
Abstract
This article presents a proposal for a new method to evaluate tool wear incremental sheet forming process. Incremental sheet forming is an innovative forming process with a high interest in fields of the industry due to its low preparation cost and high flexibility, allowing the production of small batches at a reduced cost. Among the various types of incremental sheet forming processes, the single point incremental sheet forming is the most cost-effective, and unfortunately, the single point incremental sheet forming process has high dimensional errors. In order to understand the process and its dimensional errors better, this article shows the study of tool wear and the quality of surface finish with the generated data can correlate with the tool life. The study is carried out by means of a sequence of experimental tests of galvanized steel sheet conformation by altering the stamping parameters (vertical step in, feed and rotation) and capturing the values of the surface roughness of the parts, the forming tool wear and processing time. After the completion of the tests, the classical formulation of the Taylor equation was utilized to obtain a mathematical model capable of estimating the lifetime of the single point incremental sheet forming tool associated with a tool wear value and the desired dimensional accuracy in relation to the processing parameters for the part or tool pair analyzed in a computer numerical control machine tool. The results of the study present an original model of prediction of tool wear in relation to the input parameters for the single point incremental sheet forming process; the overall error rate is 33.44% for the wear model of prediction and 35.94% for the lifetime model of prediction.
Keywords
Introduction
The incremental sheet forming (ISF) is a process of innovative conformation capable of producing complex geometry sheet using computer numerical control (CNC). The low cost of machine preparation is the main advantage, the use of CNC-machining three axes, and great flexibility, as new products are obtained by changing only its model by computer-aided design (CAD), allowing the production of small batches. 1
One of the major obstacles of industrial application of the ISF is related to dimensional error between the model and the real part due to the effects related to the elastic deformations that occur during the process. To compensate for these effects, some resources can be used, and methods such as heating, multi-pass technique, tool path optimization among others are also used. Most of these methods increase the time of conformation and the most appropriate use of each process can vary greatly according to the geometric complexity of the product, requiring correction and adjustment. In ISF systems using lower tool (with cavity or protrusion), taking into account the elastic deformations which occur during the stamping (springback), this format is already fixed. However, the use of tools-support burdens the process, which is opposed to one of the main promises of the ISF, which is the low cost of tooling. 2
The technology of ISF still carries some drawbacks. The investigation of single point incremental sheet forming (SPIF) in terms of quality production and process optimization has always been a challenge to researchers. 3
There are several parameters that have been reported to affect the process formability, namely tool radius (r), step size (Ap), feed rate (f), rotational speed
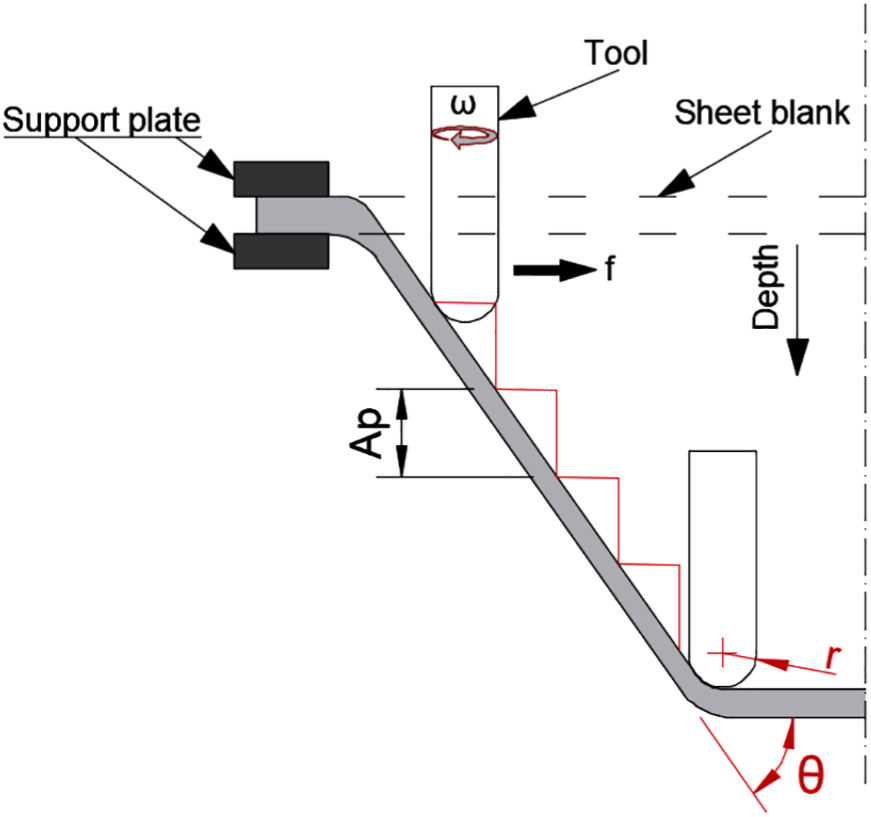
The contact friction tool-sheet has a direct relationship with unwanted deformations of the corners of the piece formed due to “meridional stress.” 7 The friction between the tool and the sheet to be formed can be minimized with a tool that turns free, tool without rotation, which will reduce the friction of the tool and sheet contact, thus minimizing damage to the tool and the final piece. 8
In SPIF, a simple tool is used to make the conformation of the piece. To obtain parts with better surface and dimensional quality, it is necessary to pay special attention to the tool used and its natural wear, avoiding excessive wear, which occurs in most of the times when the friction between the tool and the sheet is excessive.
Friction develops during contact between the tool and the sheet by means of the ISF process. The most important point is to know how it will influence the process to define the parameters and try to control their negative effects. The control of friction is done using a good lubricant, and to obtain an excellent surface finish of the tool and the sheet, it is necessary to polish the tool tip and the plate must not contain surface imperfections, scratches or dimples. A high friction can result in the incidence of premature wear of the tool or the plate. 9
Studies on tool wear response and tool life prediction in the ISF process are lacking. 10 According to Branker, 10 more studies are needed on the life of the forming tool of the ISF process, especially to allow a cost modeling with SPIF.
This article presents a proposal for a new method to evaluate tool wear ISF process. ISF is an innovative forming process with high interest in fields of industry due to its low preparation cost and high flexibility, allowing the production of small batches at a reduced cost. Among the various types of ISF processes, the SPIF is the most cost-effective, unfortunately the SPIF process has high dimensional errors.
Section “Related work” describes related work. Section “SPIF tool wear prediction model” describes the SPIF tool wear prediction model and section “ Tool wear” describes the types of tool wear. Section “Experimental parameters” presents the experimental parameters and section “Tests and tool wear analysis” presents tests and tool wear analysis. Section “Analysis of variance” shows the analysis of variance and section “Results and discussion” presents results and discussion. Sections “Validation of experimental results” and “Conclusion” present the experimental × predicted results (validation) and conclusions.
Related work
The SPIF has been studied by many authors who describe the process as having a great potential for both industry and for the academy. It can as well be applied to various types of materials obtaining satisfactory results. Jeswiet et al. 4 show the angles and the edges of the tool contact and the sheet to be formed. The study shows that only a part of the ball tool top comes in direct contact with the part that is less than half the maximum diameter of the tool.
Malhotra et al. 11 exploit the similarities between incremental forming and layered manufacturing to develop a methodology for automatic generation of three-dimensional (3D) spiral single point incremental forming toolpaths for forming symmetric and asymmetric components, considering specified constraints on desired geometric accuracy and maximum specified scallop height while reducing the forming time. To test the developed methodology, the scallop heights of components formed using the developed methodology are measured and compared with the maximum permissible scallop heights specified. Furthermore, the geometric accuracy and forming time of the components formed using the developed methodology and by the toolpaths generated using commercial CAM software are compared. It is shown that the toolpaths generated using the developed methodology form components with better or similar geometric accuracy as compared with that generated by commercial CAM packages and with scallop heights lesser than the maximum permissible scallop height specified by the user. At the same time, the developed methodology also reduces the forming time as compared with commercial CAM toolpaths.
Bhattacharya et al. 12 present an experimental study to study the effect of incremental sheet metal forming process variables on maximum formable angle and surface finish. BoxBehnken method is used to design the experiments for formability study and full factorial method is used for surface finish study. Analysis of experimental results indicates that formability in incremental forming decreases with the increase in tool diameter. Formable angle first increases and then decreases with incremental depth and it is also observed that the variation in the formable angle is not significant in the range of incremental depths considered to produce good surface finishes during the present study. A simple analysis model is used to estimate the stress values during incremental sheet metal forming assuming that the deformation occurs predominantly under plane strain condition.
Asghar et al. 13 present a methodology to minimize the dimensional deviation in the wall and base regions of single point incremental forming of formed components. The authors observed that the sheet deflection due to axial force and tool deflection due to radial force are the two main factors leading to the geometric deviation in wall and base regions. An analytical model has been developed for estimating these two deflections. These deflection values are incorporated in the tool path generation, and the components formed using the compensated tool path resulted in acceptable dimensional accuracy in the wall region. Force predictions carried out by force equilibrium method are used to calculate the deflection compensations as its predictions are in reasonably good agreement with the force predictions of finite element analysis and experimental measurements. Significant improvement in accuracy is achieved by using the deflection compensated tool paths.
Lingam et al. 14 present a methodology to enhance geometric accuracy of formed components by compensating for tool and sheet deflections due to forming forces. Forming forces necessary to predict compensations are obtained using force equilibrium method along with thickness calculation methodology developed using overlap of deformation zone that occurs during forming (instead of using sine law). A number of examples are presented to show that the proposed methodology works for a variety of geometries (axisymmetric, varying wall angle, free-forms, features above and below initial sheet plane, and multiple features).
According to Lingam et al., 15 SPIF uses only one tool to form components and requires additional setup to form complex geometries. Double-sided incremental forming (DSIF), using two tools (one on either side of the sheet), can form features from top and bottom of sheet in single setup. While forming components with multiple features, the accuracy of component depends on the tool path strategy used for each feature and sequence in which features are formed. Methodologies are developed to recognize features from free-form components modeled using single and/or multiple surfaces. Recognized features are sliced using horizontal, inclined or offset strategies (developed during the present work) based on the geometrical characteristics of a given feature. Selection of best-forming sequence is automated based on the relation between features and process mechanics. Results presented in this article show that complex free-form geometries can be formed with good accuracy using proposed methodologies. Maximum deviation between the measured and ideal profiles is less than 400 µm while using right sequence and appropriate tool path strategy.
Diabb et al. 16 show that adhesive wear mechanism was predominant during SPIF process. This adhesive mechanism occurs when the particles are unconstrained and are able to slide down and roll over the sample surface.
An effective way to reduce friction and increase tool efficiency is to use a material with high abrasion resistance. For some tasks, the tool material is differentiated to avoid chemical reactions with the material of the sheet and thus increase the surface quality and reduce wear of the tool, with the help of a suitable lubricant. The absence or presence of lubrications as well as the types cause variations in temperature and the sheet tool. 17 When the forming surface was not lubricated with grease, there was surface imperfections, and the aluminum plate was irregular in shape and the entire surface was rough. 2
According to Kurra et al., 18 the step depth and tool diameter have a significant effect on surface roughness, while step depth, feed rate, wall angle, and tool diameter have predominant effect on manufacturing time. An increase in the step depth increases the surface roughness. The surface roughness value is decreased with the increase in tool diameter up to some value and again increased with the increase in the diameter. The manufacturing time decreases with the increase in step depth, feed rate, and tool diameter. The effect of high feed rates and variation in tool paths on surface roughness and manufacturing time were not evaluated.
Duflou et al. 19 show that a favorable impact on the process forces could be observed due to an increased sheet temperature in the direct vicinity of the tool contact zone. This force reduction, combined with improved springback behavior, allows to significantly reduce unwanted deformations and geometric errors, resulting in an all over improved accuracy level. Furthermore, for materials characterized by a lower strainability at room temperature, applying dynamic, local heating allows to significantly shift the formability limit. Geometrical inaccuracies in SPIF produced parts can be caused by several phenomena. Elastic springback is most often mentioned in the literature, but it is surely not the only cause for dimensional errors. Plastic, unwanted deformation in areas bordering the processing zone, as a result of excessive stress levels, form another major source of inaccuracy.
Jeswiet and Young 20 perform experiments with range of speeds up to 2400 mm/min and show that speed does not appear to have an effect upon the process for the speeds tested. However, speed has been found to have an effect upon the wear of the tool, which is due to the increased friction at high relative velocities between the tool and sheet. With high relative velocities, increased heating occurs. The most obvious source of heating due to spindle speed is friction. As the tool travels over the surface of the workpiece, it spins at a certain number of revolutions per minute (RPM). If the tool is stopped, it will slide along the surface of the material, plowing material ahead of the tool. In all cases, heating will occur owing to sliding friction. If the tool is rotated at a high speed, the tool surface will slide over the workpiece much more often and there will be excessive heating due to sliding friction. In experimental work, it has been found that the relative motion of the surface of the tool to the surface of the workpiece is directly proportional to the heat generated by sliding friction. However, it does not evaluate the effect of speed on tool wear.
To improve surface quality and tool friction with the part, working with the natural tool rotation (NTR). In case of unnatural tool rotation (UTR), it is observed that it slides along the surface of the workpiece or crushes the base material. As Figure 2(b) shows, after a small number of revolutions, the temperature can reach a very high value and place the bonding of the workpiece material on the forming tool., while in the case of NTR no sticking of base material occurs and an excellent surface quality can be obtained, as shown in Figure 2(a).
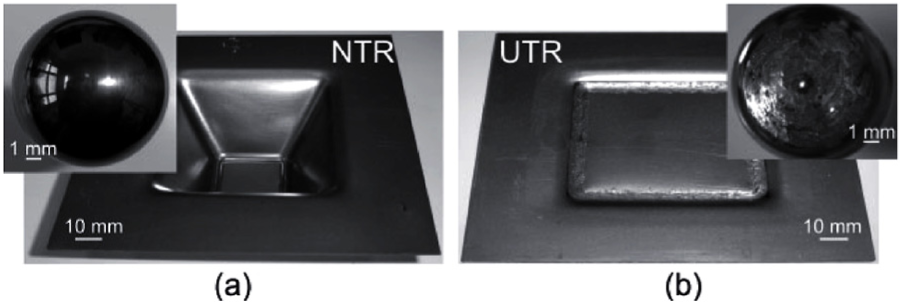
The uncoated cemented carbide forming tools and workpieces after SPIF: (a) natural tool rotation (NTR) and (b) unnatural tool rotation (UTR). 21
Kumar et al. 22 focus on the investigation of process parameters like tool diameter, step size, and spindle speed on the average surface roughness of formed components on AA2024-O sheets. Results obtained from experimental work conclude that when tool diameter was increased from 7.52 to 15.66 mm, roughness (Ra) decreased approximately 25.78%, 26.27%, 24.75% and 21.17% for 0, 500, 1000 and 1500 r/min spindle speeds, respectively. Similarly, roughness (Ra) was found to decrease by 33.59%, 31.81% and 29.47% for 7.52, 11.60 and 15.66 mm tool diameter, respectively, when spindle speed was increased from 0 to 1500 r/min. Larger tool diameter (15.66 mm in this case) with a higher spindle speed (1500 r/min in this case) produced the best surface quality of the components in terms of average roughness.
Durante et al. 23 studied impact of spindle speed on AA7075-T0 sheets to measure average surface. Roughness of surface was found to decrease when spindle speed passed from not rotating to rotating conditions. Direction of tool rotation was not found to affect surface roughness.
According to Hamilton and Jeswiet,
24
the effects of forming at high feed rates and tool rotational speeds were studied and analyzed in SPIF, using the speed factor (defined as spindle speed/feed rate,
Radu et al. 25 investigated the surface quality of parts processed by single point incremental forming as a function of four process parameters: tool diameter, size of the vertical step of tool, feed rate and spindle speed. Two quality characteristics were taken into account: the surface roughness (Ra) and the microstructural modification of material as a result of forming. The obtained results revealed that both characteristics were improved when high value of the process parameters was used, except the size of the vertical step of tool that led to an increase in roughness and a coarse microstructure of material.
Radu and Cristea 26 show the influence of the working parameters on the quality of parts, which can be summarized as follows: high values of tool diameter have positive effects on surface roughness and microstructure of parts but negative effects on the parts accuracy; the tool vertical step has positive effects on the three analyzed characteristics of quality as long as it has small values; high values of the feed rate lead to a finer surface and to a refined microstructure of parts but, in general, to a low-dimensional accuracy; high values of the spindle speed have a positive influence on the accuracy, surface roughness, and microstructure of parts.
According to Emmens et al., 5 increased spindle rotational speed is used sometimes to increase formability. The formability increase is due to both a local heating of the sheet and, what is more, a positive reduction of friction effects at the tool–sheet interface. Spindle 5 RPM has an effect upon maximum profile height and an equation, which relates maximum profile height created by incremental forming to pitch size (Ap), can be developed. 27 It has also been observed that surface roughness is higher in the case of non-rotating tools. 5 By decreasing the relative motion between tool and workpiece, the surface roughness can be reduced. This will also reduce the incidence of spalling due to repeated stress over the same surface.
Taherkhani et al. 28 propose a mathematical model for estimating geometrical error, surface roughness, and the time required for forming as functions of process parameters using the group method of data handing (GMDH) method. The input parameters are step depth, feed rate, tool diameter, and sheet thickness. The effect of speed has not been studied in this article. Then, genetic algorithm (GA) is used for both single and multi-objective optimization of the objective functions. A tradeoff point is then selected from the Pareto front such that maximum dimensional accuracy and surface quality are obtained at the shortest time. The data required for empirical models are prepared in a series of experiments via central composite design (CCD).
The significant tool tip wear could also contribute to the creation of scratch on the sheet surface, along the periphery while maintaining the gradual helix along the vertical direction (depth direction). 29
The high speed of the tool during the forming process generates high friction which consequently provides heating exactly in the area of conformation, like an instant warmth. This heating reduces the mechanical strength of the sheet, thereby facilitating the conformation and improving the surface quality of the finished part. 30
According to Suriyaprakan 31 the most important qualities of forming tool are having good hardness and good wear resistance in order to give good surface finish and accurate final part. Therefore, forming tool in this project must have good treatment to enhance those required quality.
The tool friction effects at the sheet may damage the surface of the final piece and further reduce the formability of the process. To reduce these effects in the SPIF process, 32 a cylindrical oblique tool with bearing was developed, which showed an improvement in part quality, especially in surface quality. The features of the tool also influence the forming process as the tool size influences the surface finishing and also the formability of the piece. The relationship between the size of the tool and the sheet thickness to be formed affects the formability of the sheet. 33
Adams and Jeswiet 34 present a new model of contact geometry, wherein contact geometry is derived from the intersection of the tool with the regions that have already been formed. Because this method allows for contact geometry to be determined based on measurable surrounding features, experimental measurements of contact geometry are performed to quantify the contributions of tool diameter, step size, and wall angle on contact area.
The principal mechanism of wear in the SPIF is delamination mechanism, which is caused by plastic deformation, as well as the adhesion of particles on the tool tip that induce a surface sample defragmentation. 16
According to Gupta and Jeswiet, 35 an increase in maximum temperature is observed when there is decrease in the tool feed rate. A similar trend of drop in temperature followed by an increase later was observed for temperature recordings for tool feed rates. The measured temperature range also decreases with the increase in feed rate. An increase in the feed rate decreased the time taken to form the shape. However, a reduction in the highest recorded temperature was observed as the tool feed rate (f) was increased from 3000 to 7500 mm/min. The experiments were performed with f = 3000 mm/min, 4000 mm/min, 5000 mm/min and 7500 mm/min, and tool rotation speed of ω = 1000 and 2000 r/min.
Gupta and Jeswiet 35 show that an increase in maximum temperature is observed for decrease in tool feed rate. A similar trend of drop in temperature followed by an increase later was observed for temperature recordings for tool feed rates. The measured temperature range also decreases with the increase in the feed rate. An increase in the feed rate decreased the time taken to form the shape. However, a reduction in the highest recorded temperature was observed as the tool feed rate was increased from 3000 to 7500 mm/min.
Gupta and Jeswiet 35 observed that the tool rotation speed and continuous relative motion of tool over the surface increase the temperature at the sheet tool interface. The temperature increases with each pass and a trend of steady state is observed. An increase in the tool rotation speed beyond 2000 r/min caused sheet damage due to wear and material adhesion, further increasing the interface friction.
Babu and Kumar 36 show in experimental studies on incremental forming of stainless steel AISI 304 sheets that the highest formability was observed at 1000 r/min tool rotational speed at step depths of 0.3 and 0.35 mm. However, at 0.4-mm step depth, the tool rotational speed of 1500 r/min was optimum with the formability at 1000 r/min. At higher tool rotational speeds, formability of the sheet decreased owing to the increasing friction between the tool and sheet, and the corresponding rise in roughness, wear of specimen and heat generated. Therefore, at the low tool rotational speeds, the dynamic frictional resistance to the form is low and gives a better formability. The presence of friction to a certain level increases the formability by spreading the strain over a larger area in the sheet and also by lowering the stresses. In contrast, the absence of friction increases the amount of strain in the nose of the cone, thus limiting the depth before failure. However, increases in frictional forces of more than a certain level requires a higher amount of energy to form the part, thus decreasing the formability of the workpiece.
Sy and Nam 37 investigate the use of an electrically assisted manufacturing method in the incremental forming of magnesium and aluminum alloy sheets process to improve formability, surface quality, and geometric accuracy. The approach produces a homogeneous heating zone in the whole metal sheet with very short ramping time. Speeds of 250 and 50 r/min; temperatures of 25 °C, 200 °C and 300 °C; 2000 and 6000 mm/s of feed; and depth step of 0.1, 0.5, and 1 mm are used. The best roughness is obtained for speed of 250 r/min in the experiments evaluated with the same input parameters.
According to Hussain, 38 tool diameter, step depth, wall angle, spindle speed, feed rate and lubricant type have effect on surface roughness. Dimensional accuracy is affected by sheet thickness, tool diameter, wall angle, final part depth and step depth. Tool diameter, step depth, sheet thickness and feed rate were considered as input variables. Furthermore, dimensional error, forming time and surface roughness (Ra) were chosen as output variables. Experiments show that increased surface roughness caused by increased tool feed rate is associated with tool run-out.
According to Hegan and Jeswiet, 27 spindle speed tests showed little effect on roughness, but there was a minimum reached at approximately 1500 r/min, beyond that, the values of surface roughness were found to be increasing again at 2500 r/min. This may be as a result of the tolerance to which the tool was machined combined with vibration of the mill head.
SPIF tool wear prediction model
The SPIF process has many correlation variables to wear: step size, feed rate, rotation speed, lubricant, tool material, material of the sheet to be formed, tool roughness, sheet roughness, and piece geometry. In order to correlate them and understand what happens to the process when it varies with either variable, we used the statistical methods Taguchi with application in DOE++ which is an efficient software to analyze the correlations between the variables of the printing process incremental and also can reduce the number of experiments. This method may be used for the analysis of correlations between the process parameters 39 in relation to for tool wear. 40
An analysis of the tool wear study in turning process was done by correlating the process variables with the expanded formula of Taylor, obtaining a mathematical equation to describe the tool wear (VB) of the process in relation to its variables. Similarly, 41 by applying the Taylor expanded formula, we arrived at algebraic model shown in equation (1), wherein varying the machining parameters and substituting its values in equation evaluated tool wear through time

The process of independent variables are forming time (min), ω is the rotational speed (r/min), f is the feed rate (mm/min), Ap is the depth in each sheet forming layer (mm), and VB is the flank wear. Algebraic parameters E, F, G, and H are exponents of processing algebraic model variables, and C is a multiplier. However, equation (1) shows each of the unknowns and equating to zero, it shows five equations with five unknowns (C, E, F, G, and H). The solution to these heterogeneous equations was obtained by replacing the

Based on developing mathematical models, there are always the existence of uncontrolled variables that are of no use. Representing by

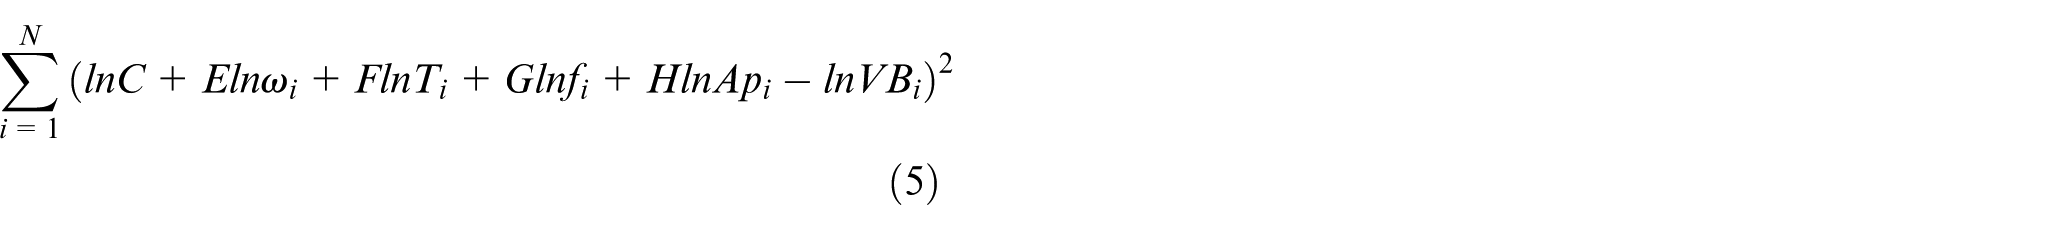
Supposing all the possible residues, due to the influence of all variables, we have the sum of the quadratic residue given by equation (5)

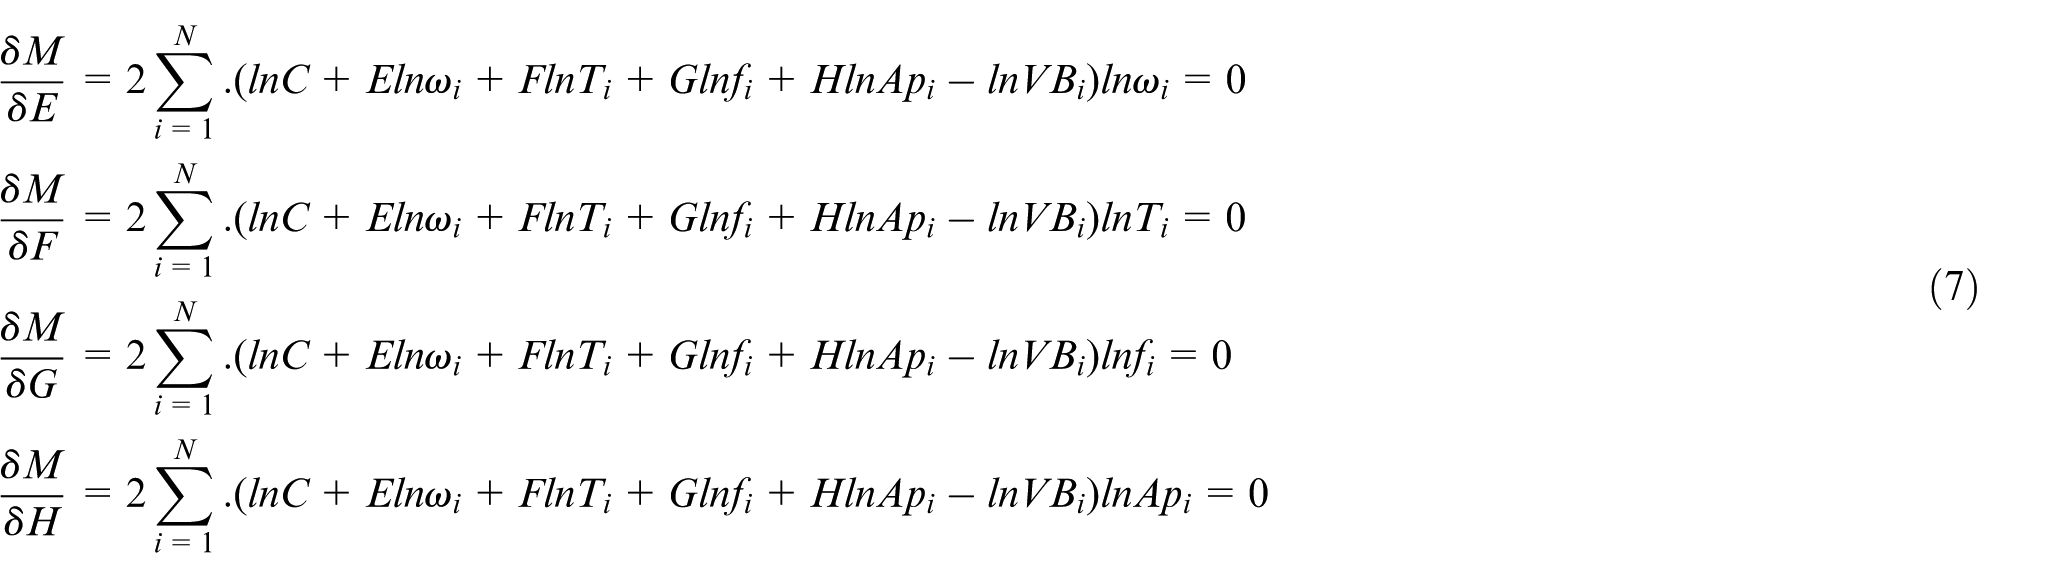
Considering M as a function of the unknowns C, E, F, G, and H, the condition that the sum of squared residuals, M is minimal is the partial derivative of M with respect to each of the unknowns is zero. Thus, we obtain equation (6)

Developing the partial derivatives has the following set of equations (7)
whereas in ΣlnC = NlnC = NI, 41 equations (7) and (8a) are replaced by the new configuration (equations (8b)–(8e))


Tool wear values
Having intended that many articles reported the existence of tool wear, this article seeks an algebraic formulation of Taylor expanded by means of a mathematical formulation to estimate the lifetime of a tool by incremental forming SPIF. For this, a forming test sequence for obtaining the experimental data will be achieved. Typically, VB is selected from the range 0.15–1.00 mm depending on the type of machining operation, the condition of the machine tool and the quality requirements of the operation. 42 Table 1 shows the industrial practical recommendations for tool wear limit.
Recommendations for tool wear limit (VB). 42
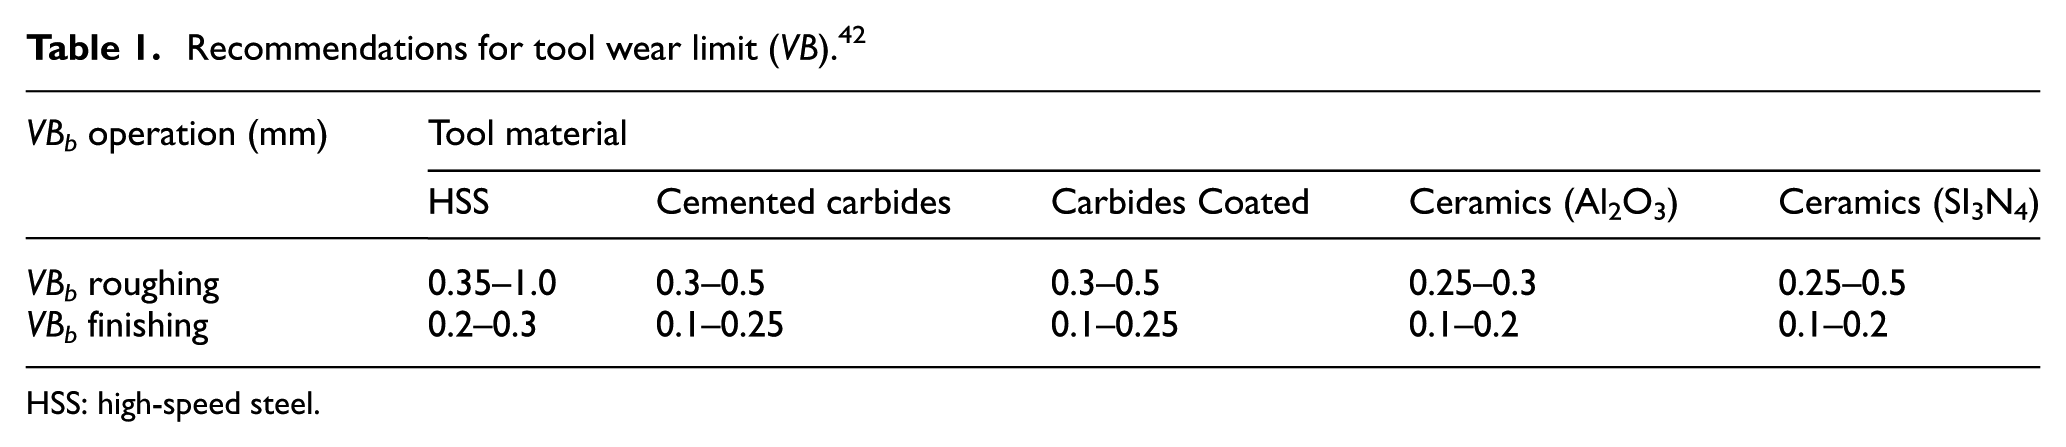
HSS: high-speed steel.
The SPIF consists of a forming process in which a simple tool is used, the path of the tool being described by a CAD programming of a CNC machine. To obtain parts with better surface and dimensional quality, it is necessary to monitor the natural wear suffered by the tool, avoiding excessive wear, which in most cases is caused by high friction between the tool and the sheet.
There are several studies on tool and its reactions in the conformation process: influence of the diameter in the process; 43 the formability decreases by increasing the tool diameter; 44 making groove engraving on the face of the tool; 45 choice of lubricant to reduce tool wear; 46 analysis of the speed of rotation of the tool to improve the workpiece finish;22,24–26,30,47 the use of high rotations for the generation of heat;21,30,47 and the influence of the quality of the tool finish and the hardness in the final quality of the workpiece. 31
The study of this article was motivated by the relevance of tool wear analysis and tool life prediction in the SPIF process to aim at a better understanding of the process. This article is a study about the wear of the tool and the surface finish of the final part associating these parameters with a tool life, creating a model of the tool life, optimizing the process donations, and using the optimization criteria for the reduction of processing time with a lower cost and constant tool life.
The wear of the tool is directly influenced by the friction that occurs between the tool and the sheet to be formed. Too much friction in the process can cause premature tool degradation. 21 There is the existence of temperature peak between the metal sheet surfaces. The magnitude of these temperatures depends greatly on the relative velocity between the surfaces and the materials involved, but can easily reach a few hundred degrees celsius, which can generate an oxidation wear mechanism 48 that is less common in SPIF.
SPIF has adhesion and abrasive main wear mechanisms. 49 Adhesive wear is the most common and is described as the wear of a plastically deformed surface by contact with another surface. This contact between the surfaces can be described with the following steps: smoothing of the surface of the material of lesser hardness, accumulation of deformation below the surface, formation of sub-surface cracks, and the formation of a particle of wear in the form of a blade. However, abrasive wear is less common, and it may be present due to the action of oxidized particles of greater hardness than the tool, which results in an abrasive action on the tool. 10
In general, the tool wear depends on the material thickness, tool material, part material, lubrication, punch velocity and punch-die clearance, 50 forces are also more homogeneous with spiral tool path without any local peaks and valleys. 29
When sliding friction occurs at the tool–sheet interface, the material is scraped from the sheet and then adhered to the tool surfaces. The scratches would continuously affect the front surfaces and cause successive wear, which leads to some deep gaps. 32
Tool wear
Every tool, whether cutting or stamping, has a lifetime that is usually closely linked to the productivity or quality of the final part.
The process of incremental forming occurs by the continuous contact of the forming tool with the sheet to be formed, thus generating a wear on the tool, primarily by the adhesion wear mechanism in the tool and sheet contact areas to be formed. In the incremental forming tools, two types of wear are typically found: top wear (Dt) and angled top wear (Dta). Figure 3 exemplifies the types of wear being: (a) shows black top wear, (b) shows the angled top wear, (c) shows the union of the two types of wear, total top wear (Dtt), which also represents the actual wear of the tool.
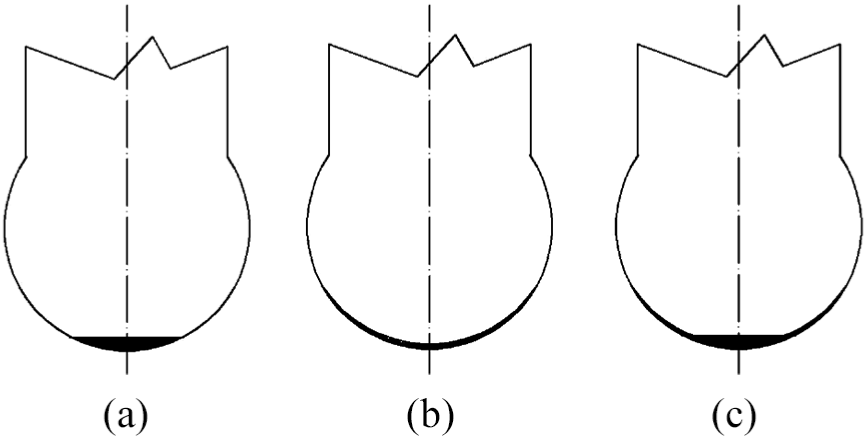
Types of incremental forming tool wear: (a) black top wear: (b) angled top wear and (c) union of the two types of wear.
There is tendency of the top wear (Dt) to occur mainly at the beginning of the forming process. This occurs when the top of the tool maintains contact with the sheet in the execution of the conformation. To the extent of the part gaining shape, this sheet–tool contact increases, thus creating the second wear (Dta), to be related to the wall angle of the part. The larger the angle, the greater the wear area of the tool.
To understand the effects of tool wear on the tool itself, correlating to the conformation process, a study of the effect of the top wear was carried out.
Figure 4(a) presents a tool of 12.53 mm in diameter that suffered wear of 0.05 mm. In the dark part in the detail presented is a small top wear, 0.05 mm, suffered by the tool. This small top wear causes the top of the tool to have its area of contact with the piece increased from a point contact to a contact of an edge of, in this case, 1.58 mm. The increased contact area causes increased friction between the tool and the sheet and generates a progressive increase in tool wear, reducing the quality of the final workpiece finish and limiting the detailing of the part to be formed.
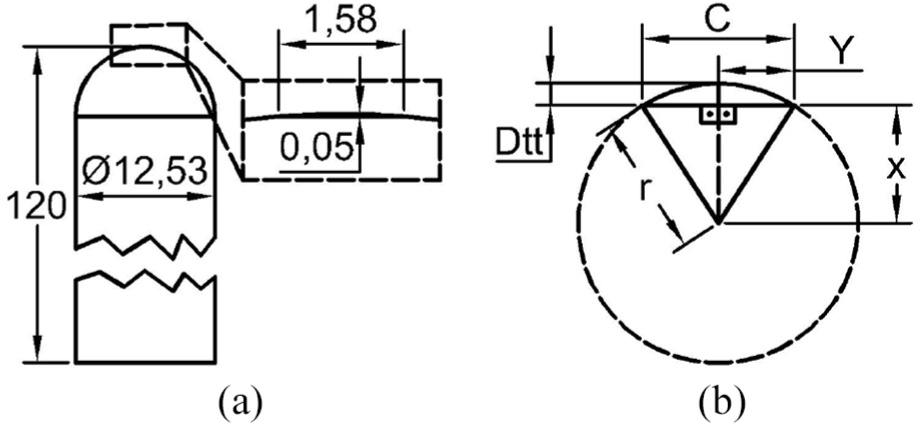
(a) Total top wear and (b) application of Pythagoras in total top wear.
To find the size of the planned C-edge, the Pythagorean formula was used. Replacing the values of X and Y of the Pythagorean forum by the values of Figure 4(b) as a function of the value of the top wear measured in the tool (Dtt), we obtain equation (9)

By performing the mathematical operations necessary to put the C in evidence, we have the value of the tool-piece contact edge, as shown in equation (10)

Correlation of wear with process variables
For the correlation of the input variables in relation to the output parameters of the SPIF process, the adjusted Taylor formula was used for the SPIF process. Correlations between the input and output parameters were obtained by solving the system of equations using experimental data extracted from galvanized steel sheet conformation tests.
Equation (11) presents the proposed model, where “Dtt” is the total top wear (mm), “f” is the conformation feed rate (mm/min), “T” is the tool forming time (min), “ω” is the rotation of the tool (r/min), and “Ap” is the incremental step in Z (depth in each sheet forming layer).
The values of K, P, M, L and A are parameters of the proposed algebraic model, which must assume different values for each type of workpiece material to be obtained by solving a multi-variable regression model using the statistical analysis software Statdisk Version 12.0 and SPSS version 13

Experimental parameters
The process of forming by SPIF can be divided into the following steps: description of the materials used, definition of process parameters, CAD/CAM programming, sheet fixing and carrying out the tests.
The programming CAD/CAM comes to the definition of the path to be followed by the sheet forming tool, which is made by a model in CAD and is inserted into the CAD/CAM software CNC machine. For movement of the tool, ESPRIT CAM software with a finishing strategy is used, increasing Z-shaped helix with minimum angle of 1° (see Figure 5), the path of the helical tool, which minimizes the marks in workpiece and also the forming efforts.
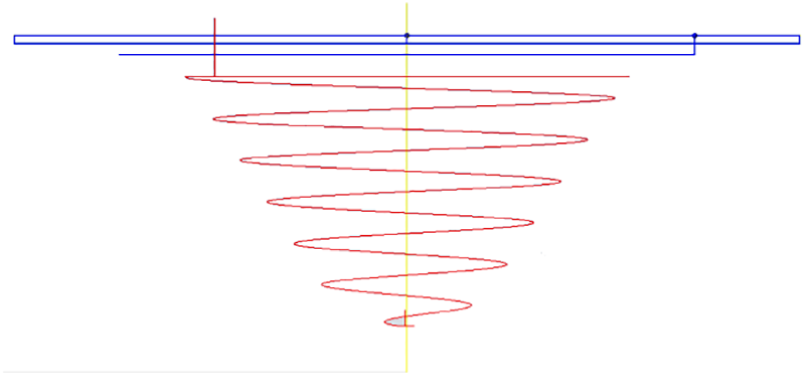
Tool path.
For fixing the sheet to be formed, 12 screws were used and M12 was tightened to force 76 N m with a Tramontina Pro torque wrench. Figure 6 shows the attachment of the device to the table of the CNC machine.
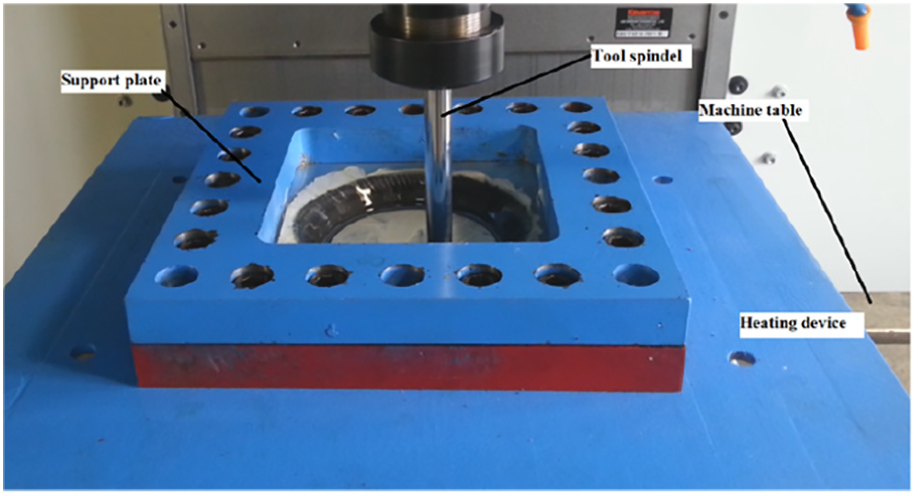
Fixing device.
The use of tools with larger diameters reduces formability. 38 In addition, tools with smaller diameters increase dimensional accuracy at wider wall angles. Most studies usually adopt a tool diameter of between 4 and 12 mm.
The materials used in the process are basically the sheet to be formed, the forming tool, the lubricating oil and the CNC machine. The plate used is a galvanized steel with an average hardness of 52 HRB, thickness of 0.95 mm and square format of 190 mm each side. The forming tool is made of SAE 1045 laminated steel with a hardness of 179 HB and tensile strength of 570 MPa, the tool has no heat treatment or polishing, the diameter of the tool tip is 12.53 mm, and this diameter was chosen because it is the size widely used in the literature.4,38 For lubrication, 5 mL of VG 68 oil was used. The machine used is CNC ROMI D600.
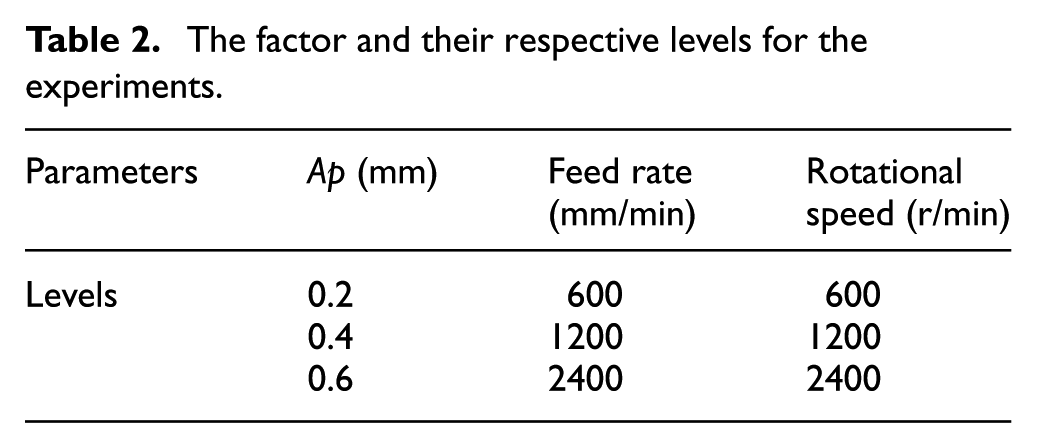
The process input parameters are vertical step (Ap), feed rate in the XY plane (f) and tool rotational speed (ω). The input parameters were varied as follows: Ap of 0.2, 0.4 and 0.6 mm; f of 600, 1200 and 2400 mm/min; and S of 600, 1200 and 2400 r/min. As there are three unknowns with a variation in three levels, the tests were carried out by opting to execute all possible combinations between these values, resulting in 27 tests (no replication), according to Table 2, with technological conditions Ap, feed rate (f) and ω, not covered in the literature.23,27,35,51
The factor and their respective levels for the experiments
To mark the end of each test, the maximum tool wear of 0.10 mm or the conformation of a batch of 10 pieces was used as a parameter, whichever occurs first. This 0.10-mm wear parameter was used because it is the lowest value in the literature for tool wear, based on a piece of simple and symmetrical geometry, as shown in Figure 7.
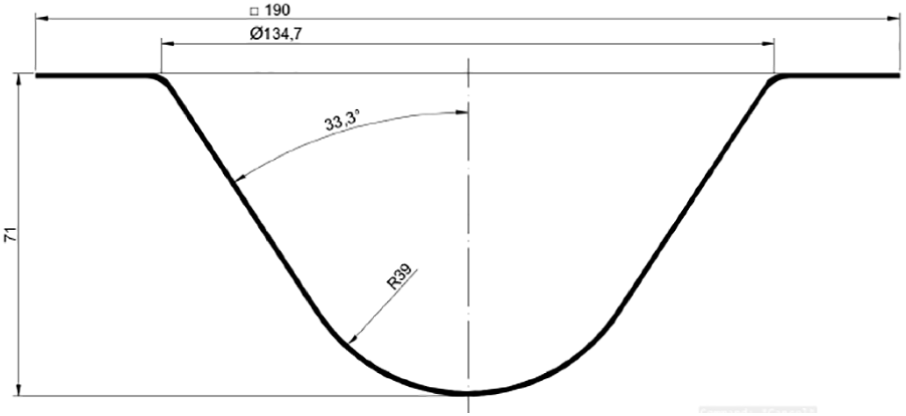
Piece feature used (units in millimeters).
Tests and tool wear analysis
For tool wear analysis, a Hexagon profile projector JT12A-B was used, and a comparison was made between the profile of the initial tool and the profile of the final tool. For the analysis of the wear, Figure 8 shows an image of the profile of the top wear of tool to test 6, which presented wear of 0.223 mm.
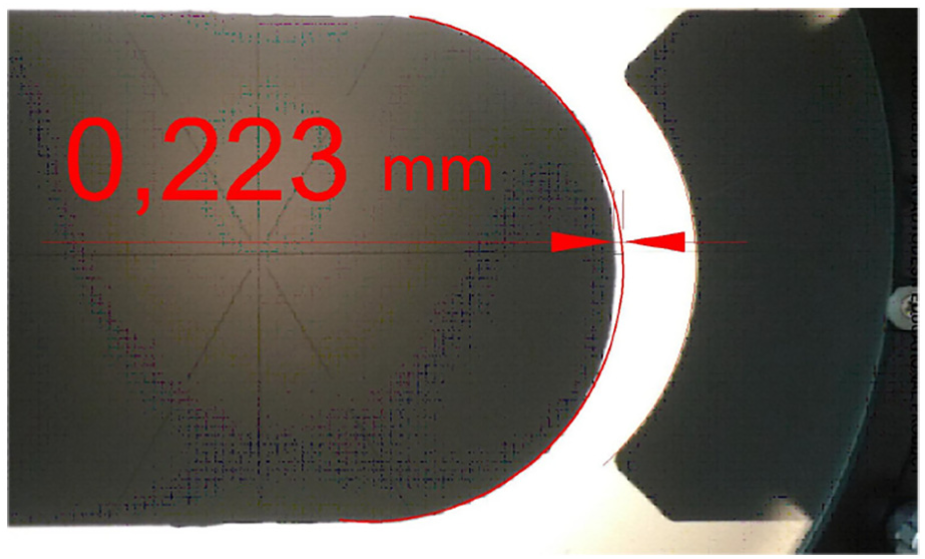
Image of profile projector showing test (6) tool wear (Table 1).
The Reliasoft software was used to carry out the analysis of variance test. There are 27 experimental runs at three levels, which are shown in Table 3, without replication.
Design of experiments factorial layout and output responses.
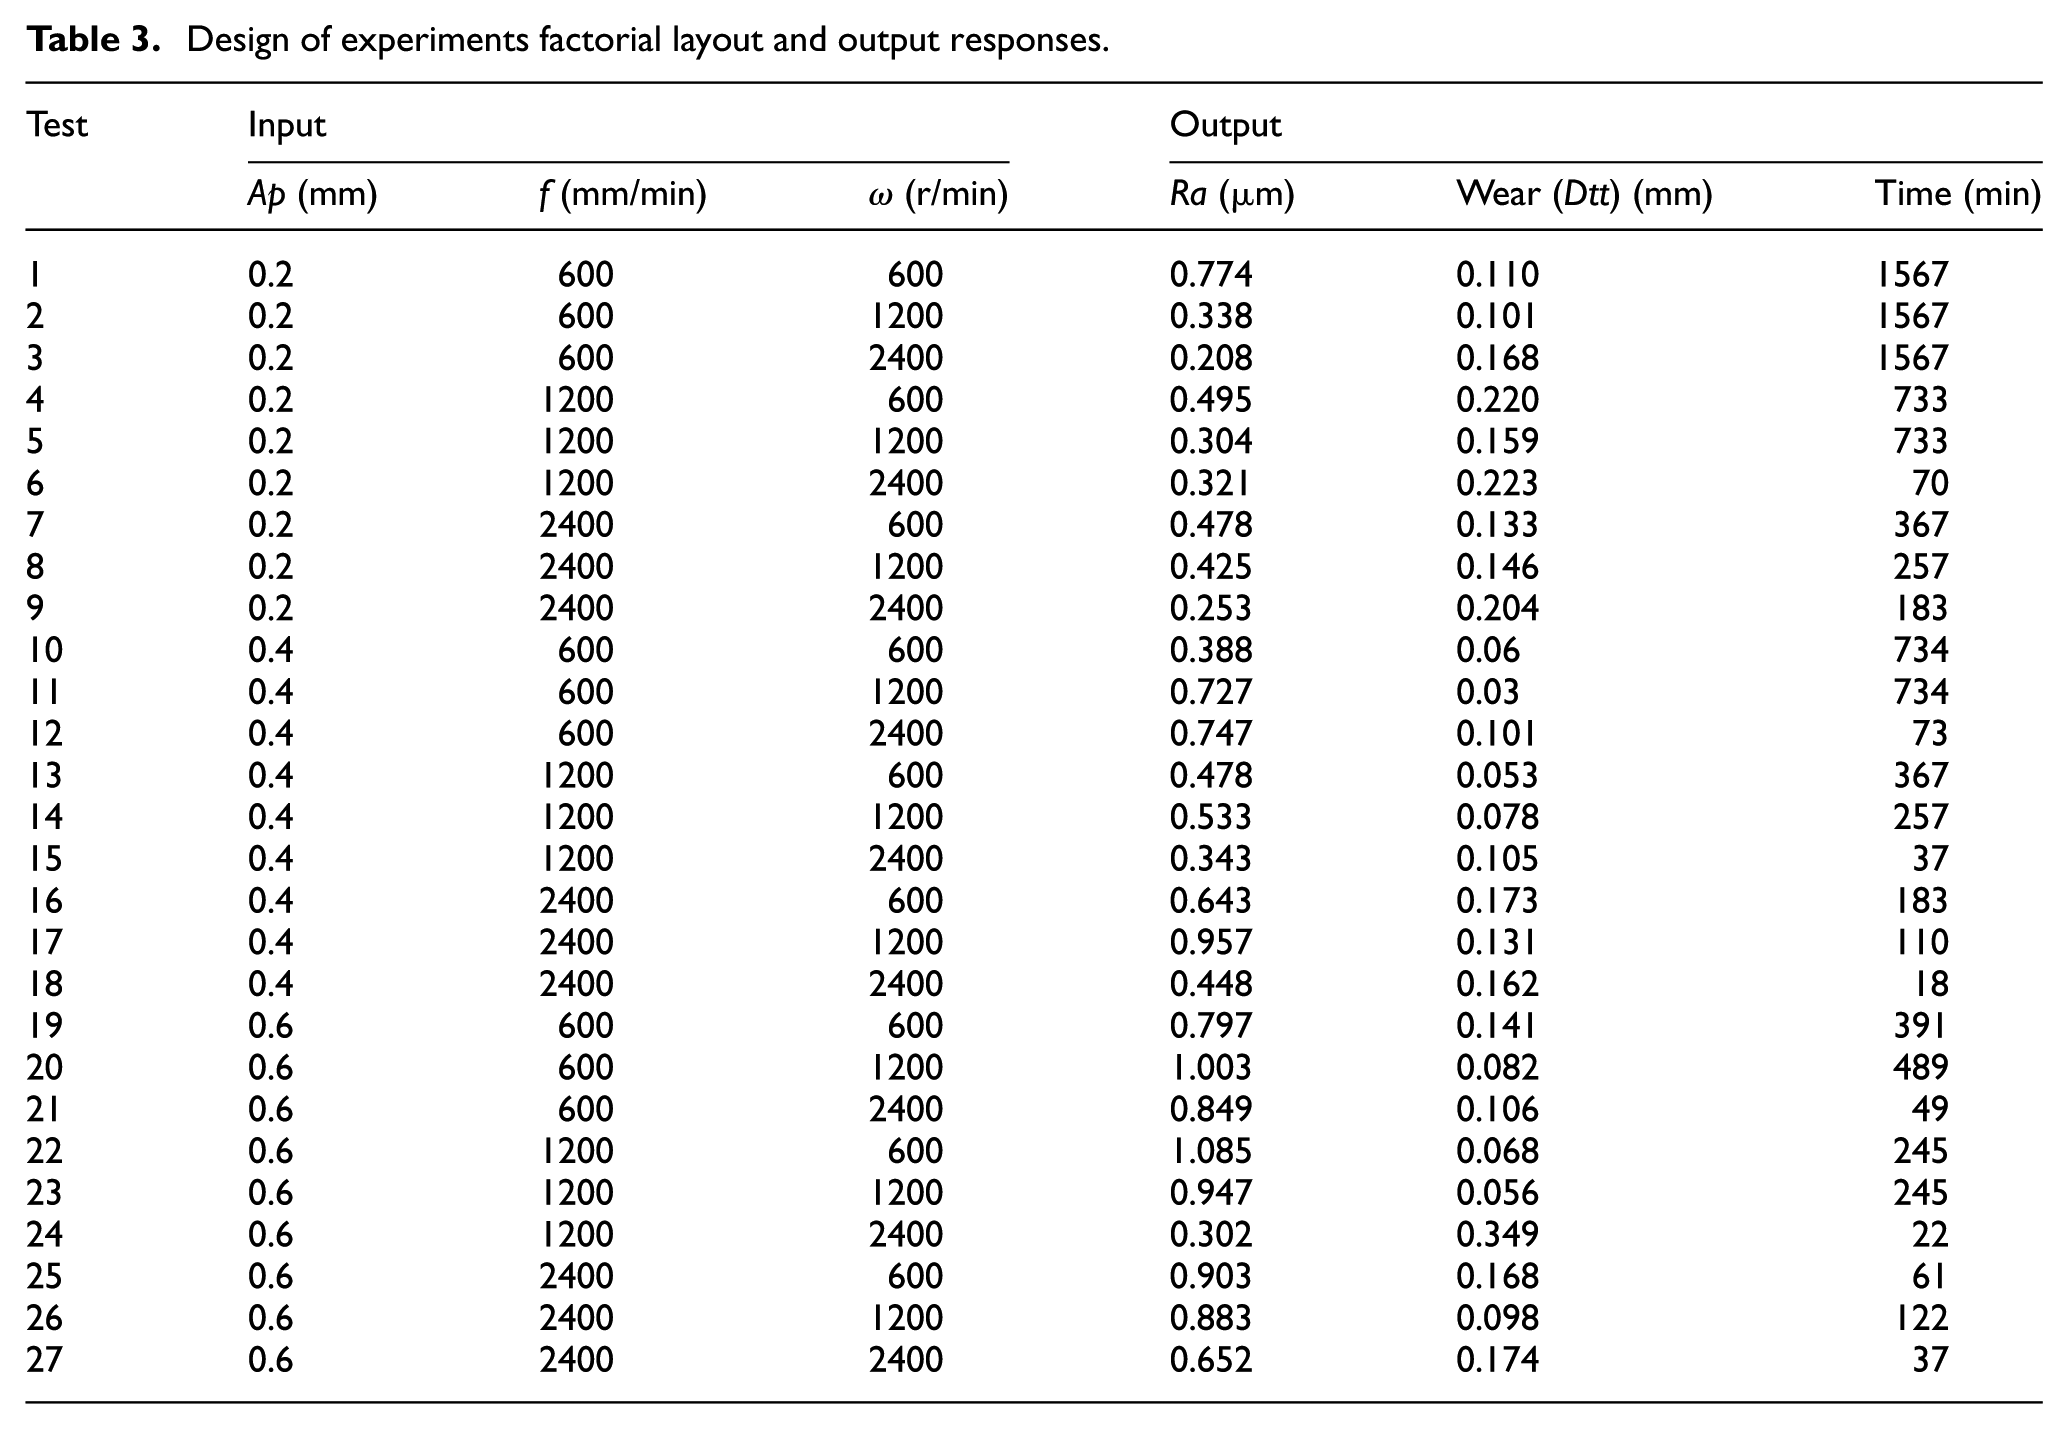
To check the roughness, an SJ-310 roughness gauge with a resolution of 0.002 µm is used. The profile of the roughness surface (Ra), the most used roughness unit in the literature is obtained by the arithmetic mean of the five measurements performed on each piece. The average roughness of each batch is shown in Table 3.
Table 3 shows the relationship of the processing parameters and the results of surface roughness of the parts, the tool wear and time of conformation. One can find and compare the results of the two equations that were generated in this work: one of wear and the other of time.
Figure 9(a) presents a piece with excellent surface finish. This piece was conformed with the following parameters: Ap = 0.2 mm, ω = 1200 r/min and f = 600 mm/min. These parameters are related to test 2 and the part presented is the second part of a sequence of 10. In particular, for this piece, an Ra roughness of 0.33 µm was obtained.
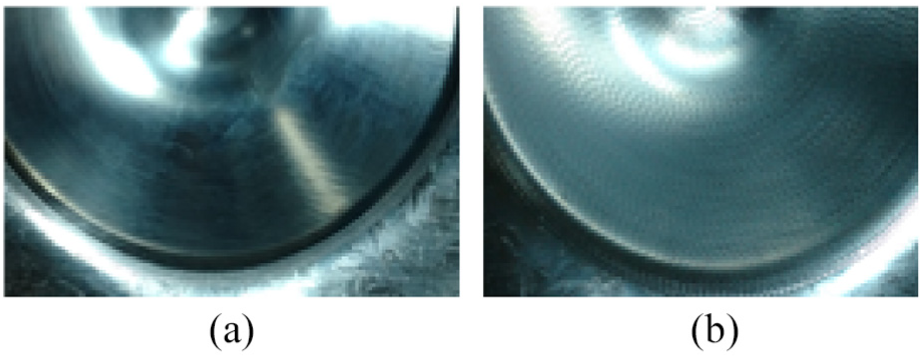
Characteristic of the part performed in (a) test 2 and (b) test 22.
Figure 9(b) shows a part with continuous marks throughout the shaped area. The marks are symmetrical and are due to the use of low rotation together with a high value of Ap. This piece was conformed with the following parameters: Ap = 0.6 mm, ω = 600 r/min and f = 1200 mm/min. These parameters are related to test 22 and the part presented is the second part of a sequence of 10. For this piece, in particular, an Ra roughness of 1.07 µm was obtained.
By observing the results of the shaped pieces, we can notice that the final finish of the pieces varies greatly with the variation of the conformation parameters.
Effects of data inputs
In order to evaluate the effects of input data with output data, Figures 10 and 11 are generated. Figure 10 analyzes the effects of Ap, feed rate and rotation in relation to tool wear, being an individual analysis of the correlation variables and the same analysis was performed to obtain the relation with the roughness as in Figure 11.
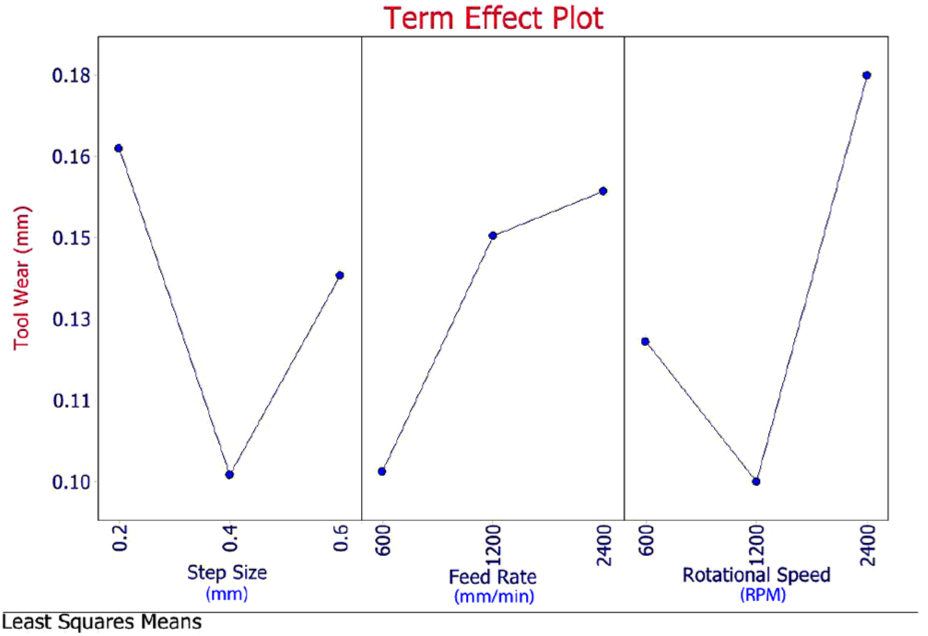
Analysis of tool wear in relation to input data—least square means × term effect plot.
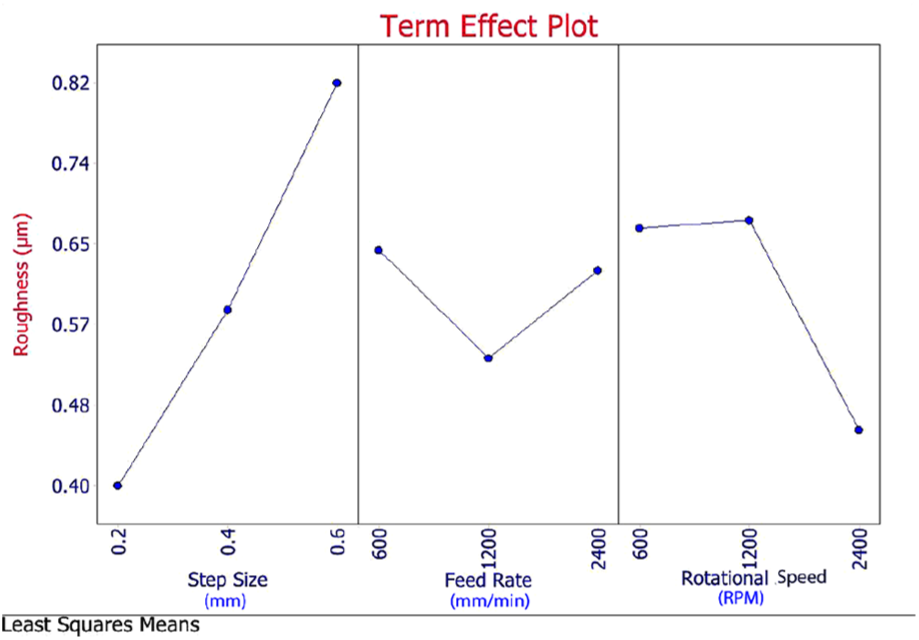
Analysis of the roughness of the final piece in relation to the input data—least square means × term effect plot.
Figure 10 shows the correlations between the variables of input, rotation, Ap and feed. In relation to input variable, thus tool wear using quadratic minimum method, it can be observed that the lower the values of the variables, the lesser the wear of the tool, and longer the time of conformation.
Observing the effects of the Ap in the tool wear, when the Ap is 0.2 mm, we obtain the highest values of wear considering that the Ap is small, the tool path ends up overlapping, and the processing time is high, leaving the tool more time in contact with the piece to be shaped.
The Ap of 0.4 mm is the one that presents the best relation in time of conformation and wear of the tool, because it reduces the time of contact piece and sheet to be conformed not yet increasing the force of formation very much on the other hand, after Ap 0.6 mm reduces the forming time dramatically and increases tool wear. It should be noted that the Ap traverses a trajectory of helix angle so the increment value is inserted gradually in the process, which is defined by the CAM software.
In relation to the feed rate, the wear of the tool increases with the increase in the parameters that were expected, because the higher the value of the forming speed, the greater the wear of the tool, and this results in the greater efforts of formation.
When we observe the wear of the tool in relation to the rotation, we have a differentiated reaction because, as far as the rotation is low, the wear is relatively high due to the drag factor of the tool in relation to the plate, already in the rotation of 1200 r/min, probably due to spot heating of the sheet to a temperature tolerable for the forming tool to the point of contributing to reduction of the formation efforts of the shaped sheet. In the rotation of 2400 r/min, it generates high friction between the tool and sheet obtaining a high temperature which for the formation can be excellent, but for the tool the very high temperature generates the degradation of the tool, leading to its premature wear.
Figure 11 shows a relationship between the feed rate and the rotation in relation to the roughness of the final piece; this analysis is performed by the least squares method, showing that producing high rotations can produce less surface roughness of the pieces, improving the finishing of shaped pieces. The most important fact to observe is the improvement of the surface quality as the value of rotation increases, and it can still be said that there is a feed that would be an optimum point for the roughness question that would be 1200 mm/min.
When we analyze each variable individually, it can be noted that if the step size value is 0.2 mm, the wear is more accentuated and the surface roughness is low, and when the Ap increases, the opposite of what was imagined, the tool wear decreases and the roughness increases. There is no well-defined pattern for tool wear or roughness of the part as observed in Figures 10 and 11, because when the feed is low, the wear is also low, and when the feed increases to a value of 1200 mm/min, the wear is high and the roughness is low, but when the feed is at 2400 mm/min, the wear of the tool is medium and the roughness as well. At rotation 600 r/min, there is a high roughness of the tool wear. This indicates an irregularity in rotation pattern, while rotation at 2400 r/min is high in tool wear but low in roughness.
In Figure 12, all input variables, Ap, rotation and feed variables are analyzed, with the tool wear output variable, to get a sense of the complete process in relation to input variables and tool wear, and a graph was analyzed for the feed rate, rotation and Ap by the method of least squares, where we can observe that the three lines present a trend for the process that has an optimal point that will be close to the values of Ap 0.4 mm, rotation of 1200 r/min and feed rate of 1200 mm/min.
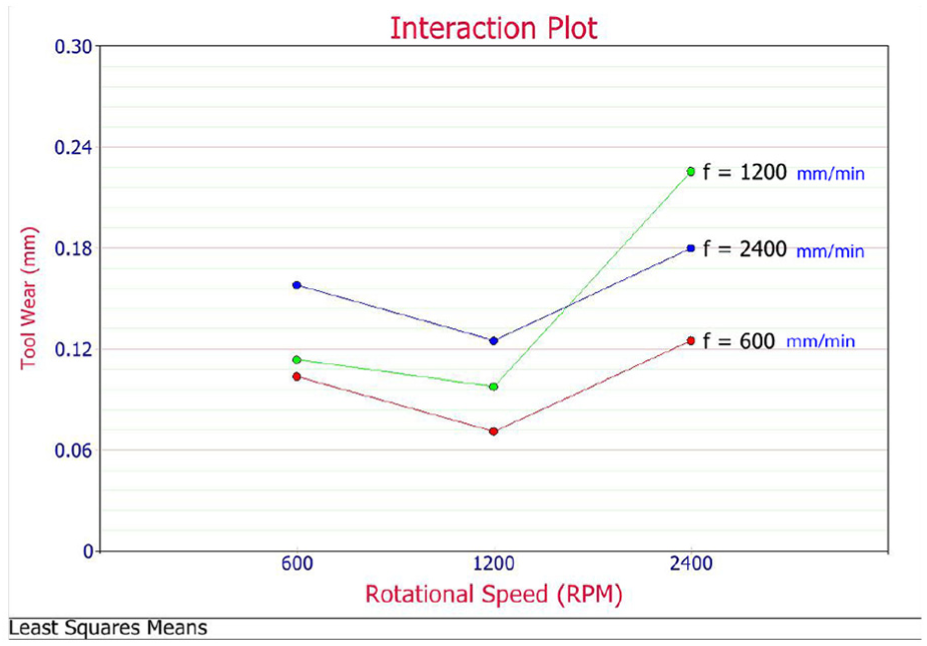
Analysis of the tool wear of the final piece in relation to the input data—least square means × interaction plot.
Figure 13 shows the behavior of roughness in relation to the input (Ap, feed and rotation parameters), analyzed using the method of least squares. It can be observed that a strong tendency of the part processing to have a good surface finish when the values of the input parameters are high, and this may be related to with bigger processing temperature, because the faster the execution of the process, the bigger the processing temperature. The heating is punctual, carried out by the friction of the tool with the sheet, the reduction of the working time of conformation is reduced in relation to the time of heat dissipation during the forming process, raising the average processing temperature.
Consider the roughness of the end piece in relation to the input data—least square means × interaction plot.
Different results were obtained by Gupta and Jeswiet 35 where it was observed that the surface roughness is not significantly affected by changes in relative tool velocity at the sheet–tool interface due to the flat tool. The experiments were performed with f = 3000, 4000, 5000 and 7500 mm/min, and tool rotation speed of ω = 1000 and 2000 r/min, with f much larger than the current research.
Pereira Bastos et al. 51 shows that surface roughness also increases with an increase in the feed rate (f = 1500, 2500, 3500 and 12.000 mm/min) and used tool not rotating (ω = 0 r/min).
Durante et al.
23
show that passing from tool not rotating to rotating (ω = 0, 200 and 600 r/min), the roughness value is reduced less than 10% and, so as for the temperature analyses, under the same speeds and for anticlockwise rotation a decrease is registered as well. Results are closer to those obtained in this research, despite working with technological conditions (Ap,
Analyzing the studies referenced,23,27,35,51 it is noted that the current research complements these previous studies because it uses intermediate technological conditions of Ap, feed rate (f) and
However, the results obtained for roughness analysis are similar to the results obtained by Kumar et al., 22 where larger tool diameter with a higher spindle speed produced the best surface quality of the components in terms of average roughness. Two other publications30,47 also obtained the same results, that is, an increase in the speed of rotation caused a decrease in the roughness.
The improvement of the surface quality can be related to two main factors: increased rotation increases the friction between the tool and the sheet to be formed, thus increasing the temperature facilitating the conformation and reducing the marks of conformation and/or the increase in the rotation causes the tool to rotate many times at the same point thus creating a type of polishing on the sheet thus improving surface finishing. These two factors can be correlated and worked together to obtain piece with good finish.
The high friction generated by the high rotation can be equated with the feed, to increase the processing temperature and to improve the quality of the surface, and one can use the increase in the rotation and the feed rate at the same time, thus we will have an increase in the temperature because the high feeders do not let the heat caused by the high speed dissipate too much.
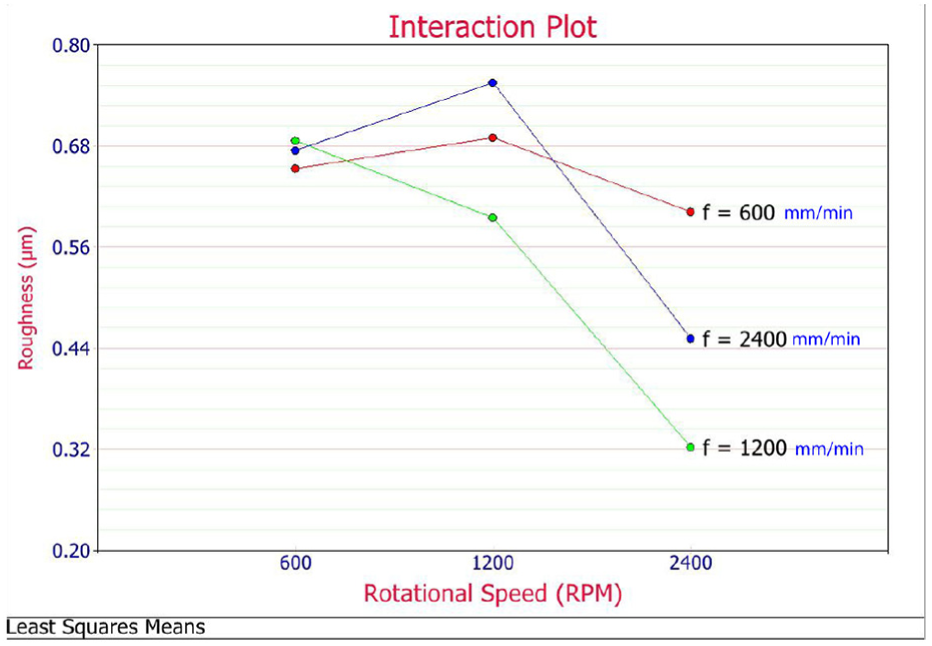
Figures 14–16 show a part of the roughness analysis correlating Ap rotation and feed, where the Ap value is 0.2 mm in Figure 14, Ap = 0.4 mm in Figure 15 and Ap = 0.6 mm in Figure 16. It can be observed that to increase the value of Ap, consequently, the value of the roughness also increases, but if the other parameters increase, a decrease in the roughness occurs, and it can also be observed that irrelevant of the value of Ap, a high rotation near the 2400 r/min achieves good surface quality. Looking now at the relation that the roughness has with the feed that for this process, the feed obtaining the best surface quality is an intermediate value that would be 1200 mm/min.
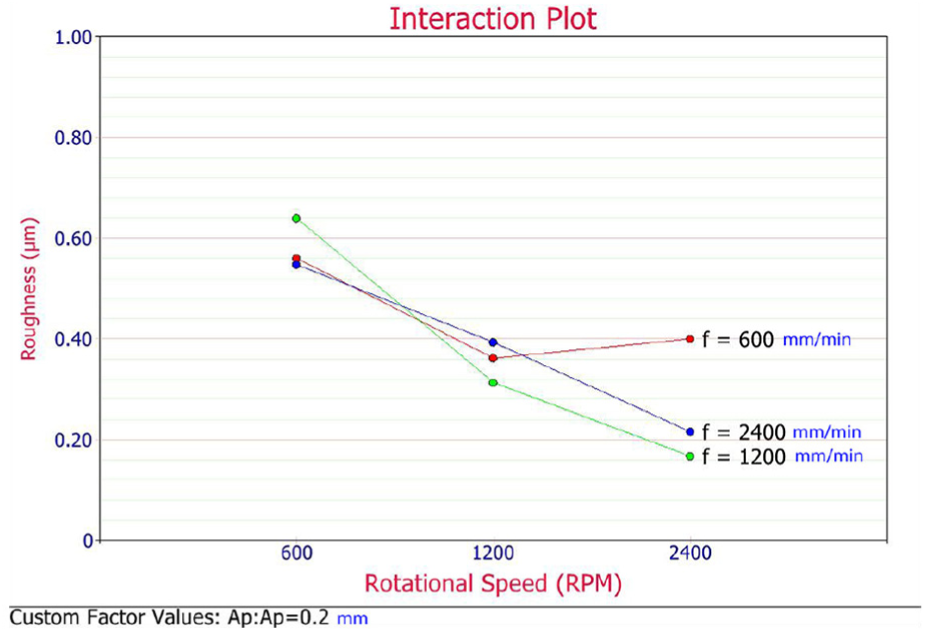
Consider the roughness of the end piece in relation to the input data, with Ap = 0.2 mm.
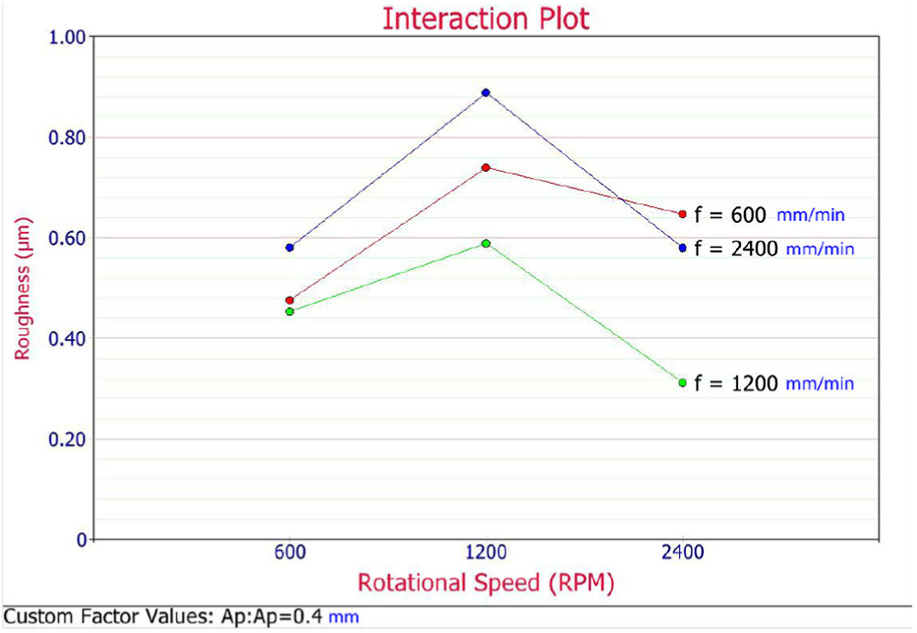
Consider the roughness of the end piece in relation to the input data, with Ap = 0.4 mm.
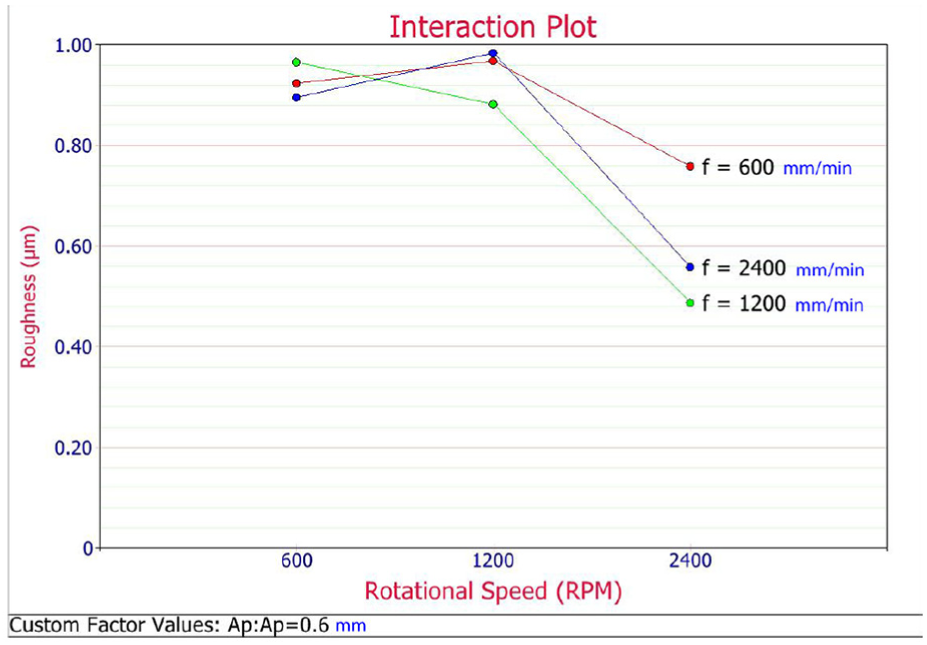
Consider the roughness of the end piece in relation to the input data, with Ap = 0.6 mm.
Figures 14–16 show different results of Hegan and Jeswiet 27 and Gupta and Jeswit 35 ; it is observed that the relationship between the tool RPM and the surface roughness of the formed component may not be linear and that the surface roughness decreases with the increase in RPM only till 1500 r/min. According to Hegan and Jeswiet, 27 this may be as a result of the tolerance to which the tool was machined combined with vibration of the mill head.
The experiments developed by Hegan and Jeswiet 27 use as input factors Ap = 0.51 mm, f = 1500 mm/min and ω = 0, 100 and 2600 r/min, only, which may explain the different results, since they were performed only 10 experiments, and a curve was fitted between the three points showing discrepancies when the two methodologies are compared.
Figures 17–19 present the analysis of the wear of the tool in relation to the parameters of rotation and feed, separated by the value of Ap that is divided by 0.2 0.4 and 0.6 mm, and it can be observed that the wear of the tool when using an Ap of 0.2 mm is much larger when compared to the Ap of 0.6 mm, which is due to the fact that when conforming with a 0.2-mm Ap, the tool gets longer in friction with the part, and, on the other hand, the 0.6-mm Ap conformation should wear plus the tool because theoretically it makes a greater conformation effort, the step in Z greater reduces the time of conformation but not necessarily increases the wear since the path of the tool is always realized in propeller, with this the Ap does not execute in a single moment but rather distributing along a complete turn in the execution of the part. It is worth noting that this is a partial analysis of the process input parameters.
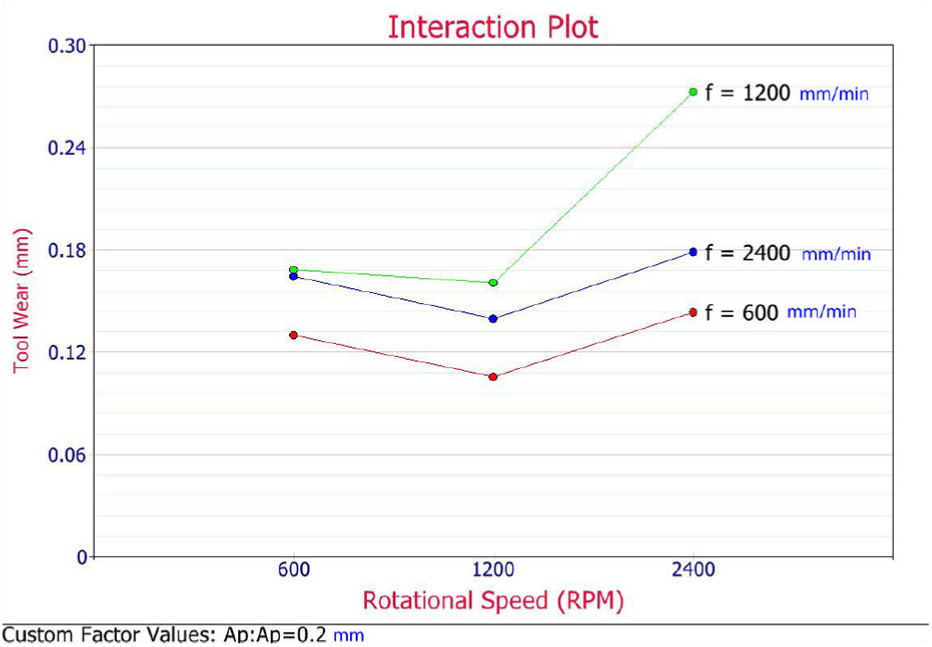
Analysis of wear of the tool in relation to Ap = 0.2 mm.
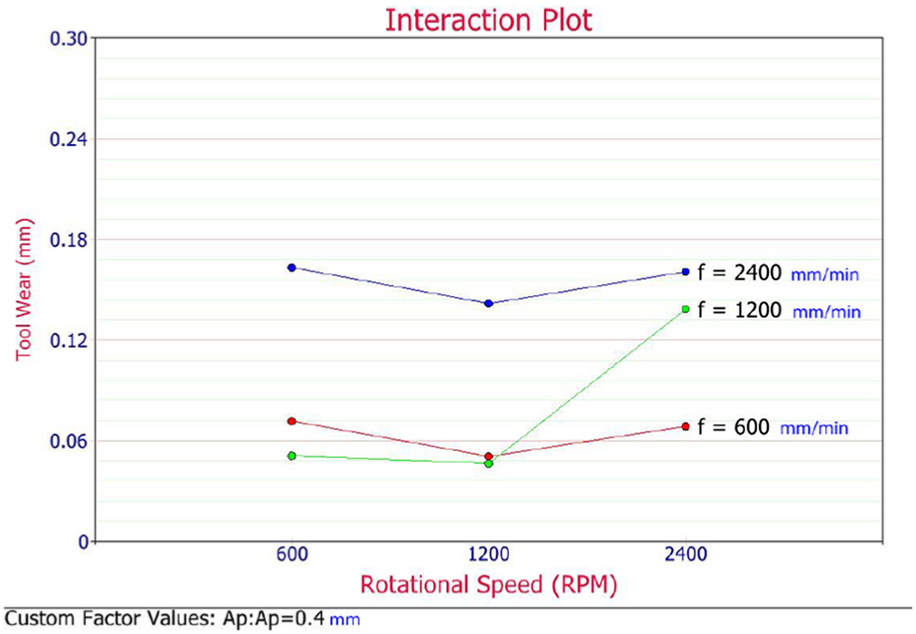
Analysis of wear of the tool in relation to Ap = 0.4 mm.
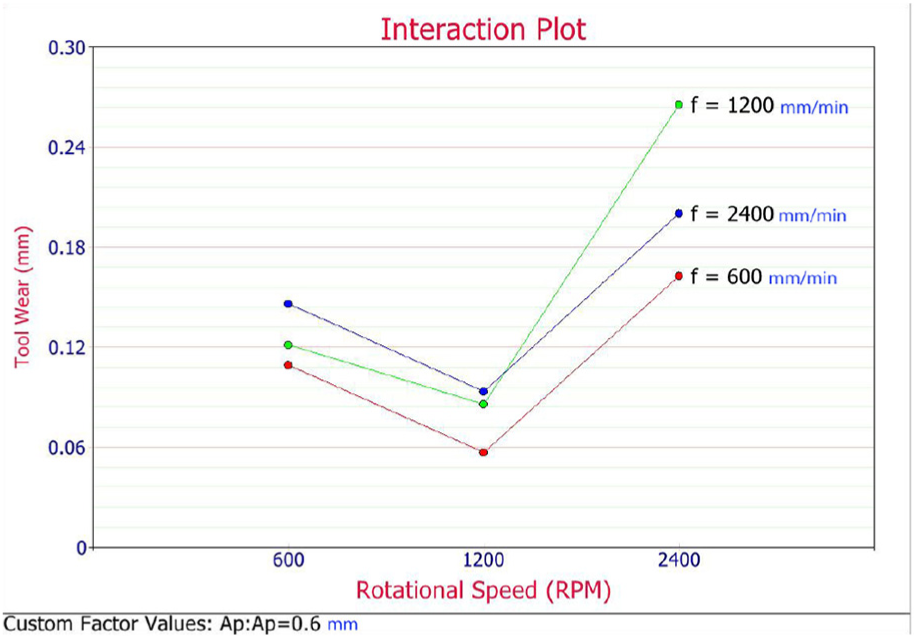
Analysis of wear of the tool in relation to Ap = 0.6 mm.
Analysis of variance
The idea, analysis of variance (ANOVA), is a variant due to the treatments with a variation due to chance or residue. ANOVA computations are summarized in a table with columns for source of variation, degrees of freedom (DOF), sum of squares, mean squares and F statistics.
The DOF indicates the quantity of the experiments in the data set. DOF of a factor is equal to a number of levels of factor minus 1. The F-ratio in the ANOVA table makes a test of the null hypothesis that all the treatment means are the same (all the αi values are 0) versus the alternative that some of the treatment means different (some of the αi values are non-zero). When the null hypothesis is true, the F-ratio is about 1, providing some random variation; when the alternative is true, F-test tends to be bigger than 1 when compared to the F-statistic.
The values of p are used in hypothesis testing. One way to report the results of a hypothesis test is to state that the null hypothesis was or was not rejected at a specified p value or level of significance. This is often called fixed significance level testing. For example, in the portland cement mortar formulation above, we can say that H0:
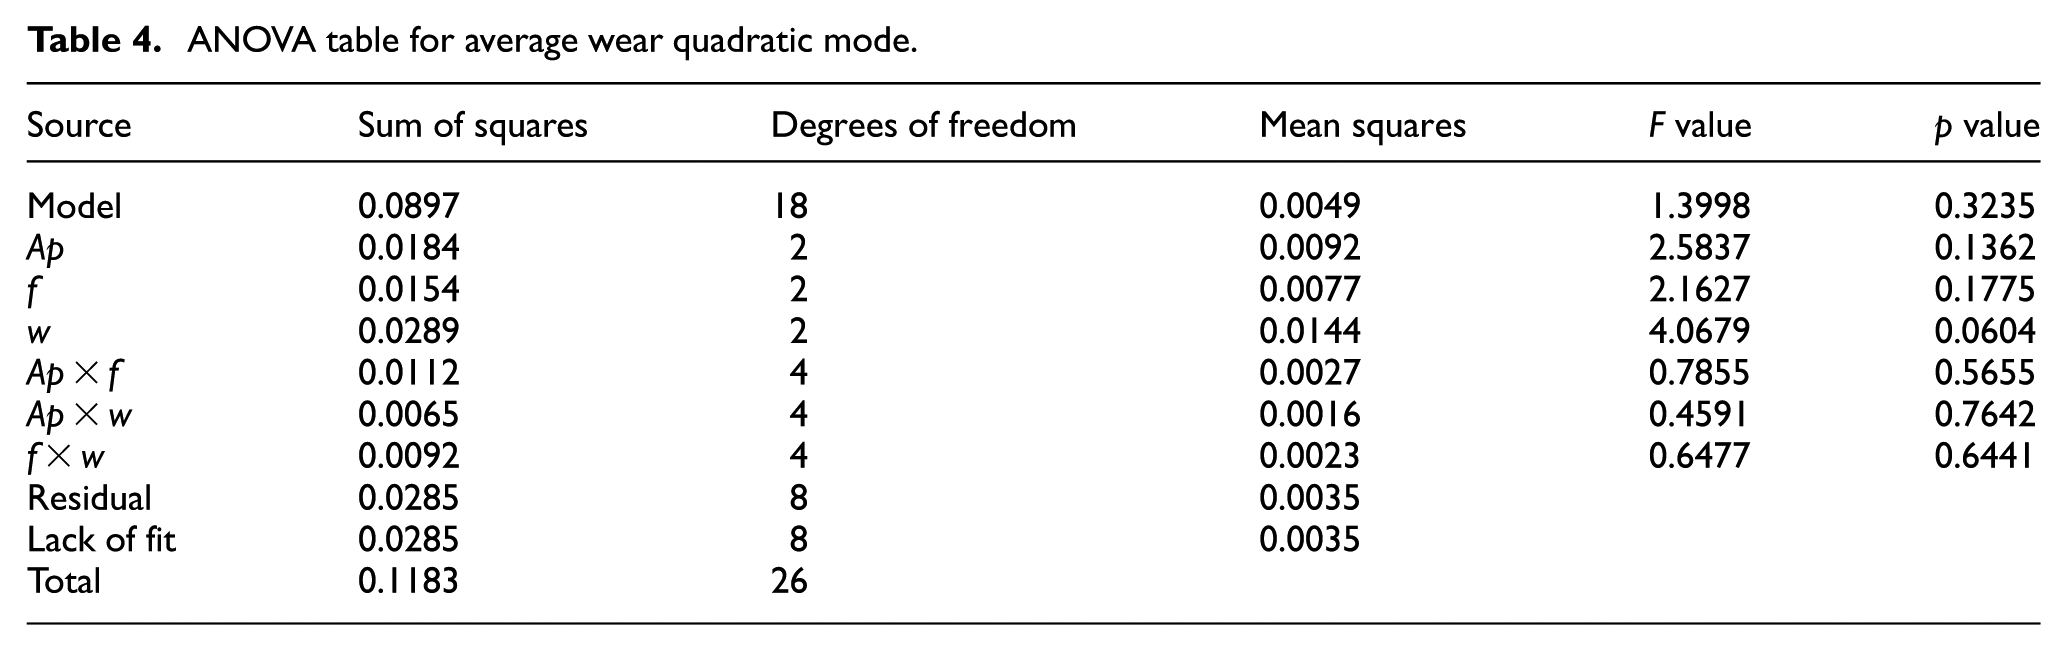
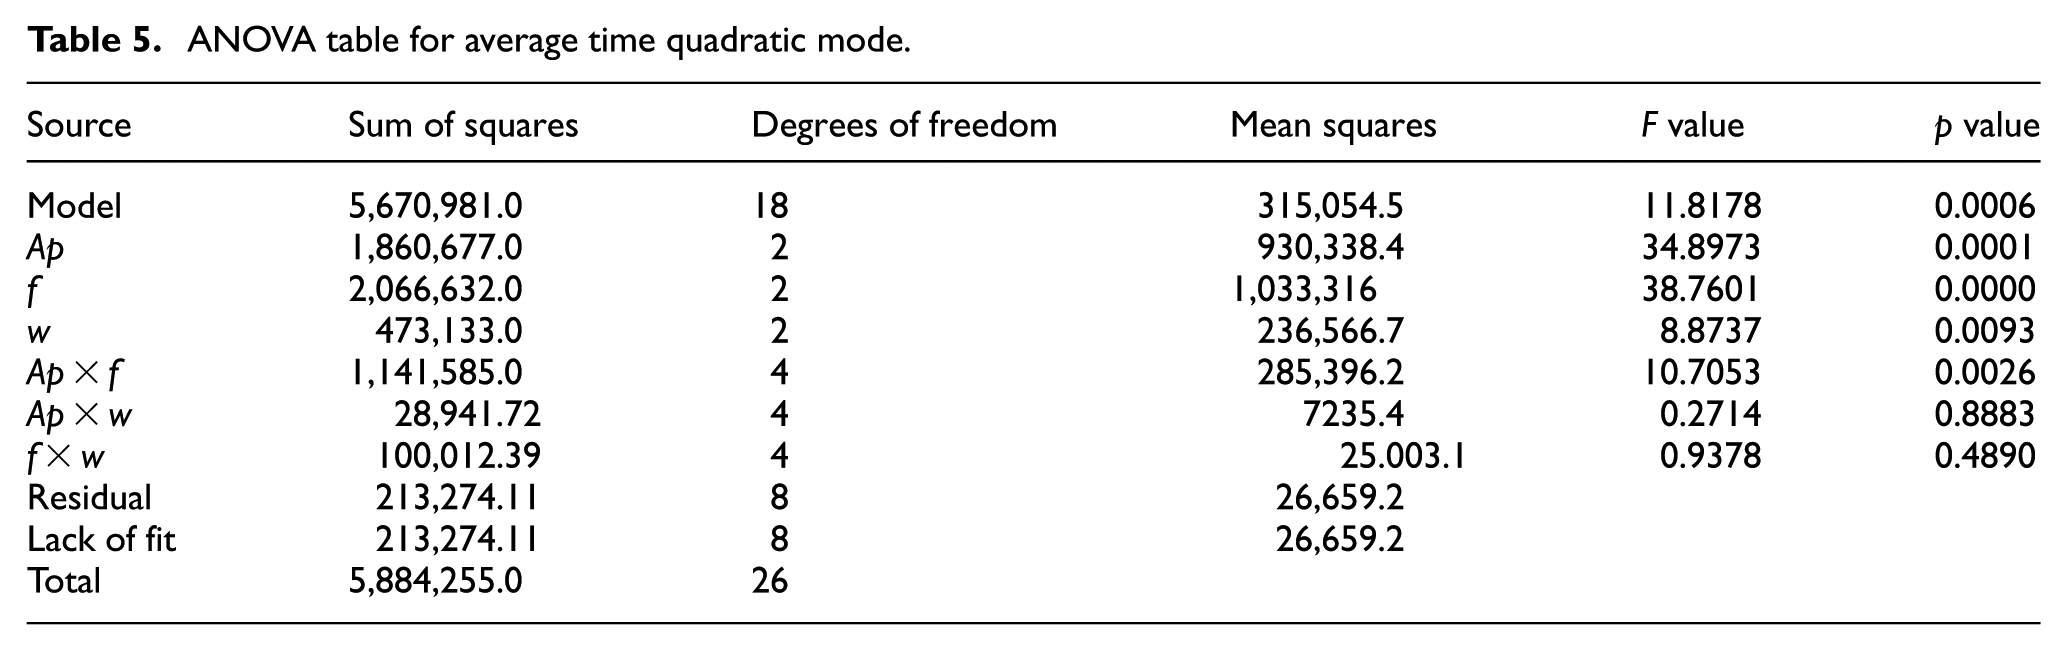
The larger the “F-ratio,” the lower the “p value” of a factor indicating the higher significance of that factor (Tables 4 and 5). In this case, the model term is said to be statistically significant if its “p value” is less than 0.05. In addition, for the analysis of wear
ANOVA table for average wear quadratic mode.
ANOVA table for average time quadratic mode.
The former is referred to as the treatment mean square, while the latter is referred to as the error mean square. A ratio of the two terms is used to conduct the F test. The F ratio will be close to a value of 1 and will follow the F distribution. On the other hand, if the investigated factor does affect the response, then the F ratio will not follow the F distribution and the p value corresponding to the F ratio will indicate this.
It can be observed in Table 4, which analyzes the result of the formula Dtt, that the values of F were too close to 1 and if the value of p is close to 1, then the model is not significant and hence it is not a good prediction.
In addition to the coefficients and multiplication factor of the equation, the software presents the coefficient of determination of the model (R2) and the significance value (sig.) as a response. The coefficient of determination represents how much the model explains the variable, in this case the Dtt. Satisfactory values for R2 are above 0.7, which means that the equation accounts for 70% of cases. The significance level represents the level of correction needed between the data presented with the dependent variable, which should be below 0.05 or 5%.
Results and discussion
The goal of the investigation is to find the best combination of process parameters with the shortest processing time generating the least wear possible in the forming tool, so it is necessary to understand what happens when we modify the processing parameters.
ANOVA analysis and the main effect plots of the factor on Dtt (wear)
To define a mathematical model to explain the reaction of galvanized sheet steel with an SAE 1045 forming tool in the SPIF process, multiple regression of the Taylor expanded formula was made. With the results obtained, in the software SPSS and Statdisk, equation (12) was set up.
For equation (12), the R2 value obtained was 0.495, which means that the model explains 49.5% of the wear and the values of significance obtained were also outside the acceptable limits and the objective proposed in the study, where K = 0.886, f = 0.719, T = 0.014,

The effect of independent factors and their mutual interactions on tool wear is tabulated in Table 4.
ANOVA analysis and main effect plots of the factor on T (time)
In this way, the formula must be restructured to reach the objective. Therefore, a modification was made in the order of the variables leaving as dependent variable of the time of conformation, or better, the lifetime of the tool, taking equation (13) as follows

By modifying the input data of the SPSS, to fit the new equation, the new coefficients were obtained, being the same ones presented in equation (14)

Making a new analysis of convergence of equation (14) in SPSS software, we obtained a coefficient of determination (R2) of 0.822, showing that the model explains 82.2% of the tool lifetime and significant values were K = 0.000, F = 0.001, Dtt = 0.014,
The high rotation of the tool generates high friction between the sheet to be formed and the forming tool. Although this friction can be detrimental to the finish of the part, the analysis of the tests carried out resulted in the conclusion that the larger the rotation, the better the roughness of the final part. Acting only on rotation does not improve the process, working with a relation between rotation and feed can reduce the formation time and provide a good surface quality.
The effect of independent factors and their mutual interactions on tool wear is tabulated in Table 5.
Response surface graphs and interaction effects for Dtt and T
If the model accurately considers the effect of the factor, the residuals (the differences between the response values observed at each factor level and the response values predicted by the model) should be approximately normal and independently distributed, as can be seen in Figures 20 and 21, it can be observed that some points of the curve do not fit with the normal line.
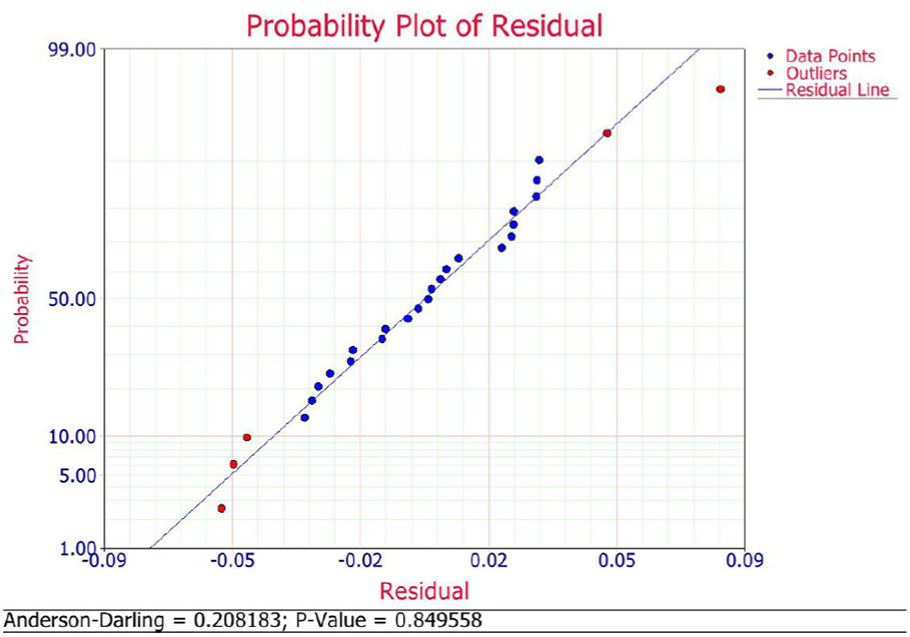
Probability plot of residual for tool wear.
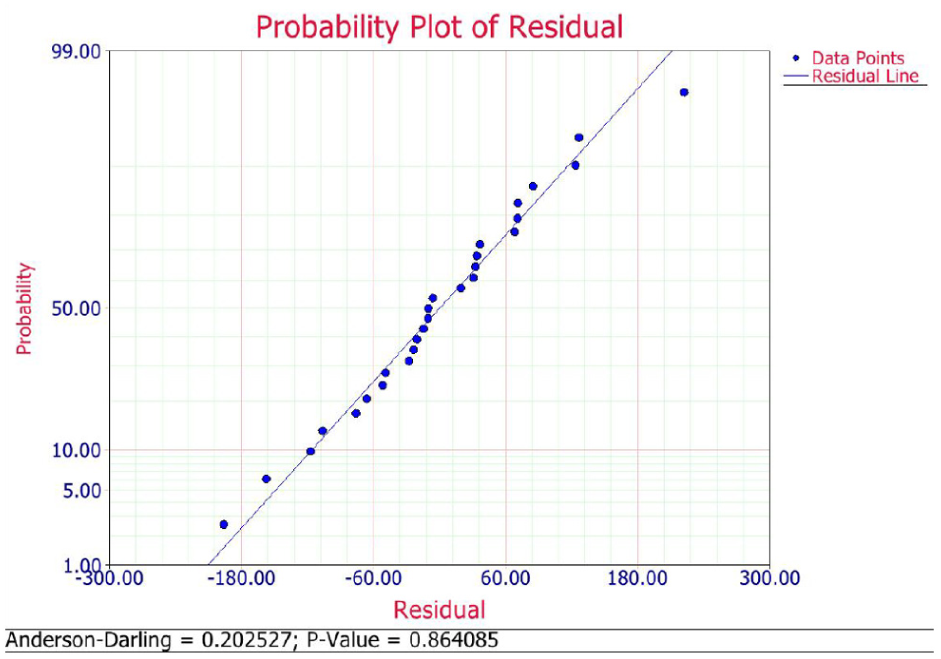
Probability plot of residual for time.
In Figure 20, it can be seen that some points were not adjusted to the curve, causing some errors of convergence and an imprecision in the convenience of the mathematical formula. The points outside the curve are outside the programmed limits of residual line then that in this case, which is −0.4 to +0.4.
It can be observed in Figure 21 that most of the values converged to close to the normal residue line, thus obtaining an excellent result of the mathematical equation performed in relation to the life time of the tool.
Validation of experimental results
Experimental × predicted values
In order to obtain a better comparison between the results obtained through the measurements and the result obtained by the generated equations, Table 6 is created, where we can observe the measured and calculated values.
Experimental × predicted.
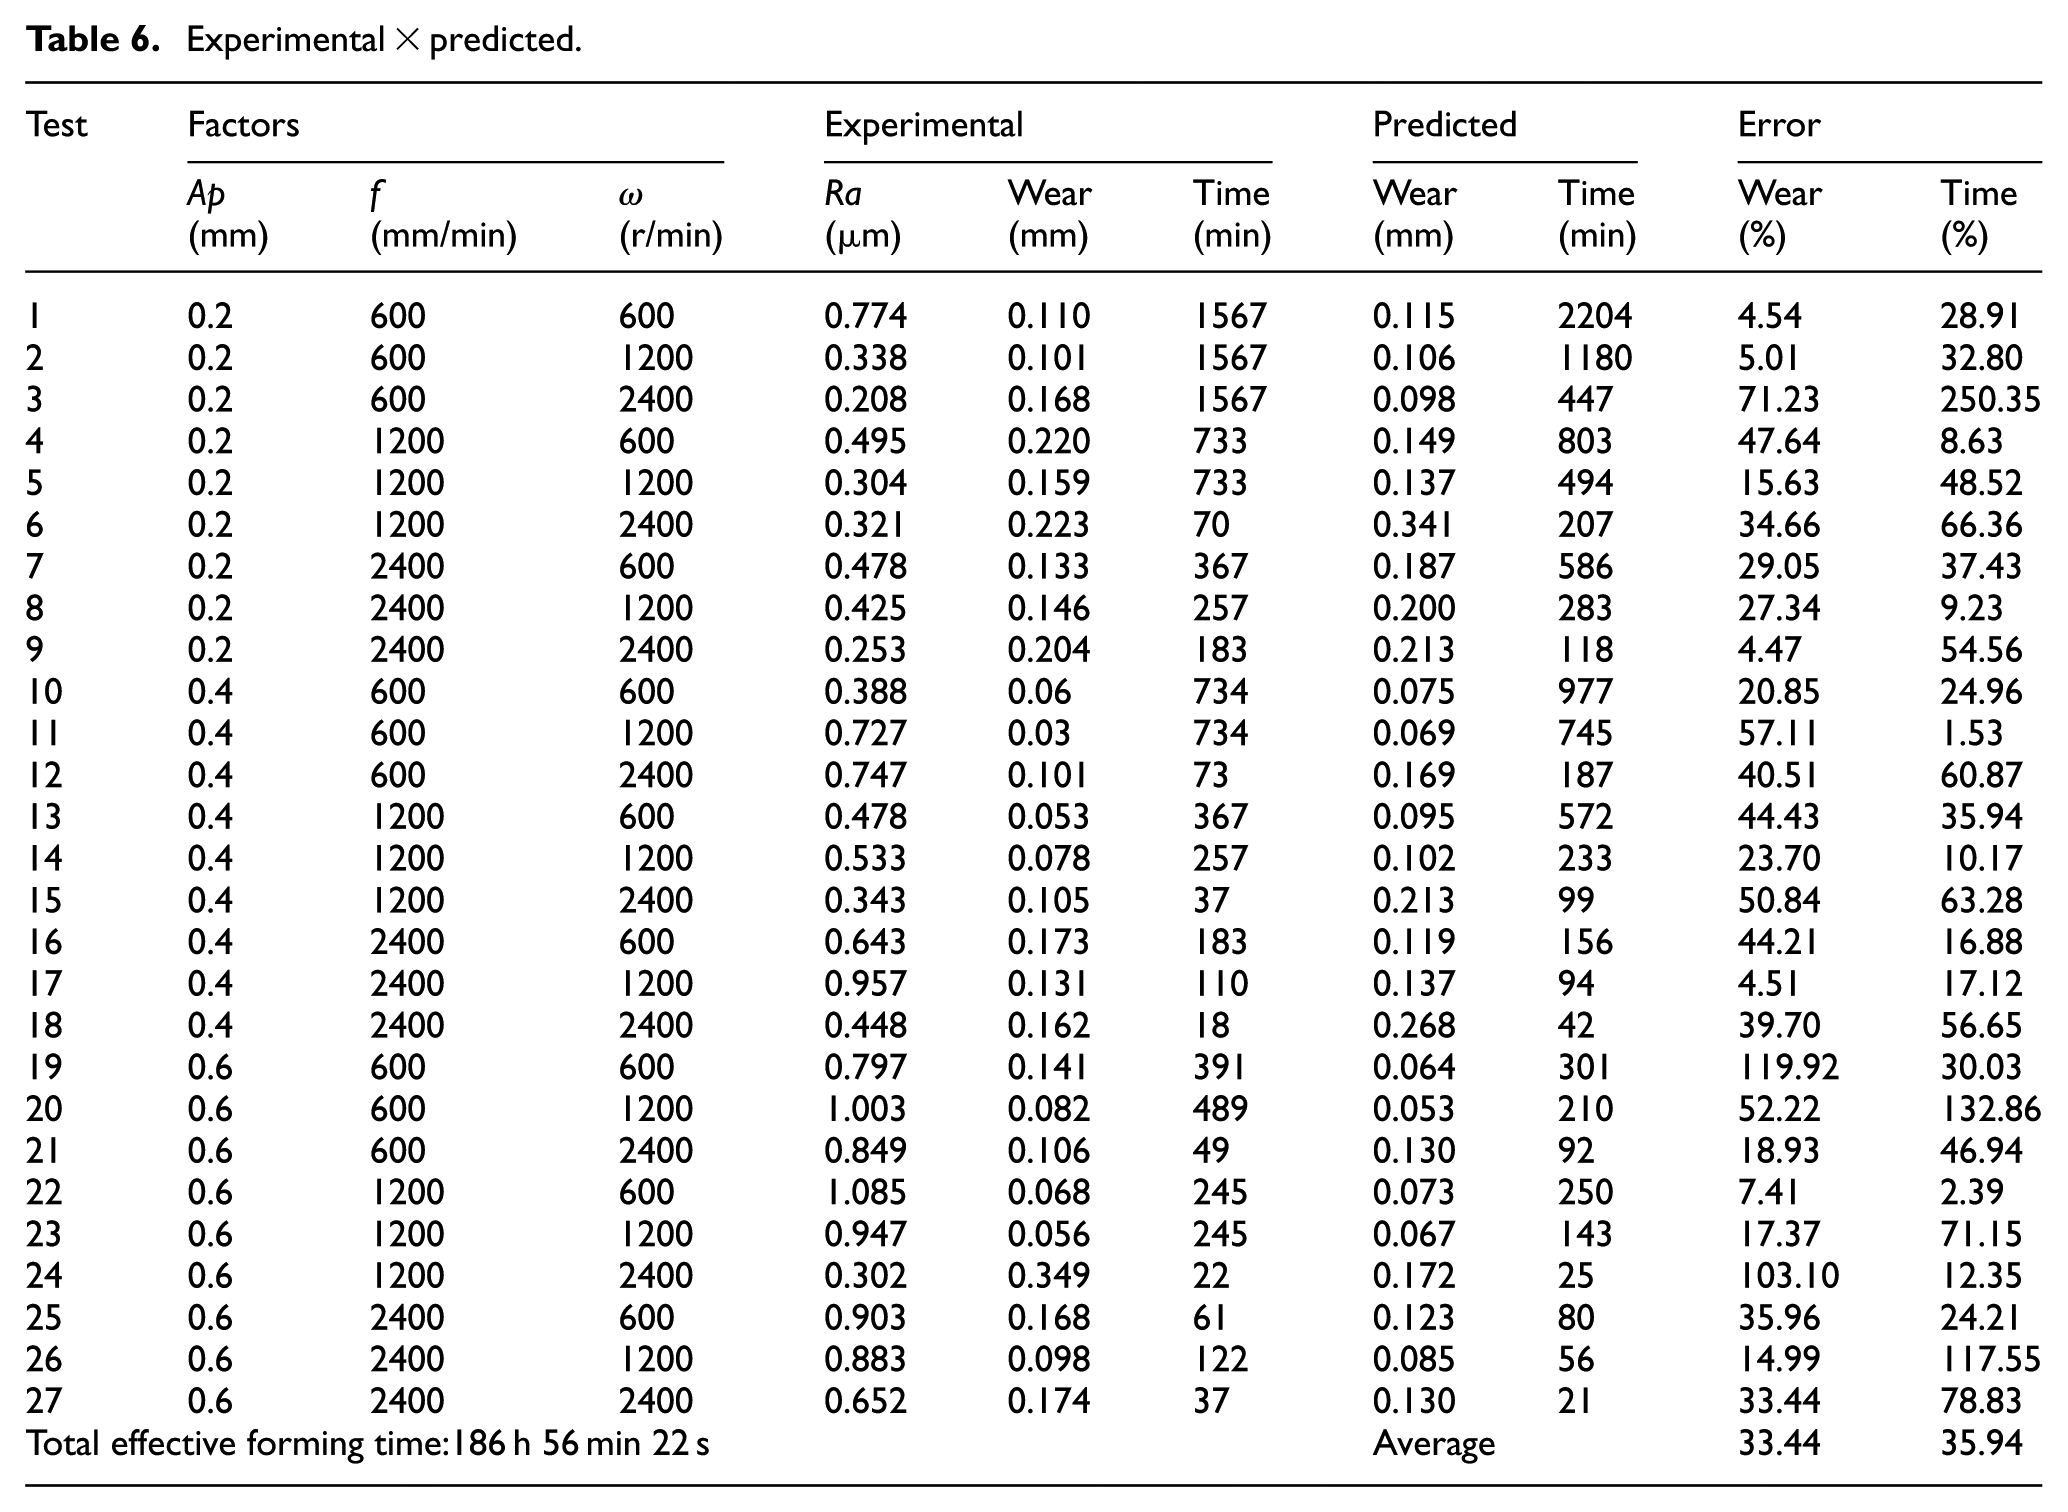
The predicted model columns present the data calculated from the tool wear formulas and the tool life, in order to understand the difference between the values that were calculated and measured, and a percentage error column can be observed for the value of the error for each experiment performed. The overall error rate is 33.44% for the wear formula and 35.94% for the life-time formula.
A plot of experimental and predicted responses is represented in Figures 22 and 23. It can be seen that the dot distribution is close to the straight line, but in Figure 22, it can be seen two further points, test 6 and test 24, while in Figure 23, we can see three points further apart from essays 1, 2 and 3, but in general one can say that the answer has a good accuracy.
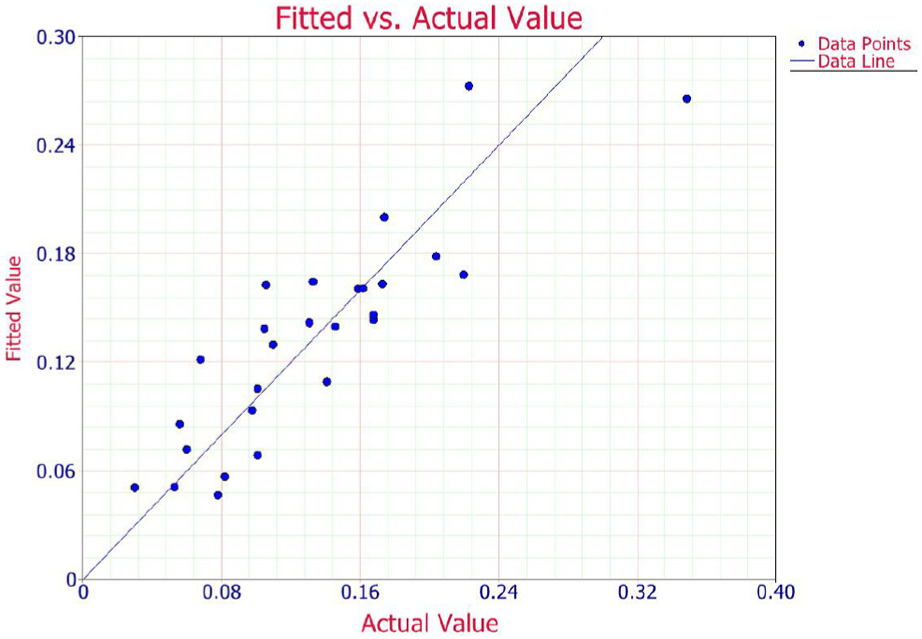
Plot of experimental and predicted responses for tool wear.
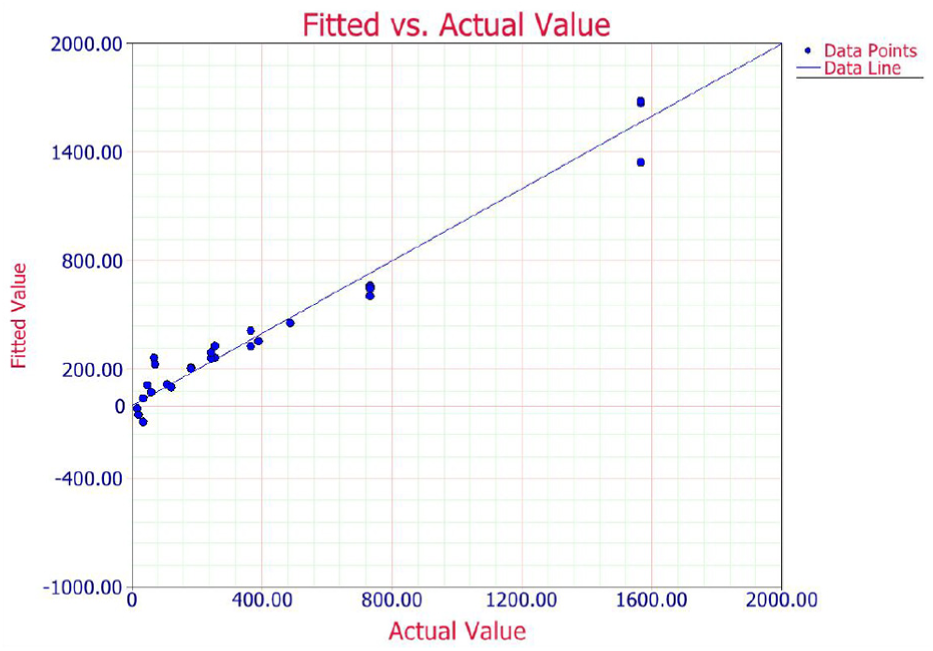
Plot of experimental and predicted responses for time.
It is observed that data points are closely distributed to the straight line indicating close accuracy between experimental and predicted responses.
Analysis of causes and effects
For analysis of cause and effect of the input parameters with the output data, Table 7 is performed.
Input conditions and output result.
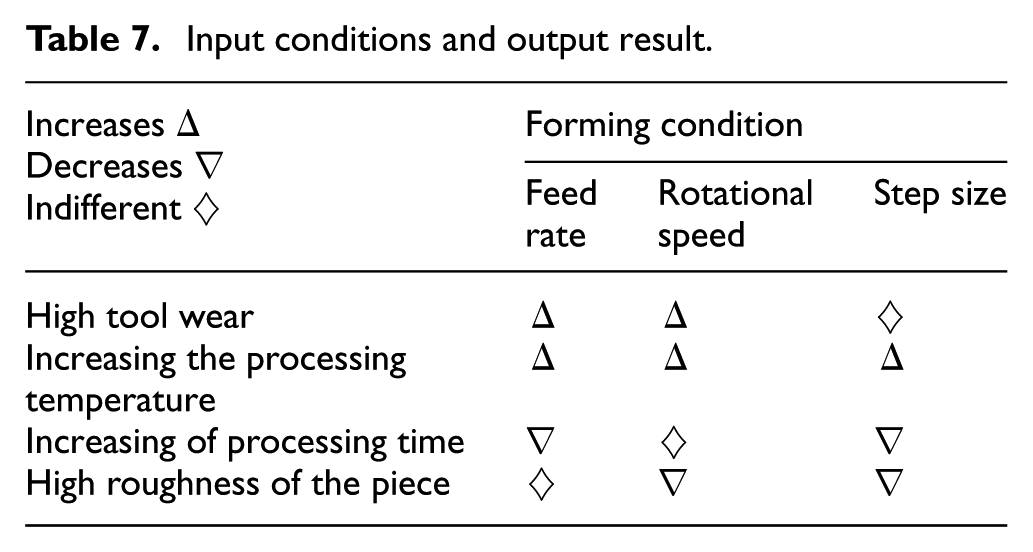
Table 7 shows that when feed increases, tool wear and process temperature increases, the processing time decreases and the roughness of the final part is little influenced by the feed. Increasing the tool wear increases the processing temperature, and the processing time is not influenced by rotation, but with increased rotation, a significant improvement in the workpiece surface finish can be achieved. When Ap increases, tool wear does not show significant variations, and if there is an increase in processing temperature, the forming time is appreciably reduced and the surface quality of the workpiece improves.
Conclusion
This article presents an unpublished methodology of tests for wear analysis and tool life evaluation for SPIF process, in which a tool of SAE 1045 steel without heat treatment was used to form galvanized steel sheets with 0.95 mm thickness, totaling a conformation time of 11,160 min, with a top wear of less than 0.1 mm.
With the proposed method and the accomplishment of the experimental tests, it was possible to obtain a mathematical model of the prediction of the life time of a tool of SPIF, for the SAE 1045 steel tool pair and galvanized steel sheet. The results of the study present an original model of prediction of tool wear in relation to the input parameters for the SPIF process, the overall error rate is 33.44% for the wear model of prediction and 35.94% for the life-time model of prediction.
It was established that the high rotation improves the surface finish of the part and also increases the wear of the tool, and it has been demonstrated that there is a relation between the feed rate and the rotation capable of producing pieces with a high surface quality and reduced time of production. The mechanical strength of the plate and the tool hardness are also parameters of the SPIF process that can influence the wear of the tool.
This work provides a relevant contribution to estimate the tool life of the incremental training process. This achievement means an improvement in the SPIF technology, making possible the optimization of the productive process, which, by means of the empirical model, makes a better definition of the conditions of forming to obtain a process with greater productivity, lower cost or constant tool life.
In future works, new tests with the rotational speed greater than 2400 r/min are suggested to evaluate the results associated with the roughness analysis, as some experimental results were obtained different from the results in the literature. It should be emphasized that the novelty of the method proposed to evaluate tool wear, which was not reported in the literature, is the greatest contribution of the investigation.
Footnotes
Declaration of conflicting interests
The author(s) declared no potential conflicts of interest with respect to the research, authorship, and/or publication of this article.
Funding
The author(s) disclosed receipt of the following financial support for the research, authorship, and/or publication of this article: This work was supported by the Brazilian government agencies MEC/CAPES/CNPq/FAPDF.