
Abstract
Microgrooves are one of the basic microfeatures fabricated on different microproducts, used to integrate micro systems in various fields. Service life and product functioning of microproducts are directly influenced by shape, size, and surface quality of microgrooves fabricated on it. Hence, these are the important criteria to be considered while fabricating microgrooves on micro devices. This article presents the experimental study into fabrication of microgrooves on stainless steel by electrochemical micromachining. The influence of electrochemical micromachining process parameters like applied voltage, pulse frequency, duty ratio, electrolyte concentration, and microtool scanning speed on machining accuracy, that is, width overcut, length overcut and depth overcut, material removal rate, linearity of microgroove, depth profile, and surface finish were investigated during microgroove generation. From the experimental results, optimal parameters obtained were applied voltage of 2.6 V, pulse frequency of 8 MHz, 30% duty ratio, electrolyte concentration of 0.15 M H2SO4, and microtool scanning speed of 93.75 μm/s for machining of accurate microgroove, with best surface finish. Finally, microfeatures like “C”-shaped microgroove of rectangular cross section and multiple microgrooves as required in micro thermal devices have been machined with optimal parametric settings. This study will be useful for machining of need-based microgrooves on microproducts like micro actuators, micro pumps, micro coolers, and micromixers.
Introduction
There is continuous increasing market demand for compact, intelligent, robust, multi-functional, and low-cost industrial products in various fields. Miniaturization is the only viable solution to fulfill such strong market requirements, since miniature systems have low mechanical inertia, less thermal distortion and mechanical vibration, low mass and weight, less space requirement, low cost of operation and less amount of material, and energy requirement. Therefore, miniaturized products find wide applications in various fields like microelectromechanical systems (MEMS), fuel processing, aerospace, heat transfer, and microfluidics. Typical micro systems consist of various micro devices integrated together like micro sensors, micro actuators, micro pumps, micro coolers, micro heat exchangers, micro reactors, and micromixers. The micro devices have to withstand higher stresses at elevated temperature during its service in different applications like micro combustors, chemical reactions required at elevated temperature, in micro reactors, and in micro thermal devices. To fulfill such adverse requirements of service conditions, microproducts are made of advance engineering materials like titanium and titanium alloys, nickel, super alloys, aluminum alloys, and stainless steel. Hence, it is essential to investigate the microgroove fabrication process on advanced metallic surfaces. Stainless steel, which has higher mechanical strength, corrosion resistance, thermal stability, and low cost, is one of the prospective materials in fabrication of micro devices. Microgrooves of different shapes, sizes, and surface finishes are the key configurations in majority of the microproducts. In microfluidics, frictional force and capillarity vary according to the shape and surface roughness of the microgroove. High aspect ratio of microgrooves provides large surface area for reaction systems, for heat dissipation, and a high capillary force for micro heat pipes. Microgrooves can also be used as slide ways in micro mechanical systems. Geometrical shape, size, and surface roughness of microgrooves affect the service life and running performance of the micro components; hence, fabrication of metallic microgrooves in the range of tens to hundreds of microns in width and depth, with good shape accuracy, and surface quality, is the focused area of research and needs further development.
Several methods have been reported for the fabrication of metallic microgrooves, micro-channels, and microstructures. Lim et al. 1 fabricated thin cylindrical tungsten micro pins of uniform diameter by regulating the current density by means of electrochemical etching. Kim et al. 2 introduced the use of disk-type electrode for electrochemical milling of taperless microgrooves and microstructures of high aspect ratios on stainless steel, by applying ultrashort voltage pulses. Shin et al. 3 used micro wire as tool in electrochemical micromachining (EMM) of microgrooves by moving the microtool along the programmed path and analyzed the side gap according to pulse voltage, pulse on time, and pulse period. Choi et al. 4 investigated the machining characteristics during electrochemical machining of WC–Co alloy using ultrashort pulses and successfully machined microfeatures like microholes and microgrooves having sharp edges with good surface quality by electrochemical drilling and milling. Malapati et al. 5 fabricated micro-channels in copper foil by EMM and investigated the influence of process parameters on linearity and stray current–affected zone. Rao and Kunzru 6 fabricated micro-channels on stainless steel by wet chemical etching and observed that the channel depth and etch factor were significantly affected by the composition of etchant, operating temperature, and initial width of opening. Jang and Park 7 fabricated micro-channels on stainless steel for fuel cell plates using chemical etching and micro end milling. Jain et al. 8 fabricated microholes and micro-channels on copper sheet using sewing needle as a tool by EMM. Yan et al. 9 fabricated microgrooves of varied cross sections on stainless steel by electro-discharge machining (EDM) and investigated the influence of discharge energy over shape and surface roughness of the microgroove fabricated. EDM needs separate tools for every shape of microgrooves since microtool wear cannot be avoided. Ali 10 compared the fabrication of microfluidic channels on metals and polymers using micro end milling and micro electrical discharge milling. Ryu 11 applied EMM using ultrashort pulses, for machining of microfeatures like microholes, square, and circular cavities on stainless steel, using citric acid as an electrolyte. Das and Saha 12 fabricated cylindrical micro tools by electrochemical turning and followed roller burnishing process to improve its surface quality. Murali and Yeo 13 presented a spark erosion technique for machining of straight microgrooves in hardened tool steel using graphite foil as tool electrode. Ghoshal and Bhattacharyya 14 proposed micro electrochemical sinking and milling method for generation of microfeatures on stainless steel by EMM. Oh et al. 15 investigated the sidewall roughness of microgroove machined with laser-induced etching and concluded that etch depth and sidewall morphology was significantly affected by laser source; however, it was difficult to get the uniform cross section of the microgroove for higher depths in addition to unavoidable heat-affected zone. Yu et al. 16 reported ultraviolet lithography (UV-LIGA) manufacturing process for characterization of high aspect ratio metal micro channel plates for microelectronic cooling applications. For LIGA process, very expensive equipments are required in addition to special environment such as vacuum or ultraviolet source. Hakamada et al. 17 fabricated straight and bent copper micro-channels by the spacer method and investigated their microfluidic flow characteristics. Ruszaj et al. 18 applied electrode ultrasonic vibrations for monitoring and analyzing phenomena occurring at machining area in EMM.
Fabrication processes affect the machining accuracy and surface finish of the microgroove. Shape and size of the microgroove can be relatively controlled by adjusting the process parameters, whereas surface roughness is more difficult to control by just adjusting the machining parameters in various methods. EMM is an attractive method for fabrication of metallic microgrooves on difficult-to-cut materials. Since there is no physical contact between tool and workpiece, there is no tool wear, no stress induced into the workpiece, no surface cracks, and structure of the workpiece remains unchanged. This permits the use of micron-sized tools for the machining of microfeatures on metallic surfaces. Material dissolution takes place at atomic level; therefore, good surface finish can be achieved irrespective of the hardness of the material. Microgrooves of various shapes, sizes, and surface finishes are required in different applications. Therefore, for the fabrication of need-based structures by EMM, proper setting of the process parameters is most important. Considering industrial applicability of this process, it becomes essential to know which parameters have to be set on production machine and which conditions have been controlled to reach the desired result. Previous studies of microgroove machining by EMM mainly included the investigations into width overcut (WOC), length overcut (LOC), and material removal rate (MRR), whereas actual depth of microgroove, depth profile, that is, exact cross section of the machined microgroove, surface finish at the bottom of microgroove, and uniformity of the microgroove along its length are the important features of the microgroove from application point of view. Therefore, the authors have investigated the influence of EMM process parameters on these important features of the microgroove, in addition to WOC, LOC, and MRR, during machining of microgrooves by EMM.
This article presents in-depth experimental investigations into machining of microgrooves on stainless steel by EMM, using developed tungsten microtool. The influence of process parameters like applied voltage, pulse frequency, duty ratio, electrolyte concentration, and microtool scanning speed on dimensional accuracy, MRR, depth profile, and surface finish of microgrooves has been investigated. Stability of the machining process was also investigated by measuring the microgroove widths at different positions along the length of microgroove. Conditions of machined microgrooves were analyzed through measuring microscope, and by three-dimensional (3D) non-contact surface profiler, for shape accuracy and surface finish. This study will be useful for machining microgrooves of desired size and surface finish on stainless steel for any specific applications. Finally, an attempt has been made to machine microfeatures like complex-shaped microgroove of rectangular cross section and multiple microgrooves as required in micro thermal devices with optimal parametric settings.
EMM and experimental setup
Fundamentals of EMM
EMM is an anodic dissolution process, in which material is removed from metallic surface by electrochemical reaction according to Faraday’s law of electrolysis. Workpiece as anode and microtool as cathode are immersed in an electrolyte, with very small inter-electrode gap (IEG). Micron scale tool electrode moves with constant feed rate toward the workpiece to maintain the IEG. Following the scheduled path of the microtool, desired microfeatures can be machined as encircled in Figure 2. When the microtool is placed in an electrolyte with very small IEG, RS is the side gap electrolyte resistance and Rb is the resistance of the electrolyte at the bottom of tool. While machining of microhole, the tool feed is in downward direction, Rb is the shorter electrolyte resistance path between tool bottom and workpiece, hence dissolved area is the region under the front end of the tool, resulting in micro drilling operation. When the tool feed is in X-direction or Y-direction, Rs is the electrolyte resistance of shorter path and anodic dissolution takes place around the tool sidewall, resulting in grooving operation on workpiece.
During electrochemical reactions, due to the effect of static electrical force, ions or molecules at the interface between electrode and electrolyte are rearranged forming interfacial layers. The interfacial layers formed at electrode-electrolyte interface behave as plates of capacitor and charges and discharges according to supplied potential and is called as “electrical double layer” (EDL).Figure 1(a) shows the equivalent electrical circuit of electrochemical cell, where CDL is the capacitance of double layer and Rp is the polarization resistance of the double layer. Schematic of the pulse waveform supplied during machining is shown in Figure 1(b) In EMM, machining takes place during pulse on time only and EDL is charged and discharged periodically during every supplied pulse. Electrolyte resistance at (Rb or Rs) is the product of specific electrolyte resistivity (ρ) and IEG (h), then the charging time constant for double layer (τ) can be given as:

where Cdl is the specific capacitance of the double layer.
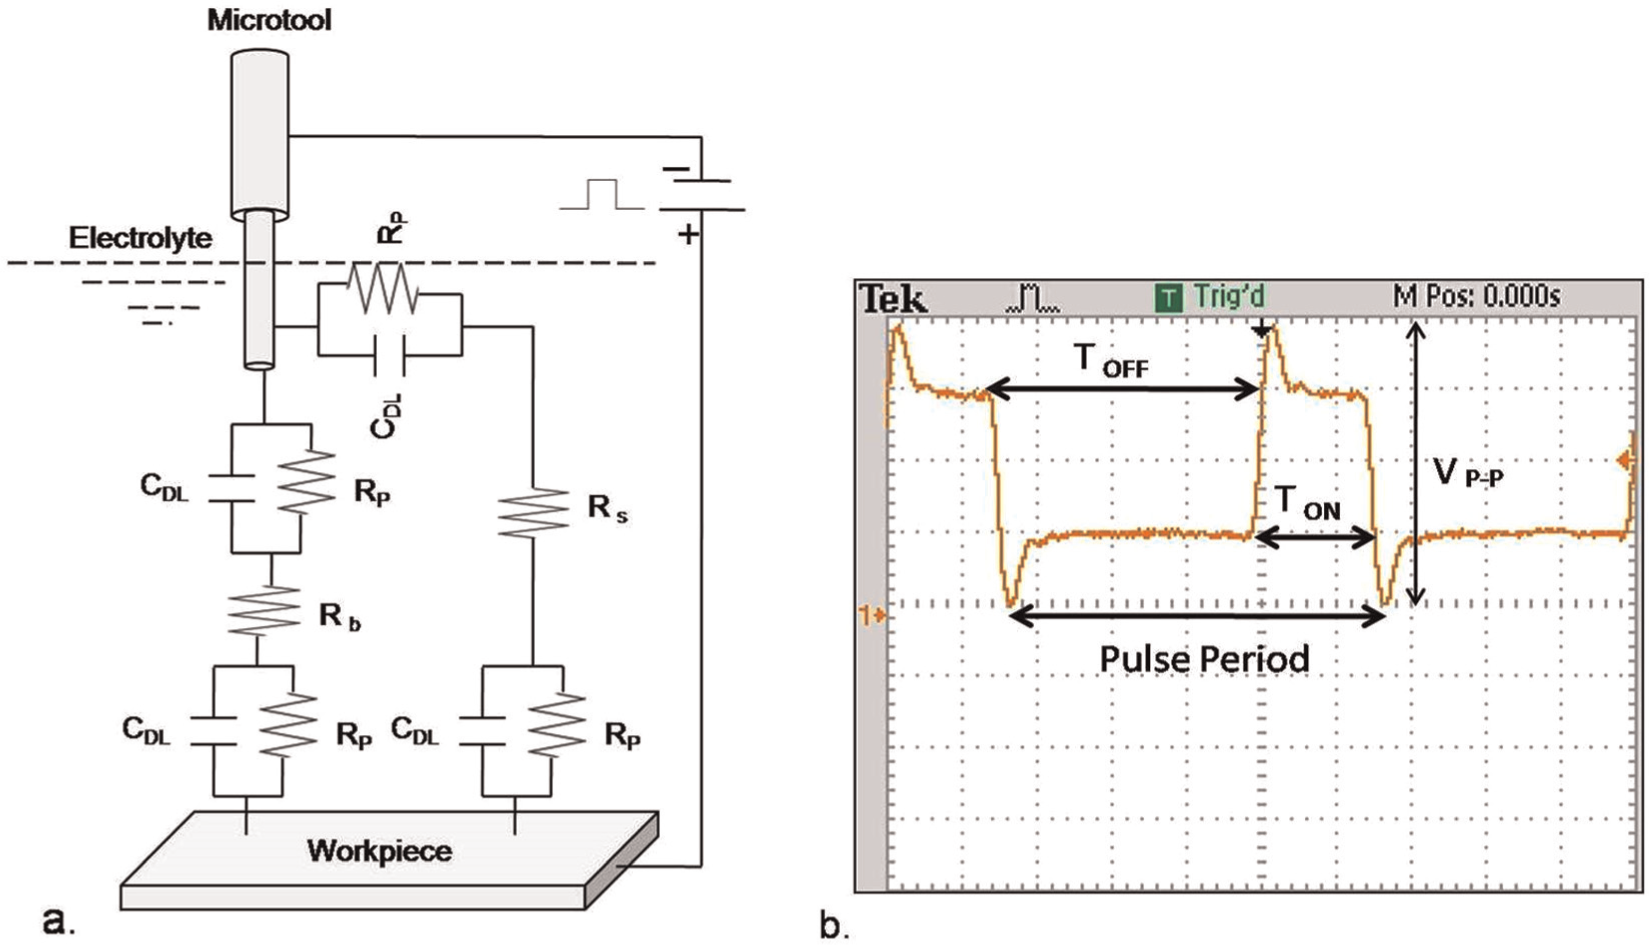
(a) Equivalent electrical circuit of EMM cell. (b) Schematics of pulse waveform.
Electrolyte resistance is proportional to the current path; hence, electrolyte resistance between the bottom of the microtool and workpiece, that is, Rb is smaller and gets charged, whereas electrolyte resistance between side of the microtool and workpiece, that is, Rs is comparatively higher and gets weakly charged during every pulse supplied. Therefore, when τb and τs are their corresponding charging time and if τb < TON < τs, the region at the bottom of tool having resistance Rb will get charged completely and there is extra time for electrochemical reaction to occur, whereas side region having resistance Rs will not get charged completely because of smaller pulse on time and electrochemical reaction will not occur along the sides.
When EMM is performed using ultrashort pulse voltage, machining precision can be controlled by effect of double layer and Faraday’s law. The amount of material removed during EMM can be determined by combining Faraday’s law and Ohm’s law 19 as stated in equation (2)
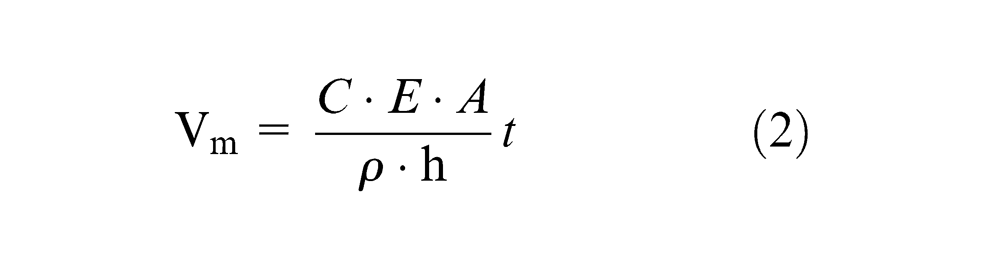
where Vm is the volume of material dissolved, C is the electrochemical constant of a material, E is applied voltage, A is electrode area, t is the machining time, ρ is specific electrolyte resistivity, and h is IEG.
Considering that material dissolution takes place during pulse on time only, equation (2) can be modified as
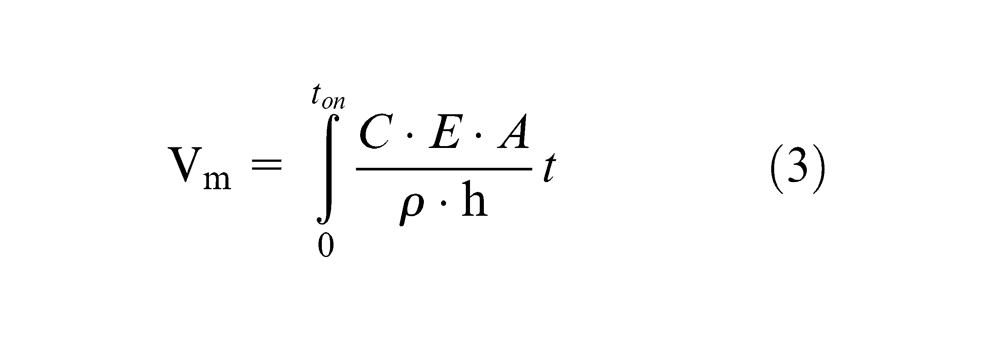
From equations (1)–(3), it can be seen that machining accuracy, that is, volume of material removal, can be controlled by various pulse parameters such as applied voltage, pulse on time and pulse period, electrolyte concentration, machining time, microtool size, and IEG. Therefore, influences of all these parameters need to be investigated for better control over the EMM process while machining of microgrooves.
Experimental setup
Figure 2 shows the schematics of developed EMM experimental setup, which has been used for development of microtool as well as machining of microgrooves and microfeatures. It consists of various subsystems, namely, mechanical machining unit, controller unit, desktop computer, pulse power supply, and machining chamber. Mechanical machining unit consists of three units of linear stages to provide basic movements in X, Y, and Z directions and arranged in gantry-type structure. Microtool was mounted on Z-axis using microtool holder. Controller unit regulates the speed of stepper motors of each linear stage through desktop computer. Various feeds can be given to all or any of three stepper motors at a time through controller unit. Function generator provides pulsed supply to electrodes, with various parameters like pulse amplitude, pulse frequency, and duty ratio. Digital storage oscilloscope monitors nature of pulse online and stores the generated pulse for further analysis. The machining current flowing through the electrolyte cell was measured using digital ammeter. Machining chamber fabricated from Perspex material has work holding arrangement to assure mounting of the workpiece surface in perfect horizontal plane. StereoZoom microscope was used for online monitoring of the micromachining operation and measuring microscope for the measurement of machined microgrooves. Precision electronic weighing machine was used for measuring the weight of the work sample before and after the machining.
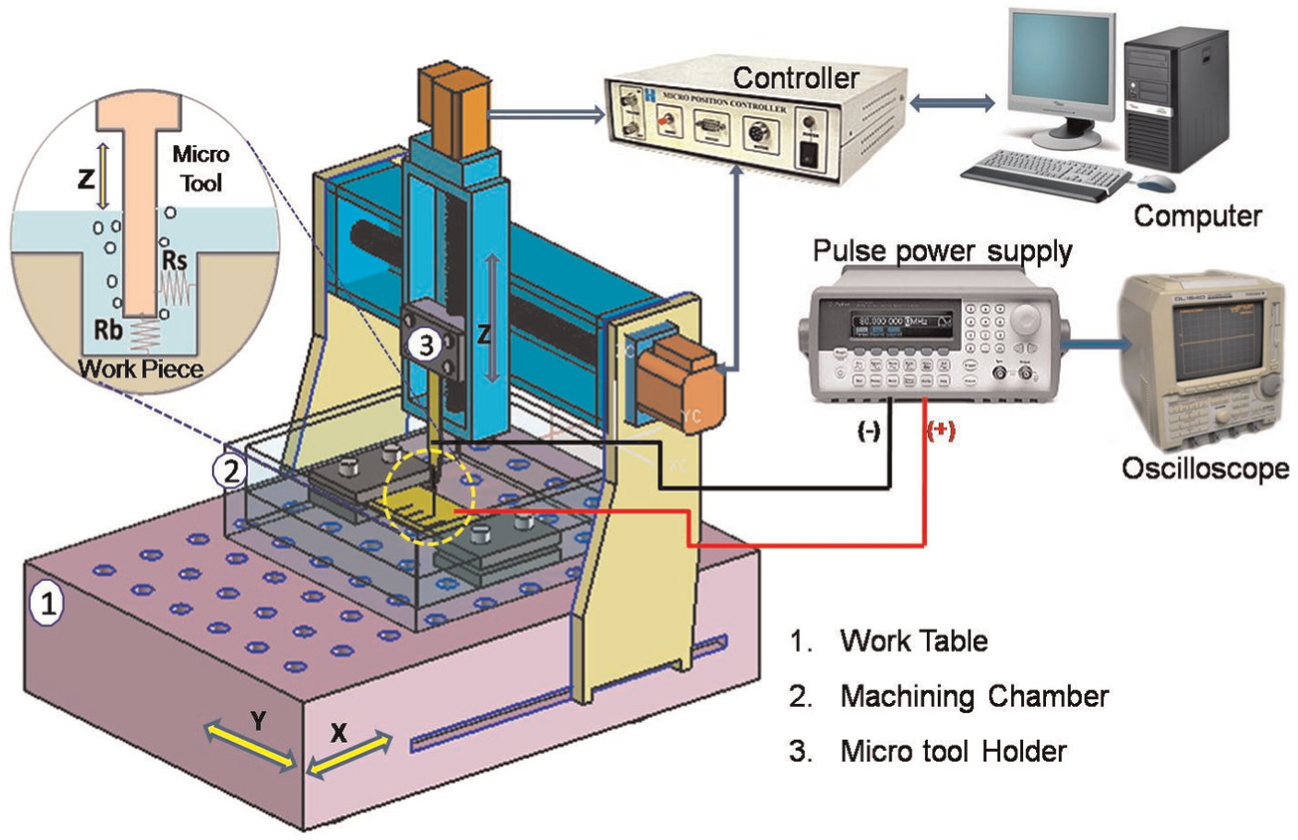
Schematics of EMM experimental setup.
Experimental plan
To investigate the influence of EMM process parameters during generation of microgroove on performance characteristics, experiments were systematically planned and performed using developed experimental setup. During experimentation, linear microgrooves of 2000 μm length were machined on stainless steel. The influences of various EMM process parameters on the micromachining criteria, that is, dimensional accuracy, MRR, depth profile, uniformity of microgroove along the length, and surface finish of the microgroove were investigated. Reverse tapered tungsten microtool having cylindrical tip diameter of 140.91 μm and taper angle of 0.58° as shown in Figure 3 was fabricated by reverse EMM using the same experimental setup and used for the fabrication of microgrooves. For effective utilization of microtool in generation of straight-walled microgrooves, reverse tapered microtool has been developed. To prevent the dissolution of material along the sidewalls of microtool, and to minimize the stray current effects during machining, sidewalls of microtool were insulated using liquid solution made of polymer and resin dissolved in isopropyl alcohol. Scanning-type strategy for microtool movement adopted during microgroove generation ensures supply of fresh electrolyte at micromachining region and improves machining quality. Microtool movements as per desired path were controlled using software program. Microtool moves to and fro for full scanning length with down feed of 0.3125 μm at the end of each scan. Microgrooves of 80 μm depth were machined finally. The initial IEG of 20 μm was maintained for all the experiments.
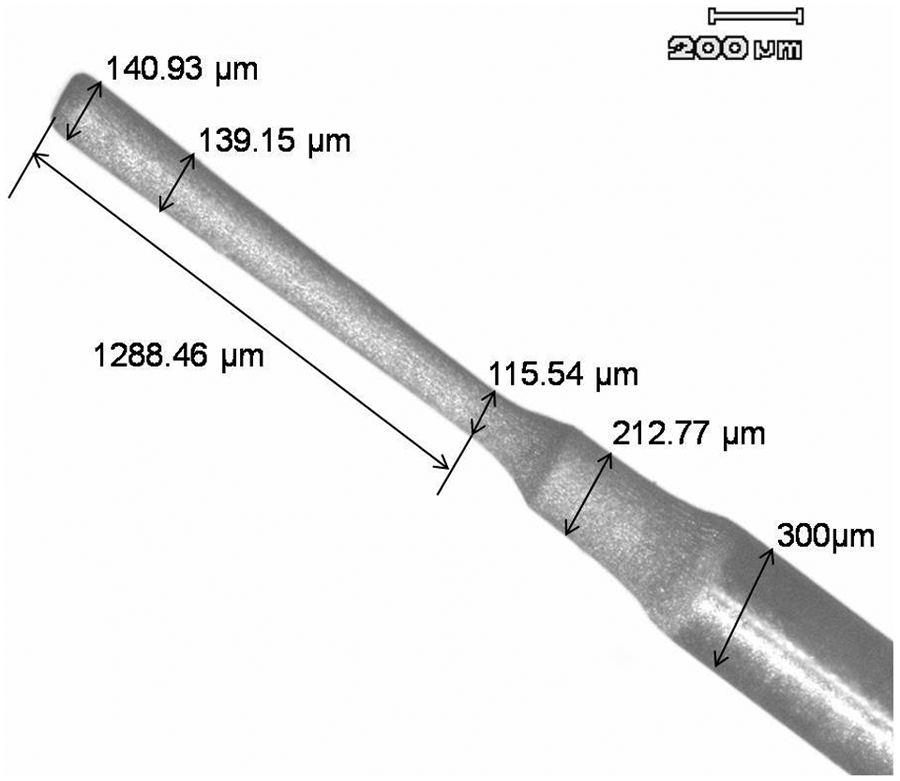
Microscopic image of developed tungsten microtool.
EMM process parameters for machining of microgrooves were selected considering the important points such as pulse parameters, that is, pulse on time, pulse off time, and voltage amplitude, which offer considerable potential for improvement in accuracy and surface finish and can be varied independently. Microtool shape and size that directly affect machining accuracy and sidewall insulation of the microtool play important role in minimizing stray current effects and taper generation along the sidewall of microfeatures. The IEG should be as small as possible, since with smaller IEG the resolution of the machined shape becomes better. The electrolyte completes the electric circuit between anode and cathode and allows machining reactions to occur. The electrolyte carries away heat and reaction products from machining zone. Dilute sulfuric acid is selected as an electrolyte, since it generates negligible precipitates and avoids clogging of sludge at narrow IEG. Machining localization also depends on machining time; hence, machining speed should be selected carefully to get better control over the process. In the present experimental study, various process parameters were determined by varying one parameter at a time keeping other parameters constant. Suitable parametric ranges for machining of microgroove as shown in Table 1 were determined from various trial experiments.
Parametric ranges during experimentation.
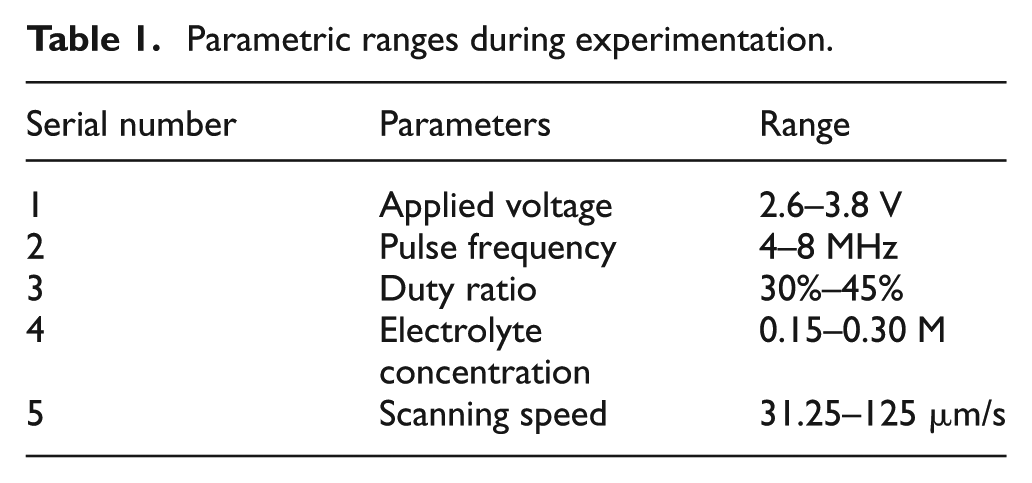
Machining of microgroove below 2.6 V, 30% duty ratio, 0.15 M electrolyte concentration, scanning speed above 125 μm/s, and pulse frequency above 8 MHz with other parametric combinations was not possible, since the material dissolution rate lags tool feed rate causing continuous sparking due to physical contact of microtool with workpiece surface. Therefore, these were considered as starting values of the respective parameters. However, extreme limits of the different parameters were determined from experimental setup capabilities and literature reviews.
Machining accuracy and quality of microgroove, that is, WOC, LOC, and depth overcut (DOC), MRR, uniformity of groove along the length, and surface roughness were obtained from the machined microgrooves. Various responses were calculated as follows.
WOC is the excess material removed across the width of microgroove and is calculated as

where i = 1, 2, …, N; N is the number of locations where microgroove widths were measured, W is groove width, and d is microtool diameter.
LOC is the excess material removed along the length of microgroove and is calculated as

where L is the actual length of microgroove, l is the travel length of microtool, and d is the microtool diameter.
DOC is the excess material removed along the depth of microgroove and is calculated as

where H is the actual depth of microgroove and h is the total downward feed of the microtool.
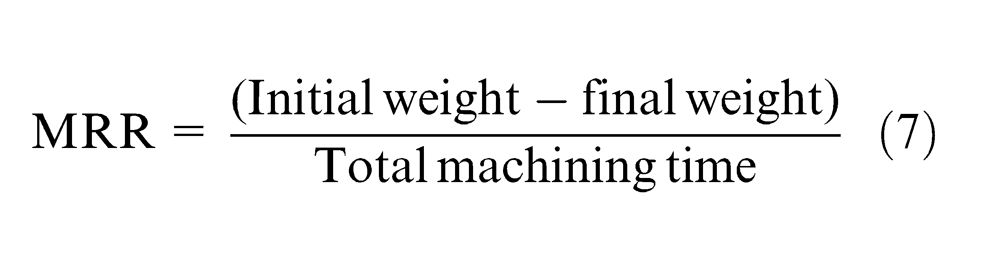
MRR is the amount of material removed per unit time and is calculated as
Linearity is the uniformity of microgroove width along the length of microgroove. Microgroove widths were measured at a distance of every 400 μm along the length. Linearity is calculated as


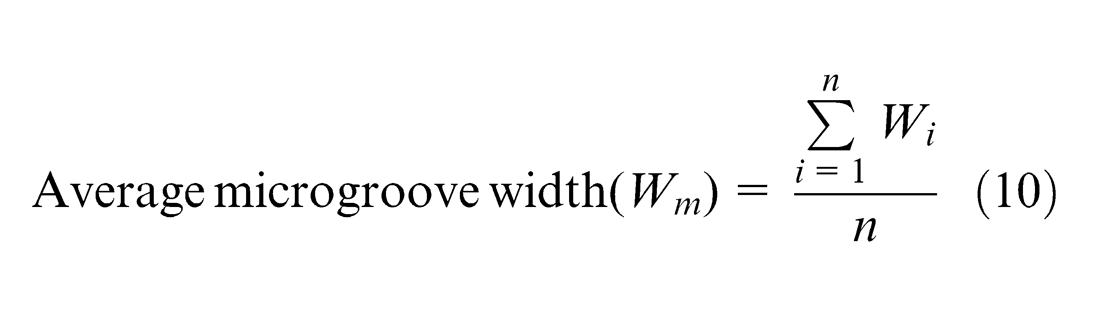
where Wi is the microgroove width at ith location, n is the total number of measured widths along the length and Wm is the average microgroove width. Lower values of linearity are preferred and it signifies the uniform microgroove.
Shape accuracy and surface finish of the machined microgrooves were measured by “Talysurf CCI Non-Contact Surface Profiler System,” and the analyses of the measured data were performed using the “TalyMap application” software. Microscopic images and optical profiles of machined microgrooves were analyzed for measurements of accuracy.
Results and discussions
For effective utilization and industrial applicability of EMM, the process parameter settings must be known while fabricating need-based structure to increase production rate, minimize wastage of material, and for quality production. In EMM, machining accuracy and surface finish vary according to the process parameters. Hence, microgrooves were fabricated on stainless steel by varying one parameter at a time and their influences over machining accuracy and surface finish were investigated.
Influence of applied voltage on machining accuracy and surface finish
To explore the correlation between applied voltage and the machining accuracy, that is, WOC, LOC, and DOC, MRR, linearity, depth profile, and surface finish, microgrooves were machined by applied voltage in the range of 2.6–3.8 V, pulse frequency of 4 MHz, 35% duty ratio, 0.15 M H2SO4 as an electrolyte, and microtool scanning speed of 93.75 μm/s.
Figure 4(a) plots the variations in machining accuracy, that is, WOC, LOC, and DOC of microgroove with respect to applied voltages. From the figure, it can be seen that different overcuts of the microgroove increase with increase in applied voltage. This can be explained by localization of electrochemical reactions during microgroove fabrication. Increase in applied voltage increases machining current density, hence machining localization becomes poor and material is dissolved from the wider area resulting in increased machining gaps, that is, WOC, LOC, and DOC. From the figure, it is also seen that DOC of microgroove increases with applied voltage up to 3.4 V and afterward it decreases gradually. This is because of the increased number of hydrogen gas bubbles generated at IEG with increase in applied voltage. Entrapped gas bubbles between microtool tip and workpiece at narrow IEG affects the dissolution process, resulting in reduced depth of microgroove.
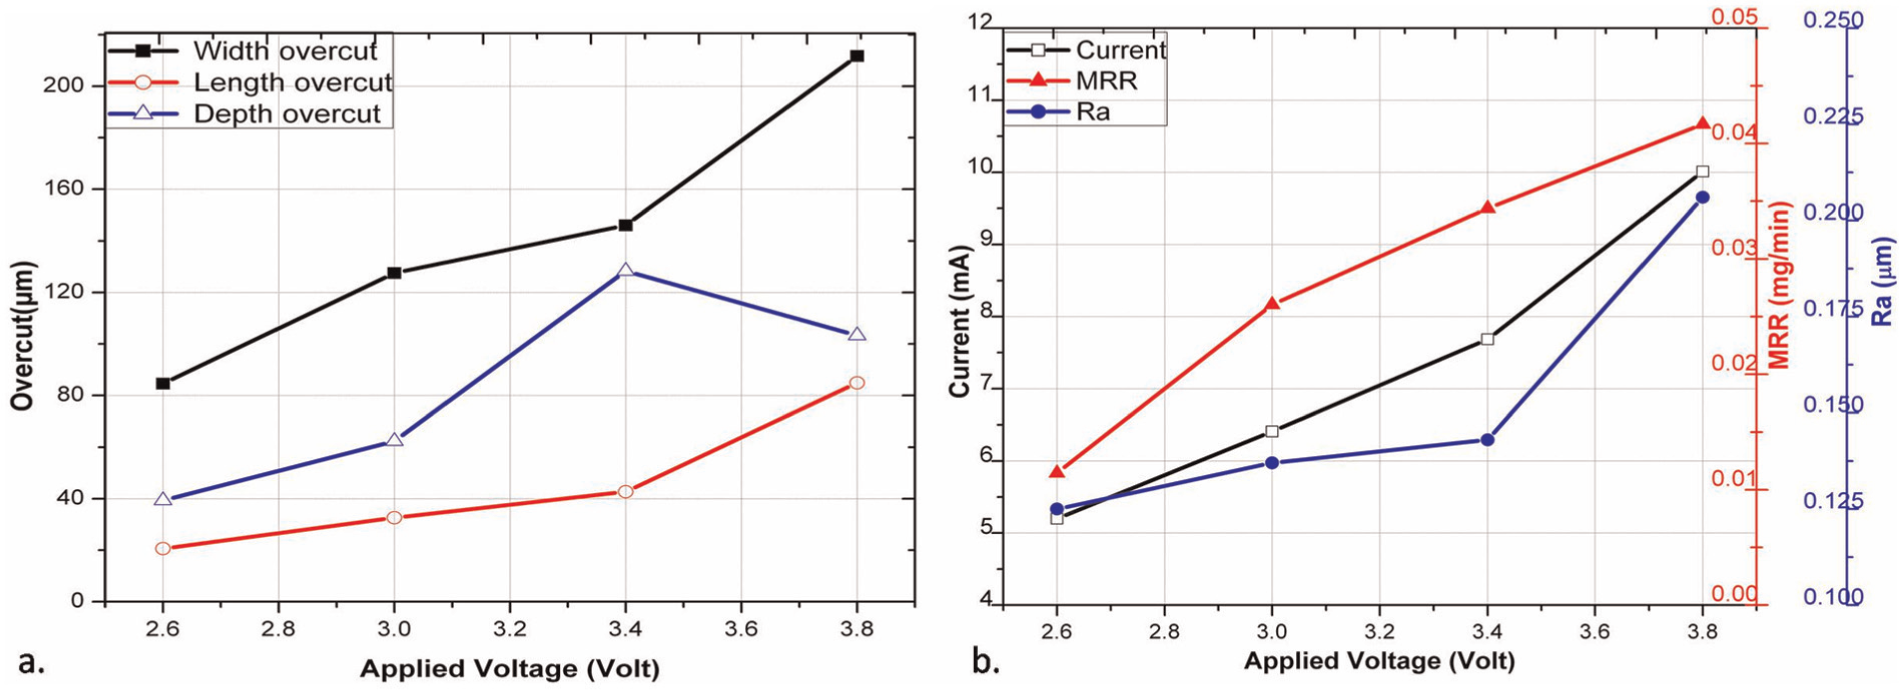
Variations in (a) overcut and (b) machining current, MRR, and Ra of microgrooves machined at different applied voltages, with 4 MHz pulse frequency, 35% duty ratio, 0.15 M H2SO4, and scanning speed of 93.75 μm/s.
Variations in machining current, MRR, and surface roughness at the bottom of the microgrooves at different applied voltages are graphically represented in Figure 4(b). From the graph, it can be seen that with increase in applied voltage, there is increase in machining current, MRR, and surface roughness. This is because with increase in applied voltage, machining current increases, which increases the current density, which in turn increases MRR. Increased MRR with increase in applied voltage diminishes the surface quality of microgroove generating comparatively rough surface, which can be seen from the roughness profiles in Figure 5(c). Figure 5(a)–(c) shows the microscopic image of microgrooves machined with various applied voltages, surface qualities, and roughness profiles at the bottom of corresponding microgrooves, respectively. From the figure, it can be clearly seen that WOC, LOC, and surface roughness at the bottom of the microgroove increase with increase in applied voltage.
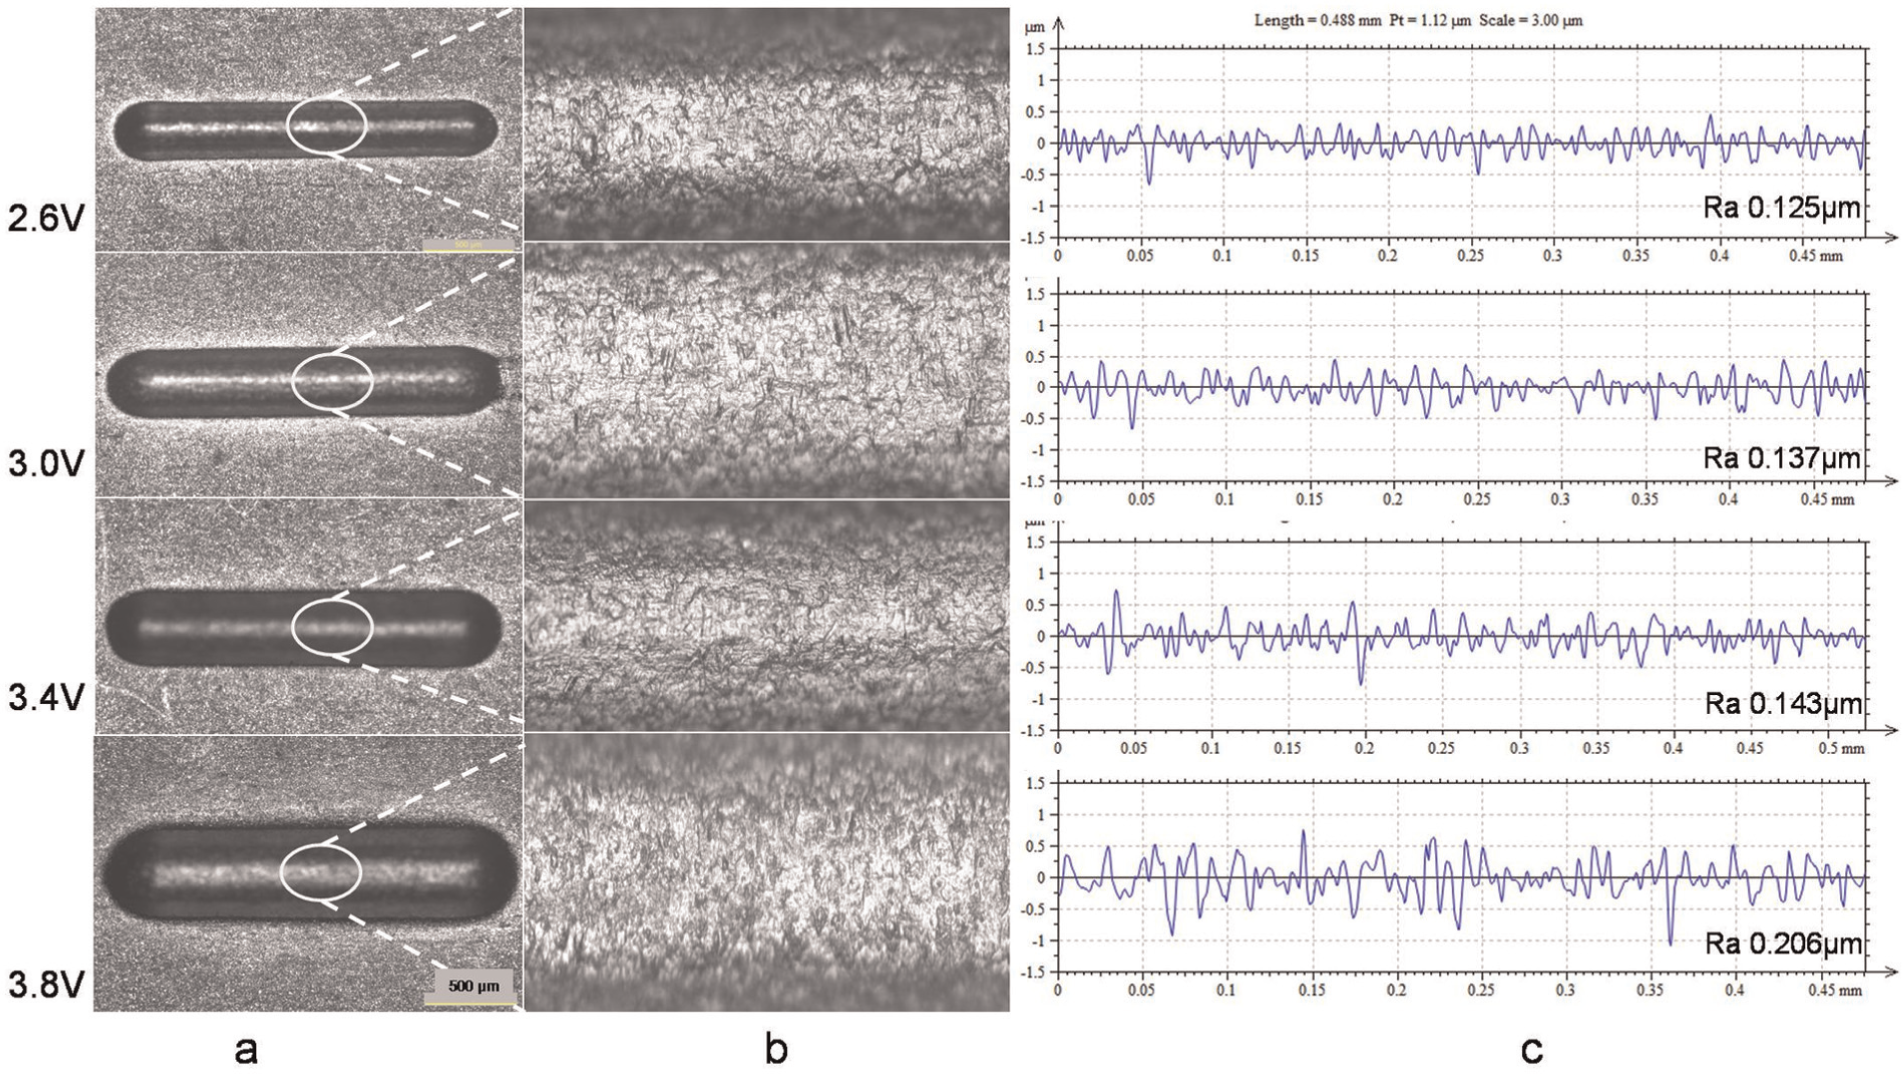
(a) Microgrooves machined at different voltages, with 4 MHz pulse frequency, 35% duty ratio, 0.15 M H2SO4, and scanning speed of 93.75 μm/s; (b) surface quality; and (c) roughness profiles at the bottom.
3D optical images for middle segment of the microgrooves and depth profiles of corresponding microgrooves are shown in Figure 6(a) and (b), respectively. From depth profiles of the microgroove, it can be seen that radius of curvature at the bottom of microgroove, microgroove width, depth, and taper angle along the sides of microgroove increases with increase in applied voltage because of the increased current density at increased applied voltage. From the figure, it is also seen that microgroove width and depth increase with increase in applied voltage up to 3.4 V, with further increase in applied voltage, that is, at 3.8 V there is increase in width but depth of microgroove decreases as compared to depth at 3.4 V. This is because of the increased number of the hydrogen gas bubbles at higher applied voltage, which gets entrapped in between microtool tip and workpiece surface at IEG after achieving some depth of the microgroove. Hence, width is higher at top face and it reduces with depth after sometime of machining.
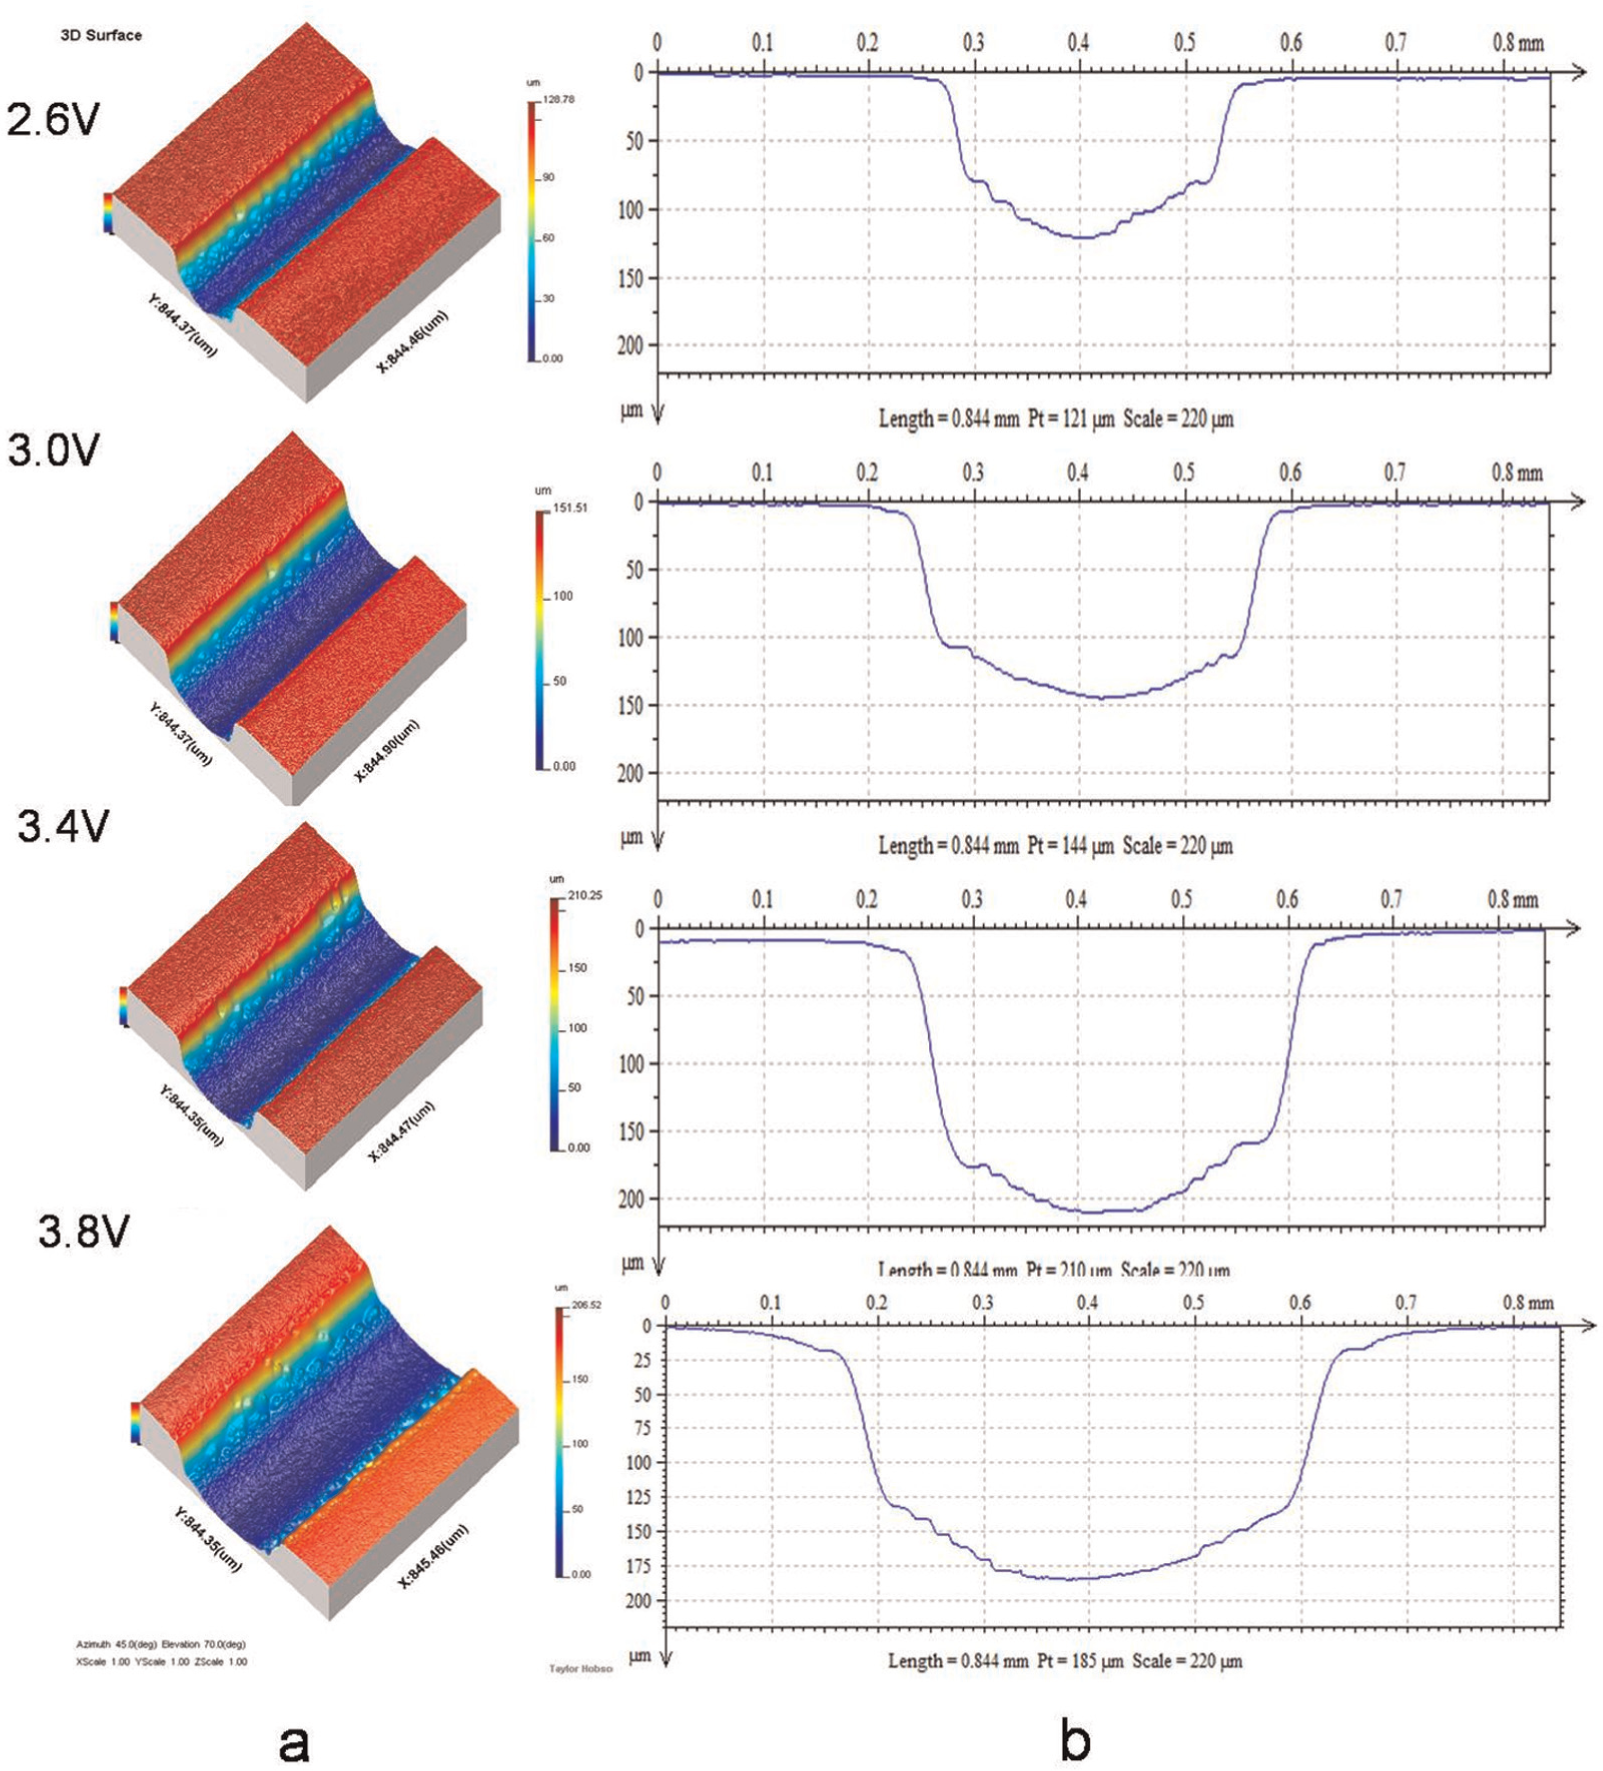
(a) Three-dimensional optical images and (b) depth profile of microgrooves machined at varied applied voltages with 4 MHz pulse frequency, 35% duty ratio, 0.15 M H2SO4, and scanning speed of 93.75 μm/s.
Figure 7 plots the variation in standard deviation (SD) of microgroove machined with different applied voltages. From the figure, it can be seen that linearity of microgroove improves with reduction in applied voltage. This is because of the improvement in machining localization at reduced applied voltage. For investigating the stability of the EMM process during fabrication of microgroove at different applied voltages, microgroove widths were measured at different locations along the length of microgroove and were plotted, as shown in Figure 8(a). Optical images for the variations in microgroove width along the length of a microgroove for middle segment of microgroove are shown in Figure 8(b). From both the figures, it can be clearly seen that average microgroove width and variations in microgroove width increase with increase in applied voltage. This is because of poor localization of machining process with increase in applied voltage. Hence, material dissolves from wider area, which in turn increases average microgroove width and variations in microgroove diminishing linearity, making it difficult to control the process with further increase in applied voltage.
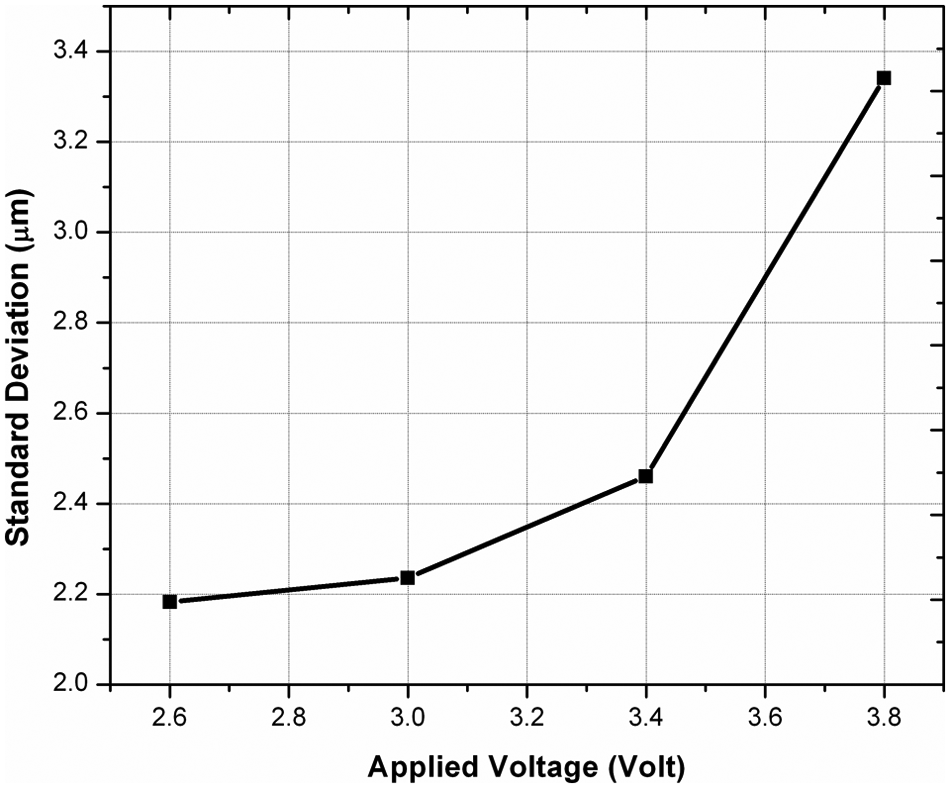
Variation in standard deviation of microgroove machined at varied applied voltages with 4 MHz pulse frequency, 35% duty ratio, 0.15 M H2SO4, and scanning speed of 93.75 μm/s.
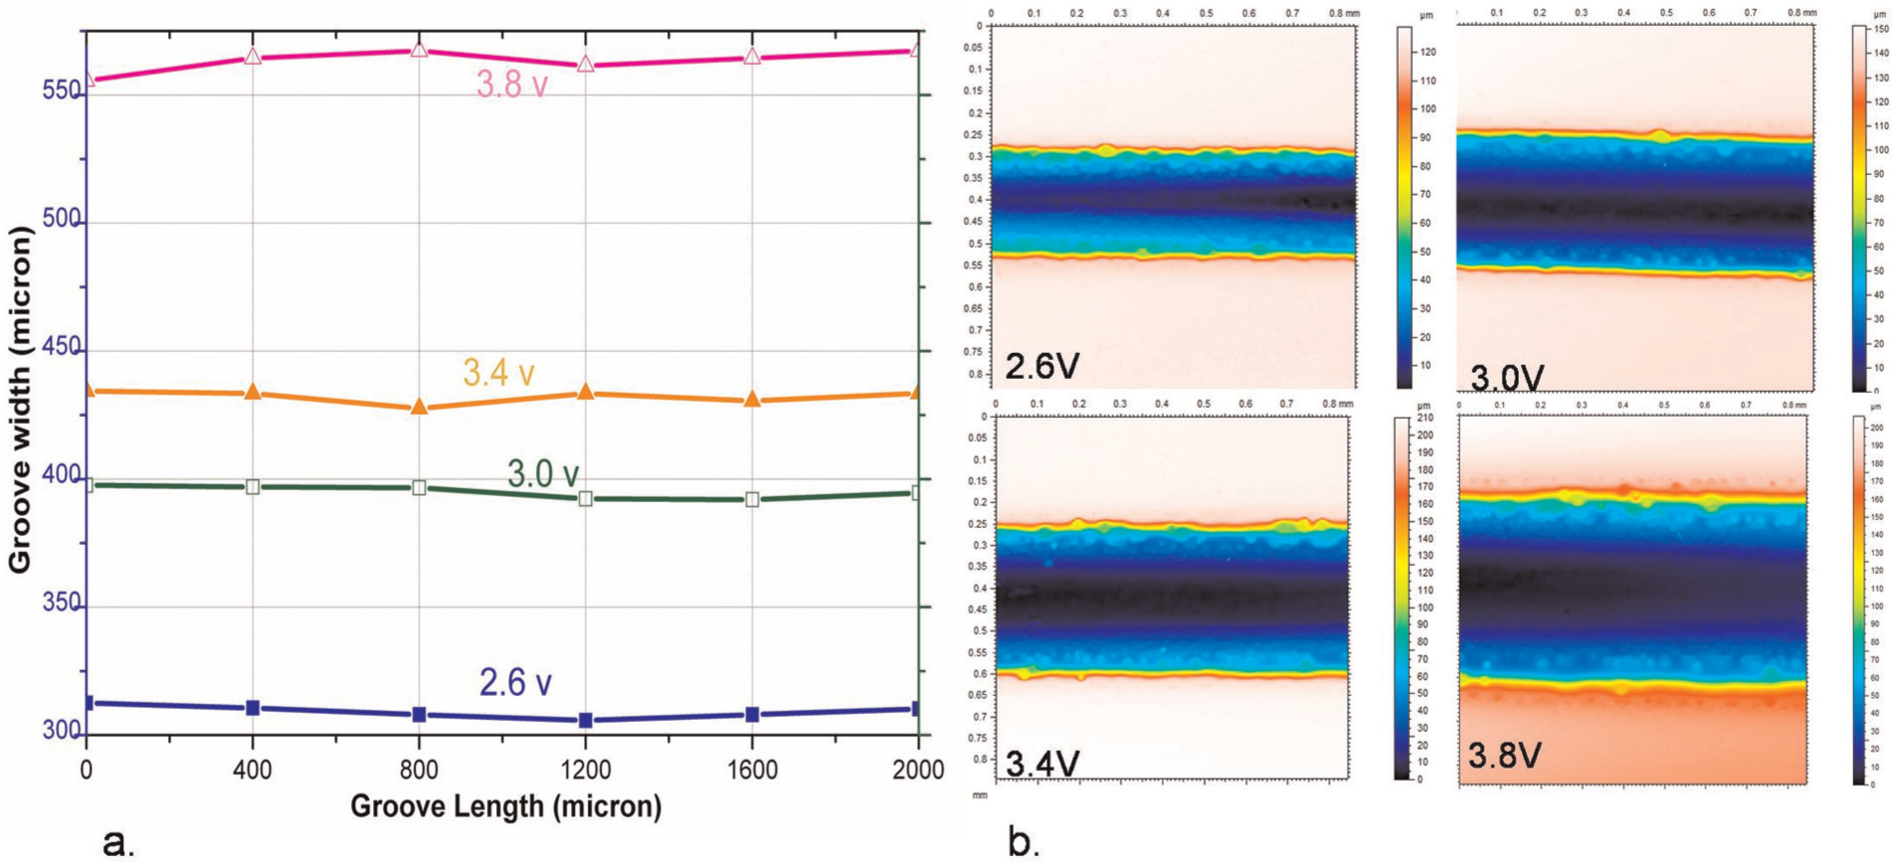
(a) Variations in microgroove widths along the length of microgroove, and (b) optical images showing width of a microgroove, machined at varied applied voltages with 4 MHz pulse frequency, 35% duty ratio, 0.15M H2SO4 and scanning speed 93.75μm/sec.
Therefore, for machining uniform and accurate microgrooves with minimum overcuts and better surface quality, machining with lower applied voltage is recommended. In the present experiment, machining below 2.6 V was not possible since MRR lagged with tool feed rate, generating micro sparking due to physical contact of microtool with workpiece surface. Hence, for the fabrication of precise microgroove, applied voltage of 2.6 V was considered for further part of experimentation.
Influence of pulse frequency on machining accuracy and surface finish
Pulse frequency is one of the important process parameter in EMM. Therefore, to investigate the influence of pulse frequency over the machining accuracy, that is, WOC, LOC and DOC, MRR, linearity, depth profile, and surface quality of the microgroove, experiments were performed with varied pulse frequencies from 2 to 8 MHz in four steps, 35% duty ratio, applied voltage of 2.6 V, 0.15 M H2SO4 as an electrolyte, and with scanning speed of 93.75 μm/s. Figure 9(a) plots the influence of pulse frequencies over machining accuracy. From the figure, it can be seen that WOC, LOC, and DOC decrease with increase in pulse frequency. This outcome can be better explained by pulse period and the localization of electrochemical reactions. Pulse period is inversely proportional to the pulse frequency; hence, with increase in pulse frequency, pulse period decreases, that is, pulse on time decreases. Machining localization improves with reduced pulse on time, dissolving workpiece material from confined area around the microtool, which in turn improves the machining accuracy by generating reduced overcuts. Figure 9(b) represents the variations in machining current, MRR, and surface roughness, that is, Ra value, while fabricating microgrooves with different pulse frequencies. From the figure, it can be seen that machining current, MRR, and surface roughness decrease with increase in pulse frequency. This is because for a fixed duty ratio with increase in pulse frequency, pulse on time decreases, which in turn decreases average machining current and also improves the machining localization. Increased spatial confinement at shorter pulse on time and reduced current density finally reduce MRR with improvement in surface quality. Figure 10(a) shows the microscopic image of the microgrooves machined with different pulse frequencies and Figure 10(b) plots surface roughness profiles at the bottom of corresponding microgrooves. From the figure, reduction in WOC and LOC and improvement in surface quality at the bottom of the microgroove can be seen at higher pulse frequency because of improvement in machining localization.
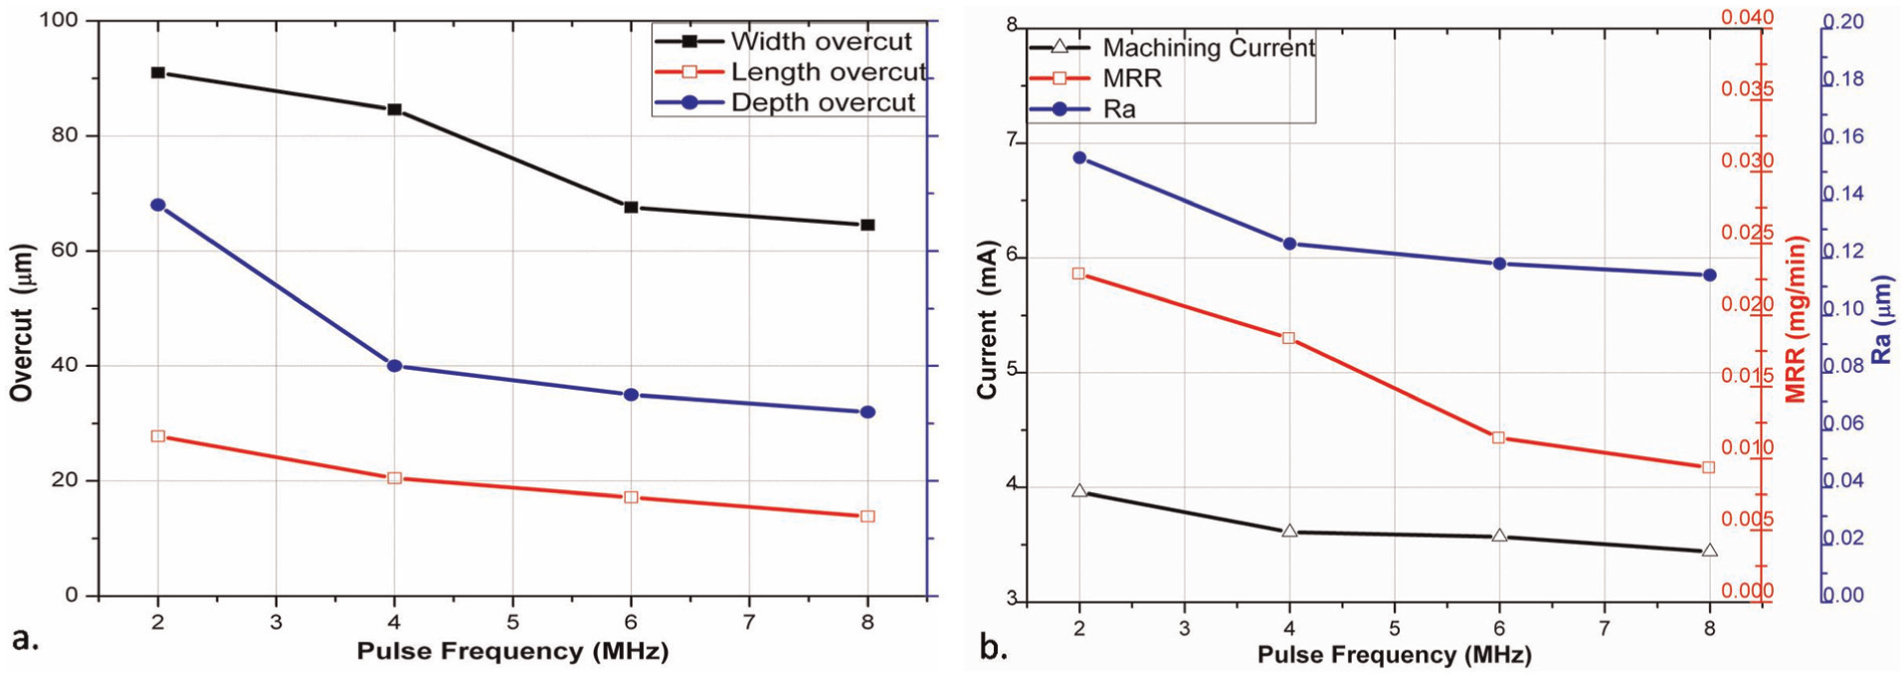
Variations in (a) overcuts and (b) machining current, MRR, and Ra of microgrooves machined at different pulse frequencies with 35% duty ratio, 2.6 V, 0.15 M H2SO4, and scanning speed of 93.75 μm/s.
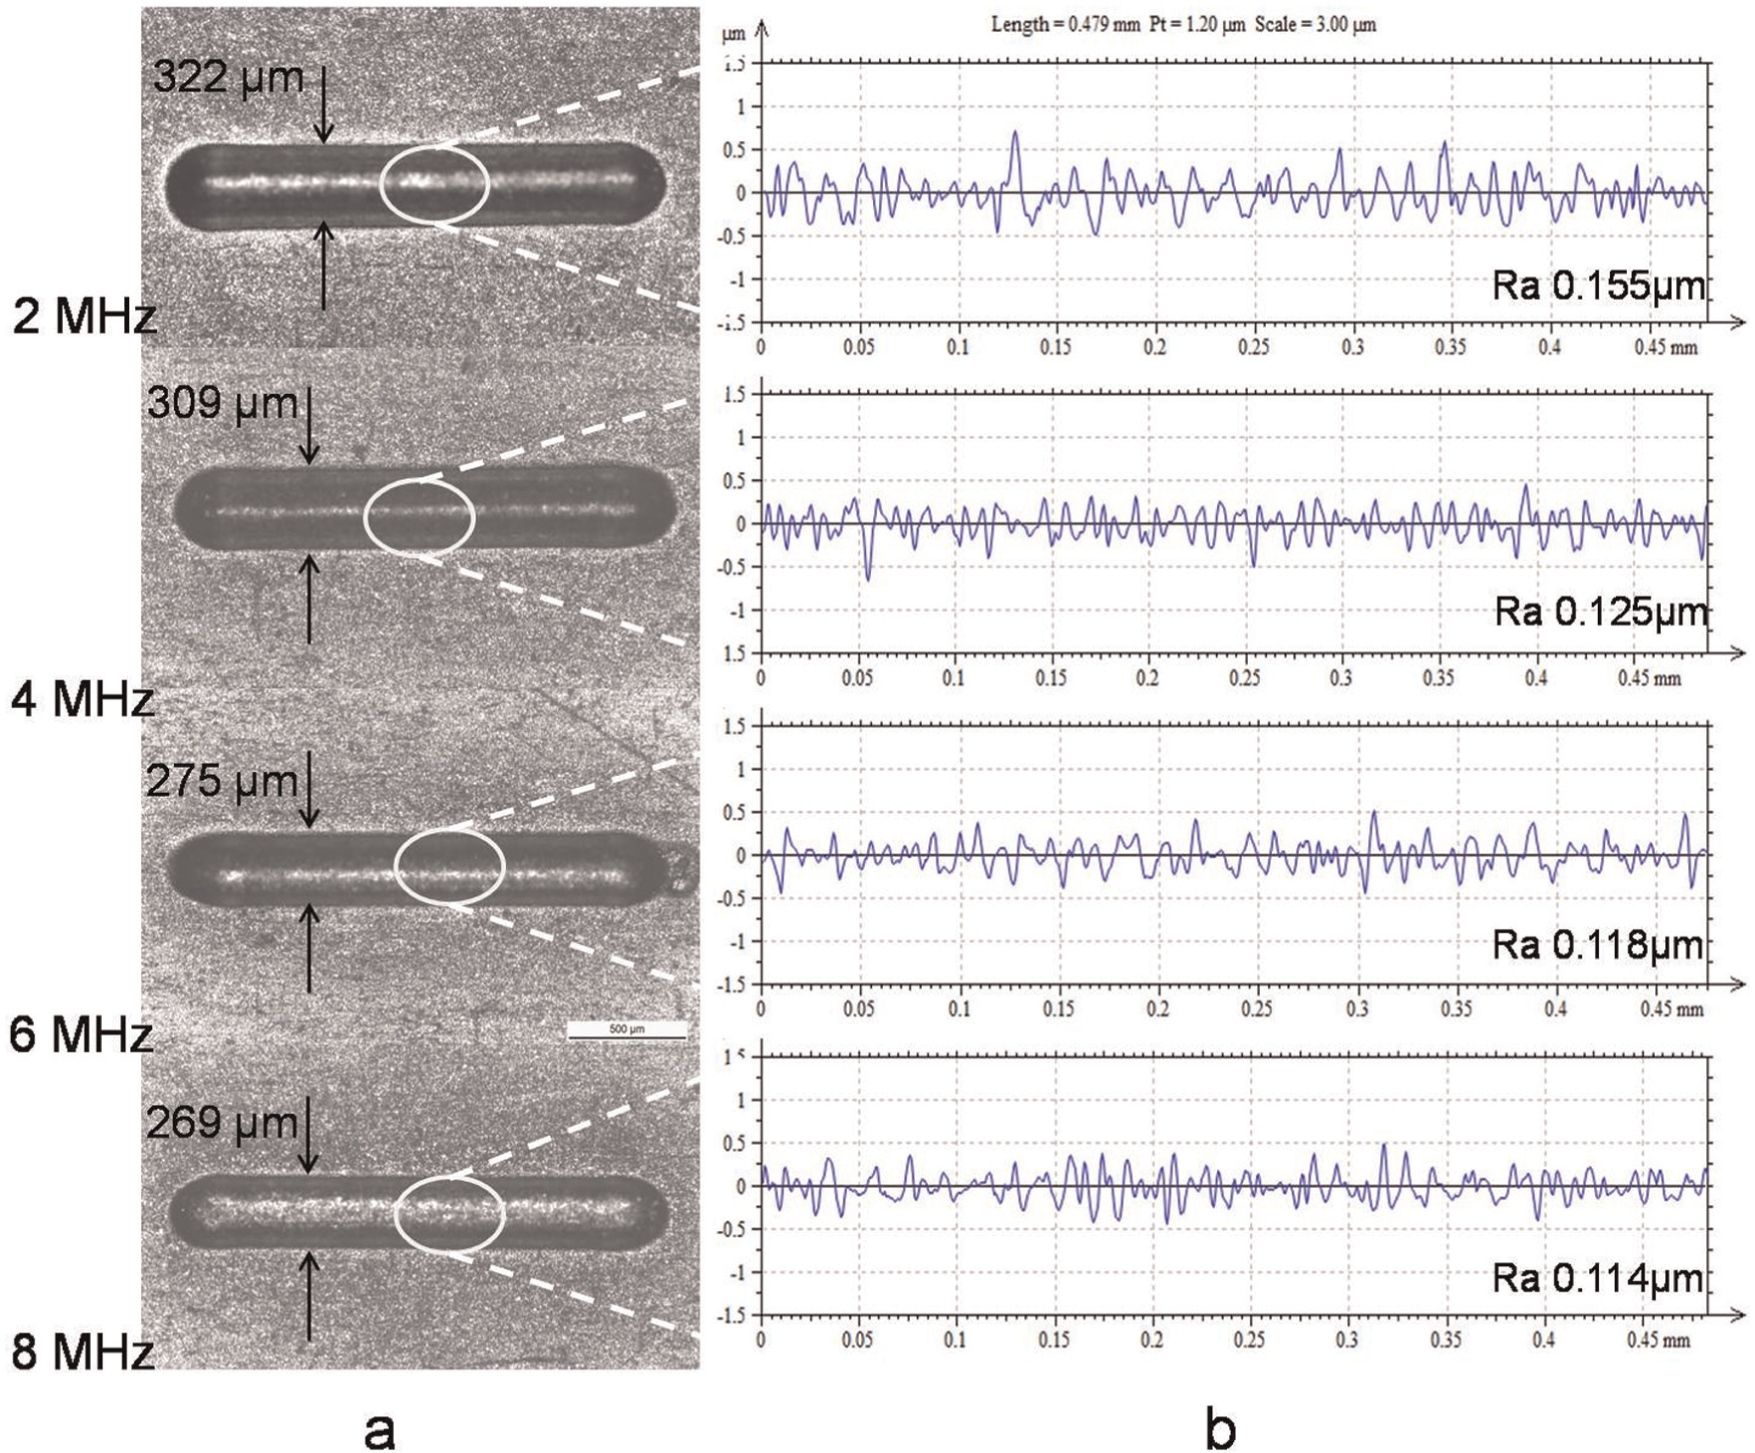
(a) Microgrooves machined at different pulse frequencies with 35% duty ratio, 2.6 V, 0.15 M H2SO4, and scanning speed of 93.75 μm/s. (b) Roughness profile at the bottom.
Figure 11 shows the depth profiles of the microgrooves machined at different pulse frequencies. Because of the improved localization of machining process and reduced current density, reduction in microgroove width and depth can be seen from the cross-sectional profiles of the microgroove. Also, the curvature at bottom portion of the microgroove improves to flat shape, making it near rectangular microgroove, with increase in applied frequency. Figure 12 plots the variation in SD of microgroove machined with different pulse frequencies. From the figure, it can be seen that linearity of microgroove improves with increase in pulse frequency. This is because of the improvement in machining localization at increased pulse frequency. Microgroove widths of machined microgrooves were measured at different locations along the length of microgroove and are plotted as shown in Figure 13(a), and optical image of the middle segment of microgroove depicting microgroove width and variations in microgroove widths along the length is shown in Figure 13(b). From both the figures, it can be confirmed that machining localization improves with increase in pulse frequency, which results in reduction in average microgroove width and variations in microgroove width.
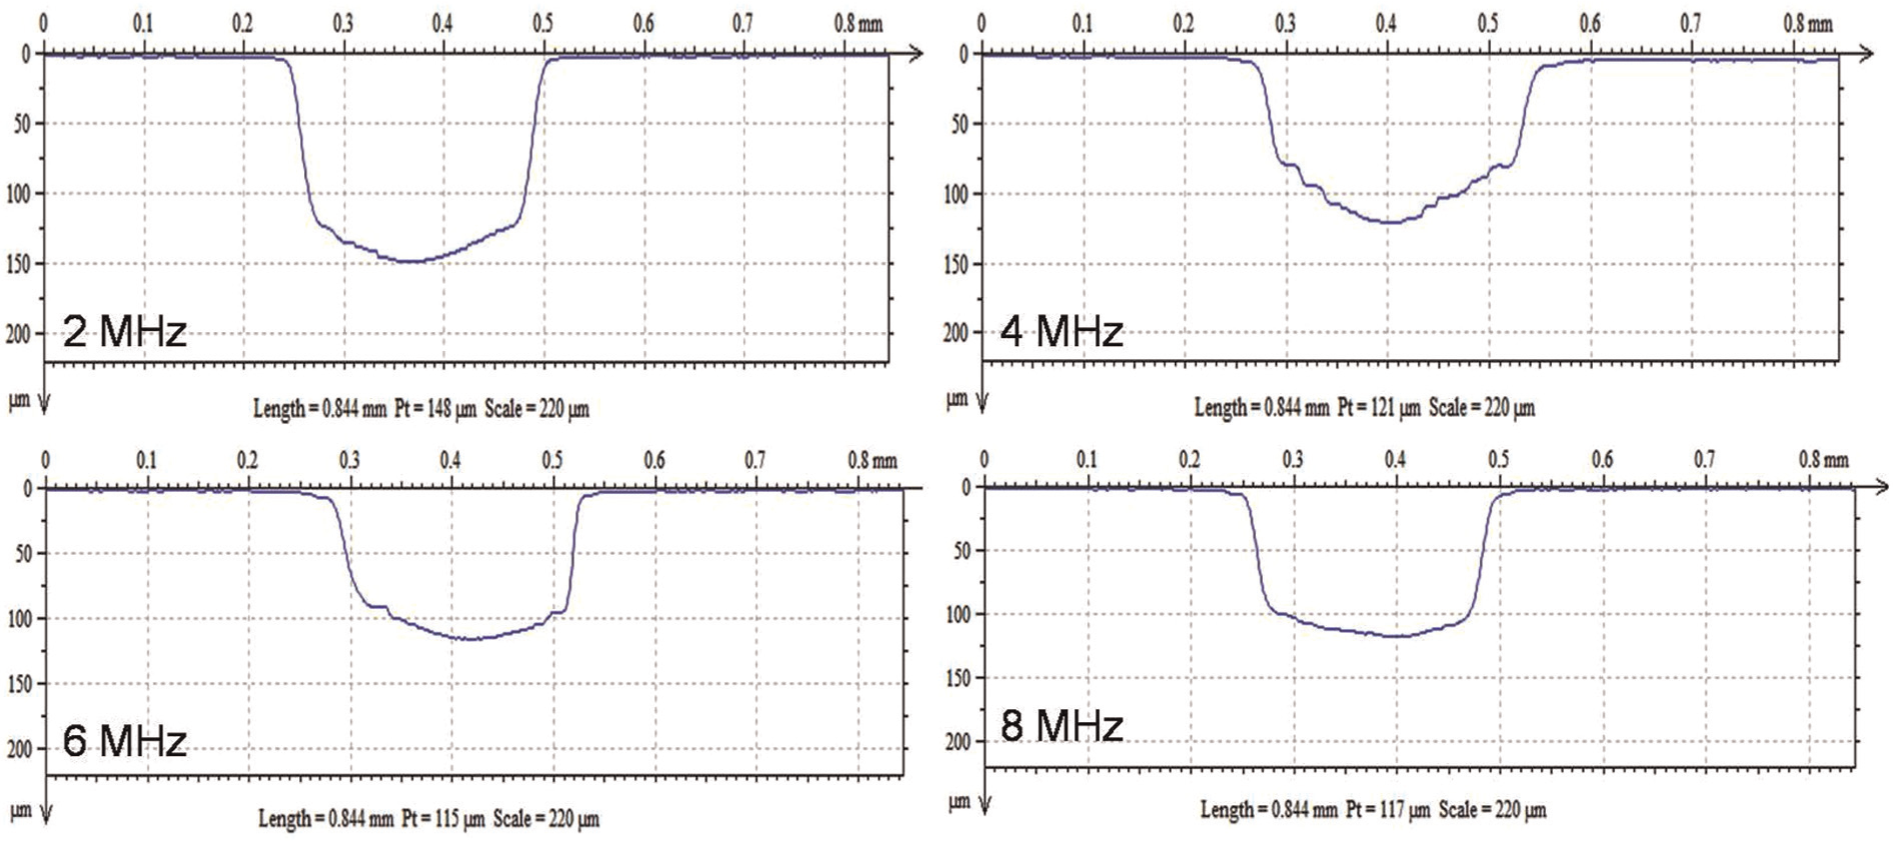
Depth profiles of microgroove machined at varied pulse frequencies with 35% duty ratio, 2.6 V, 0.15 M H2SO4, and scanning speed of 93.75 μm/s.
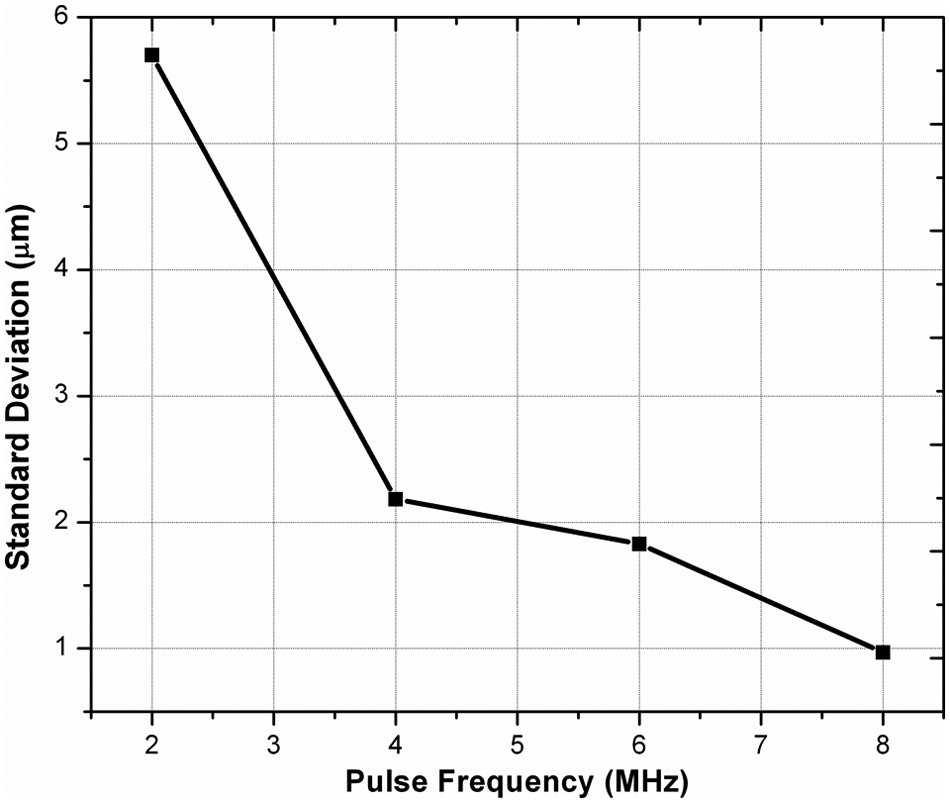
Variation in standard deviation of microgroove machined at varied pulse frequency and 35% duty ratio, 2.6 V, 0.15 M H2SO4, and scanning speed of 93.75 μm/s.
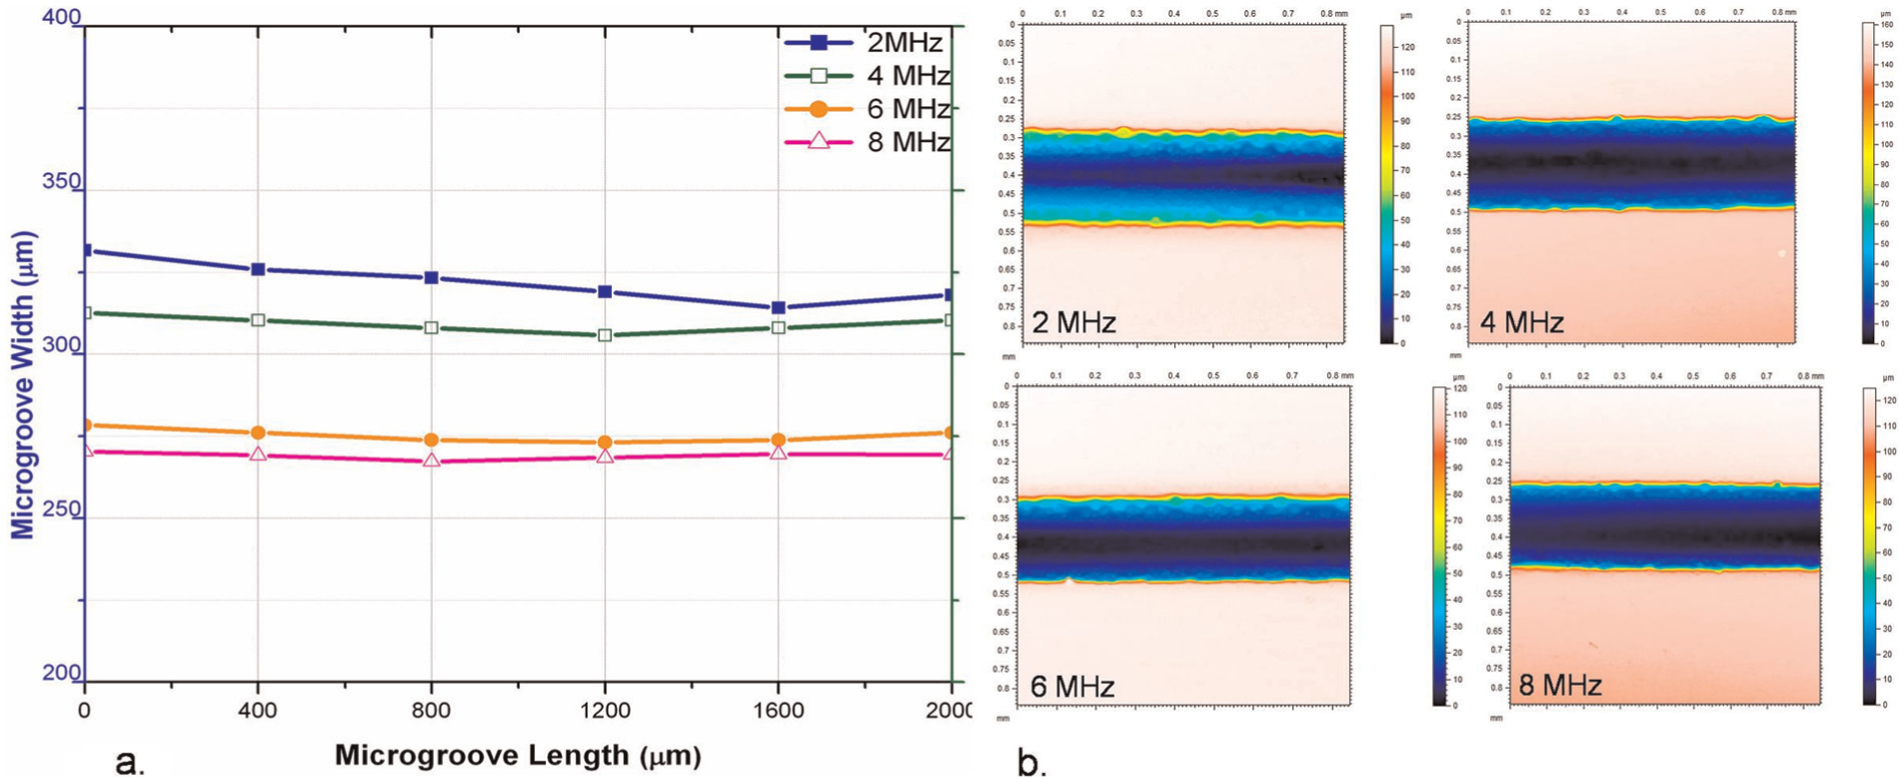
(a) Variations in microgroove widths along the length of microgroove, and (b) optical images showing width of a microgroove, machined at varied pulse frequency with 35% duty ratio, 2.6V, 0.15M H2SO4 and scanning speed 93.75μm/sec.
Therefore, for machining accurate rectangular microgrooves with minimum overcuts and good surface quality, machining with higher pulse frequency is suggested. However, machining above the pulse frequency of 8 MHz was not possible in the present experiment due to the fact that the pulse on time becomes very short and MRR lags microtool feed rate, which leads to sparking; hence, pulse frequency of 8 MHz was considered for further part of experimentation.
Influence of duty ratio on machining accuracy and surface finish
Duty ratio is the ratio of pulse on time to the pulse period and signifies the percentage of time for which pulse is on. In EMM, material dissolution takes place during pulse on time and sludge removal takes place during pulse off time; hence, it is essential to investigate the influence of varying duty ratios over the machining accuracy and surface finish of the microgroove. Experiments were performed by varying duty ratios from 30% to 45% with increment of 5%, pulse frequency of 8 MHz, applied voltage of 2.6 V, 0.15 M H2SO4 as an electrolyte, and microtool scanning speed of 93.75 μm/s.
Figure 14(a) shows the variations of machining accuracy in terms of overcut of the microgrooves machined with different duty ratios. Graphs in figure reveal that there is improvement in machining accuracy at lower duty ratio, since smaller pulse on time at lower duty ratio leads to spatial confinement of the electrochemical reactions, hence machining gap shrinks and the geometry gets more precise. Variations in machining current, MRR, and the surface roughness while fabricating microgrooves with varied duty ratios are plotted in Figure 14(b). From the figure, it can be seen that machining current, MRR, and the surface roughness increase with increase in duty ratio. This can be explained by pulse on time. Pulse on time increases with increase in duty ratio and increase in pulse on time means more machining time, hence machining current increases with increase in duty ratio. Also, machining localization becomes poor with increased pulse on time. Therefore, increased current density and reduced localization increase MRR diminishing machining accuracy and surface quality. From the figure, it can also be seen that MRR increases gradually up to 35% duty ratio, afterward a sharp increase in MRR up to 40% duty ratio, and it again increases gradually for further increase in duty ratio. This is because of increase in machining current with increase in duty ratio. After 40% of duty ratio, more number of hydrogen gas bubbles were generated at IEG and it affects the dissolution process resulting in gradual increase in MRR. Figure 15 shows the microscopic images, surface quality, and roughness profiles of the microgrooves machined with different duty ratios. Because of the poor machining localization at increased duty ratio, increase in width of microgroove and surface roughness at the bottom of microgroove can be clearly seen from the figure.
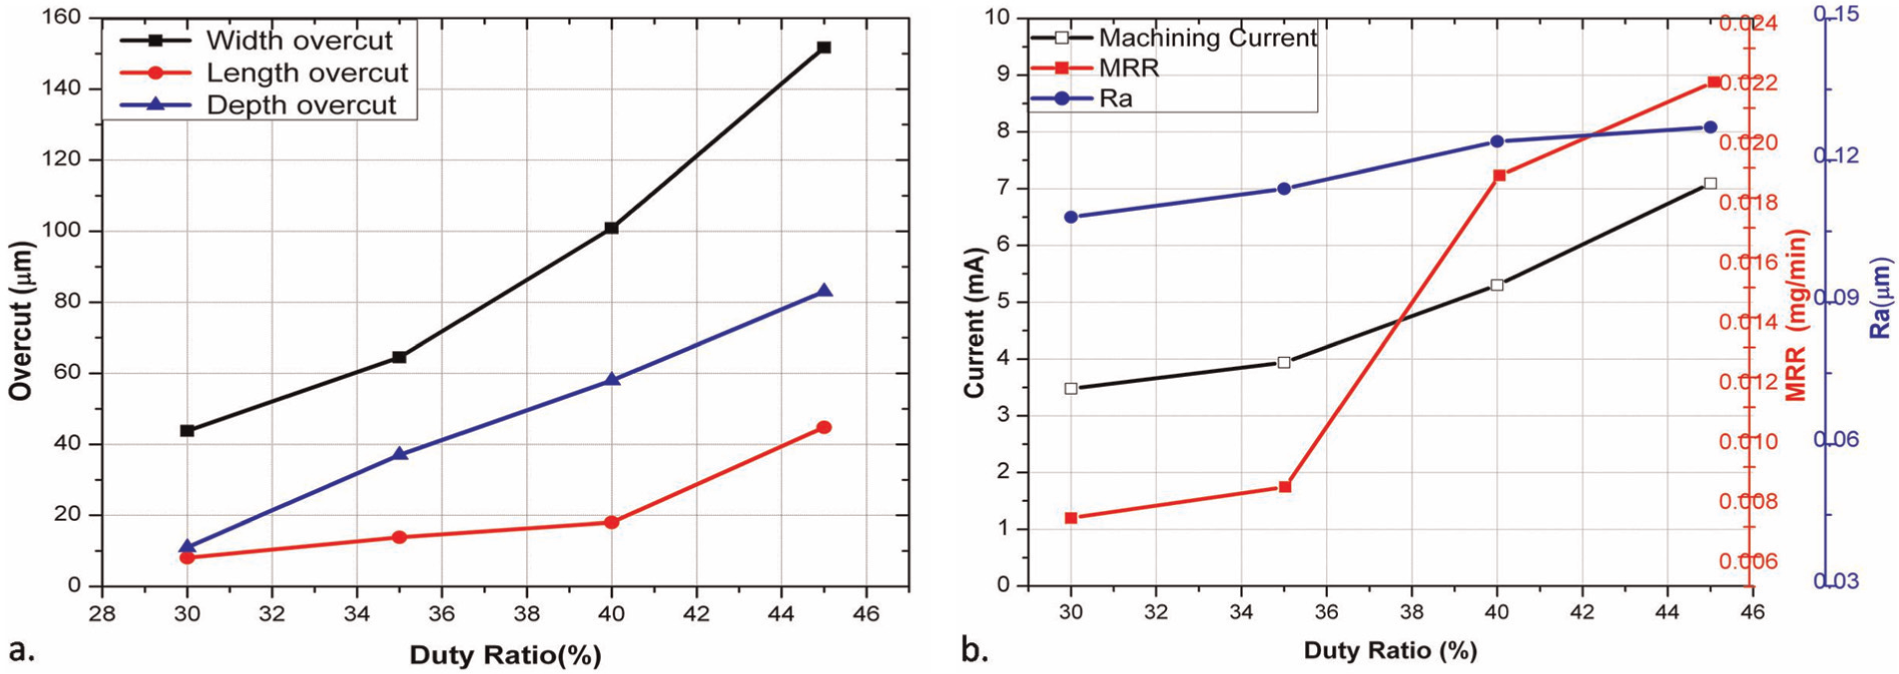
Variation in (a) overcuts and (b) machining current, MRR, and Ra of microgrooves machined at different duty ratios, with 2.6 V, 8 MHz pulse frequency, 0.15 M H2SO4, and scanning speed of 93.75 μm/s.
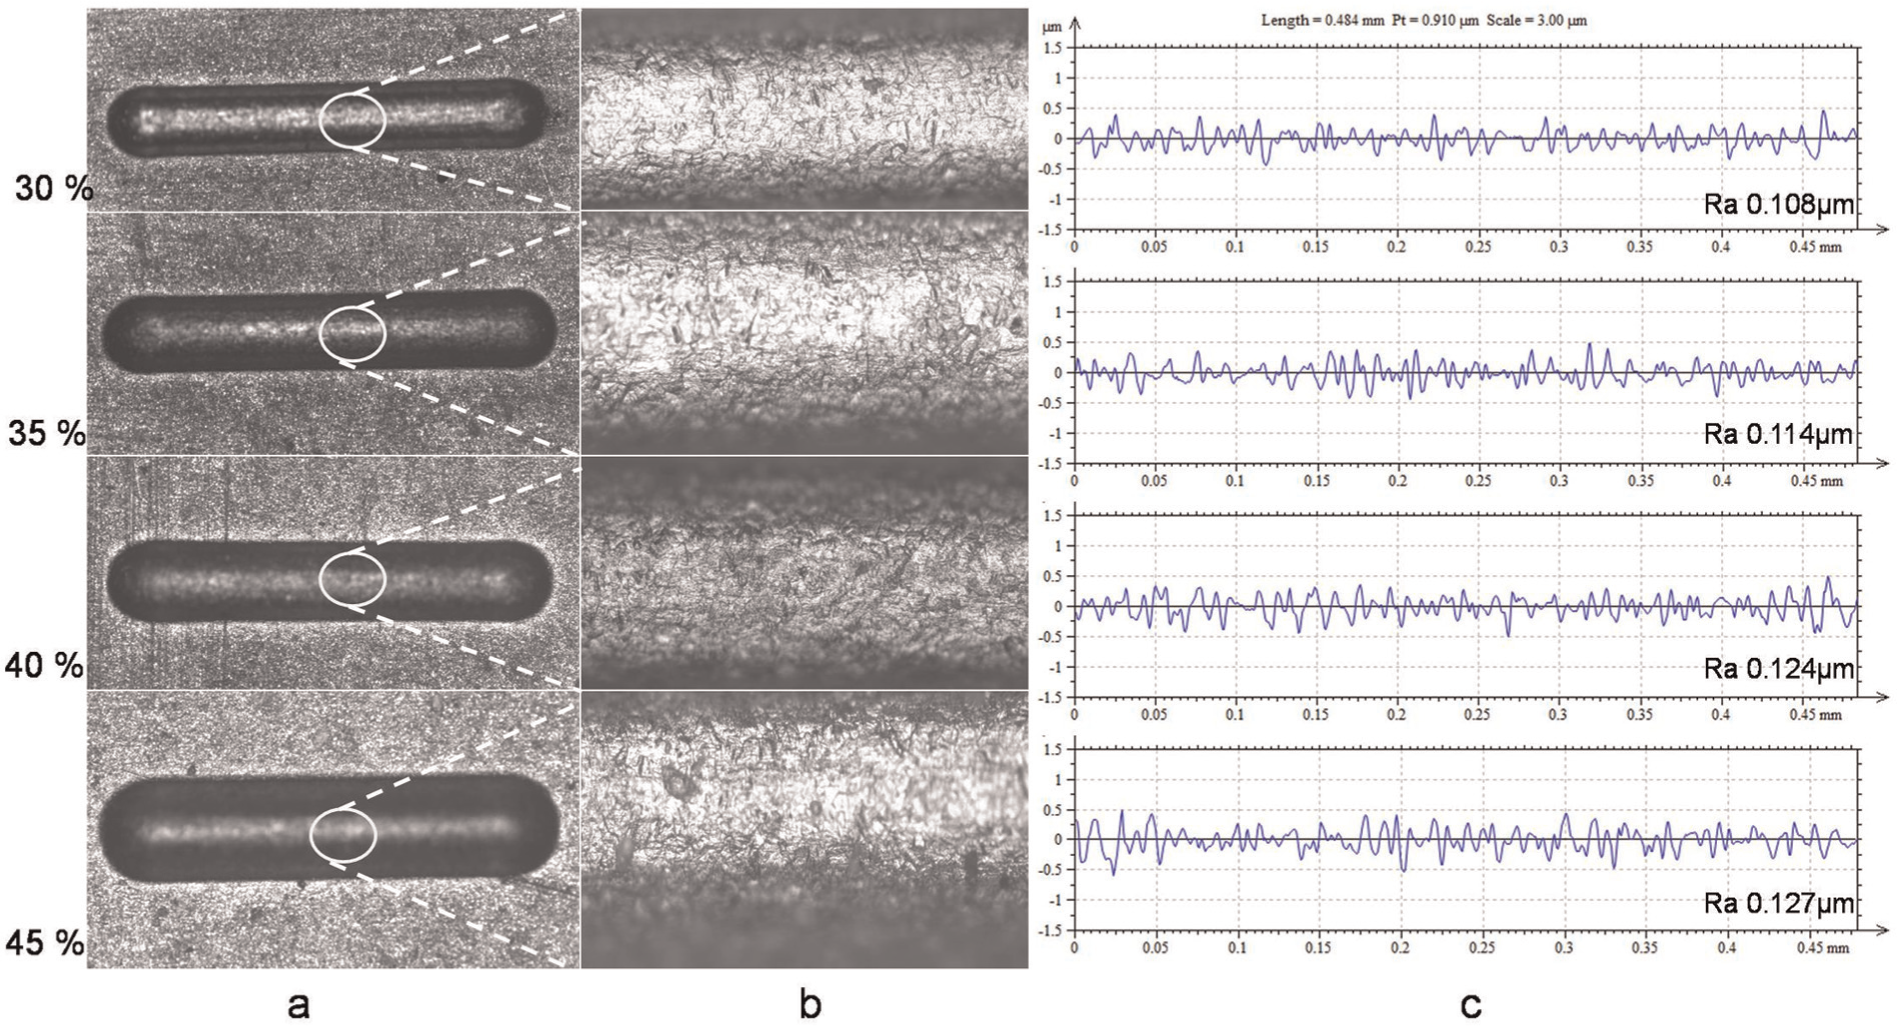
(a) Microgrooves machined at different duty ratios with 2.6 V, 8 MHz pulse frequency, 0.15 M H2SO4, and scanning speed of 93.75 μm/s; (b) surface quality; and (c) roughness profiles, at the bottom.
Figure 16 shows the depth profiles of the microgrooves machined with varied duty ratios. Reduction in width, depth, and taper angle along the sidewalls of the microgroove with reduction in duty ratio can be seen from the depth profile of the microgroove. Also, the bottom side of the microgroove achieves near flat shape with decrease in duty ratio, because of the reduced current density and improved machining localization. Figure 17 plots the variation in SD of microgroove machined with different duty ratios. From the figure, it can be seen that linearity of microgroove improves with decrease in duty ratio. This is because of the improvement in machining localization at decreased duty ratio. For investigating the stability of machining process, microgroove widths were measured at different locations along the length of microgroove and were plotted, as shown in Figure 18(a). Figure 18(b) shows optical image of a segment of microgroove, depicting microgroove widths and variations in microgroove width along the length. From the figures, it can be seen that the average microgroove width and variations in microgroove width decrease at lower duty ratios. This is because of the improved machining localization, which leads to material dissolution from very confined space around the microtool and reduced average current density at shorter pulse on time.
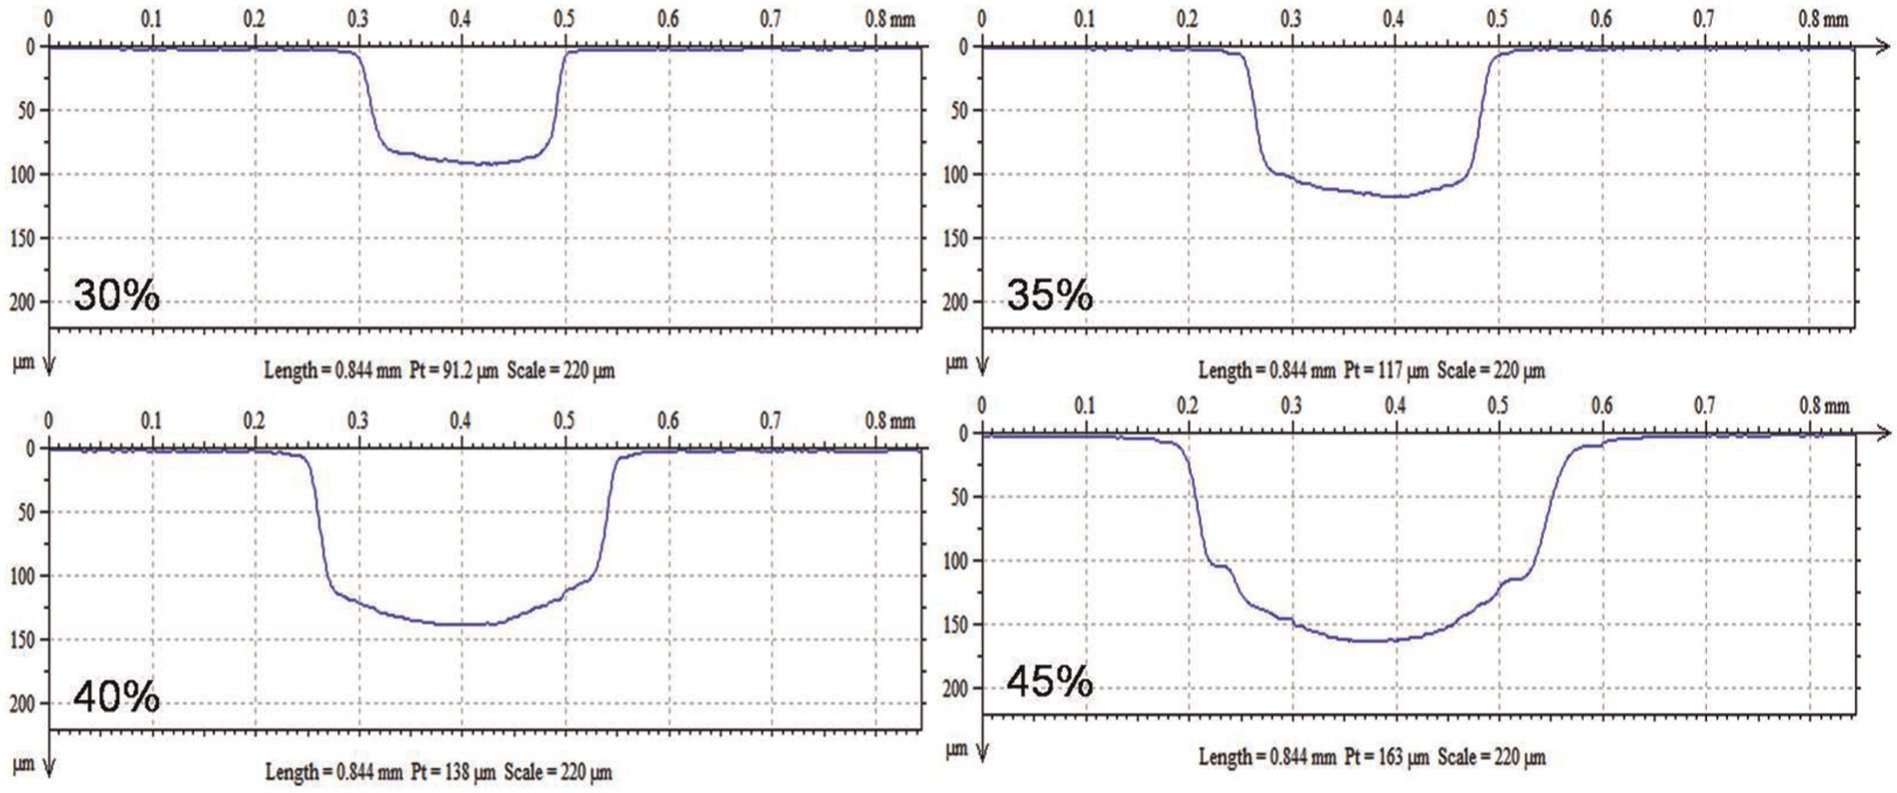
Depth profiles of microgroove machined at varied duty ratios with 2.6 V, 8 MHz pulse frequency, 0.15 M H2SO4, and scanning speed of 93.75 μm/s.
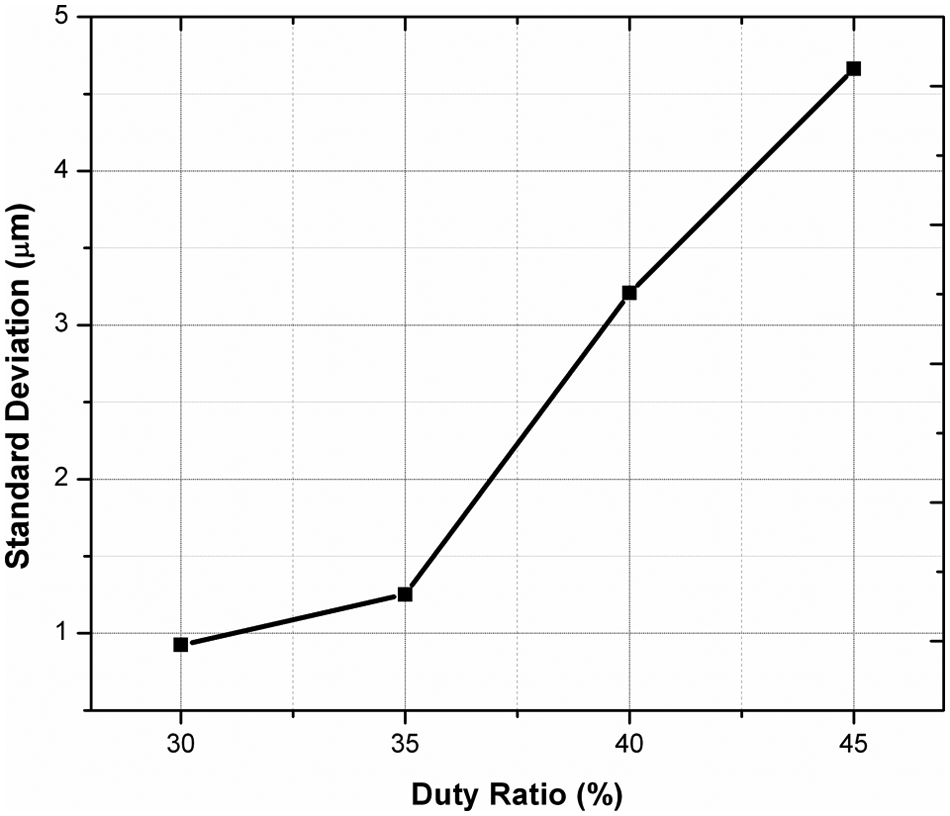
Variation in standard deviation of microgroove machined at varied duty ratio with 2.6 V, 8 MHz pulse frequency, 0.15 M H2SO4, and scanning speed of 93.75 μm/s.
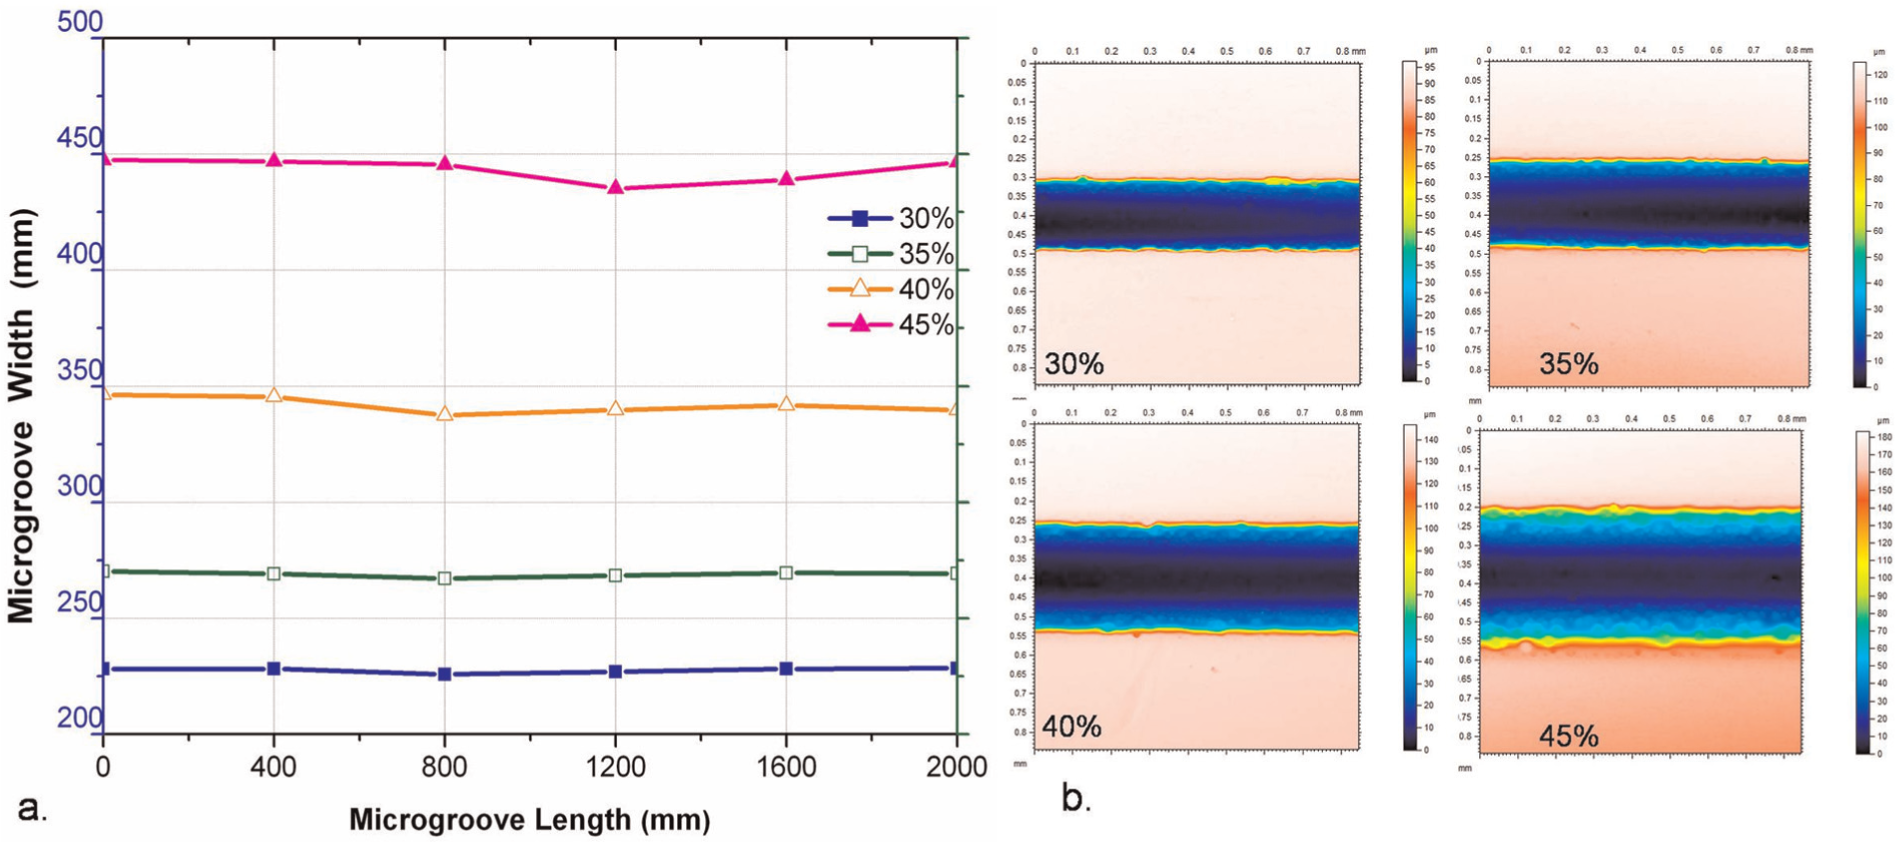
(a) Variations in microgroove widths along the length of microgroove, and (b) optical images showing width of a microgroove, machined at varied duty ratio with 2.6V, 8 MHz pulse frequency, 0.15M H2SO4 and scanning speed 93.75μm/sec.
Hence, for machining precise microgrooves with minimum overcut, uniform in width, and having good surface quality, machining with lower duty ratio is recommended. However, machining below 30% duty ratio was not possible in the present experiment due to the fact that the pulse on time is very short for enough material dissolution and MRR lags tool feed rate, which leads to physical contact of microtool with workpiece surface. Hence, for fabrication of accurate microgrooves, duty ratio of 30% was considered for further part of experimentation.
Influence of electrolyte concentration on machining accuracy and surface finish
Electrolyte concentration is one of the important process parameter to be considered in EMM since it does not only complete the electric circuit but also carry out the by-products from IEG, permitting further continuation of the machining process. For investigating the influence of electrolyte concentration over machining responses, microgrooves were machined by varying the sulfuric acid concentrations in the range of 0.15–0.30 M in four steps, with applied voltage of 2.6 V, pulse frequency of 8 MHz, 30% duty ratio, and the scanning speed of 93.75 μm/s. Figure 19(a) plots the variations in machining accuracy in terms of overcut of the microgrooves machined with different electrolyte concentrations. From graph, it can be seen that increase in electrolyte concentration leads to increased overcut. This can be explained by increased electrical conductivity of electrolyte and reduced machining localization at higher electrolyte concentration. In electrolyte cell, ions are responsible for electrical conductivity. The number of ions available for electrochemical reaction in aqueous solution increases with increase in electrolyte concentration and leads to increase in electrical conductivity. Current density increases with increase in electrical conductivity reducing machining localization, which in turn diminishes machining accuracy. From the graph, it can also be seen that overcuts increase with increase in electrolyte concentration up to 0.25 M and afterward decreases gradually. This is because of the increased number of hydrogen gas bubbles generated at front end of the microtool at higher electrolyte concentration, which affects the electrochemical reaction resulting in reduced WOC, LOC, and DOC.
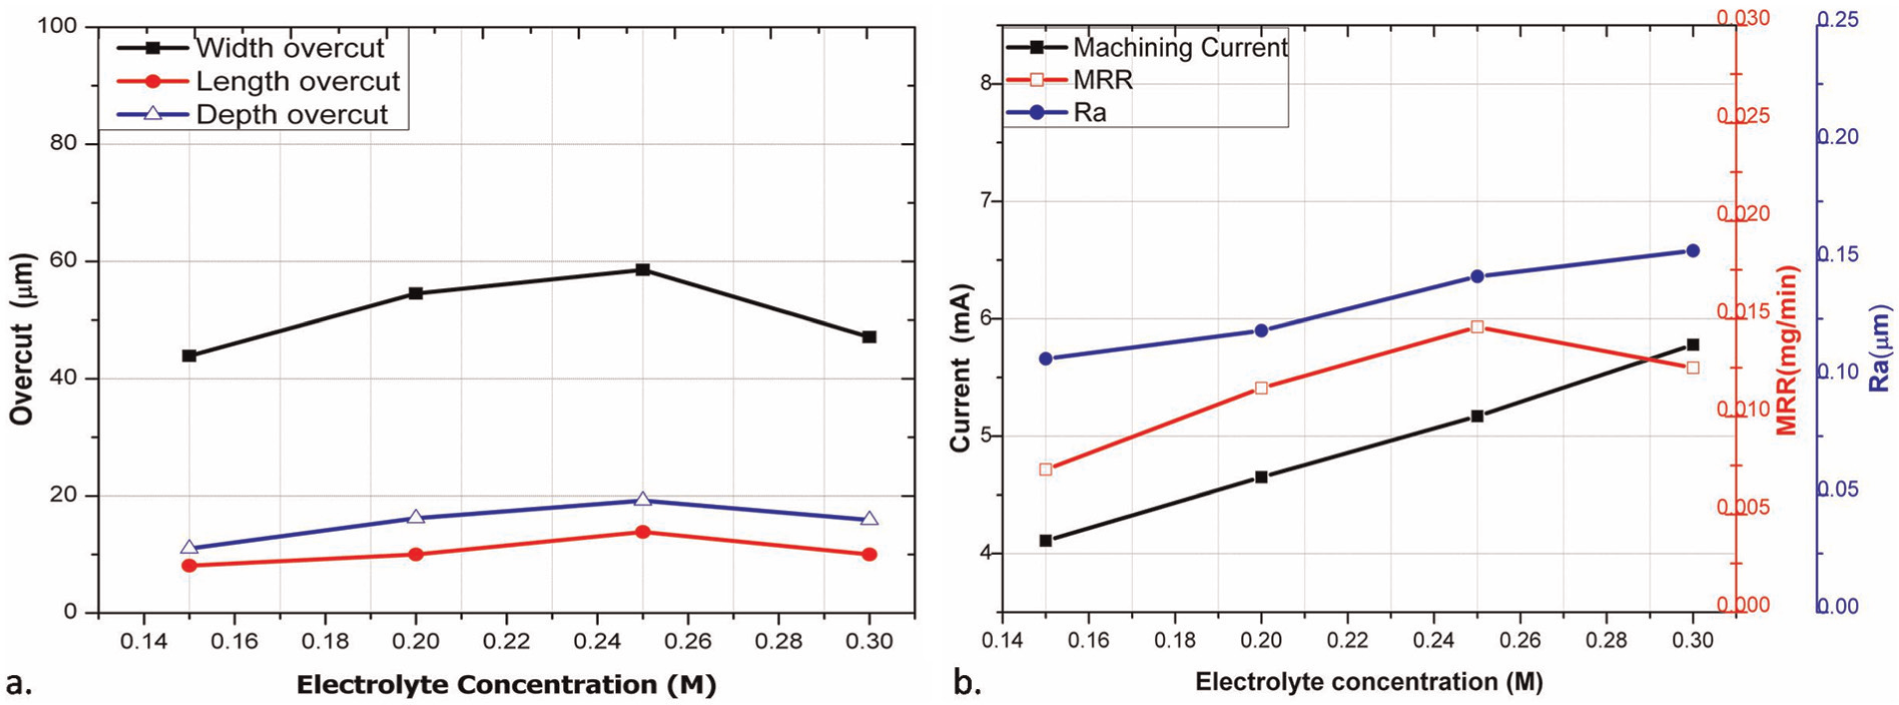
Variation in (a) overcuts and (b) machining current, MRR, and Ra of microgrooves machined at different electrolyte concentrations with 2.6 V, 8 MHz pulse frequency, 30% duty ratio, and scanning speed of 93.75 μm/s.
Machining current, MRR, and surface roughness, that is, Ra value obtained at different electrolyte concentrations while fabricating microgrooves, are plotted in Figure 19(b). From the graph, it can be observed that machining current, MRR, and Ra value increase with increase in concentration. This is because of the increased electrolyte conductivity with increase in electrolyte concentration, which ultimately increases machining current. Finally, increased current density and reduced machining localization increase MRR at increased electrolyte concentration. Higher MRR at increased current density leads to the generation of comparatively rough surface at increased concentration, as can be seen from the surface roughness profiles, as shown in Figure 20(b). From the graph, it is also seen that MRR increases with increase in electrolyte concentration up to 0.25 M and afterward, it decreases gradually. This is because of the increased number of hydrogen gas bubbles generated at front end of the microtool with increased electrolyte concentration. Increased number of gas bubbles at tiny IEG hinders the electrochemical reaction resulting in reduced MRR. Figure 20(a) and (b) shows microscopic images of microgrooves and roughness profiles at the bottom of the corresponding microgrooves machined with different electrolyte concentrations. From the figure, it can be seen that WOC and surface roughness at the bottom of microgroove increase with increase in electrolyte concentration due to increased machining current.
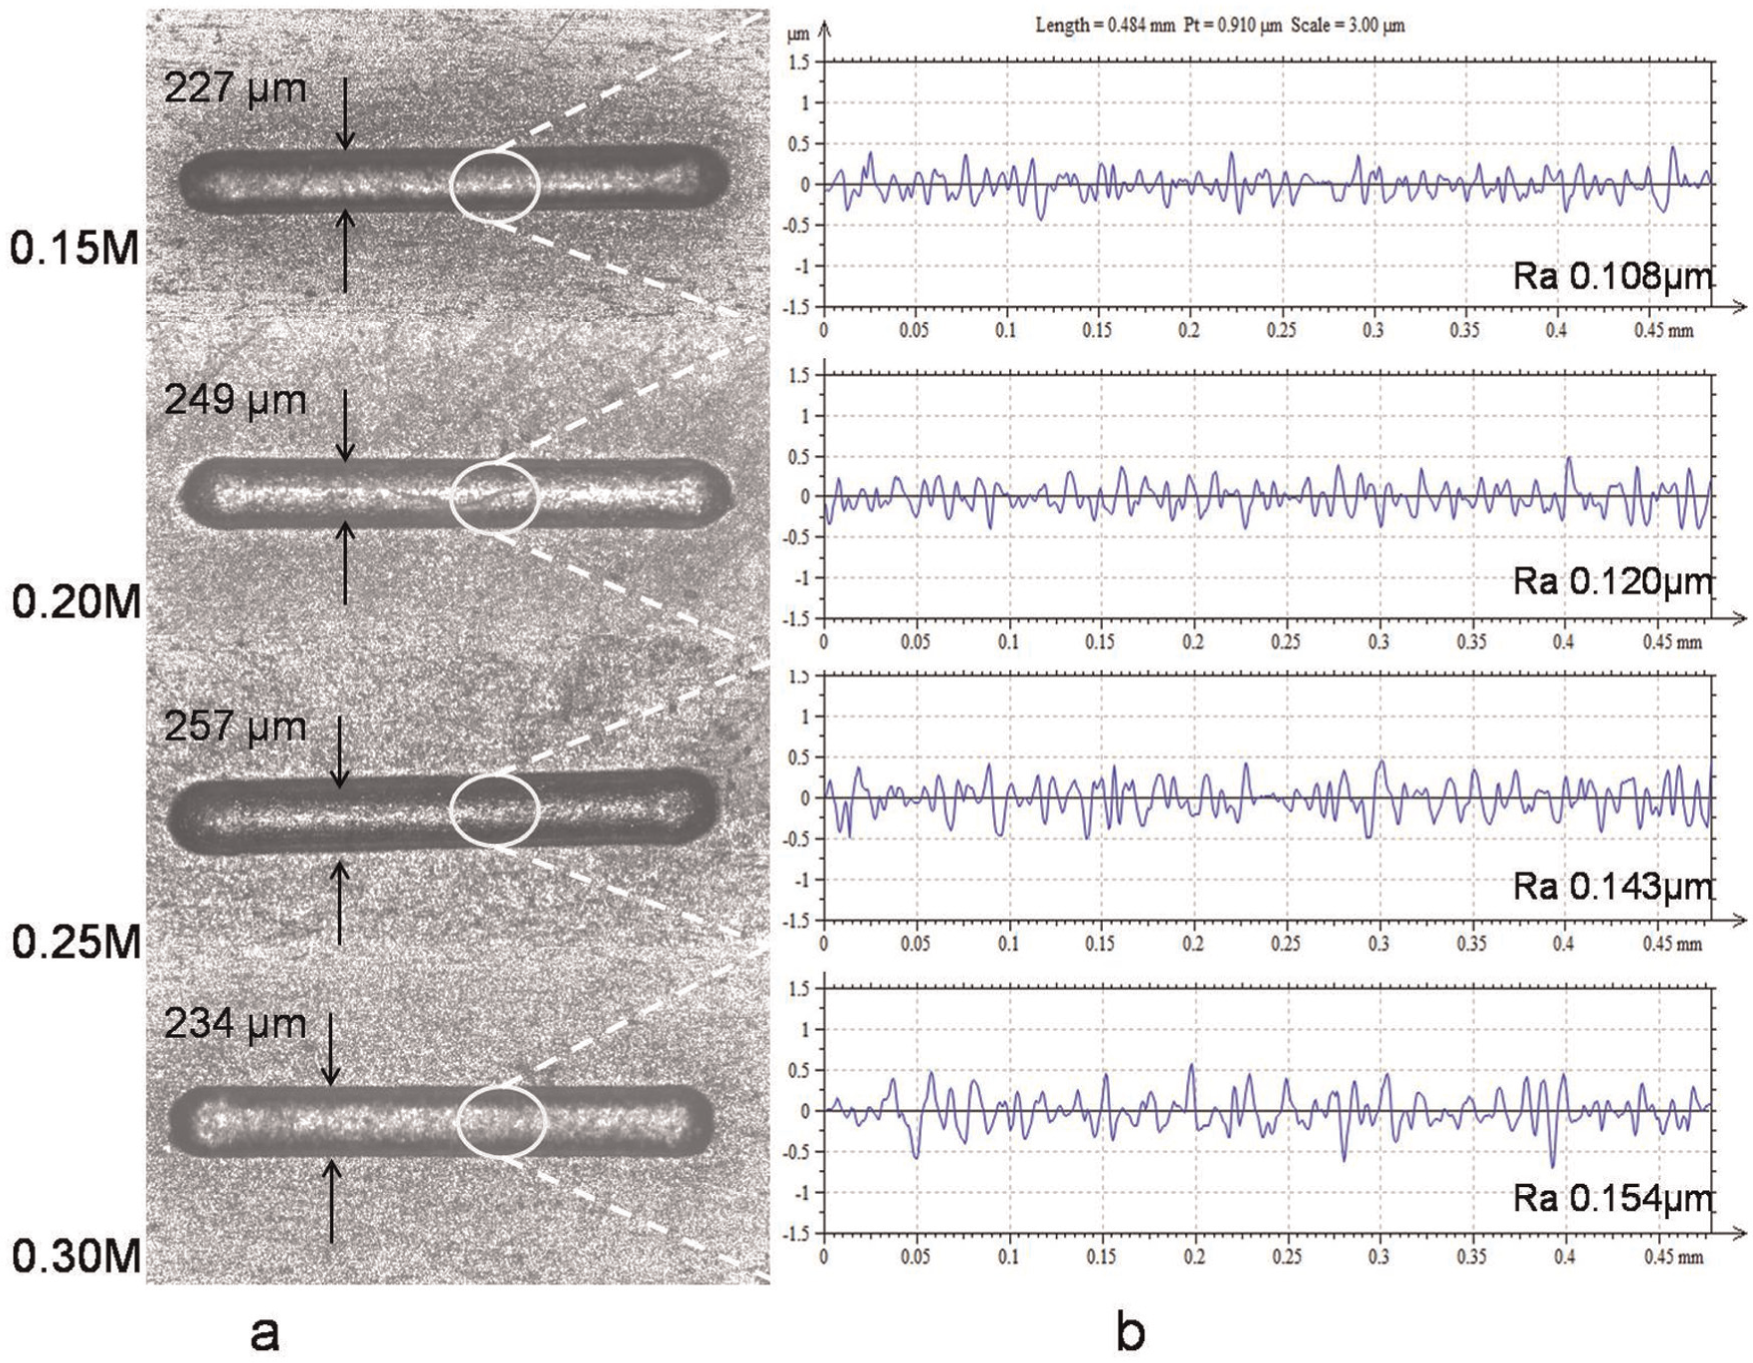
(a) Microgrooves machined at different electrolyte concentrations with 2.6 V, 8 MHz pulse frequency, 30% duty ratio, and scanning speed of 93.75 μm/s. (b) Roughness profile at the bottom.
Depth profiles of microgrooves machined using electrolytes of varied concentrations are shown in Figure 21. Increase in width and depth of the microgroove with increase in electrolyte concentration can be seen from the cross-sectional profile of the microgroove. Also at the bottom of the microgroove, curvature develops with increase in electrolyte concentration. This is because of the increased current density and reduced machining localization due to improved electrolyte conductivity at higher electrolyte concentration. Figure 22 plots the variation in SD of microgroove machined with different electrolyte concentrations. From the figure, it can be seen that linearity of microgroove improves with decrease in electrolyte concentration because of the improvement in machining localization at lower electrolyte concentration. The variations in microgroove widths along the length of the microgroove are plotted in Figure 23(a), and optical images of segment of a microgroove showing variations in microgroove widths are shown in Figure 23(b). From the figure, it can be seen that average microgroove width and variations in microgroove width decrease with decrease in electrolyte concentration due to improved machining localization at reduced current density.
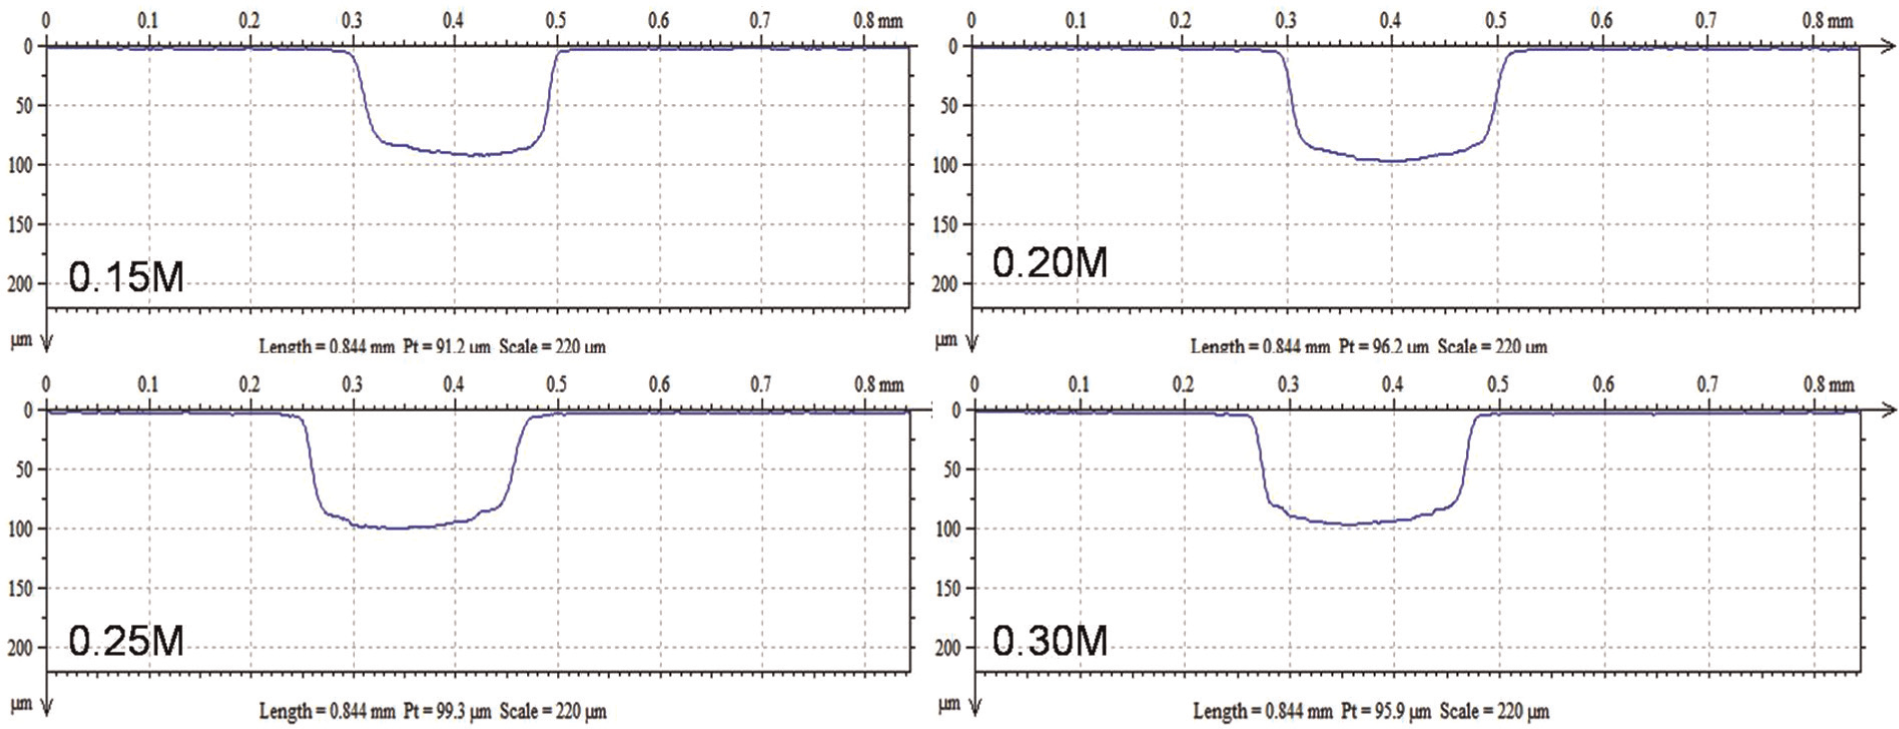
Depth profiles of microgroove machined at varied electrolyte concentrations with 2.6 V, 8 MHz pulse frequency, 30% duty ratio, and scanning speed of 93.75 μm/s.
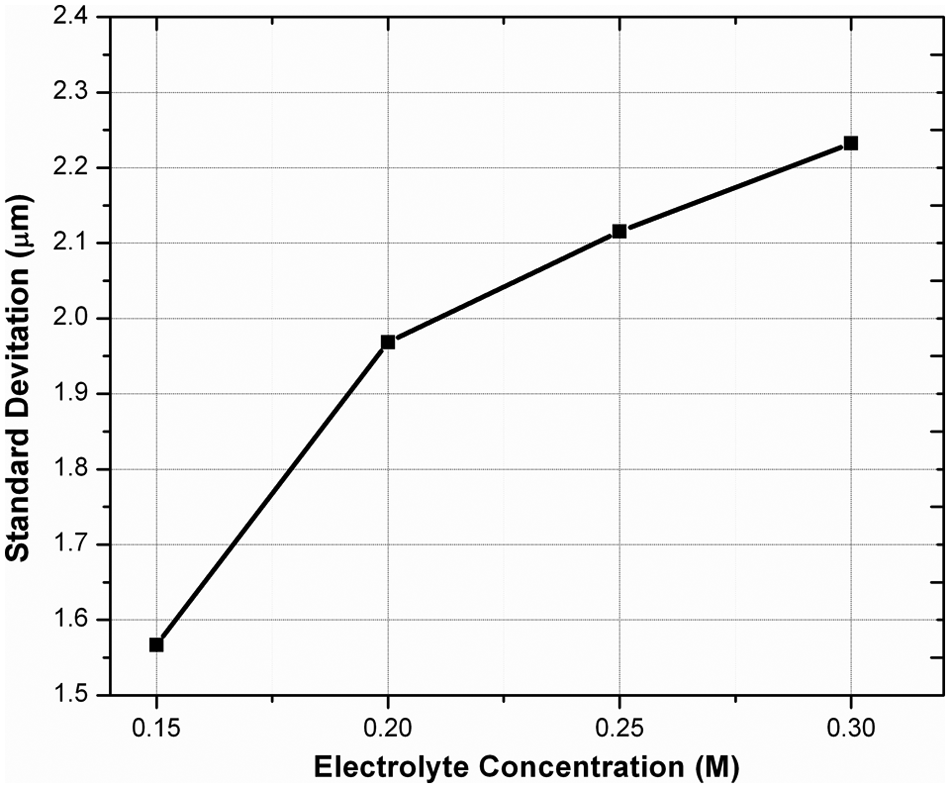
Variation in standard deviation of microgroove machined at varied electrolyte concentration with 2.6 V, 8 MHz pulse frequency, 30% duty ratio, and scanning speed of 93.75 μm/s.
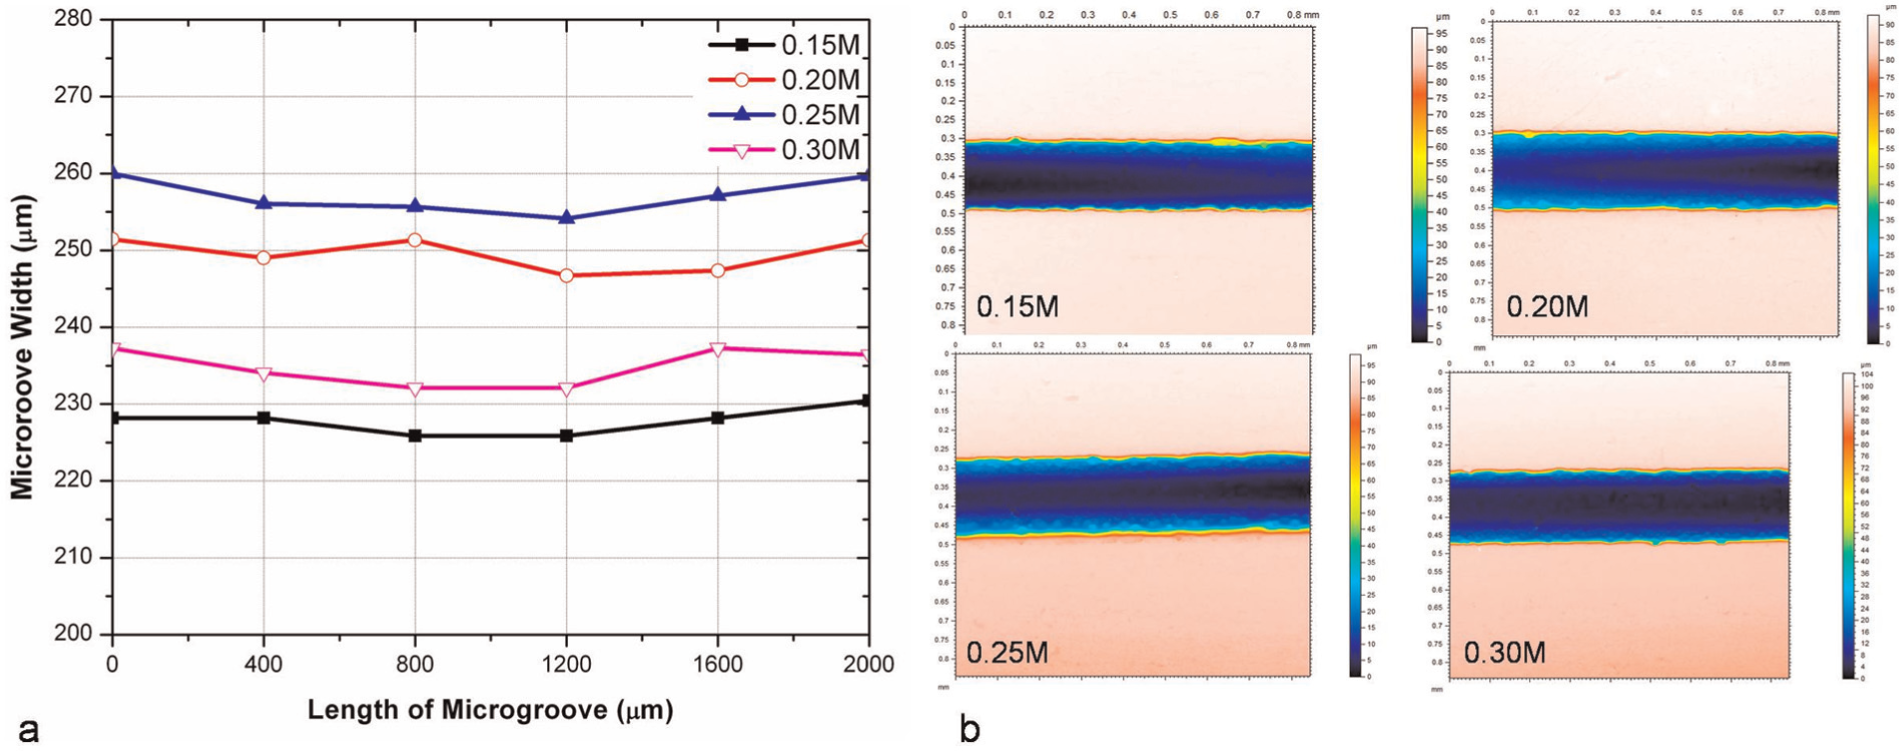
(a) Variations in microgroove widths along the length of microgroove, and (b) optical images showing width of a microgroove, machined at varied electrolyte concentration with 2.6V, 8MHz pulse frequency, 30% duty ratio, and scanning speed 93.75μm/sec.
For fabricating uniform and accurate microgrooves with good surface finish, machining with lower electrolyte concentration is recommended. However, in the present experiment, machining below 0.15 M of electrolyte concentration was not possible due to reduced electrolyte conductivity resulting in reduced machining current with reduced material dissolution, which leads to physical contact of microtool with workpiece surface. Hence, electrolyte concentration of 0.15 M was considered in the next part of experimentation.
Influence of scanning speed on machining accuracy and surface finish
In layer-by-layer machining, material is removed in layers during each scan of the microtool. Layer-by-layer machining ensures supply of fresh electrolyte at IEG due to movement of the microtool during each scan and improves the machining accuracy. Hence, layer-by-layer machining is generally preferred in EMM for the fabrication of 3D microfeatures. Since the machining localization depends on machining time also, scanning speed of microtool plays an important role in EMM. For investigating the influence of scanning speed over the machining accuracy, MRR, linearity, and surface quality, microgrooves were machined with applied voltage of 2.6 V, pulse frequency of 8 MHz, 0.15 M H2SO4, 30% duty ratio, and with scanning speeds from 31.25 to 125 μm/s. Machining accuracy in terms of overcut with variations in scanning speed is plotted, as shown in Figure 24(a). From the figure, it is seen that machining accuracy improves with increase in scanning speed of microtool. This can be explained by machining localization with respect to time. With increase in scanning speed of the microtool, machining localization improves since the microtool is available for shorter period of time for actual machining. Therefore, the material is dissolved from confined area around the microtool, improving machining accuracy. From the figure, it is also seen that WOC and LOC increase slightly at scanning speed of 125 μm/s. This is because, at higher scanning speed, microtool is available for very short period of time for actual machining; hence, material dissolution rate lags the tool feed rate and with further continuation of machining process, microtool touches the workpiece causing continuous sparking. To avoid the microtool damage, microtool is retracted back by few microns to clear IEG and machining is continued. This repetitive machining increases total machining time, increasing WOC and LOC and also MRR.
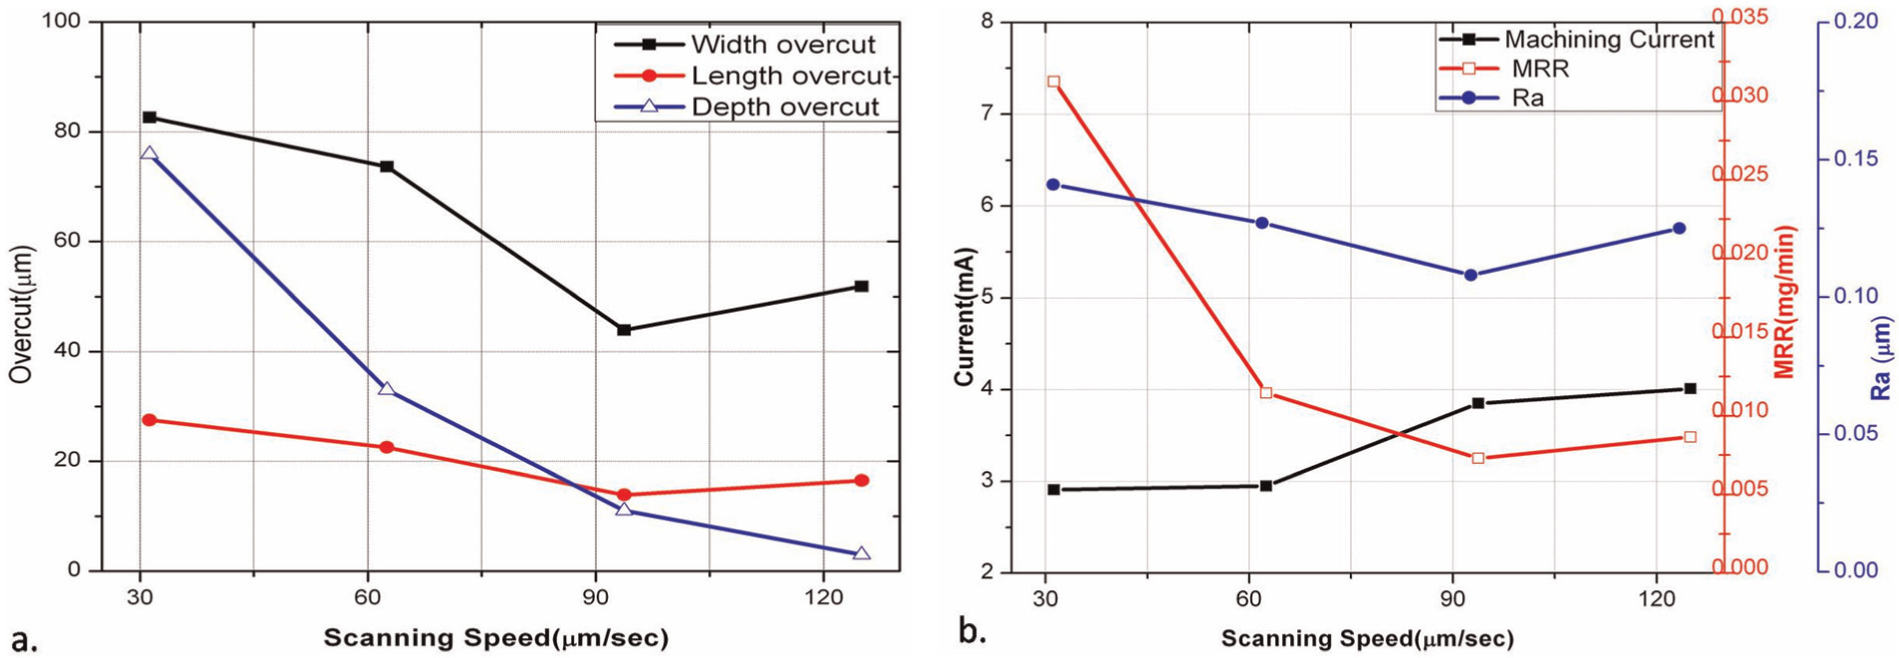
Variation in (a) overcuts and (b) machining current, MRR, and Ra of microgrooves machined at different scanning speeds, with 2.6 V, 8 MHz pulse frequency, 30% duty ratio, and 0.15 M H2SO4.
Machining current, MRR, and surface roughness, that is, Ra value obtained at different scanning speeds while fabricating microgrooves, are plotted in Figure 24(b). From the graph, it can be seen that MRR and Ra values of the microgroove decrease and machining current increases very slowly with increase in scanning speed. This is because of the improved machining localization with increased scanning speed. With increase in scanning speed, microtool is available for very short period of time for actual machining; hence, material is dissolved from very confined space around the microtool, which in turn reduces MRR and improves the surface finish of the microgroove. With increased scanning speed, IEG shrinks gradually due to reduced MRR, which in turn increases machining current gradually due to reduced electrolyte resistance. At scanning speed of 125 μm/s, MRR lags the microtool feed rate, and after sometime, microtool touches workpiece surface, causing continuous sparking. Therefore, increase in surface roughness and machining current is seen at scanning speed of 125 μm/s. For continuation of machining process, microtool is retracted back to maintain IEG and process is continued. Microscopic images, surface qualities, and roughness profiles at the bottom of each microgrooves machined with different scanning speeds are as shown in Figure 25(a)–(c), respectively.
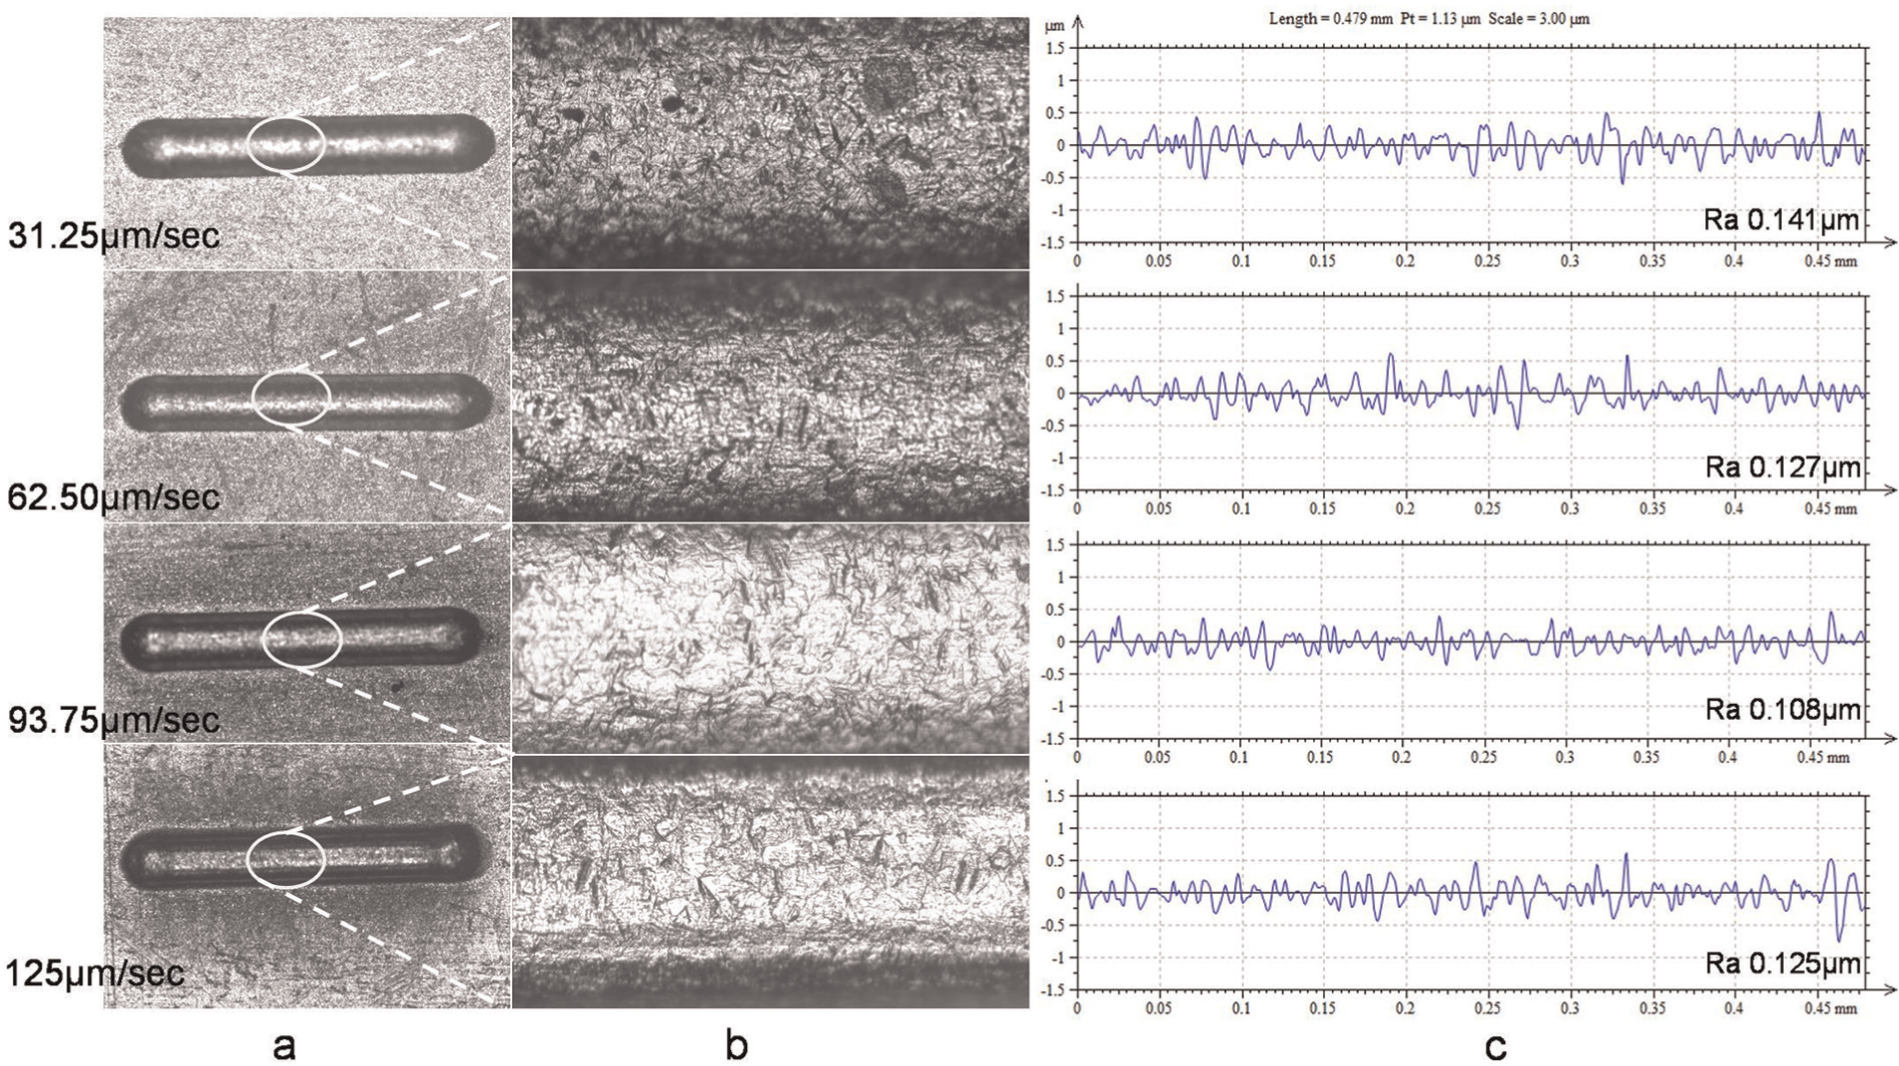
(a) Microgrooves machined at different scanning speeds with 2.6 V, 8 MHz pulse frequency, 30% duty ratio, and 0.15 M H2SO4; (b) surface quality; and (c) roughness profiles, at the bottom.
Figure 26 shows the depth profiles of the microgrooves machined with different scanning speeds. Reduction in width and depth of microgroove with increase in scanning speed can be seen from the cross-sectional profile of the microgroove. Also, the surface at the bottom of the microgroove flattens with increase in scanning speed, making it near rectangular shape of the microgroove. This is because of the improved machining localization at increased scanning speed. Figure 27 plots the variation in SD of microgroove machined with different scanning speeds. From the figure, it can be seen that linearity of microgroove improves with increase in scanning speed because of the improvement in machining localization at increased scanning speed. Microgroove widths of machined microgrooves were measured at different locations along the length of microgroove and are plotted, as shown in Figure 28(a), and optical image of the middle segment of microgroove depicting microgroove width and variations in microgroove width along the length is shown in Figure 28(b). From both the figures, it can be concluded that average microgroove width and variations in microgroove width decrease with increase in scanning speed because of the improved localization due to reduced machining time.
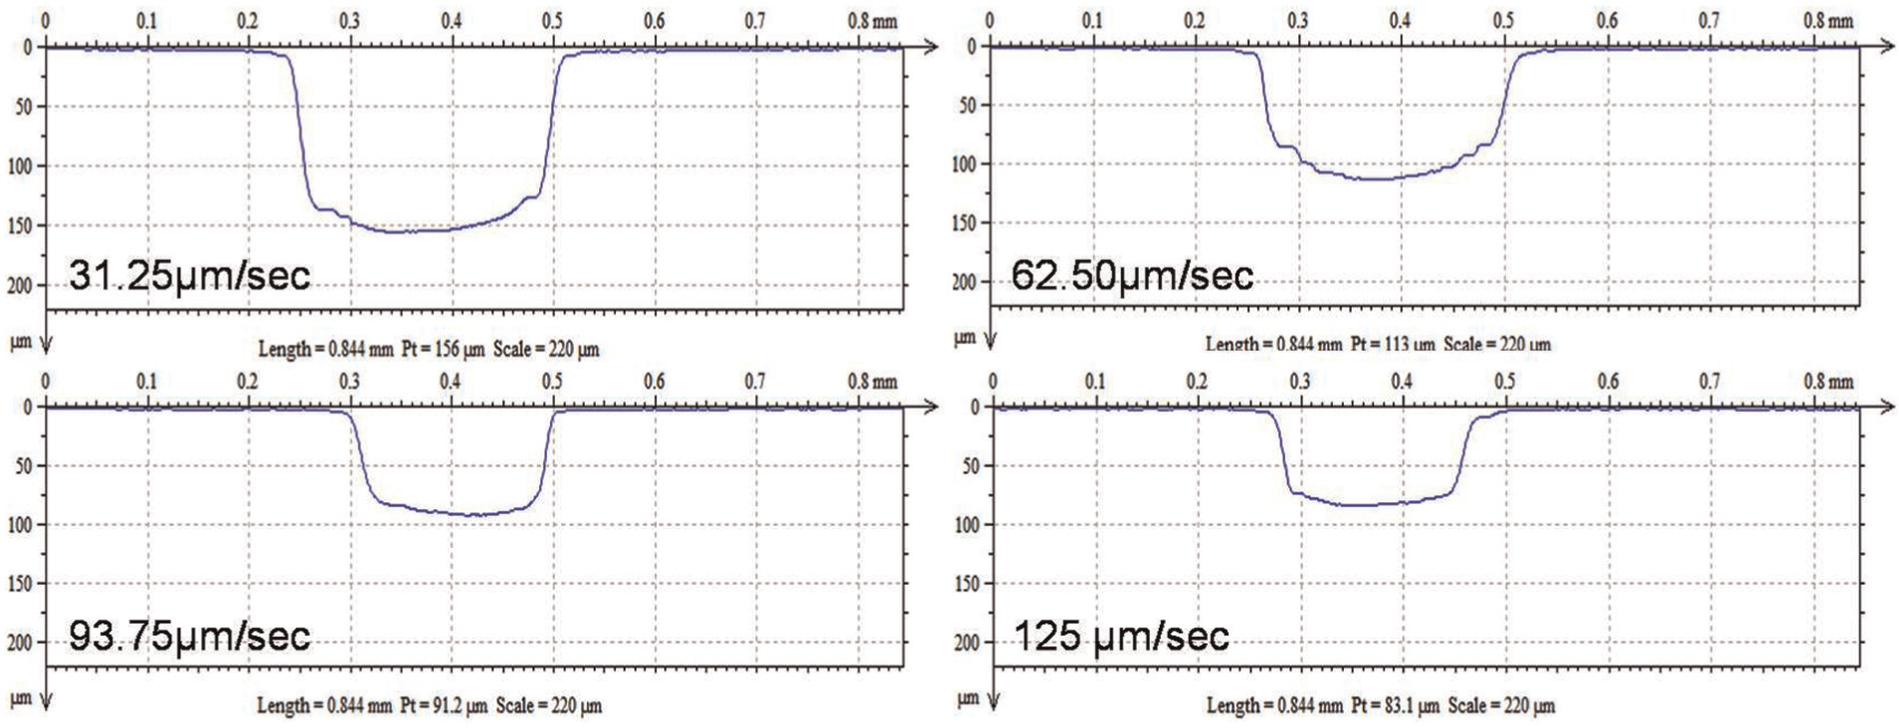
Depth profile of microgroove machined at varied scanning speeds with 2.6 V, 8 MHz pulse frequency, 30% duty ratio, and 0.15 M H2SO4.
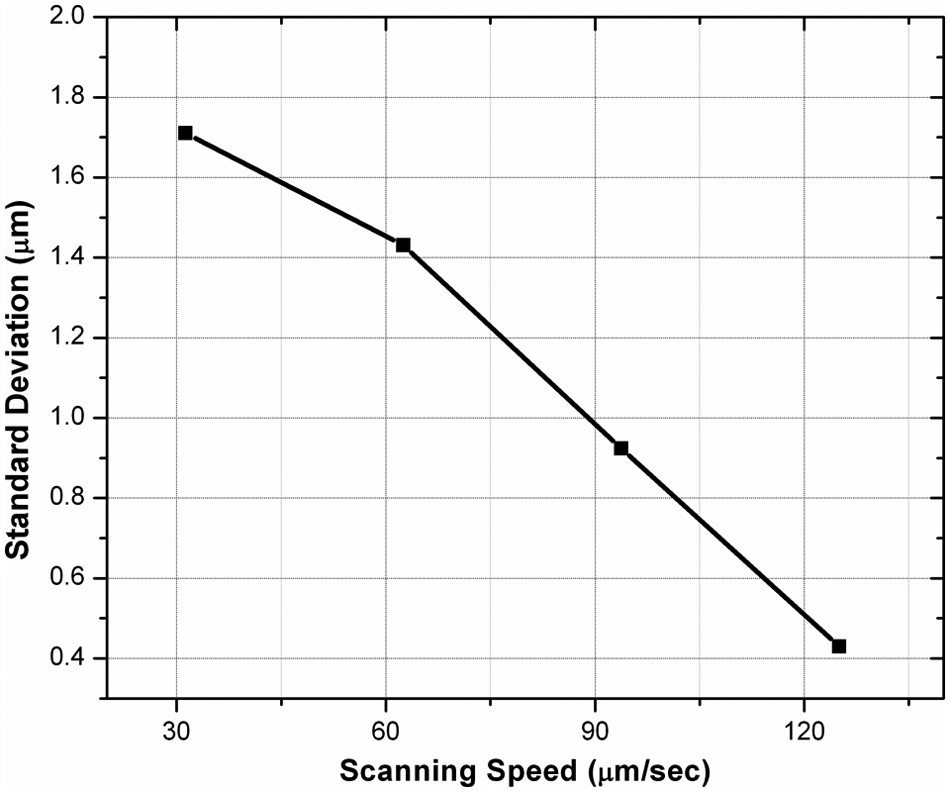
Variation in standard deviation of microgroove machined at varied scanning speeds with 2.6 V, 8 MHz pulse frequency, 30% duty ratio, and 0.15 M H2SO4.
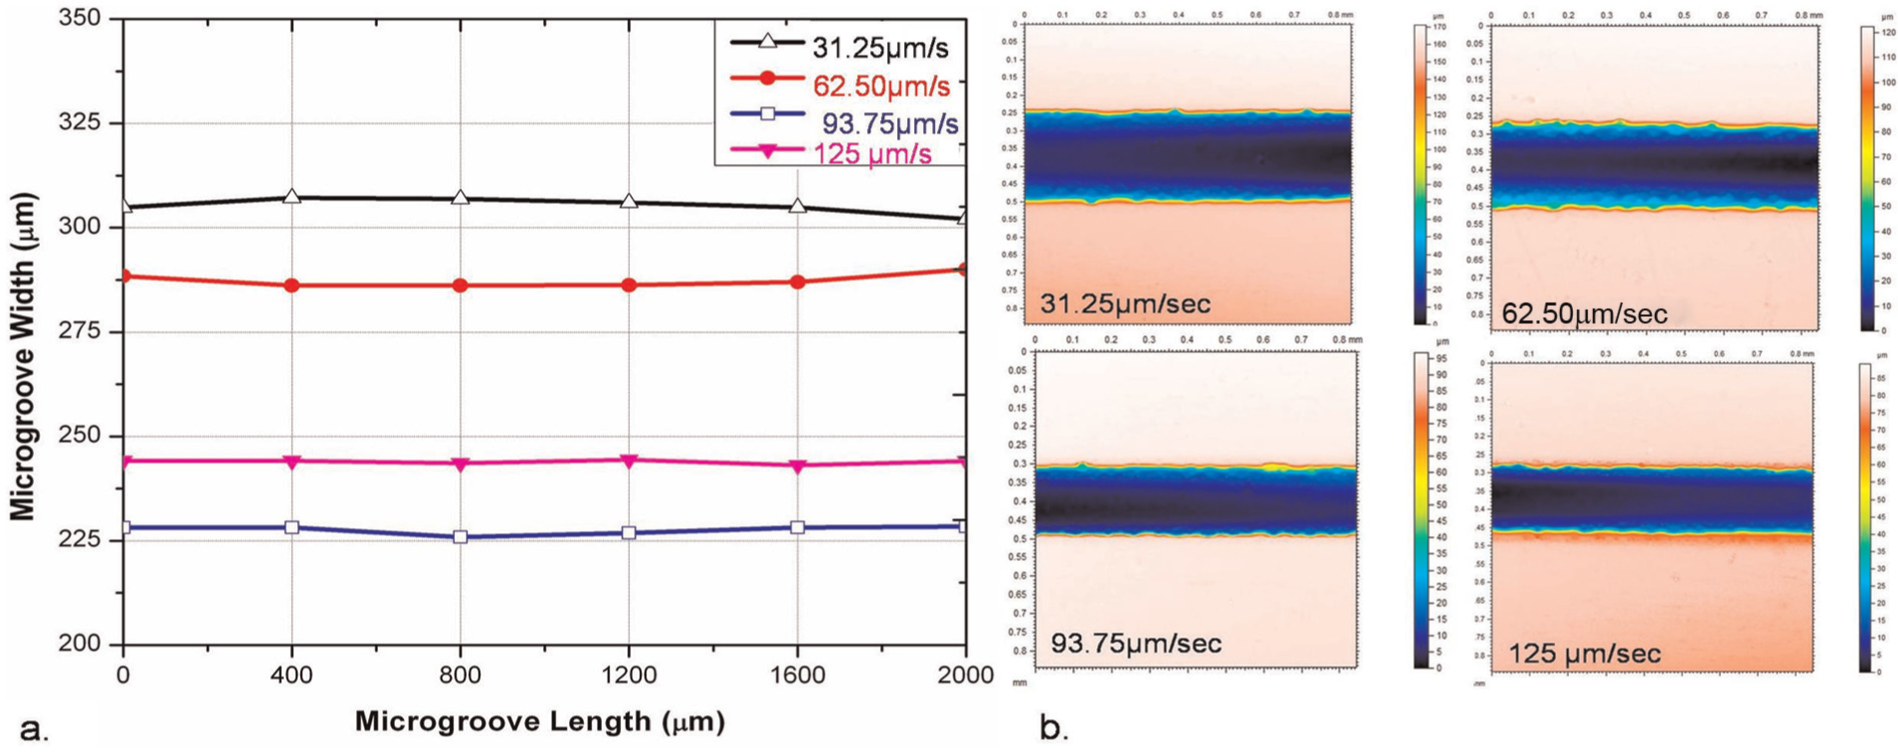
(a) Variations in microgroove widths along the length of microgroove, and (b) optical images showing width of a microgroove, machined at varied scanning speeds with 2.6V, 8MHz pulse frequency, 30% duty ratio, and 0.15M H2SO4.
Therefore, for machining accurate microgrooves having minimum overcut and surface roughness, machining with higher scanning speed is recommended. However, machining at 125 μm/s was not possible in the present experiment since material dissolution rate lags tool feed rate, which leads to physical contact of microtool with workpiece surface. Hence, for fabrication of precise microgroove, scanning speed of 93.75 μm/s was recommended.
EMM of need-based microfeatures
Microfeatures like microgrooves with different shapes, sizes, and surface finishes need to be fabricated on micro devices for different applications. From the basic experimental investigations of microgroove fabrication, best parameters obtained were as follows: applied voltage of 2.6 V, pulse frequency of 8 MHz, 30% duty ratio, 0.15 M H2SO4, and microtool scanning speed of 93.75 μm/s for minimal overcut and good surface quality. Therefore, to demonstrate the applicability of microgrooves, “C”-shaped microgroove of rectangular cross section and multiple microgrooves of varied depth and width have been machined on SS304 with best parameters. Figure 29 shows microscopic image of C-shaped microgroove with minimum overcuts, and Figure 30(a) and (b) illustrates the depth profile and roughness profile at the bottom of the microgroove at different sections. From these figures, it can be seen that fabricated microgroove has rectangular cross section, with uniform width and depth along its length and different sections of the microgroove. Also, it has uniform surface roughness at different segments of the microgroove. Figure 31 shows microscopic image of two adjoining “L”-shaped microgrooves machined using tungsten microtool of 60 μm diameter, having different widths and depths and separated by very short distance, which may act like microfin. Machined microgrooves have uniform width, depth, and cross section along its length. Also, it has same surface roughness at different arms of the microgroove. These features of microgrooves can be useful in the application of micro cooler, micro heat exchangers, micromixers, and microfluidic devices.
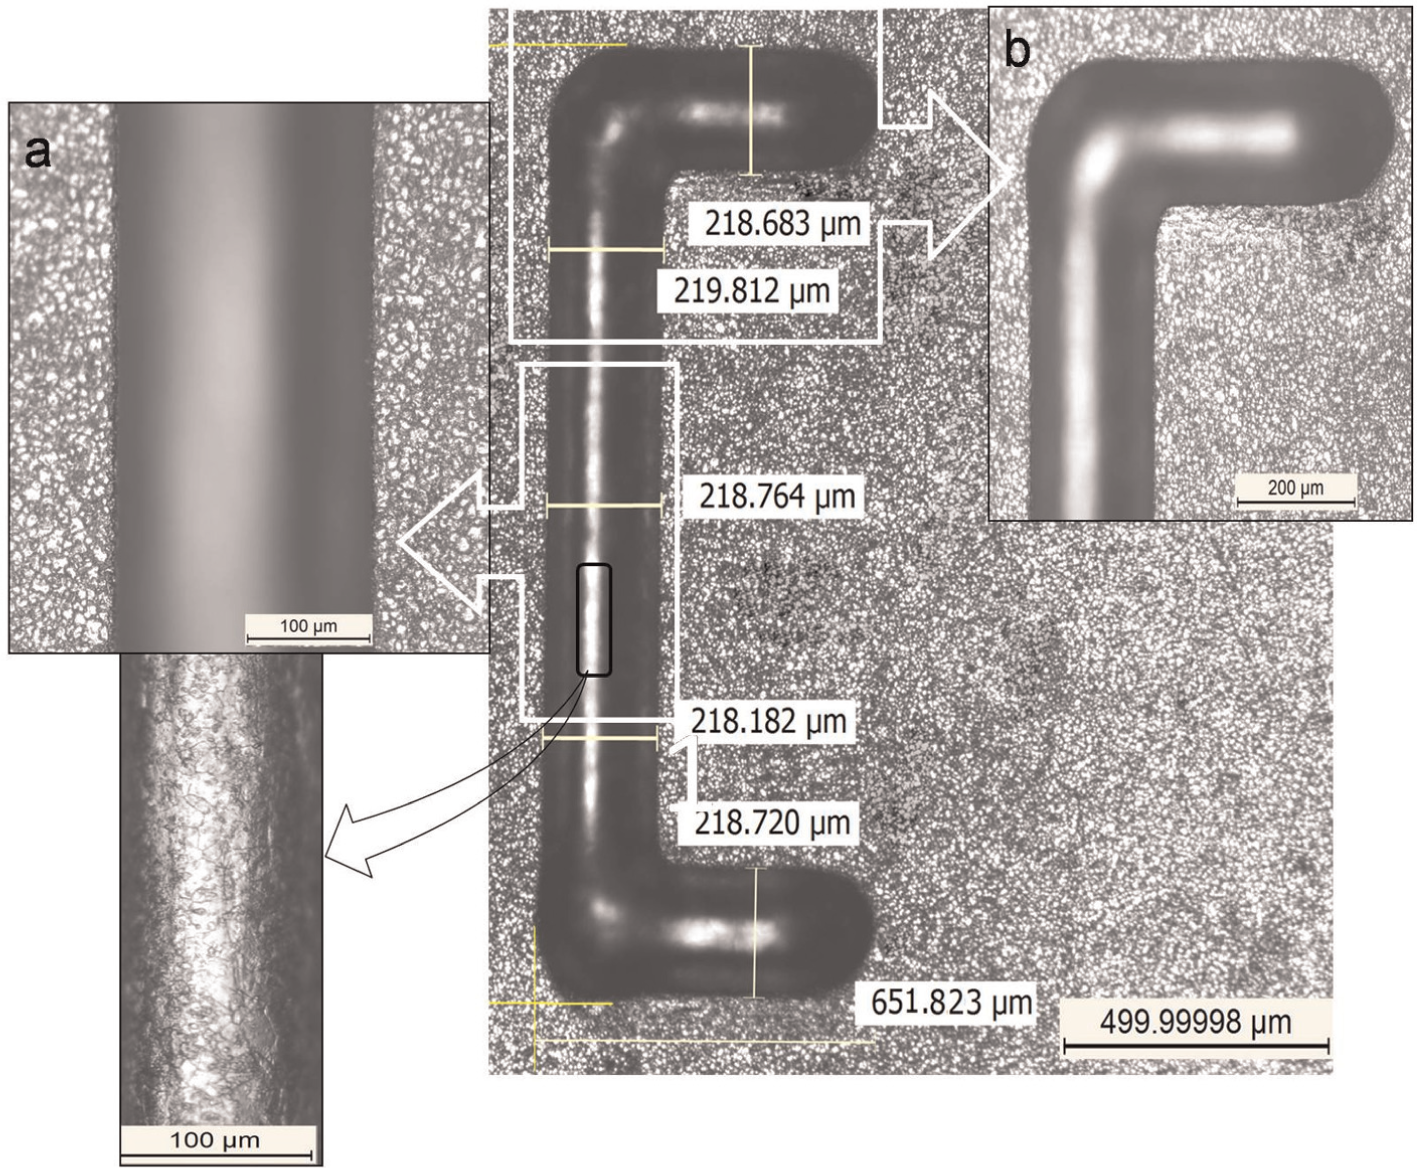
“C”-shaped microgroove machined with best parameters of 2.6 V, pulse frequency of 8 MHz, 30% duty ratio, 0.15 M H2SO4, and scanning speed of 93.75 μm/s. Enlarged view of (a) middle segment of microgroove (b) horizontal arm.
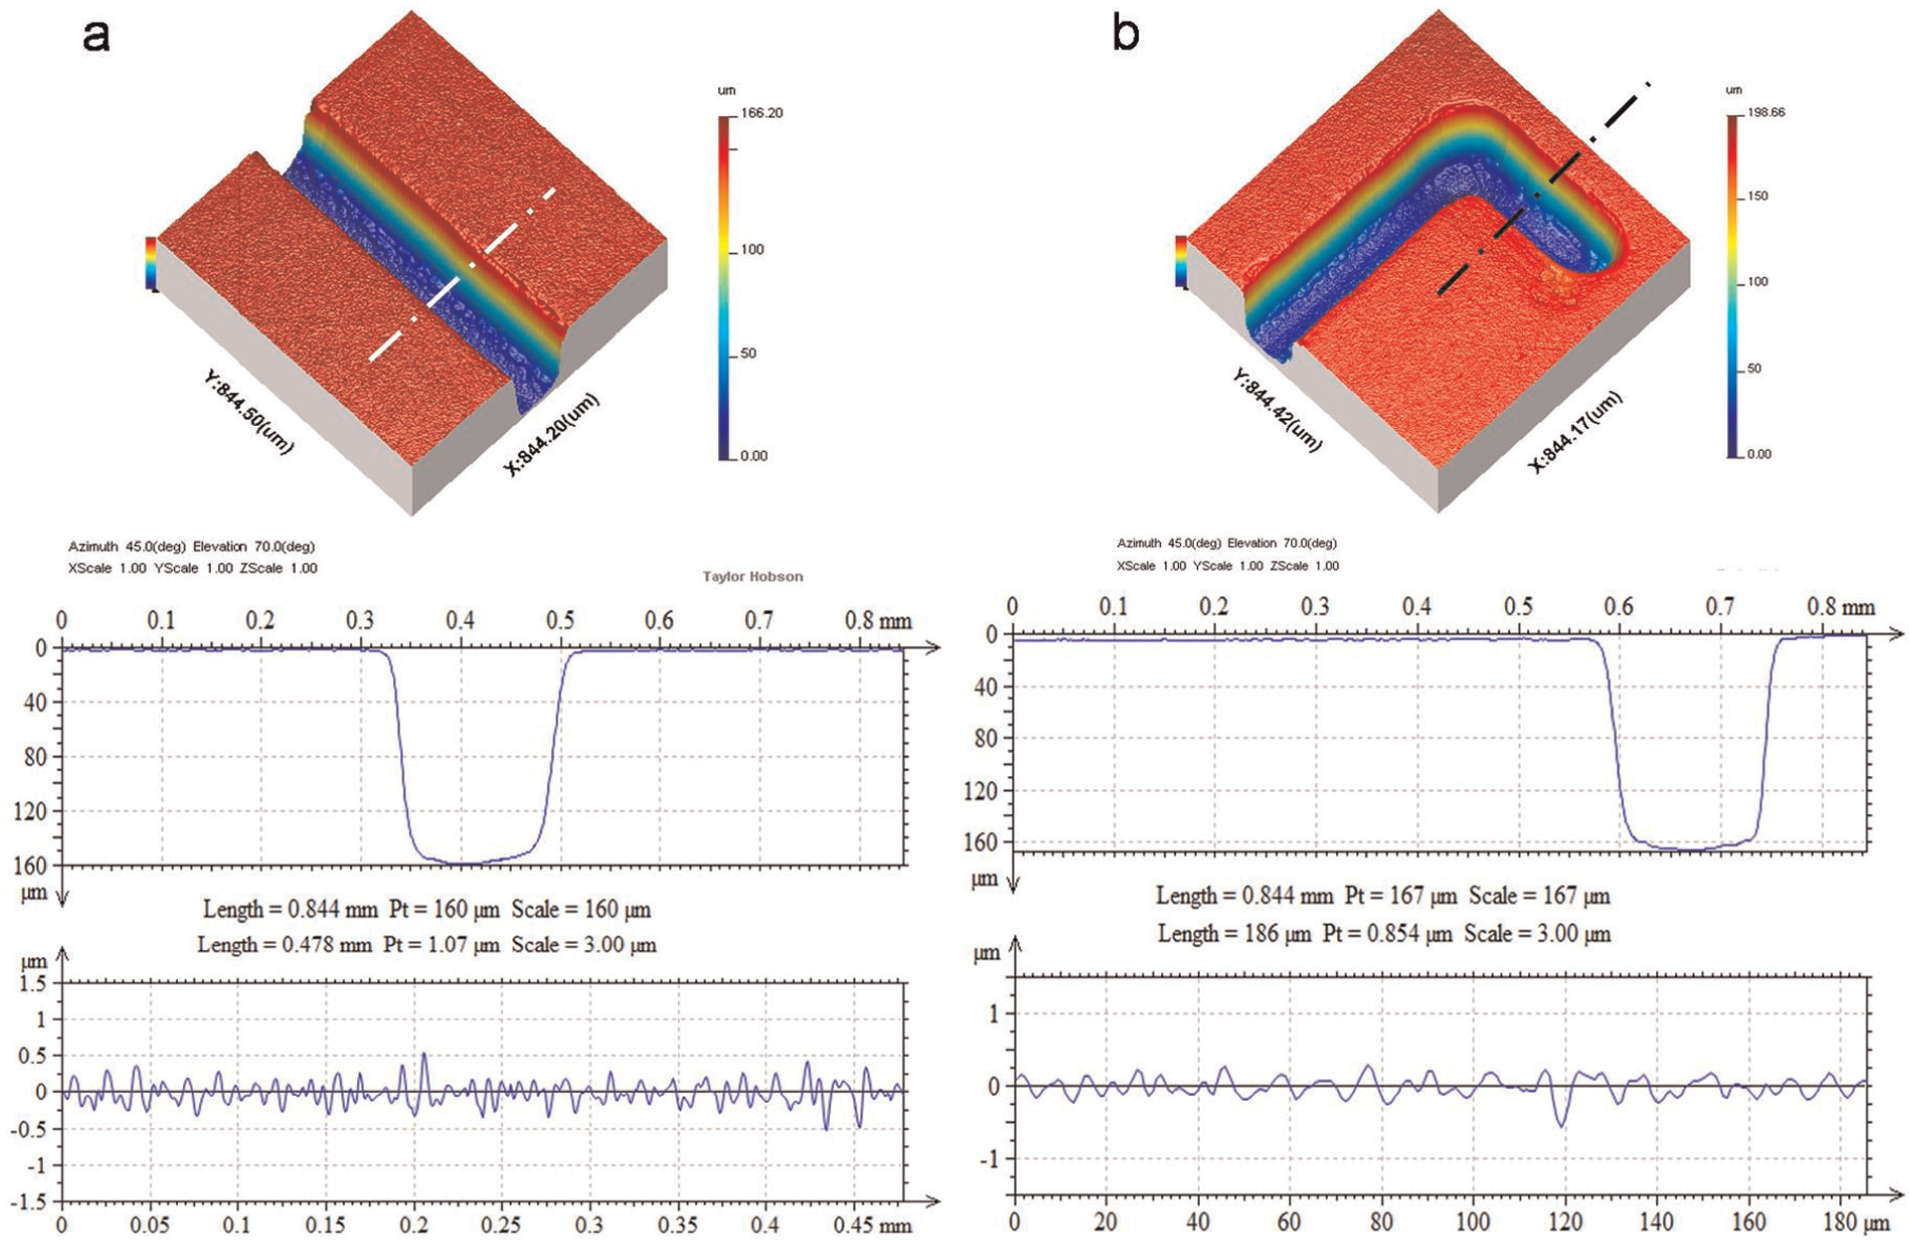
Three-dimensional images, depth profile, and roughness profile of machined microgroove: (a) Ra of 0.104 μm and (b) Ra of 0.103 μm.
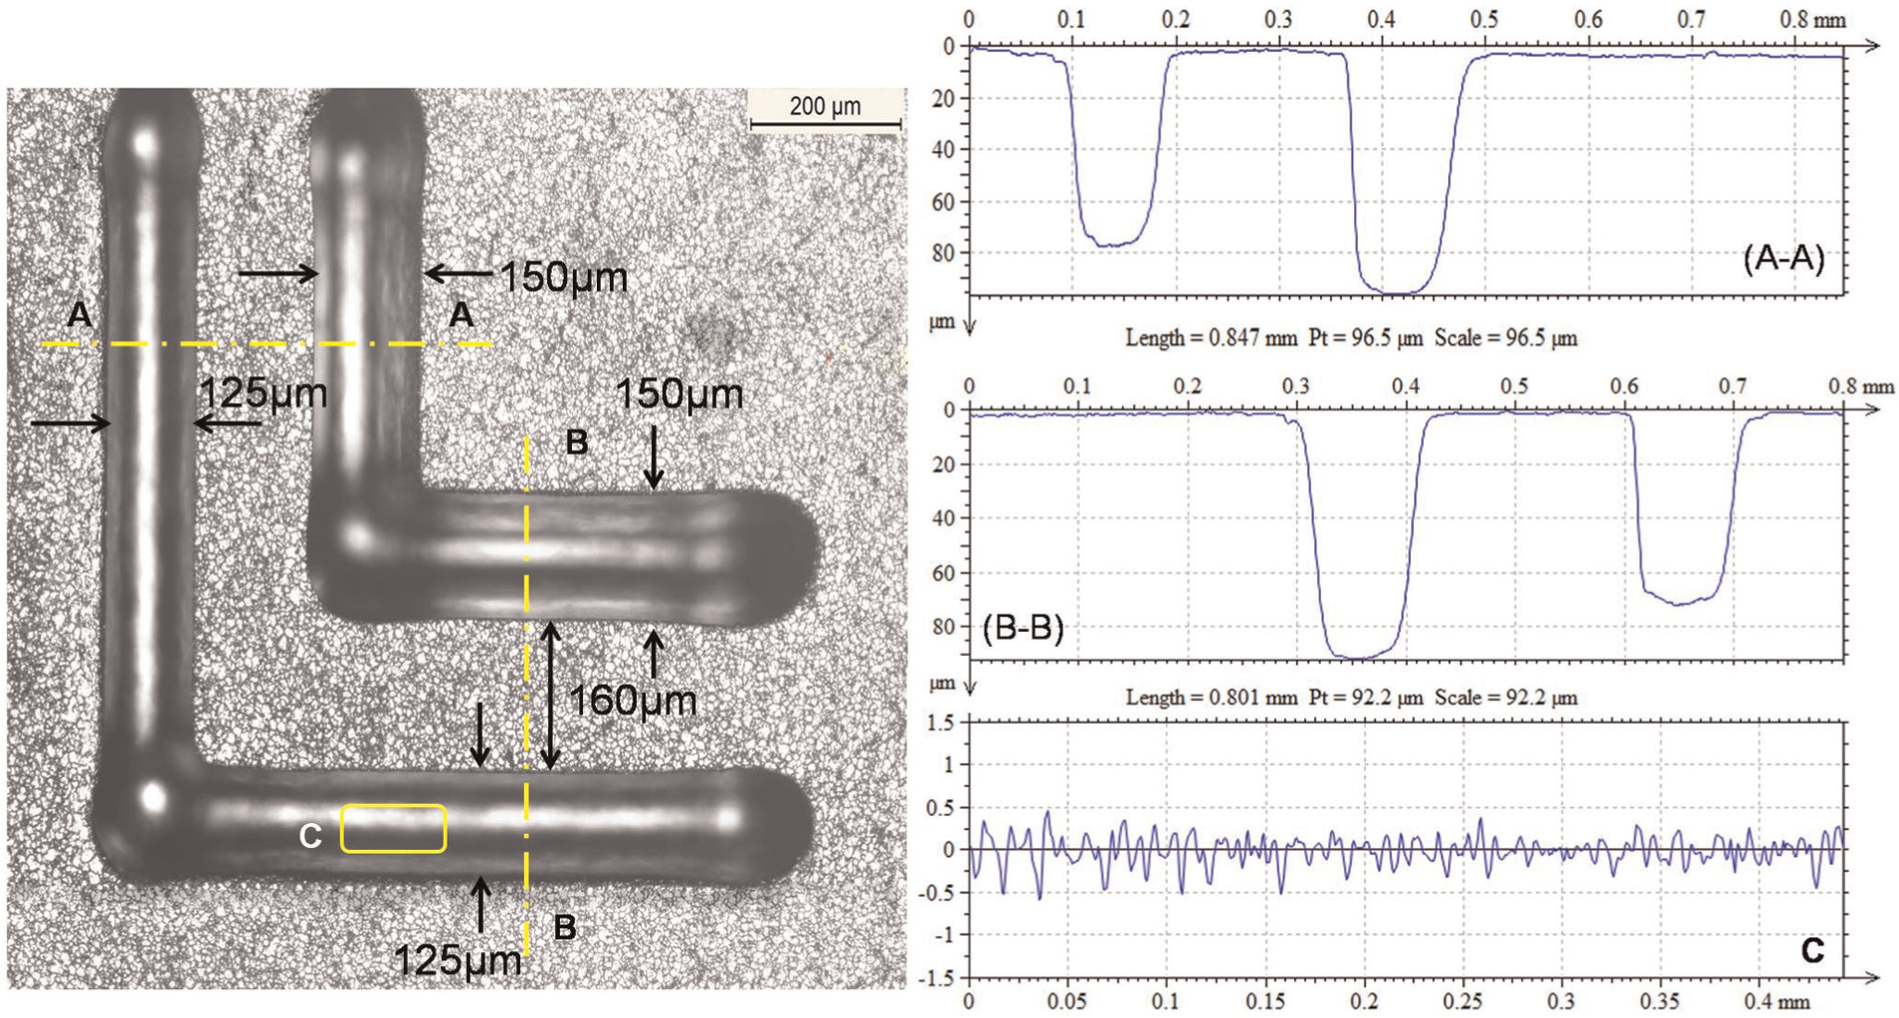
Microscopic image of “L”-shaped microgrooves with depth profiles and roughness profile (Ra of 0.110 μm).
Conclusion
This research work mainly consists of experimental observations into the fabrication of microgrooves by EMM on SS304, adopting layer-by-layer machining. The influence of process parameters on machining accuracy, surface finish, MRR, depth profile, and linearity of the microgroove was investigated. Based on the experimental results, the conclusions can be summarized as follows:
Machining accuracy improves, that is, overcut decreases, with decrease in applied voltage, duty ratio, and electrolyte concentration and with increase in pulse frequency and scanning speed of microtool. Hence, for fabricating dimensionally accurate microgrooves, machining with lower applied voltage, lower duty ratio, lower electrolyte concentration, higher pulse frequency, and higher scanning speed is recommended.
Surface finish at the bottom of the microgroove improves with decrease in applied voltage, duty ratio, and electrolyte concentration, and increase in pulse frequency and scanning speed of microtool. Therefore, for generating good surface quality at the bottom surface of microgrooves, machining with lower applied voltage, lower duty ratio, lower electrolyte concentration, higher pulse frequency, and higher scanning speed is suggested.
MRR increases with increase in applied voltage, duty ratio, and electrolyte concentration, and decrease in pulse frequency and scanning speed of microtool. Therefore, for higher production rate, machining with higher applied voltage, higher duty ratio, higher electrolyte concentration, lower pulse frequency, and lower scanning speed is suggested. However, increased MRR diminishes the dimensional accuracy and surface quality of the microgroove.
Machining current increases with increase in applied voltage, duty ratio, and electrolyte concentration and decreases with increase in pulse frequency. Increased current density worsens localization of electric field around the microtool affecting the quality of the microgroove. Localization of electric field plays an important role in generation of accurate microgrooves. The shape at the bottom of microgrooves can be controlled by regulating the machining localization with different machining parameters while machining microgrooves.
Linearity of the microgroove improves with increase in pulse frequency, and scanning speed of microtool, and decrease in applied voltage, duty ratio, and electrolyte concentration. Hence, for better control over the process and uniform microgrooves, machining with higher pulse frequency, scanning speed, lower applied voltage, duty ratio, and electrolyte concentrations is recommended.
Rectangular cross-sectional C-shaped microgroove with minimum overcut and surface roughness, that is, Ra of 0.104 μm, and adjacent multiple L-shaped microgrooves with varied depth and width useful for various applications have been machined successfully.
Experimental investigations and successful fabrication of complex microgrooves on metallic surfaces prove that EMM is a promising micromachining technique that can be used to fabricate microfeatures for industrial applications. This study will be useful for machining metallic microgrooves of desired size and surface finish on micro devices like micro actuators, micro pumps, micro coolers, micro heat exchangers, micro heat pipes, micro reactors, and micromixers for various applications. However, further investigations are required in fabrication of high aspect ratio microgrooves with varied cross sections on metallic surfaces, which will be more useful for micro thermal and microfluidic devices.
Footnotes
Declaration of Conflicting Interests
The author(s) declared no potential conflicts of interest with respect to the research, authorship, and/or publication of this article.
Funding
The author(s) disclosed receipt of the following financial support for the research, authorship, and/or publication of this article: This study was supported by the University Grants Commission, New Delhi, under CAS phase-IV programme.