
Abstract
The probabilistic design system is introduced for the sensitivity analysis to analyze the effects of machining parameters during electrical discharge machining process. An axisymmetric finite element thermal model is presented to investigate the electrical discharge machining process. By comparing the discharge crater geometry for the finite element method results and experiment results under different conditions, the deterministic thermal model is proved to be validated. Monte Carlo simulation method and response surface method are both used in the sensitivity analysis. Parameters of discharge voltage, peak current, pulse-on time and discharge channel radius are selected as the design variables. The sensitivity analysis results meet the confidence limit of 0.95. It is concluded that the discharge voltage and peak current have significant influences on the electrical discharge machining process, whereas the pulse-on time and discharge channel radius have little influence. Moreover, the increase in discharge channel radius can reduce the material removal rate. The increase in other parameters can increase the material removal rate.
Introduction
Electrical discharge machining (EDM) is a popular nonconventional manufacturing processing and widely used for dies, molds, aerospace and surgical industries. 1 EDM mainly employs thermal energy to machine high-strength and conducting materials, which is a distinctive advantage. The heat produced from the discharge processing induces the work material melting or evaporating. The electrical discharge is an extremely complicated and stochastic process which includes many phenomena such as heat conduction, heat radiation, phase changes, electrical forces and rapid solidification.2,3 To explore the EDM process, many investigations have been performed to propose or enhance various models by analyzing the spark phenomenon and mechanism of material removal in EDM. The leading reason for material removal is the heat generated in the discharge channel. The material can be removed when the temperature exceeds the melting or boiling point of the materials. Finite element method (FEM) is the nice choice to obtain the simulation results of real engineering problems. Researchers worldwide have attempted to establish the thermo-physical process model using FEM to accurately predict the crater cavity and material removing rate (MRR).
Schulze et al. 4 simulated the crater morphology with different pulses’ parameters based on FEM and compared it with the measured crater geometry. Marafona and Chousal 5 developed the FEM model for EDM according to the Joule effect. The surface quality, removed material and temperature distribution of EDM process can be estimated according to the model. Kumar 6 studied the thermal stresses from the finite element–based model and concluded that the pulse time, energy and discharge channel radius are the main elements affecting the heat generated. Kansal et al. 7 developed an FEM model of powder-mixed EDM. The model was an axisymmetric two-dimensional model, and the temperature distribution of the workpiece and material removal rate were obtained from the FEM results. Joshi and Pande 8 proposed a nonlinear, transient thermal model for die-sinking EDM processing based on FEM. The crater cavity shapes predicted by this model were more realistic and similar compared with the reported analytical models. Yeo et al. 9 analyzed five EDM models from different researchers at the aspect of the temperature distribution, crater geometry and material removal. It was showed that the EDM model with disk heat source was enhanced by employing the approximation of the heat flux and energy fraction 9 (Table 1).
Summary of the EDM models from the cited works.
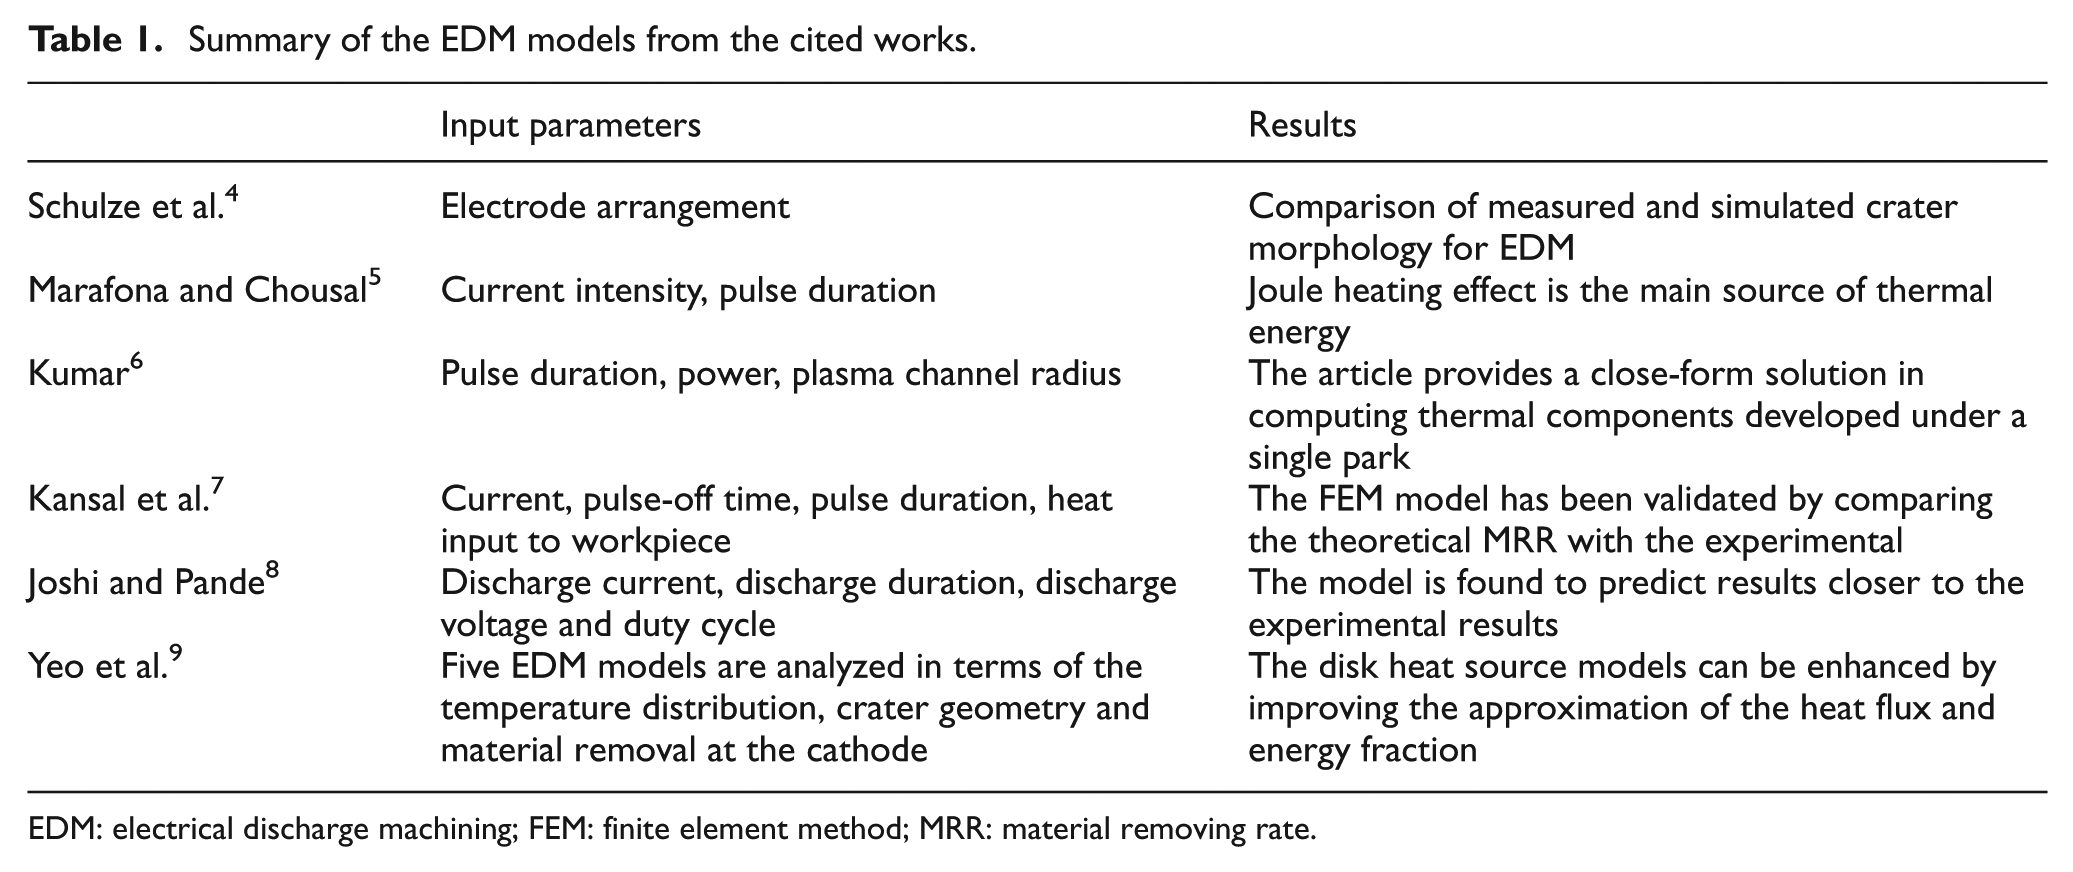
EDM: electrical discharge machining; FEM: finite element method; MRR: material removing rate.
It is drawn that the FEM has been extensively used in the EDM process. However, the models mentioned are designated to chosen tool or work materials, experimental conditions and limited experimental data generated and many stochastic factors have not been investigated, such as the fluctuation of the voltage, variation in discharge duration time and the dielectric properties during the EDM process. The effects of stochastic factors can bring about a better understanding of the EDM process. ANSYS probabilistic design system (PDS) can elucidate those effects on the EDM processing. PDS is employed for analyzing the uncertainties or reliability problems, which involves the Monte Carlo simulation (MCS) method and response surface method (RSM). 10 This approach can be taken to investigate the probabilistic and sensitivity analysis for many aspects. Nakamura investigated the probabilistic transient thermal analysis of the atmospheric reentry vehicle structure. MCS was employed to study the probabilistic temperature responses. 11 Cai et al. 12 performed the prediction of critical bucking pressure by the methods of MCS and RSM and studied the influences of randomness of material properties and dimensions for the critical bucking pressure. Simultaneously, Cai et al. 13 used the PDS to evaluate the buckling behaviors of composite long cylinders. Liu and Zheng 14 investigated strength reliability of composite laminated structure using the MCS and RSM. Nemeth et al. 15 simulated the influence of the dimension uncertainties on the probability strength response for the single crystal specimens using PDS.
The target of this work is to perform the sensitivity analysis of randomness and uncertainties of the electrode dimensions and the discharge channel to the temperature distribution during EDM process based on the probabilistic finite element analysis method. Discharge voltage (Ud), peak current (Ip), pulse-on time (ton) and discharge channel radius (R) are selected to be the random input parameters, and the random output response is the maximum temperature. Many experiments were carried out to study the finite element analysis results under specific conditions.
Finite element model
Thermal analysis model
In EDM processing, the material is machined mainly depending on the heat generated through the discharge channel, which increases the temperature of the tool and the workpiece above their melting point. Therefore, the discharge phenomenon can be modeled as heating of the workpiece in the discharge process.16,17 And the temperature distribution of the workpiece is simulated by FEM. The FEM model of EDM processing is established axisymmetrically and developed for a transient, nonlinear thermal analysis of EDM process. Three-dimensional, eight-noded hexahedral thermal solid element (solid 70) was chosen for meshing the model. Great temperature gradient would exist in the discharging region. Large element size would produce large error on the calculation results. Small element size would improve the calculation accuracy, but increase the numbers, complexity and computing time of finite element mode. Therefore, the appropriate element size is very important and can achieve satisfactory results. And fine meshing is adopted near the discharge channel and sparse meshing far from it. This method can improve the calculation accuracy and save the calculating time. Therefore, the element size of discharge channel is set 0.05 mm. The “vmesh” command is adopted and 43,421 elements are generated. The meshing finite element model is shown in Figure 1.
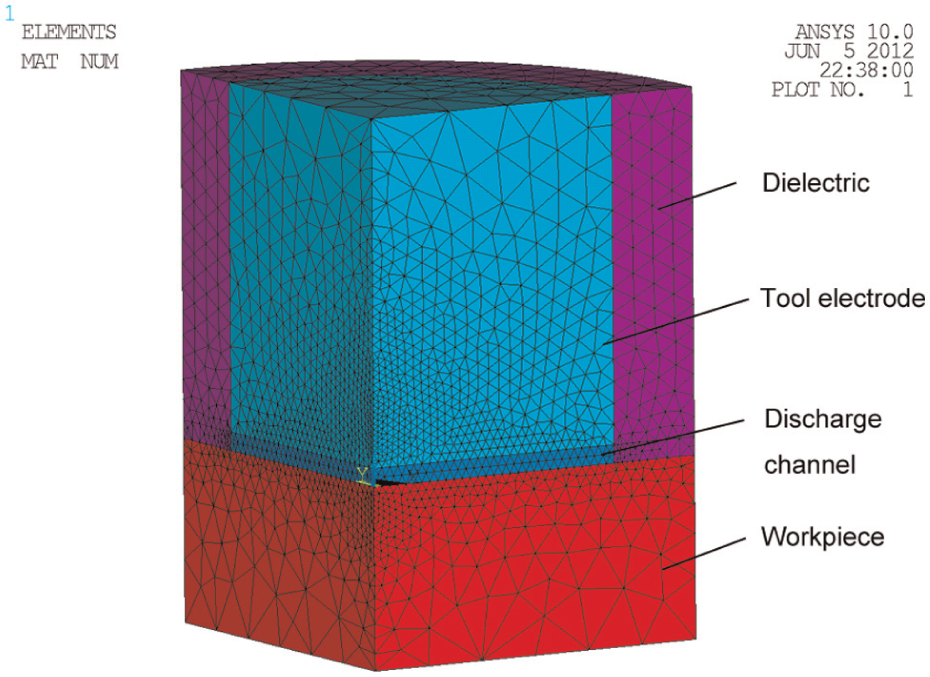
Finite element model of the EDM process.
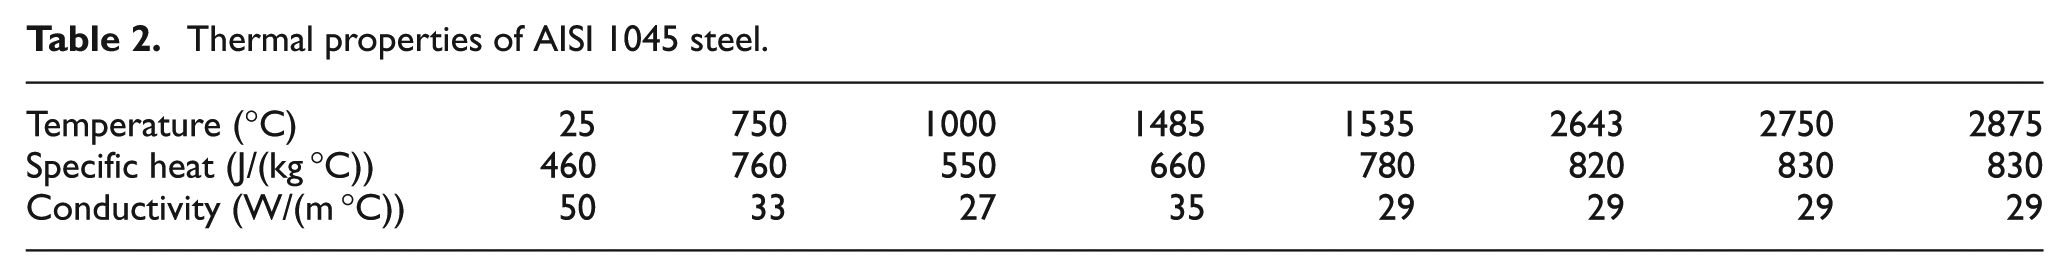
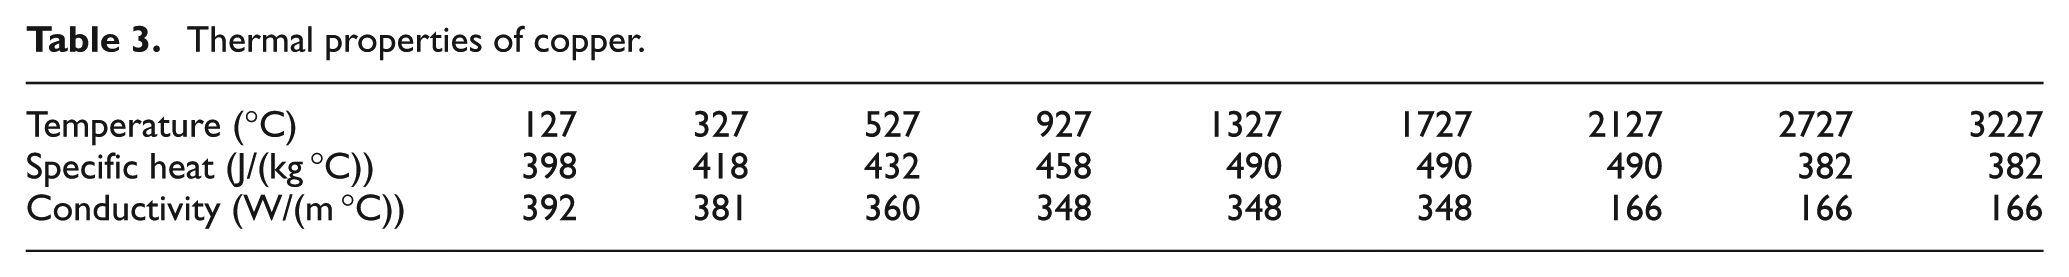
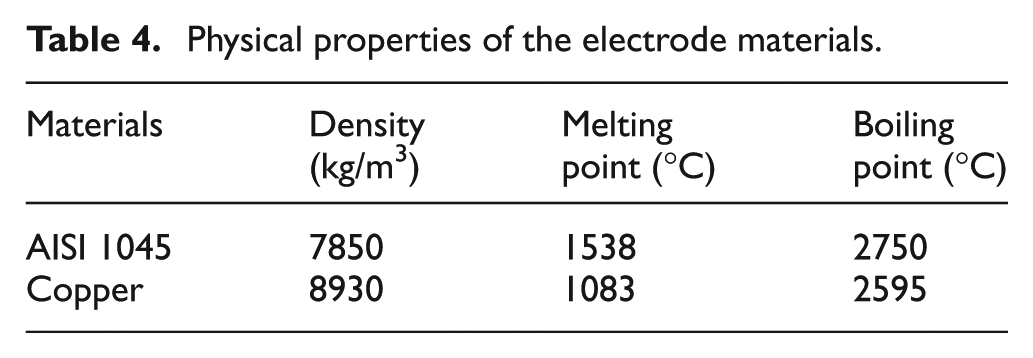
EDM is a thermal process where huge thermal energy is generated. This causes instant rise in workpiece temperature up to boiling point of the material and a subsequent decrease to room temperature. The abrupt change in the temperature severely affects the properties of the material. In this work, the variations in material properties with temperature are taken into account. Nonlinear material thermal properties under different temperatures are introduced. The materials of the workpiece and tool electrode investigated are AISI 1045 steel and copper, respectively. It is supported that the material composition is homogeneous and isotropic. And their thermal properties and physical properties can been seen in Tables 2–4. 18
Thermal properties of AISI 1045 steel.
Thermal properties of copper.
Physical properties of the electrode materials.
During the EDM process, the effects of heat conduction, radiation and convection are responsible for the heat transferred to the workpiece and the tool electrode. In this research, conduction is taken as the main manner of thermal transmission as effects of the other actions are very little. The heat conduction is governed by a differential equation as shown in equation (1)
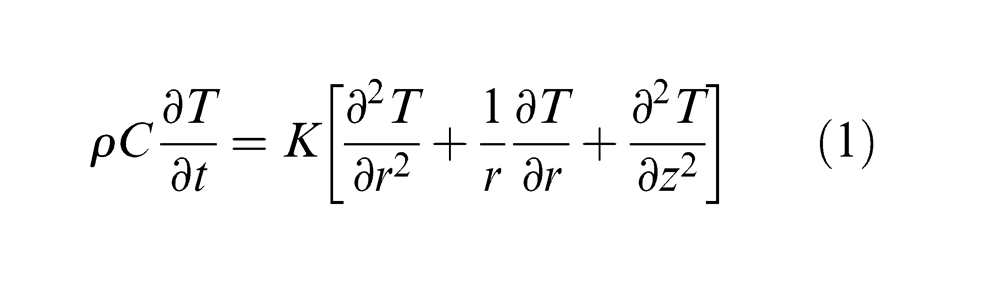
where ρ is the material density (kg/m3), C is the specific heat capacity (J/(kg °C)), T is the temperature (°C), t is the time (s), K is the material conductivity (W/(m °C)) and r and z are the radial axis and vertical axis, respectively.
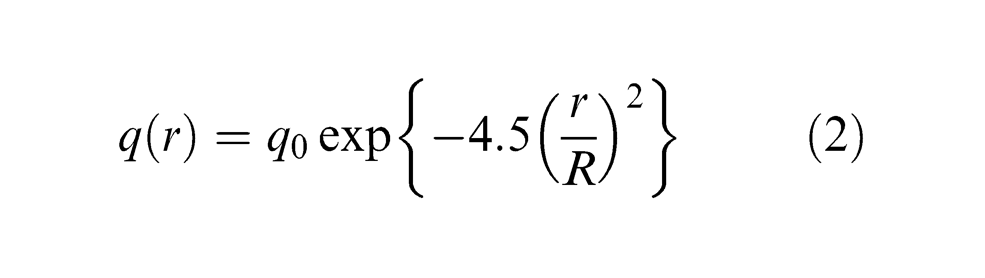
In this research, the Gaussian distribution of heat flux is introduced as the heat source on workpiece surface. Gaussian distribution can well simulate the heat model in EDM and widely used by researchers. Kansal 7 , Joshi 8 and Shabgard et al. 19 used Gaussian heat flux distribution assumption to analyze the electric discharge machining. The heat transferred to the workpiece during EDM spark is given in equation (2)
The maximum heat flux q0 is given in equation (3)
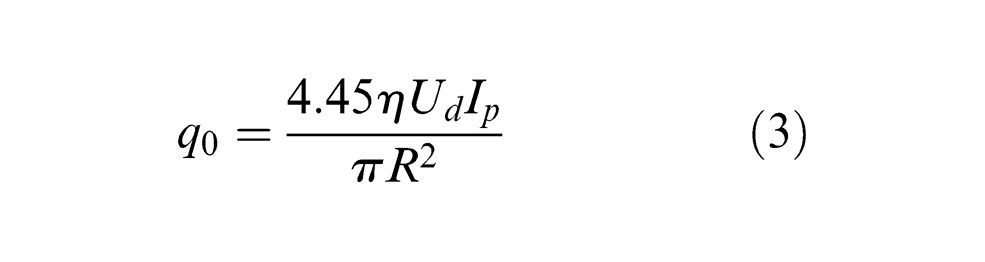
Here, η is the fraction of the total heat applied on the workpiece, Ud is the discharge voltage, Ip is the peak current and R is the discharge channel radius on workpiece surface.
Heat flux fraction is an important factor in equation (3) as it governs the amount of energy going to the workpiece. It is affected by many factors such as the thermal properties of dielectric and electrode. But it seems that there is no comprehensive method available to calculate the value of energy sharing. Various values of η were proposed in the literatures. Shankar et al. 20 claimed that 40%−50% of the heat generated is transferred to the workpiece. Marafona and Chousal 5 used 50% as a Joule heating factor. Kansal et al. 7 considered 9% as the fraction of total heat transferred to the workpiece during the powder-mixed electric discharge machining. Joshi and Pande 8 chose the value of 0.183 as the energy distribution factor to see its effect on the MRR, which is the same with the research of DiBitonto et al. 21 Considering that the experimental conditions are almost the same with that in Shankar’s research, the fraction of the heat transferred to the workpiece was considered as 40% (η = 0.4).
Usually, the discharge channel is assumed between the electrodes. The radius of this cylindrical column is not a constant but varies with time. It is determined by many variables such as discharge energy, pulse time, dielectric and electrode materials. The determination of discharge channel radius for EDM has been attempted widely. Erden 22 found that discharge channel radius is associated with the discharge power and pulse duration, while DiBitonto obtained integral equation of discharge radius mathematically. 21 The computing formula of discharge radius has been achieved by Ikai and Hashiguchi 23 as shown in equation (4). This discharge radius equation is used in Kansal et al. 7 and Joshi and Pande 8 and also adopted in this model
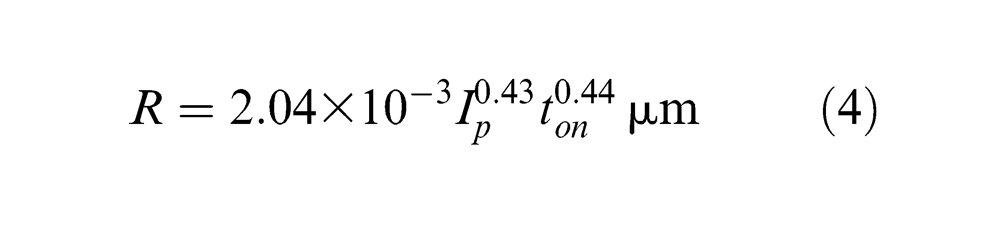
where Ip is the discharge current (A) and ton is the pulse-on time (µs).
Sensitivity analysis
Sensitivity analysis is a method to identify critical parameters and rank the importance of input variables on the outputs of parameters. It is the first and the most important step in the optimization problems because it yields the information about the increment or decrement tendency of the design objective function with respect to the design parameter. Sensitivity analysis can be performed by the PDS analysis. PDS includes two methods of MCS and RSM. The two methods are both based on statistical approach and use repetitive simulations. The random variables of uncertain input can be produced based on the assumed probability distribution in order to achieve sufficient samples.
MCS is widely used in engineering for sensitivity analysis in process design. It can generate a series of random values that are changed into another series of values formed by possible variable values. For each iteration, a value is randomly selected for each of the variable’s probability distribution to calculate the output results. 24 There is no simplification or assumption in the deterministic or probabilistic model of MCS. Therefore, MCS needs to limit the sample numbers and quantify the randomness of the result parameters. The needed number of MCS simulations is not a function of the number of input variables, whereas this method requires large amounts of computation. RSM could confirm the relationship between the random input parameters and the response. It can be estimated by a typical quadratic polynomial as given in equation (5)
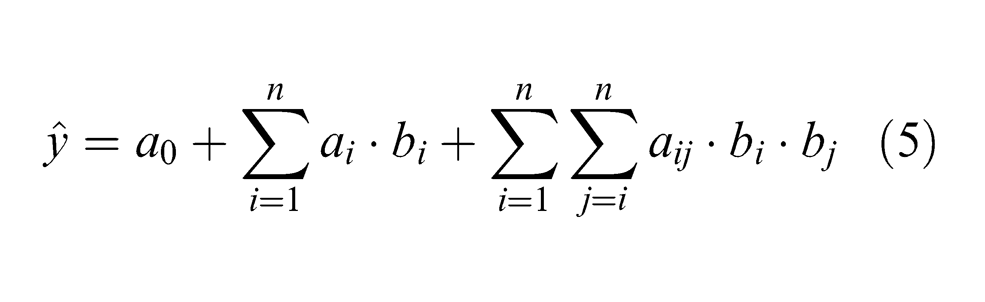
where a0, ai and aij (i, j = 1, ..., n) are the regression coefficients and bi (i = 1, ..., n) are the n input parameters. The RSM assumes a total of n sampling points for the input parameters a and b, and y is the output parameter. For each sampling point, the corresponding parameter y is solved using finite element analysis. Compared to the MCS method, RSM has a much quicker calculation speed and can provide measures to verify. But this method may be inadequate while the actual input–output relationship is not successive.
In view of the characteristics of MCS and RSM, both of them are employed to investigate the effects of uncertain variables on EDM process to obtain an accurate result. In the EDM process, discharge voltage (Ud), peak current (Ip), pulse-on time (ton) and discharge channel radius (R) were selected as the random variables to perform the analysis in a reasonable time. By the data collection and empirical analysis, the statistical characteristics are as obtained in Table 5. The MCS with Latin hypercube sampling (LHS) is introduced because of its better sampling efficiency and avoiding samples’ iterations that have been evaluated. To achieve a converged output result, there are 2000 Latin hypercube loops employed in this study. The RSM depends on the central composite design to set the sample points in the designing area. There are 25 designs of experiment with 10,000 MCS running to achieve the response surface results. In this study, a 3.0-GHz quad core Intel processor is employed. The calculation time for MCS is approximately 70 h, whereas the RSM calculation time only needs 30 min.
Statistical characteristics of input variables for EDM process.
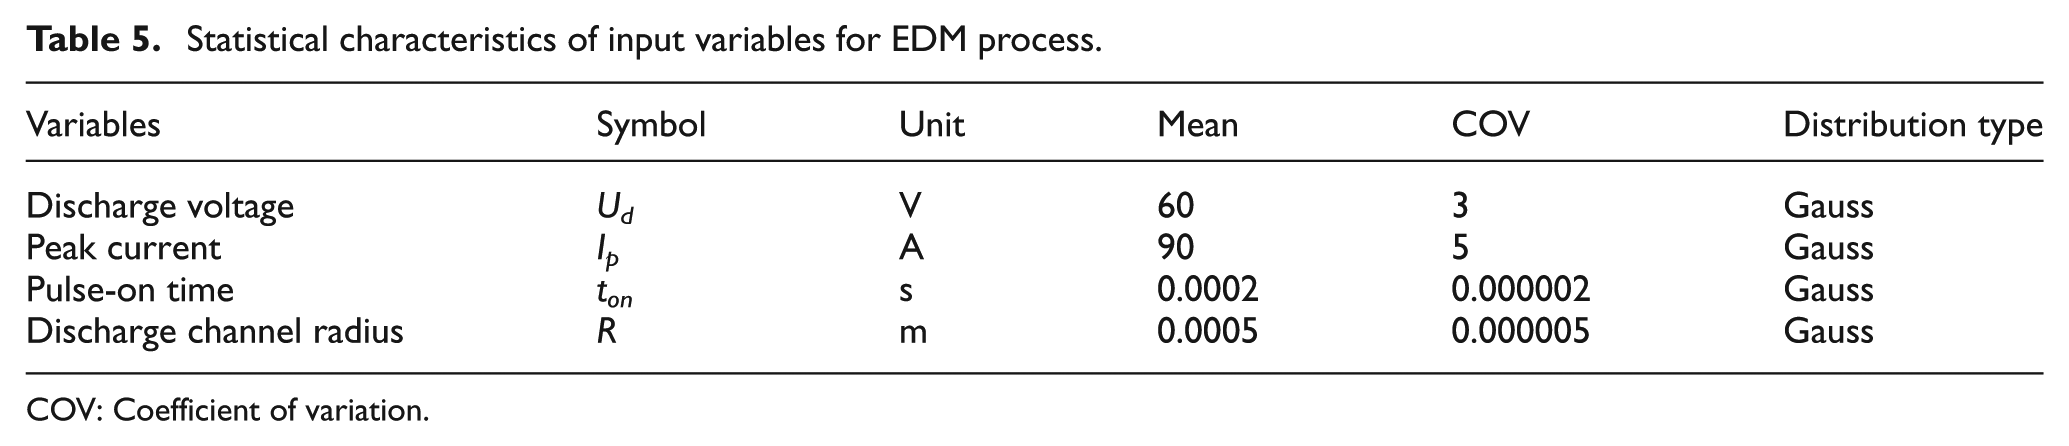
COV: Coefficient of variation.
Experiment
Some experiments were carried out on a die-sinking EDM machine as given in Figure 2 to confirm the FEM thermal model. The die-sinking EDM machine can set appropriate machining variables of current, discharge voltage and pulse duration to compare with the simulated results. For this experiment, AISI 1045 tool steel was selected as the workpiece and its dimension is 10 mm × 10 mm × 2 mm. Copper electrode with diameter of 1.5 mm was chosen to be the tool electrode. The machining is executed in commercially available emulsion for a single spark. Before and after the machining on the EDM machine, all the specimens were washed and dried. After each experiment, the machined workpiece has a discharge crater, and the depth measuring was performed by a portable measuring arm (Hexagon Stinger Iii, Sweden). And depth values were measured every 50 µm in the radius direction. Then the crater geometry can be achieved by these values. And the metallographic cross section was studied by an inverted metallurgical microscope (LW200-4CS, China). The machined morphology inspection can be carried out by scanning electron microscopy (SEM; FEI Quanta 200, Holland).
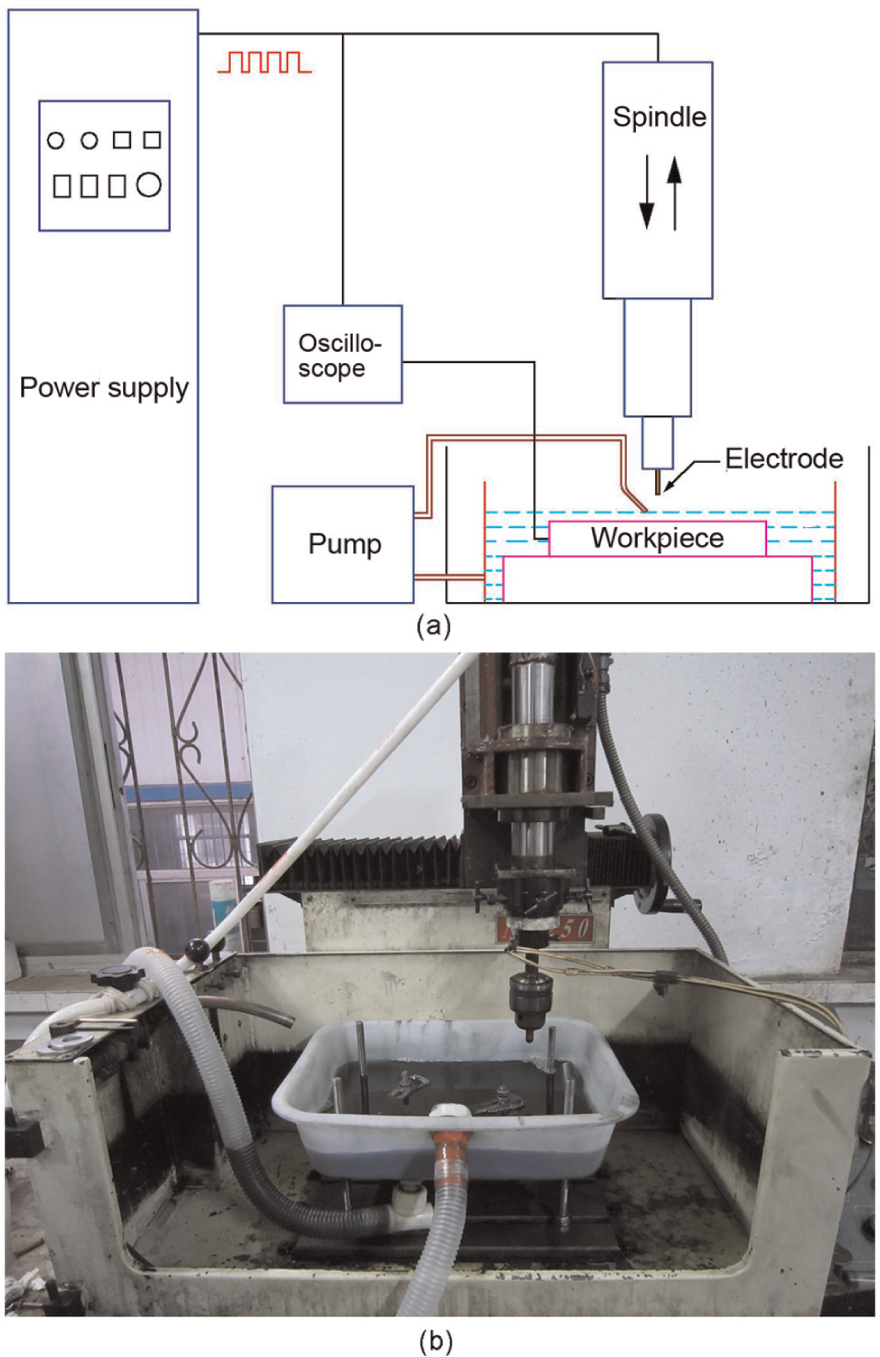
(a) Schematic diagram of the EDM experiment and (b) real photograph of the EDM experiment.
Results and discussion
Comparison of discharge crater morphology
The transient heat conduction analysis was solved by applying the heat source on the spark location (equation (2)) and the whole environment was supported to be initially at ambient temperature (25 °C). Therefore, the crater is to be generated on workpiece surface under the effect of each spark discharge and the crater obtained is circular paraboloid geometry. The crater morphology from the developed FEM model is shown in Figure 3 and has a corresponding to the experimental discharge crater morphology. From the cross-section view shown in Figure 4, the distribution of isotherm lines illustrates significant similarity with the trend of experimental crater geometry as isotherm lines have been drawn according to the melting point. The maximum temperature at the core of the workpiece is obtained where the intensity of heat flux imposed is largest. Therefore, there is a highest material removal at the center of the workpiece. Temperature decreases with the radius increase and the shape of crater cavity is longer in the radial direction than that in the depth direction.
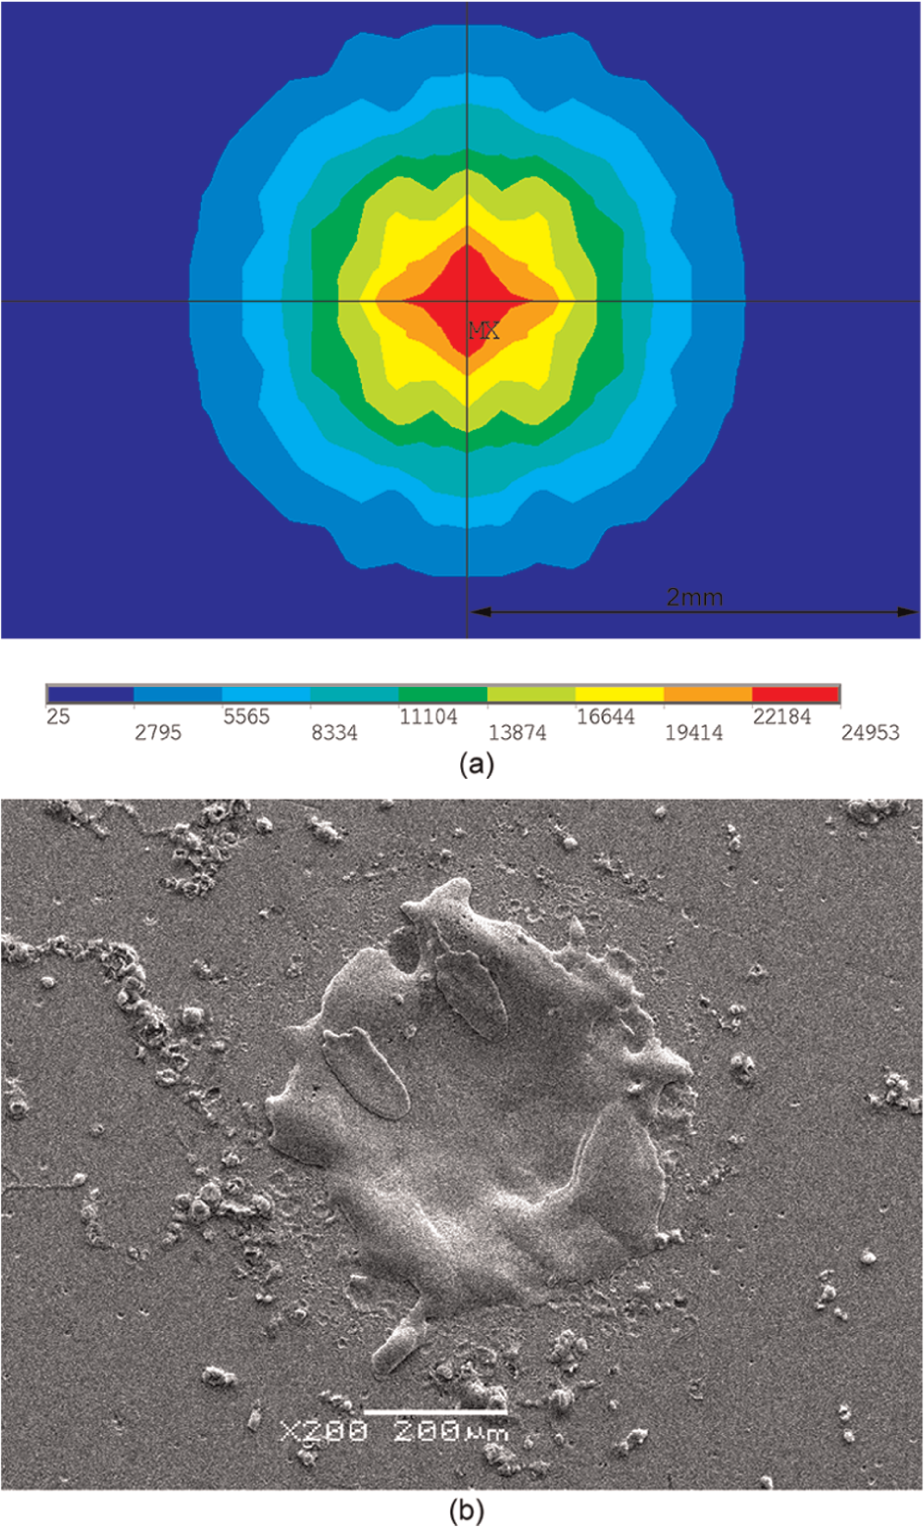
Crater morphology of a single EDM crater: (a) FEM analysis result and (b) SEM photograph of experiment result.
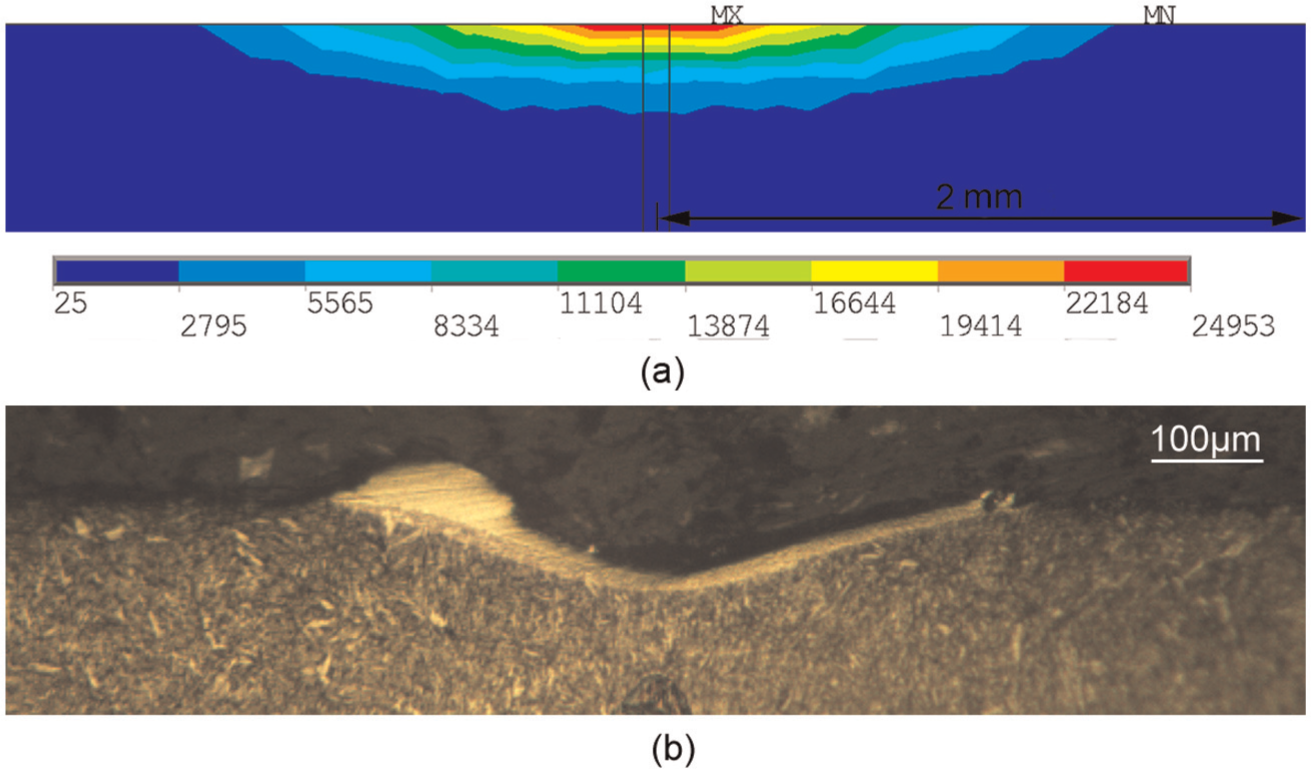
Cross-section view of the crater: (a) FEM analysis result and (b) metallographic photograph of experiment result.
It is supported that the distance from workpiece surface to that of temperature exceeding the melting point (1538 °C) corresponds to the actual discharge crater depth, taking no account of the formation of recast layer. Therefore, the isotherm line at the melting point theoretically corresponds to the crater geometry and is used to compare to the experimental crater. The material removal rate is obtained from temperature distribution profiles of the analysis result where all sparks are assumed to be effective as well as 100% dielectric flushing efficiency. Moreover, the crater geometry on the workpiece is decided by many process variables such as discharge voltage, peak current, pulse duration and thermal properties of the workpiece. Influences of some variables’ uncertainties on the temperature distribution are explicated below.
Effects of variables on the EDM process
The crater geometry under different pulse-on time (ton) is given in Figure 5(a). From this figure, we can conclude that the crater geometry of FEM analysis is quite well in shape with that of the experimental result, but a little discrepancy is observed between the two results. The removed material of the FEM model is more than the material actually removed because it is supported that the material is removed efficiently with 100% at each spark. The heat is conducted radially on the workpiece and the circular paraboloid geometry is generated. As the ton increases, the crater radius becomes larger and the depth is deeper. The ton governs the discharge time. As the heat conducted on to the workpiece lasts longer, the temperature is very high and the material removed will be more. 25 In the middle of discharge crater, the depth is very deep and the temperature is very high.
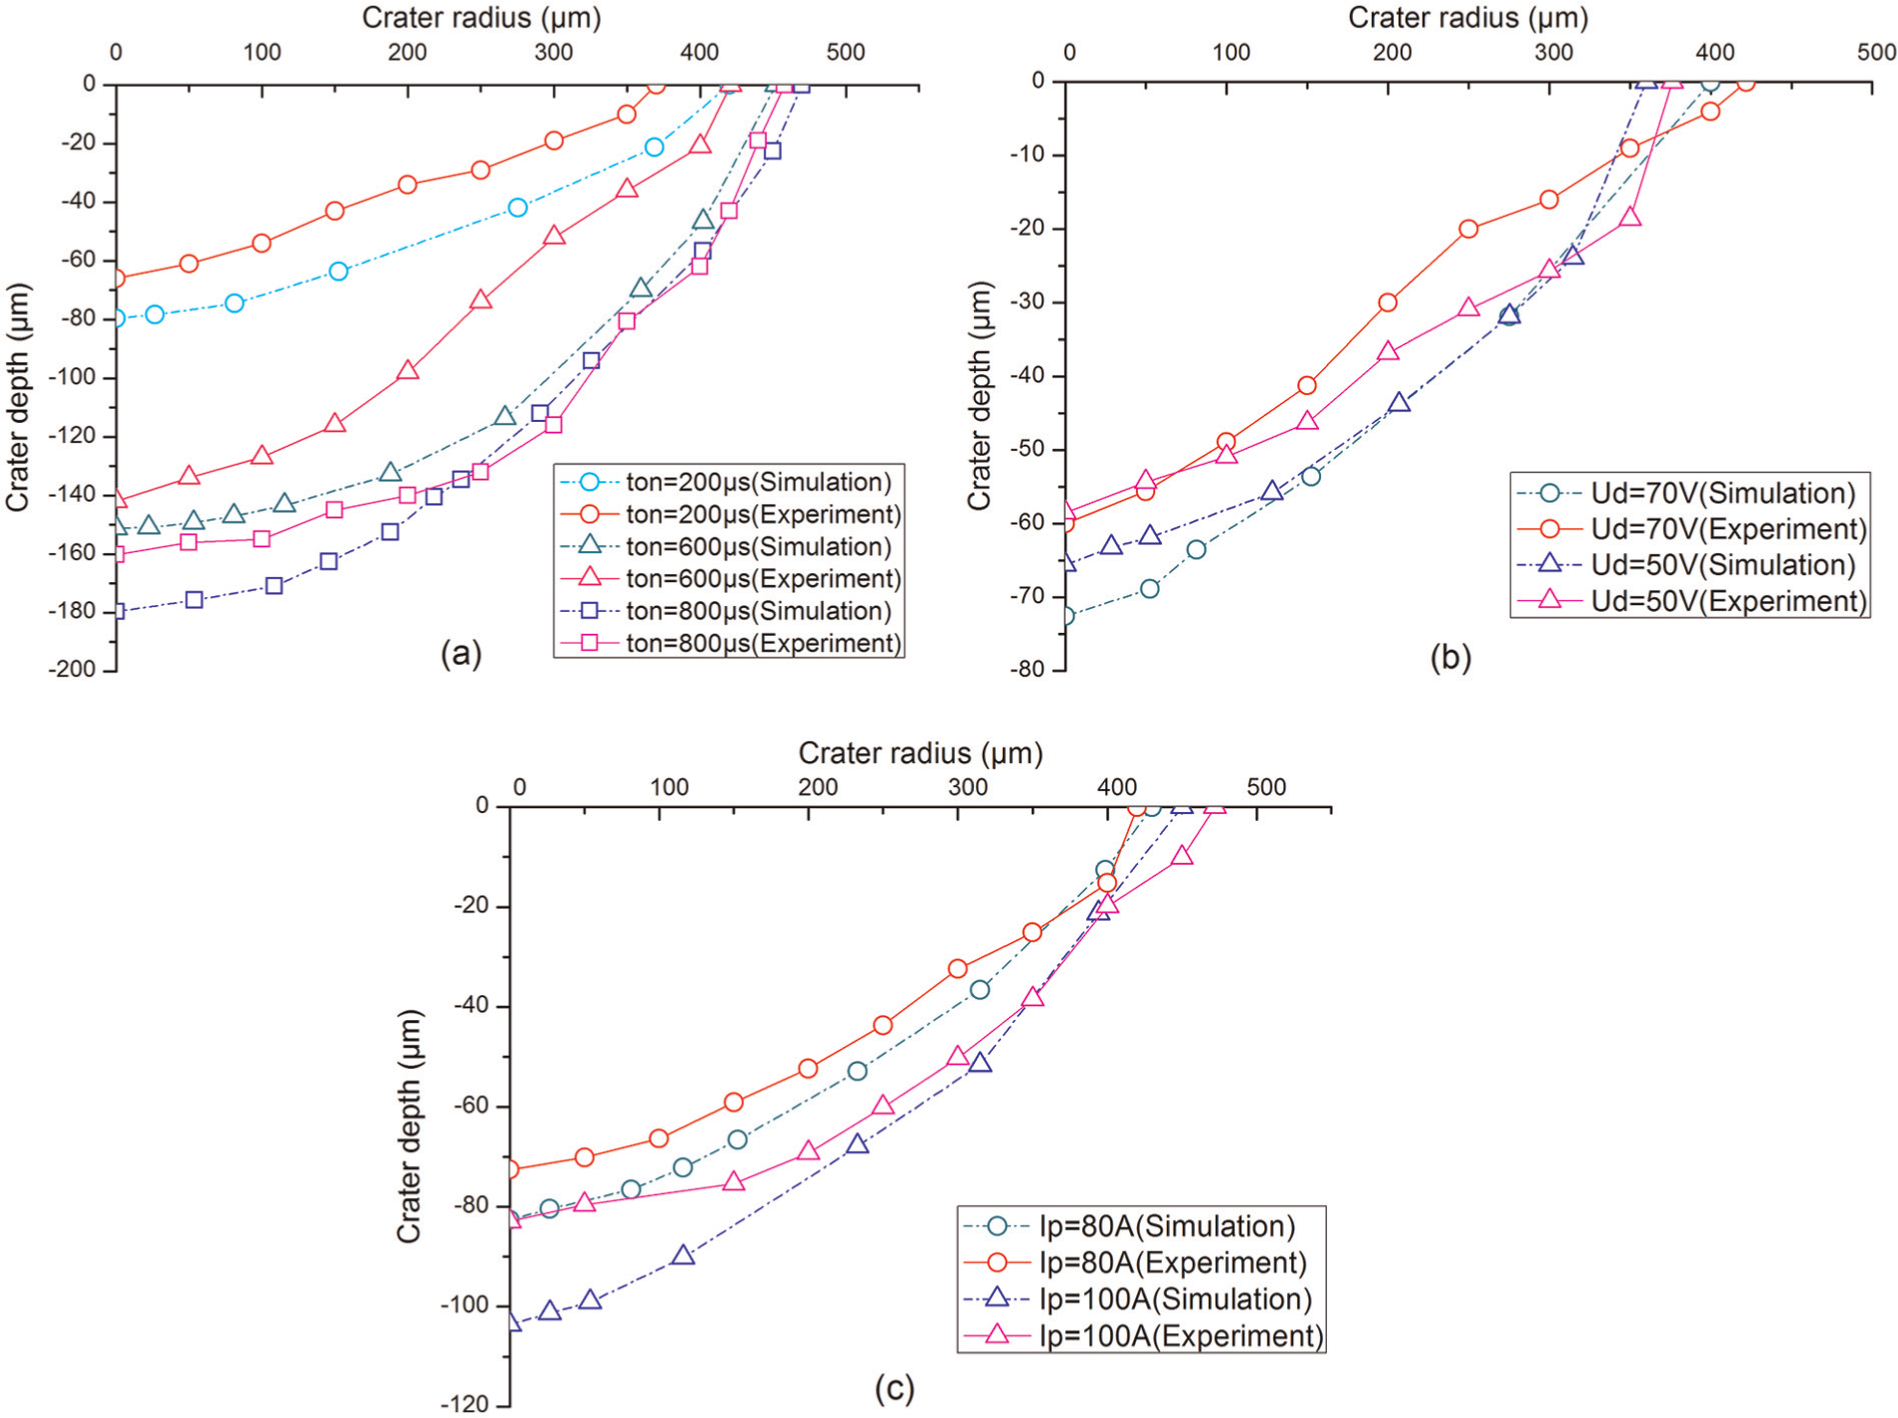
The effect of variables on the crater geometry: (a) pulse-on time, (b) discharge voltage and (c) peak current.
Similar shapes of the crater geometry have been obtained under different discharge voltages (Ud) in the FEM model and the experimental result is as shown in Figure 5(b). It is clear that the crater radius and the depth of simulation are larger than that of the experiment. The simulation by FEM is idealized and makes some assumptions, such as ideal flushing conditions, 100% spark efficiency, no ignition delays and no deposition of recast layer. During simulation process, heat is transferred from plasma to electrodes only by conduction. Therefore, whether 50 or 70 V, the crater dimensions of simulation are larger than that of the experiments. As shown in equation (3), Ud is an important factor that determines the heat influx applied on the workpiece. High values of Ud can produce greater heat influx density and larger crater. As the Ud decreases, the crater depth and radius become smaller and the material removal decreases. Therefore, lower Ud is suitable for finish machining and larger Ud is suitable for rough machining.
In Figure 5(c), the crater geometry is achieved under different peak currents. The shape and size of the crater predicted by FEM model are quite similar to the one obtained in the experiment. It can be observed that the experimental crater is shallower than the FEM predicted. This could possibly be attributed to the simplifying assumptions in our FEM models. In practice, such ideal conditions are not realized due to improper flushing of debris and arcing into the inter electrode gap during the machining with high-energy charges, thus reducing the actual MRR. However, it is very difficult to model. The results reported above show that the trends of the theoretical results predicted by our model match quite closely with the experimental results. It is also shown that Ip significantly affects the crater geometry whether in the FEM model or in experimental result. The crater depth and radius are very larger at high Ip. This variation trend is also obtained in the reported FEM model results. 26 It indicates that higher Ip can produce a larger roughness and a higher material removal, which can be used for rough machining. The Ip is also a main factor determining the heat energy generated. Larger Ip can produce more heat energy and high temperature on the workpiece which can be conducted to farther distance.
Sensitivity analysis results
Using the methods of MCS and RSM, the maximum temperature distribution histograms are shown in Figure 6. It is shown that the sampling range of maximum temperature for MCS is between 19,164 °C and 30,483 °C. And its mean value is 24,621 °C and standard deviation is 1772.9 °C. The maximum temperature range for RSM is 18,140 °C–31,656 °C, which is much higher than that for MCS. The mean value and standard deviation for RSM are 24,623 °C and 1775 °C, respectively. And they have small discrepancy for MCS and RSM. The discrepancy is due to that the sample numbers for MCS must be limited and the randomness of result parameters must be quantified.
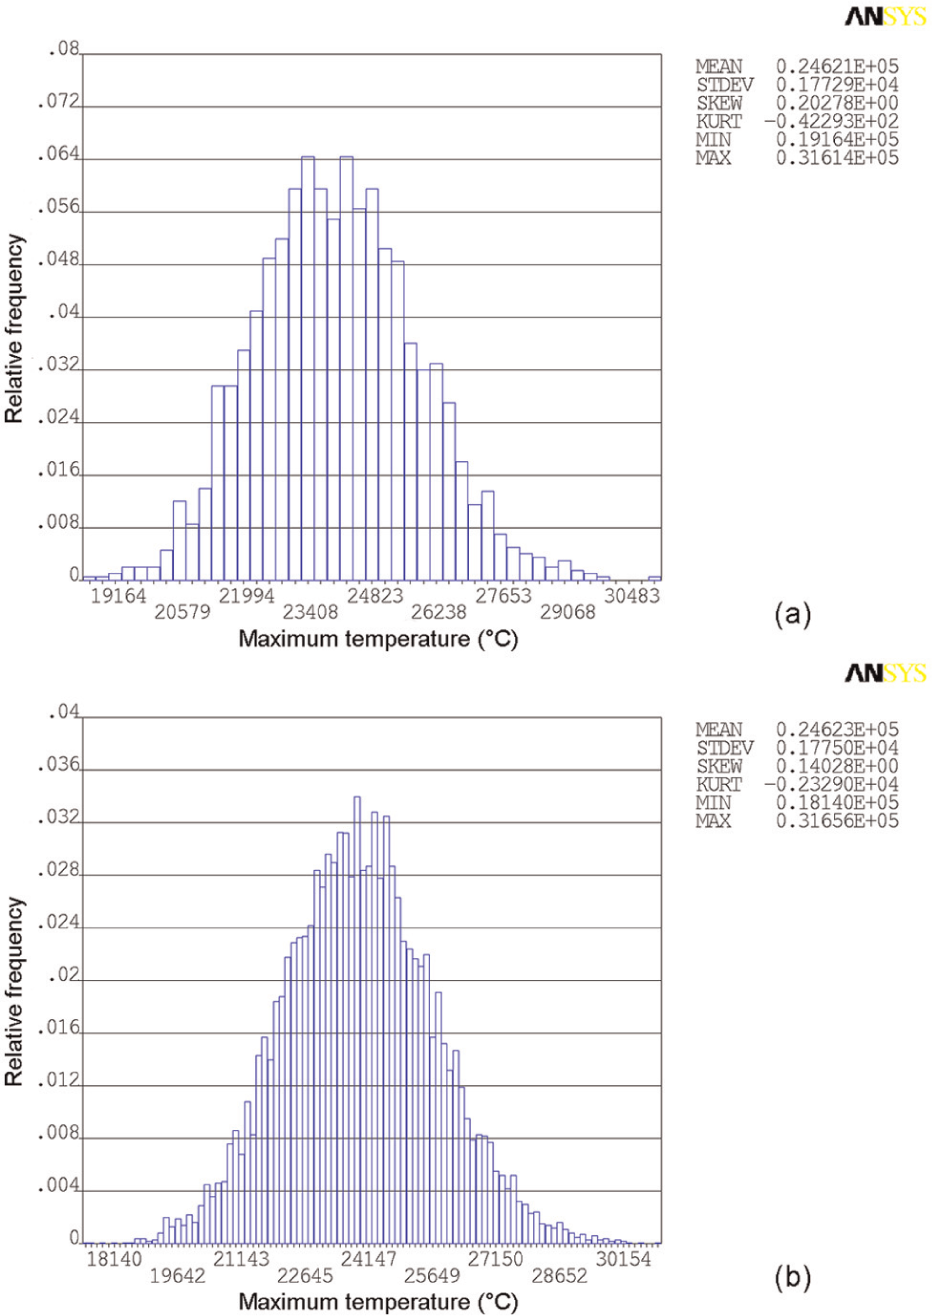
Histogram of maximum temperature distribution: (a) MCS and (b) RSM.
The cumulative distribution function of the maximum temperature is illustrated in Figure 7. The cumulative distribution function for MCS is with 95% confidence limit. The confidence limit decides the probabilities of the maximum temperature in confidence interval. Whereas the confidence limit that is characterized with the precision of results is only meaningful for the MCS. For the RSM, the precision of results depends on the precision of response surface. The value of probability can be derived at each point from the cumulative distribution curves in Figure 7. The probability for MCS and RSM is more or less the same at the maximum temperature of 25,000 °C.
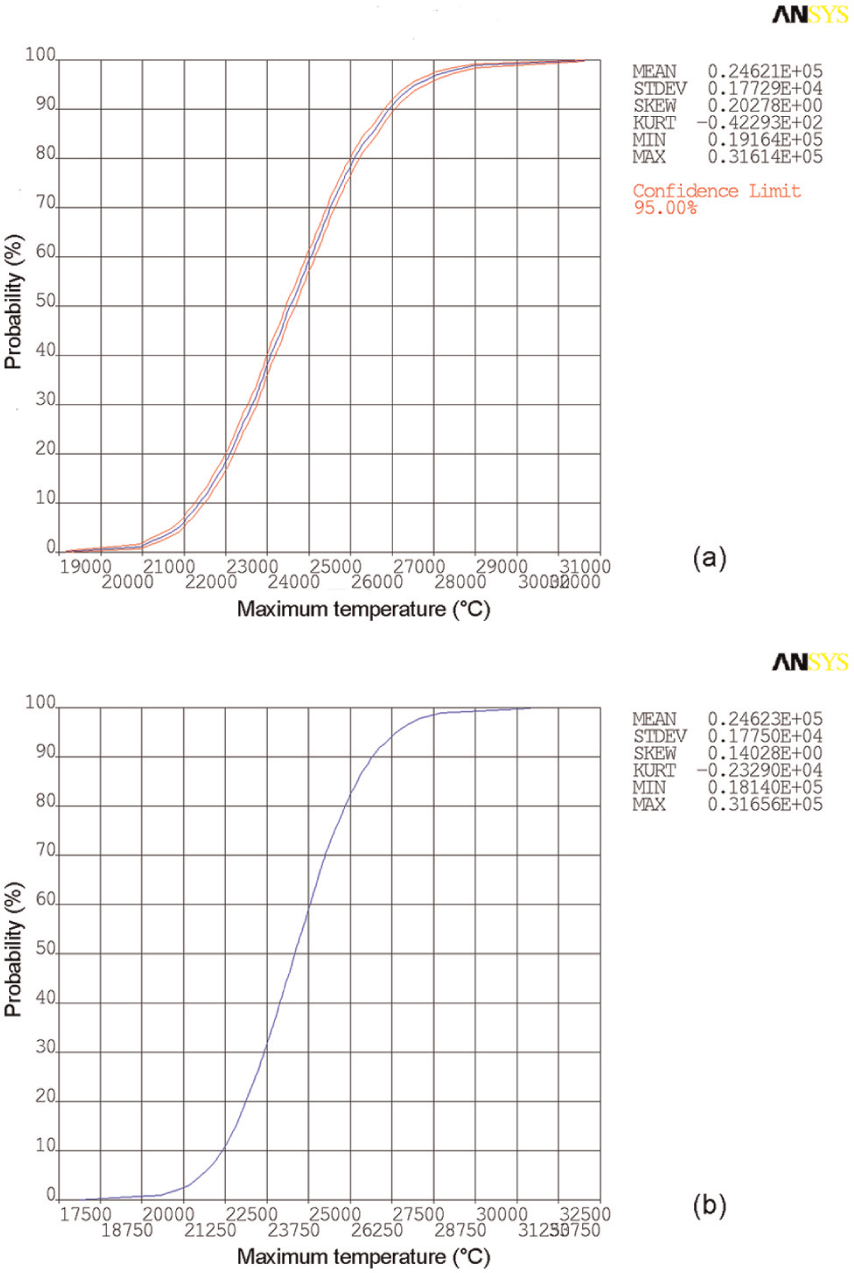
Cumulative distribution function of maximum temperature: (a) MCS and (b) RSM.
The sensitivity plot of the maximum temperature to the EDM process variables for MCS and RSM is given in Figure 8. The maximum temperature is more sensitive to the Ud and Ip, but less sensitive to ton and R. The two parameters Ud and Ip hold for nearly three-quarters of the effects on the maximum temperature. Thus, during the EDM process, discharge voltage and peak current should be paid more attention to. The Ud, Ip and ton all have positive correlation with maximum temperature, but the R has negative correlation with it. As the discharge channel radius increases, the maximum temperature of EDM processing decreases and material removal rate reduces. Constraining the increase in discharge channel radius is necessary in the EDM processing. The variation in ton has little effect on the maximum temperature.
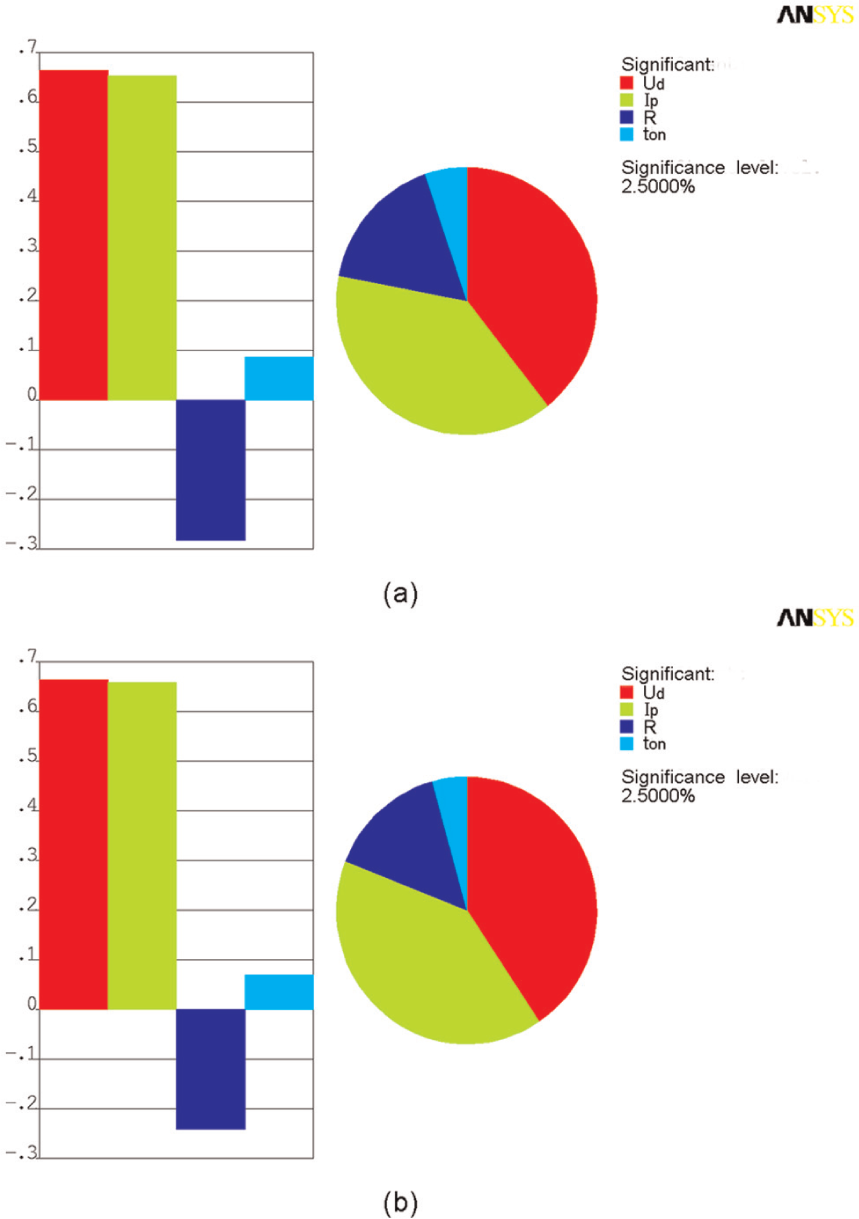
Sensitivity of maximum temperature to input parameters: (a) MCS and (b) RSM.
While the sensitivity plot indicates which random parameters have effects on the maximum temperature, the scatter plots show the distribution relationship between two variables. It can be used to validate whether the sampling points meet the correlated characteristic. The sampling points and a trend line are displayed in a scatter plot. The trend line indicates the correlation degree between the input and output variables.
Figure 9 gives the scatter plots between discharge voltage, pulse-on time and maximum temperature, where the two input variables are the most and least important input variables, respectively. The scatter of Ud has a good linear relationship with the maximum temperature. It indicates that the maximum temperature is more sensitive to the discharge voltage. But the linear relationship between the pulse-on time and the maximum temperature is bad. The sensitivity of the maximum temperature to the pulse-on time is the least. In conclusion, the linear relationship in scatter plots reflects the sensitivities of input variables. The better the linear relationship is, the more sensitivity the input variable would be. The results of scatter plots are consistent with that in sensitivity plots.
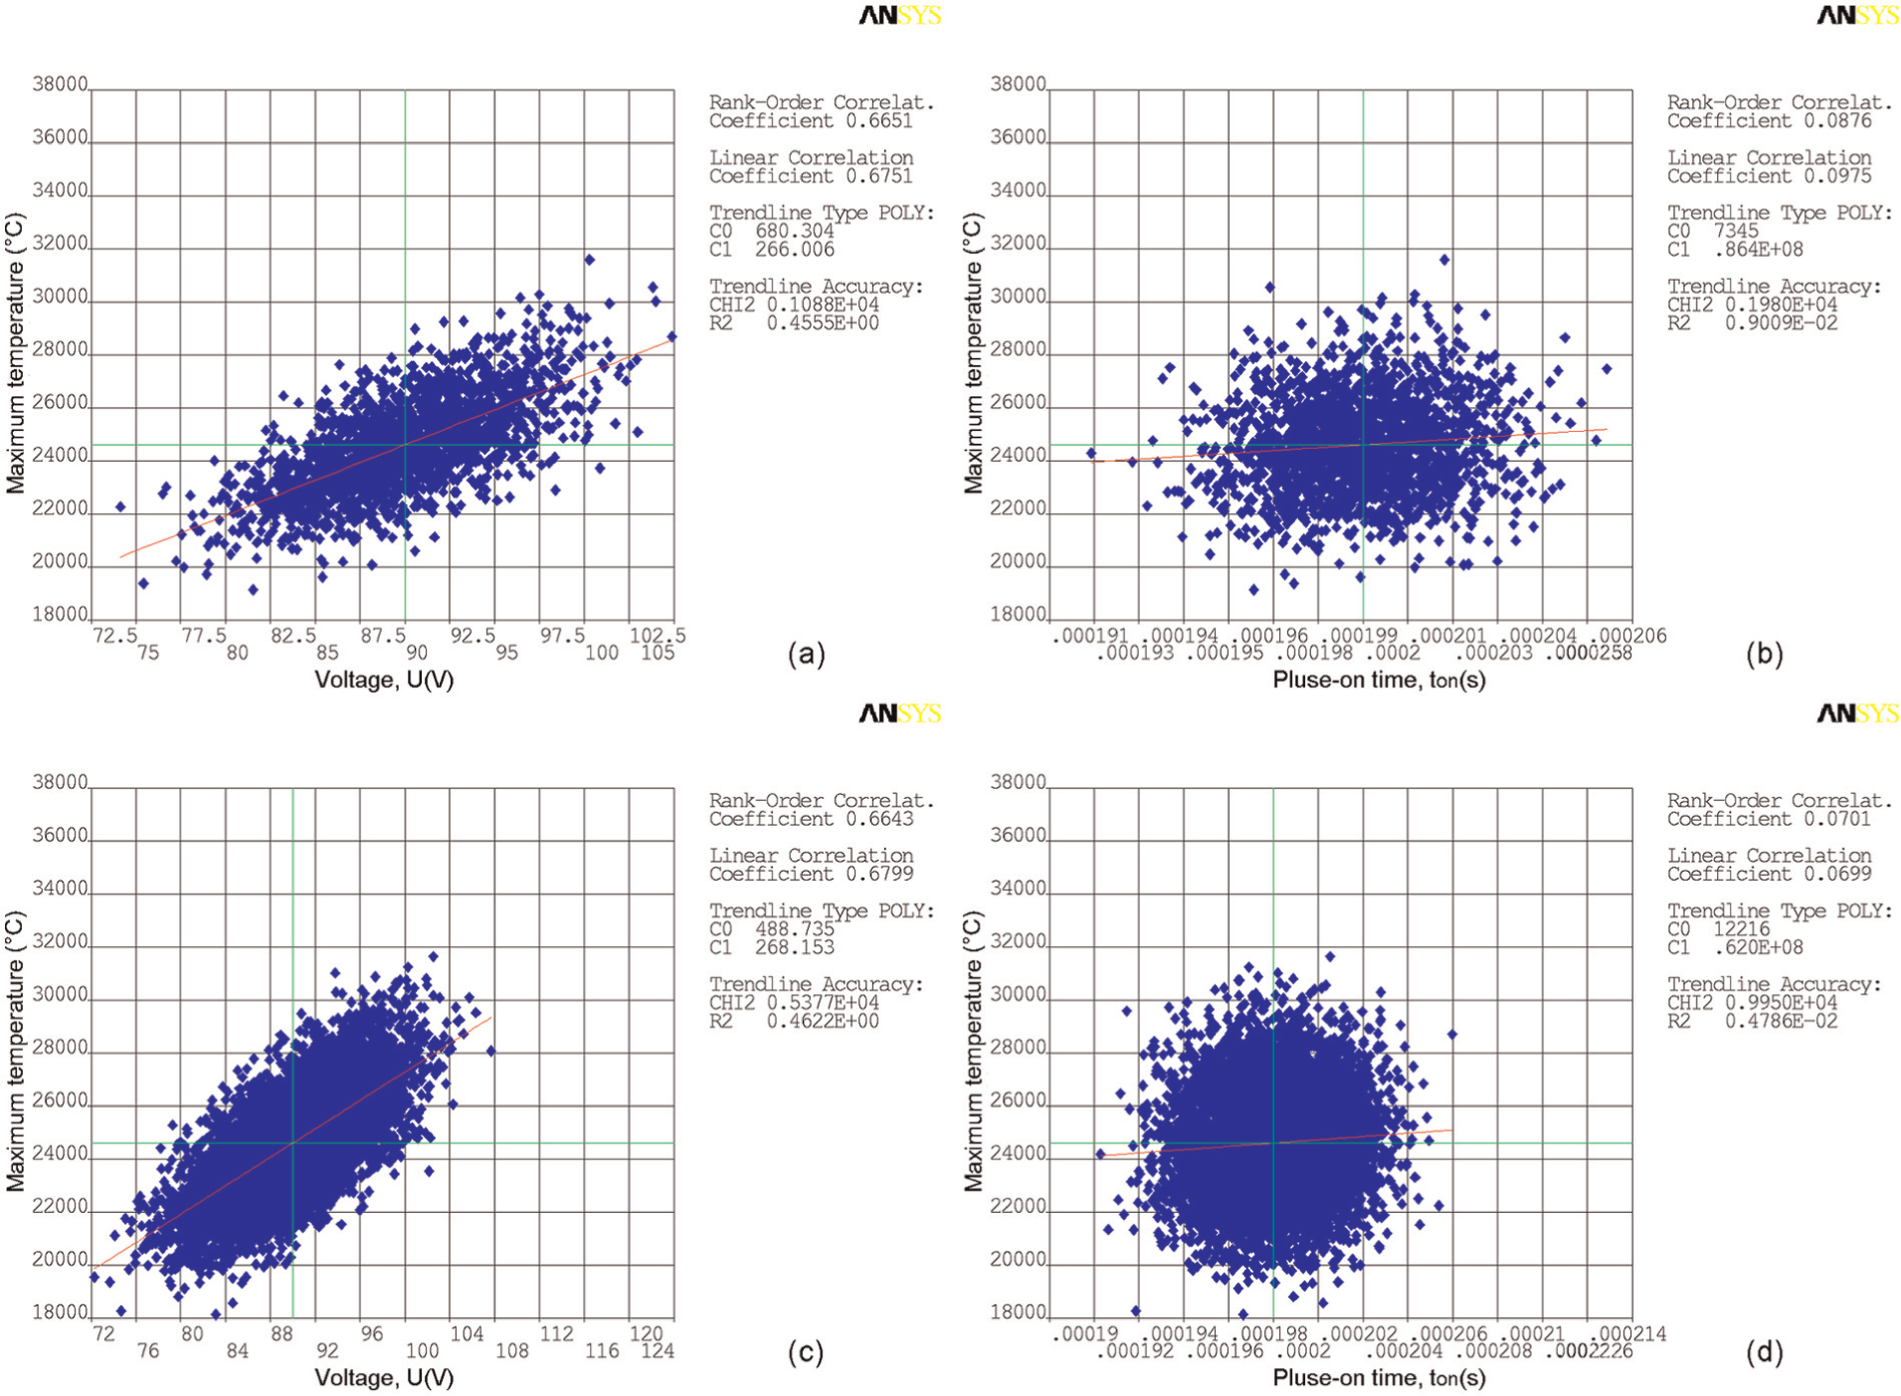
Distribution of maximum temperature with respect to (a) discharge voltage using MCS, (b) pulse-on time using MCS, (c) discharge voltage using RSM and (d) pulse-on time using RSM.
Conclusion
This work investigated the sensitivity analysis of EDM machining parameters using PDS. The influences of machining parameters including discharge voltage (Ud), peak current (Ip) and pulse-on time (ton) on temperature distribution are studied. The temperature distribution and the MRR are predicted by the FEM deterministic analysis. Many experiments are investigated to validate the FEM model.
The proposed FEM model can effectively predict the EDM process. The discharge crater predicted by the FEM model is quite similar to the experimental craters. Under the conditions of different discharge voltage, peak current and pulse-on time, the trends of material removal rate obtained by simulation is almost similar to the experimental results.
The sensitivity analysis results show that the maximum temperature has similar probabilities for RSM and MCS. The discharge voltage, peak current and pulse-on time all have positive correlation with the maximum temperature, whereas the discharge channel radius has the negative correlation. In general, the maximum temperature is most sensitive to the discharge voltage.
The most important variables for EDM process are the discharge voltage. Controlling of the process parameters can increase the removal rate and the machining efficiency. Moreover, discharge channel radius has minus effects on machining efficiency and should be limited.
Footnotes
Funding
The research was supported by Science and Technology Development Project of Shandong Province (2011GHY11520), National High-Technology Research and Development Program of China (No. 2013AA09A220), Program for Changjiang Scholars and Innovative Research Team in University (IRT1086) and Taishan Scholar Project of Shandong Province (TS20110823).