
Abstract
This article investigates the impact of dielectrics on the properties of micro-holes fabricated by micro-electrical discharge machining. Based on experiments using kerosene and deionised water as the working fluid, the machining in different dielectrics is investigated. The flow of the water is analysed by means of a flow field simulation, and corresponding experiments are also conducted to verify the simulation results. Suitable parameters are obtained to process a micro-hole array with 256 holes, a configuration widely used in printer ejector mechanisms. The average diameter of the holes is 44.47 µm, and the maximum diameter deviation is 1.3 µm.
Keywords
Introduction
Electrical discharge machining (EDM) is a non-conventional machining process that removes conductive material by means of rapid, repetitive spark discharges created by a pulse power supply, where a dielectric liquid flows between the tool and the work-piece. An advantage of EDM is that no physical cutting force exists between the work-piece and the tool-electrode. This non-contact machining process has been continually evolving from a simply tool and die machining method to micro-scale applications. Micro-EDM is the application of EDM at micrometre scales, wherein the low energy range becomes important in the EDM process. Micro-EDM has similar characteristics to EDM, except that the tool size, discharge energy, and axis movement resolutions are in the micrometre scale. 1
With the development of micro fabrication technology, industrial products and daily necessities are undergoing increasing miniaturisation and precision. Micro fabrication technology has been widely used in the fields of aerospace, communications, printing, electronics, and textiles, among others. Many key structural components in these fields, such as turbine engine blades, optical fibre connectors, printer nozzles, high-density flexible printed circuit boards, gratings for electronic microscopes, and chemical fibre spinneret structures, contain array holes with progressively smaller sizes, requiring higher machining accuracy.2–5 In particular, ejector parts in digital printing equipment are typical examples of components that require small array holes in large quantities made with a high machining accuracy. This remains a challenge to the development of micro-hole array machining.
The dielectric plays an important role in the micro-EDM process, as it is used to cool the electrode and the work-piece, and remove the debris produced during the discharge. There are two types of dielectrics, oil-based and water-based, which are appropriate for different situations. Kerosene exhibits better insulation properties, and is hence conducive to forming a discharge channel in the EDM process. As a result, kerosene is used in high-precision machining. However, the high discharge temperatures can decompose the kerosene and cause carbon elements to adhere to the electrode surface, which affects the normal discharge process.6,7 In addition, kerosene has other disadvantages, such as smell, a very low ignition point, and the potential to ignite if used improperly. Another point worth noting is that the kerosene will be heated during EDM, and the increased liquid temperature will reduce the material removal rate (MRR) due to the poor thermal conduction of kerosene. In comparison, pure water has higher thermal conductivity (about four times that of kerosene), a lower viscosity coefficient, and higher flowing velocity. As a result, the working time has little influence on the temperature of the pure water, and thus a higher MRR is sustained. 8 Because of its advantages, deionised water has increasingly been used as a dielectric in EDM, especially in the micro-EDM field.9–11 Therefore, an experiment to compare the effects of kerosene and deionised water in micro-EDM will be conducted in the first section of this study to choose the most effective dielectric for machining micro-hole arrays.
It should also be noted that the discharge gap is very small in micro-EDM, and the flow of the dielectric in the discharge gap is complex. Thus, direct measurement of the flow field in the micro-EDM discharge gap is very difficult to perform. It has been found that a numerical simulation of the flow field in the EDM discharge gap is a useful means of investigating this issue. 12 Thus, in the latter sections of this article, FLUENT software was used for simulation studies, and corresponding experiments were conducted to verify the simulation results.
Choice of dielectric
Micro-EDM has high requirements for the insulation resistance and flow properties of a dielectric. Therefore, a study of dielectric suitability is essential, and the appropriate processing performance for specific micro-hole arrays should be researched in depth.
Set-up of the micro-EDM system
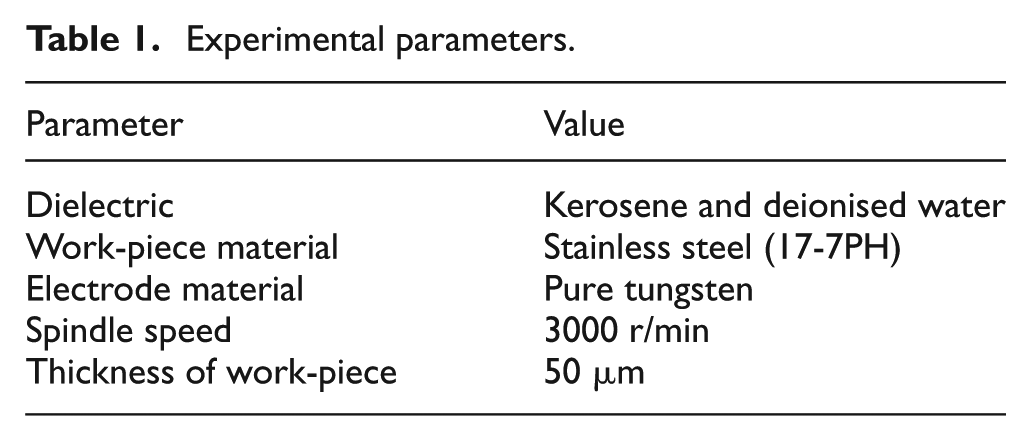
Figure 1 is a schematic diagram of the micro-EDM system developed by the Harbin Institute of Technology. The micro-EDM system contains a unit of motion control functions for each axis, a pulse power supply, and a corresponding servo control system. In addition, a dielectric supply system is needed to import the dielectric. An auxiliary visual observation system is added to the micro-EDM system to observe the electrode changes during the process. A block electrical discharge grinding (BEDG) is used to machine an electrode with diameter of 500 µm to an electrode with diameter of about 100 µm, and wire electrical discharge grinding (WEDG) is further used to machine it to an electrode with diameter of about 44 µm. The BEDG has the advantage of high efficiency, and the WEDG has the advantage of high accuracy. Combining BEDG and WEDG enabled the online processing of the fine tool-electrode, whose diameter can be stably controlled at less than 45 µm, whose maximum diameter deviation was about 1 µm. Table 1 shows the experiment parameters.
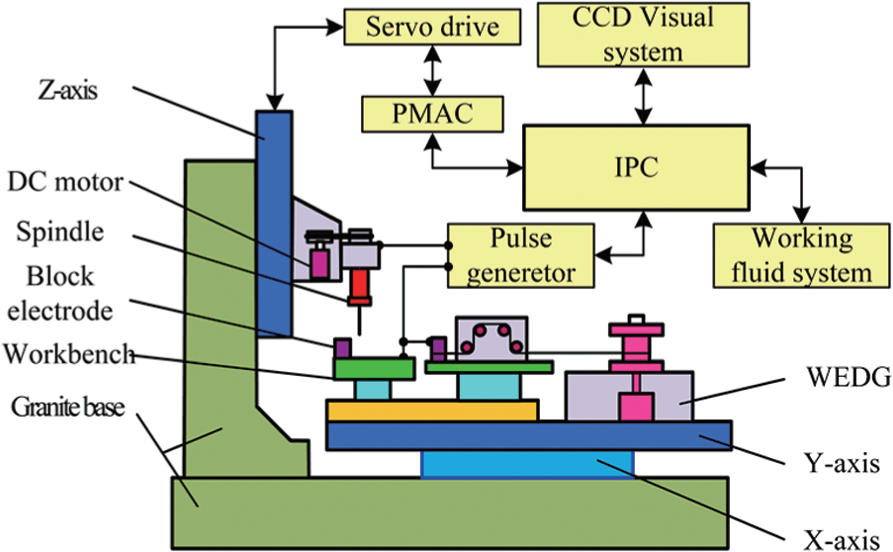
Schematic diagram of the micro-EDM system.
Experimental parameters.
Comparison experiment
Micro-EDM is usually conducted in some dielectrics, and the effect of dielectric on micro-EDM is determined by its physical properties. Table 2 lists the physical properties of the typical dielectrics, kerosene, and deionised water.
Physical properties of deionised water and kerosene.
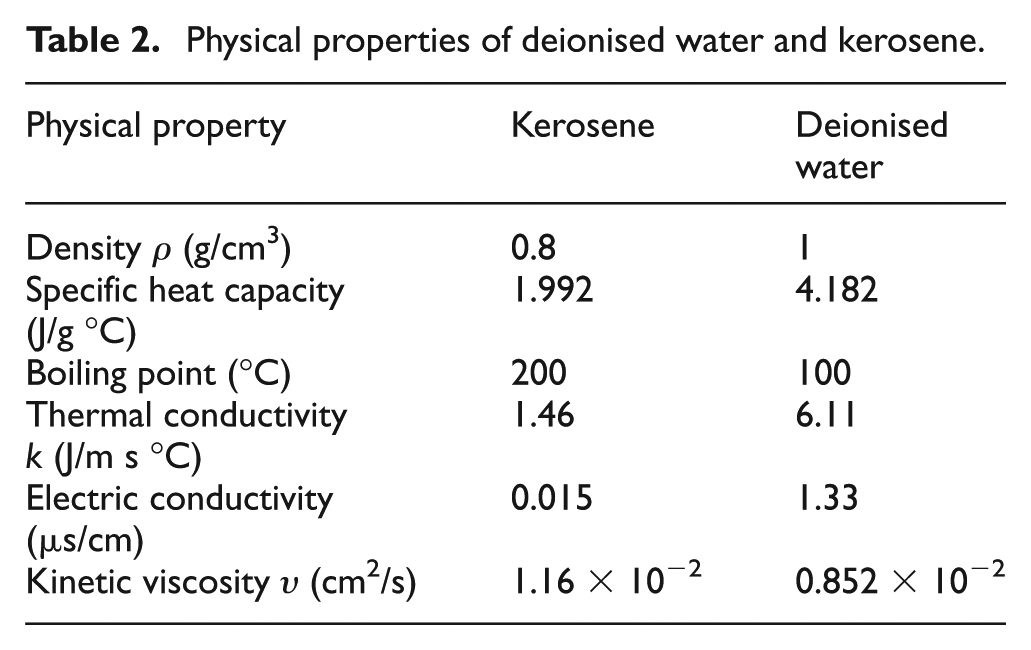
From Table 2, it is clear that kerosene and deionised water have different insulation properties, and thus machining with the rushing of deionised water and kerosene may produce different phenomena and results.
When machining array holes by micro-EDM, machining accuracy, efficiency, and stability of machining status, and electrode wear should be all considered. With other processing conditions left unchanged, kerosene and deionised water were used as dielectrics to machine array holes by micro-EDM. Hole sizes, processing efficiency, and electrode wear after machining were compared for these two different dielectric fluids.
When using electrodes of identical diameters to process micro-hole arrays, the size of a hole is mainly determined by the discharge gap. Discharge gap sizes for the different dielectrics are shown in Figure 2(a), where it is clear that the discharge gaps are closer in size for each open-circuit voltage than they are for different voltages. Theoretically, the thermal insulation of deionised water is worse than that of kerosene, so a larger discharge gap should occur in deionised water. However, this theoretical analysis is not entirely consistent with the experimental results, which show all discharge gaps to be small for low voltages, and little difference in the discharge gap for the different dielectrics. The main reason for these results is the small discharge energy in the micro-hole array machining experiment.
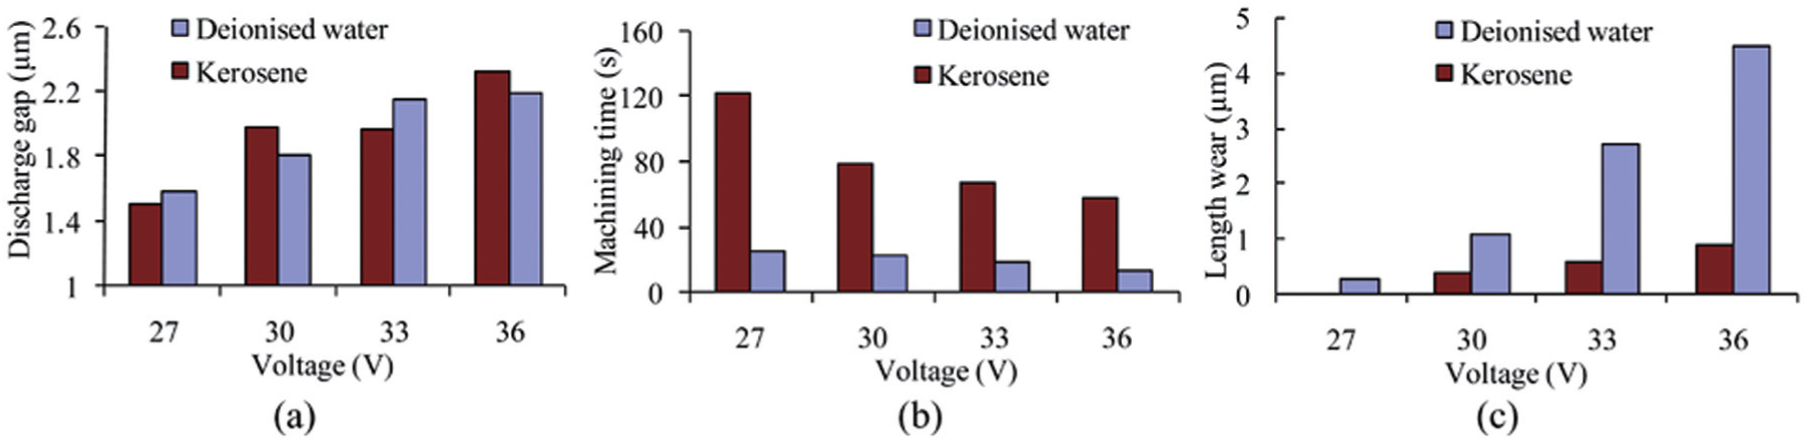
Effects of dielectrics on the size of (a) the discharge gap, (b) the machining time, and (c) the length wear of an electrode.
From Figure 2(b), it can be seen that the machining time in deionised water is much lower than that in kerosene for the same open-circuit voltage; that is, the processing efficiency is much better in deionised water. For open-circuit voltages of less than 27 V, machining is particularly difficult in kerosene and the machining time is over 2 min. In terms of electrical parameters, a high voltage must be used to ensure normal discharge in kerosene; otherwise, it is difficult to maintain a normal discharge gap. If the open-circuit voltage is small, the discharge gap will also be small, and this will result in unstable processing.
In terms of the physical properties of the dielectric, there are two explanations for this result. The first observes that the coefficient of viscosity is larger for kerosene, which thus has poorer flow and ultimately performs worse at debris removal. Additionally, carbon elements are decomposed from the kerosene at a high temperature; these carbon elements will adhere to the electrode and form an integrated carbon, affecting normal discharge and decreasing processing efficiency. Deionised water, however, does not contain carbon elements and hence does not produce the above situation. The second explanation notes that deionised water is decomposed into hydrogen and oxygen in discharge. Studies have shown that providing oxygen to the discharge gap between the tool-electrode and the work-piece can improve the removal rate of work-piece material. 13 Moreover, the bubbles generated during processing are also conducive to removing corrosion during discharge, and thus improve processing efficiency.
In this experiment, the change in length of the electrode is the most obvious example of electrode wear. The measured difference in the length of the electrode before and after processing is termed length wear. This is shown for deionised water and kerosene in Figure 2(c). For each open-circuit voltage, length wear in kerosene is smaller than in deionised water. However, the unusual electrode wear results in kerosene may be caused by instability effects, as it was observed that processing in kerosene produced more short circuits at low voltages, since these voltages could not maintain normal discharge. That is to say, electrode wear is less in kerosene, but this result was obtained under abnormal processing conditions.
Figure 3(a) and (b) shows images of electrodes after machining ten holes at different open-circuit voltages. The electrode tips are quite different after processing in the two dielectrics: after processing in deionised water, the tips are arced, the length of the deformation region is smaller, and the electrodes are more stable in shape; after processing in kerosene, the tips are conical, the length of the deformation region is larger, and the electrode surface morphology is poorer. When the electrode tip is more tapered, the cross-sectional area of the tip of the electrode becomes smaller; this is likely to cause unstable discharge and impact upon the size and shape of the processed hole.
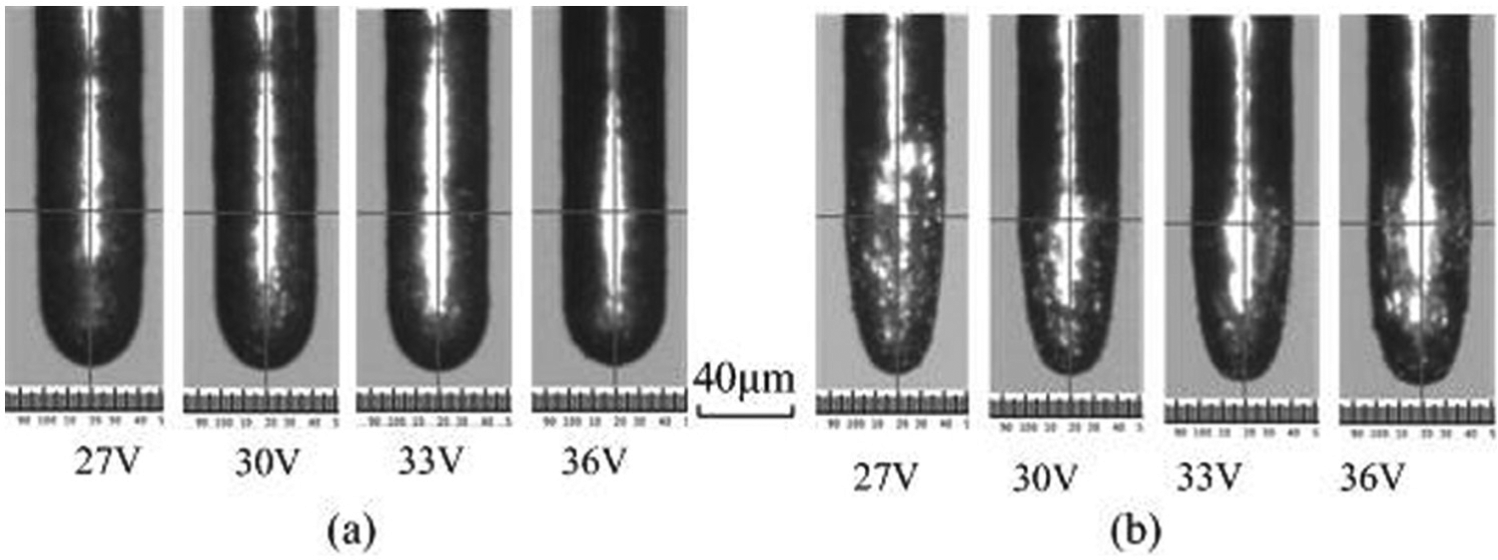
Images of electrodes after processing (a) in deionised water and (b) in kerosene at different open-circuit voltages.
Figure 4(a) and (b) is scanning electron microscope (SEM) images of micro-holes processed in deionised water and kerosene, respectively. It can be seen that micro-holes processed in deionised water have fewer edge burrs and better surface morphology.
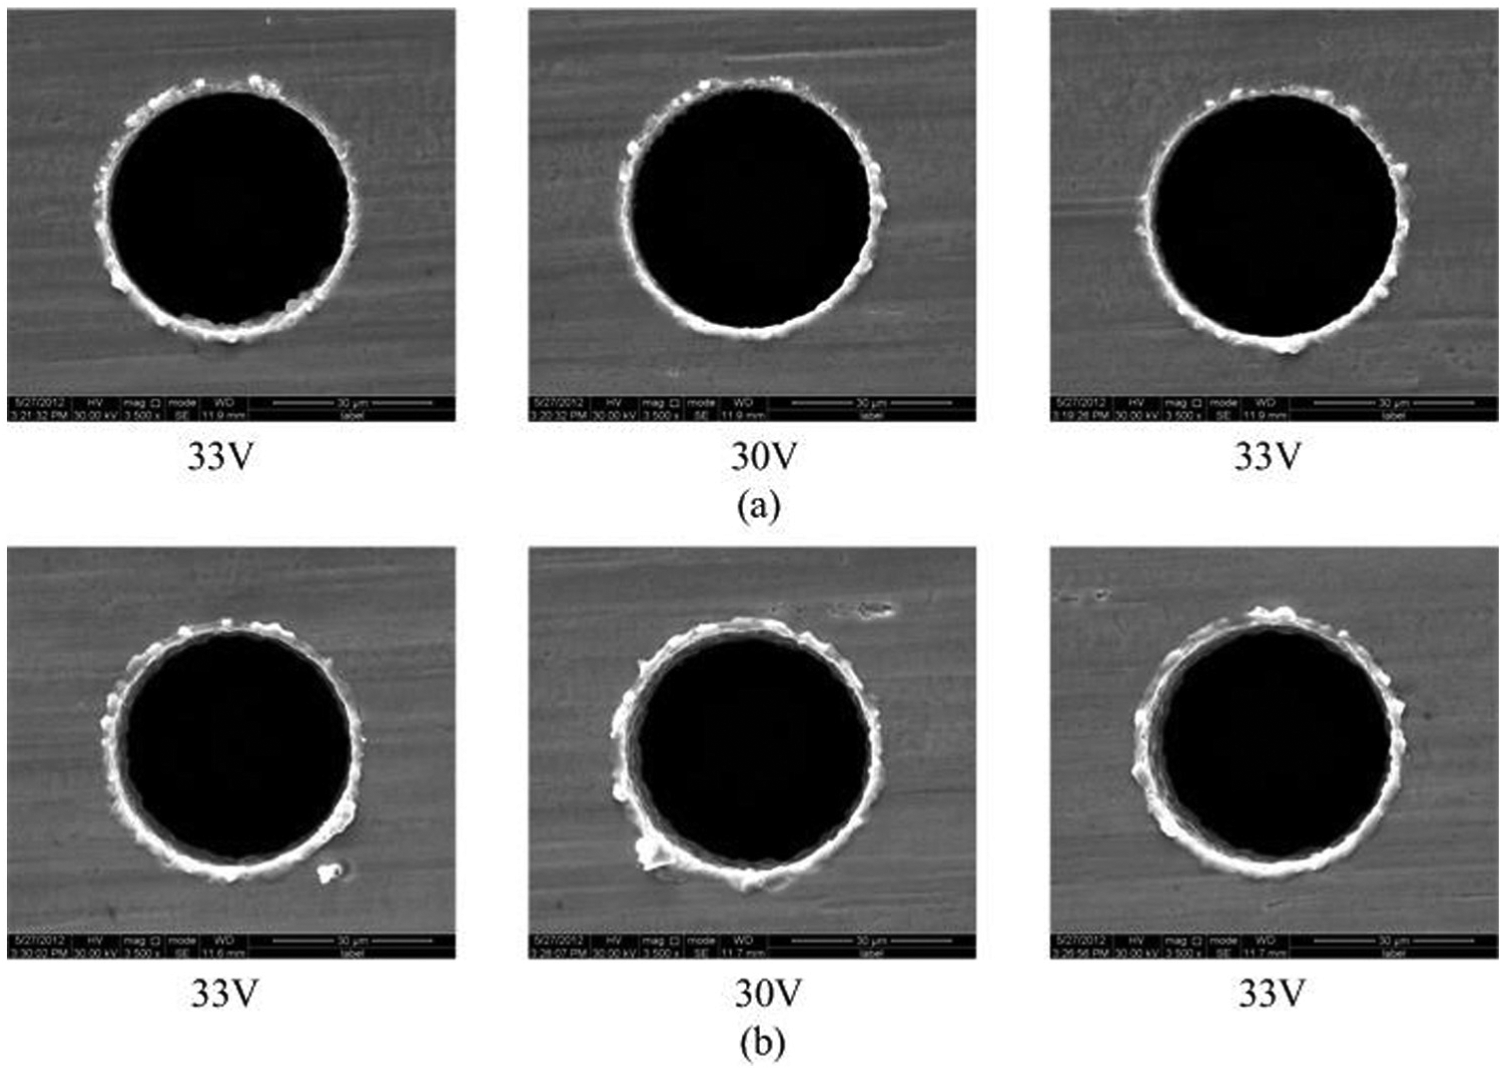
SEM images of micro-holes machined (a) in deionised water and (b) in kerosene at different open-circuit voltages.
Through the comparisons given in this section, it is clear that the processing performance of micro-EDM in deionised water is better than in kerosene: it allows appropriate control of the discharge gap, gives higher processing efficiency, and yields better micro-hole surfaces. Considering the above analysis, deionised water is chosen as the dielectric for micro-hole array machining.
Simulation analyses in the flow field of deionised water
Machining of array holes by micro-EDM often occurs in a liquid medium, with the eroded work-piece and electrode material moving with the flow in the flow field of the discharge gap. The flow conditions of the dielectric in the discharge gap determine the state of the eroded material and affect discharge in the gap, which is directly related to processing efficiency and machining accuracy. Therefore, the flow field of the discharge gap is quite important when processing micro-hole arrays and must be studied deeply. This article uses FLUENT software to perform simulation studies.
Theoretical model of the dielectric field
In order to facilitate analysis, calculation, and simulation of the flow field in micro-EDM, the following assumptions are made:
The dielectric (i.e. deionised water) in micro-EDM is incompressible;
The dielectric flow field is invariant after reaching stability;
Small eroded particles in the working flow field have negligible influence and can be ignored; and
The temperature of the deionised water is largely unchanged, so the flow field is in a thermostatic state.
Based on the above assumptions, the continuity equation of the dielectric can be expressed as
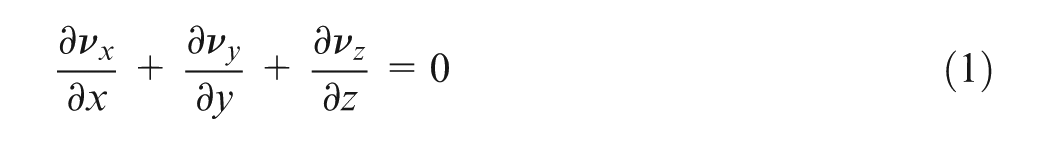
The Navier–Stokes equations can be simplified as
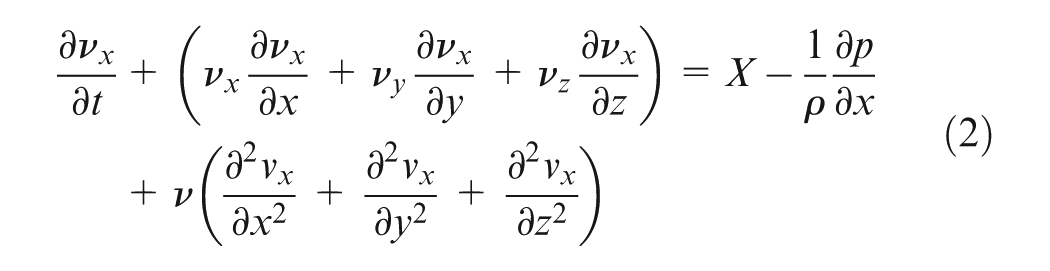
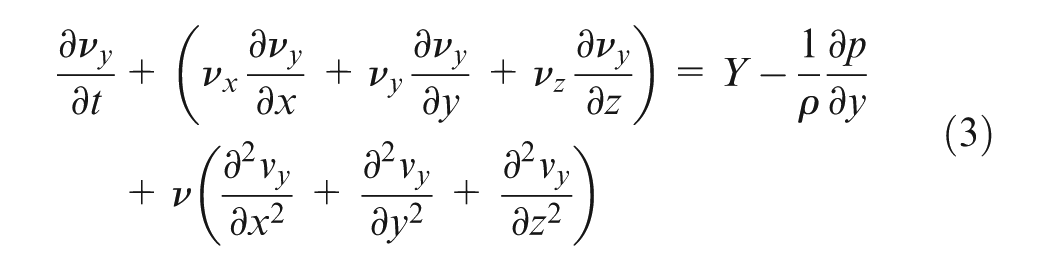
and
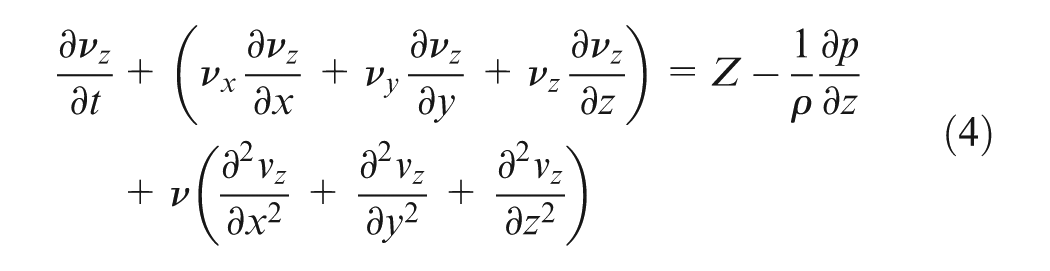
Here,
Geometric model and meshing
Rushing dielectric fluid is normally injected into the side of the electrode in micro-EDM. Figure 5(a) is a schematic diagram of rushing water in micro-EDM. Figure 5(b) is a schematic of a system that can recycle and reproduce deionised water.
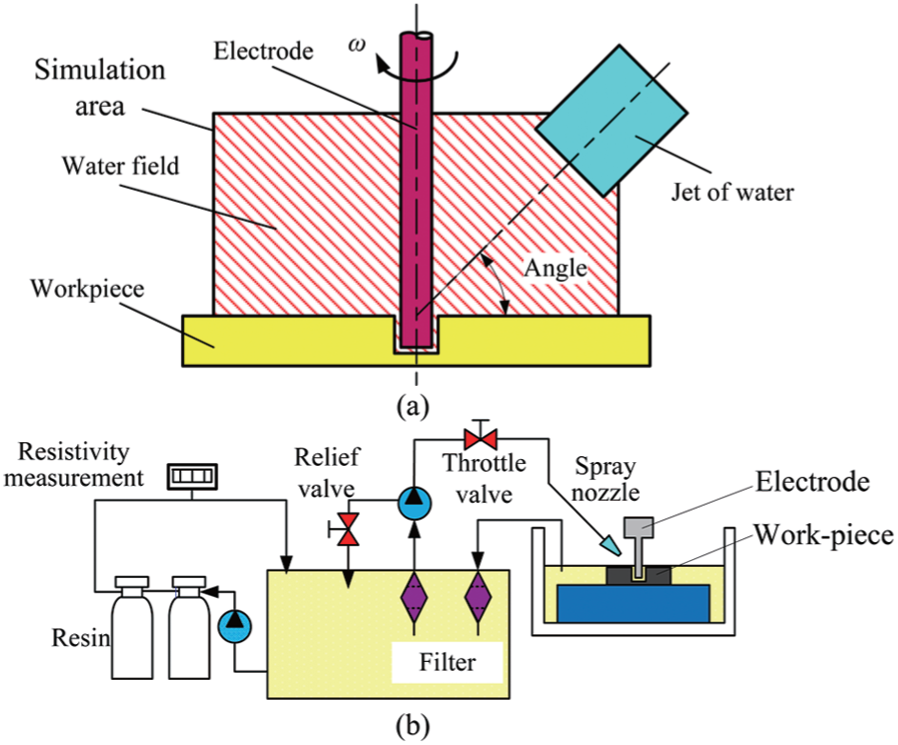
(a) Schematic diagram of rushing deionised water in micro-EDM and (b) schematic diagram of the deionised water system.
Gambit software was used to establish a three-dimensional (3D) geometric model of the dielectric field, as shown in Figure 6(a). As the small area between the electrode and the work-piece is the focus of the simulation study, a refined mesh is required. Figure 6(b) shows the completed model constructed with a mesh of tetrahedral elements.
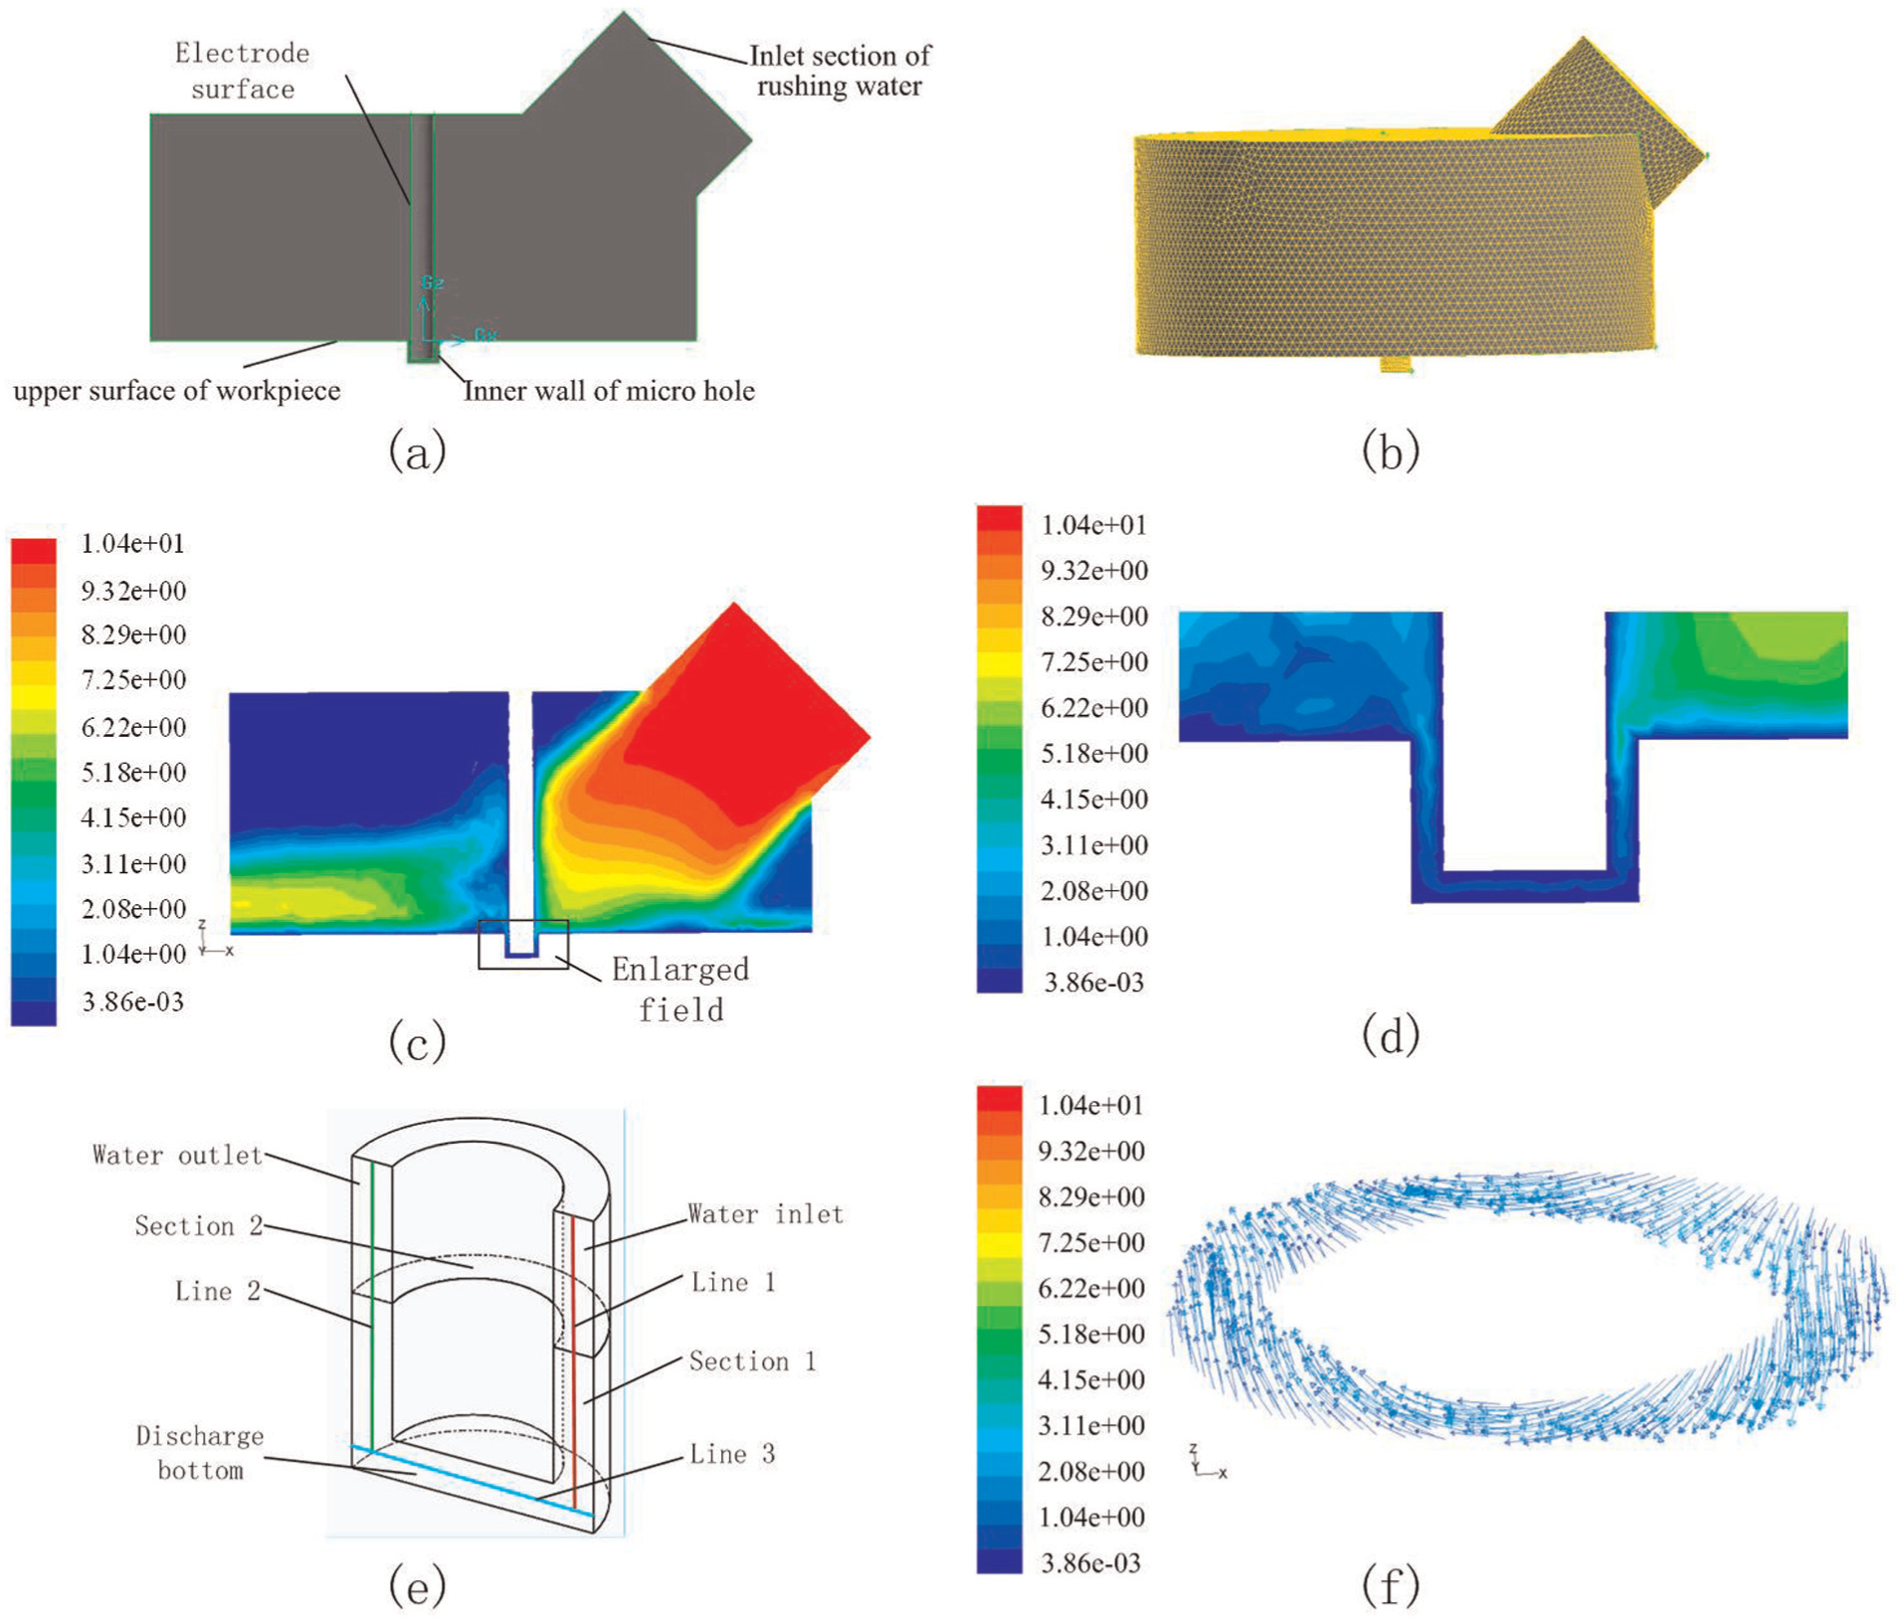
(a) Cross-sectional view of the 3D geometric model for fluid simulation, (b) geometric model with tetrahedral meshing, (c) velocity nephogram (section 1) of the main section, (d) enlarged velocity nephogram showing discharge gap, (e) profile of the discharge gap, and (f) velocity field at section 2 of (e).
Boundary conditions and setting of simulation parameters
The boundary surfaces of the geometric model in the flow field simulation are given in Figure 6(a). The inlet section for rushing water is set as the velocity-inlet boundary; the flow velocity and direction can be set to different values in the simulation. The electrode surface, the inner wall of the micro-hole, and the upper surface of the work-piece are set as wall boundaries (the electrode surface is a rotating wall boundary that can be set to different velocities). Other boundaries are the interface between the dielectric regions and the outside; these are set to pressure-outlet boundary conditions. The external condition is set at standard atmospheric pressure, and the hydrostatic pressure of the border is 0 Pa. The fluid is deionised water, the calculation model is a turbulence model, and
Results and analysis of simulation
The inlet velocity of the dielectric flow was set to 10 m/s and the rotation speed of the electrode is set to 3000 r/min. The main section is the axis of rushing water; the axis of the electrode is also selected as a section. The velocity nephogram of the main section is shown in Figure 6(c). The rushing state in the discharge gap between the electrode and work-piece is the main area of concern, so an enlarged velocity nephogram showing the discharge gap is provided in Figure 6(d).
Figure 6(e) is a schematic cross-sectional view of the discharge gap, parallel with the electrode axis. Figure 6(f) is the velocity vector plot of section 2 in Figure 6(e), which is parallel with electrode radial. From Figure 6(d), the direction of fluid flow in the gap can be seen clearly: the fluid flows into the gap from one side and flows out on the other side after aggregation. The boundary of these two sides is mainly in the centre of the cross-section, and in this position, the fluid flows in a horizontal direction. After the fluid enters the discharge gap, it reaches the outlet area from the bottom and sides of the electrode.
The velocity of fluid flowing into and out of the discharge gap greatly affects the rushing debris during discharge. The velocity at the centrelines of the inlet and outlet sides of the discharge gap (lines 1 and 2 in Figure 6(e)) can be derived from the simulation results, as shown in Figure 7(a). After the fluid flows into the gap, its speed gradually reduces due to frictional resistance and particle collision; the velocity drops to approximately 0.7 m/s when the fluid reaches the bottom of the discharge gap. If the fluid velocity at the bottom of the gap is to increase, a corresponding velocity increase must occur at the inlet. As there is loss after the fluid passes the electrode and reaches the outlet, the outlet velocity is smaller than the inlet velocity. However, the inlet velocity and the velocity halfway down line 2 is nearly the same, which is conducive to rushing discharge debris.
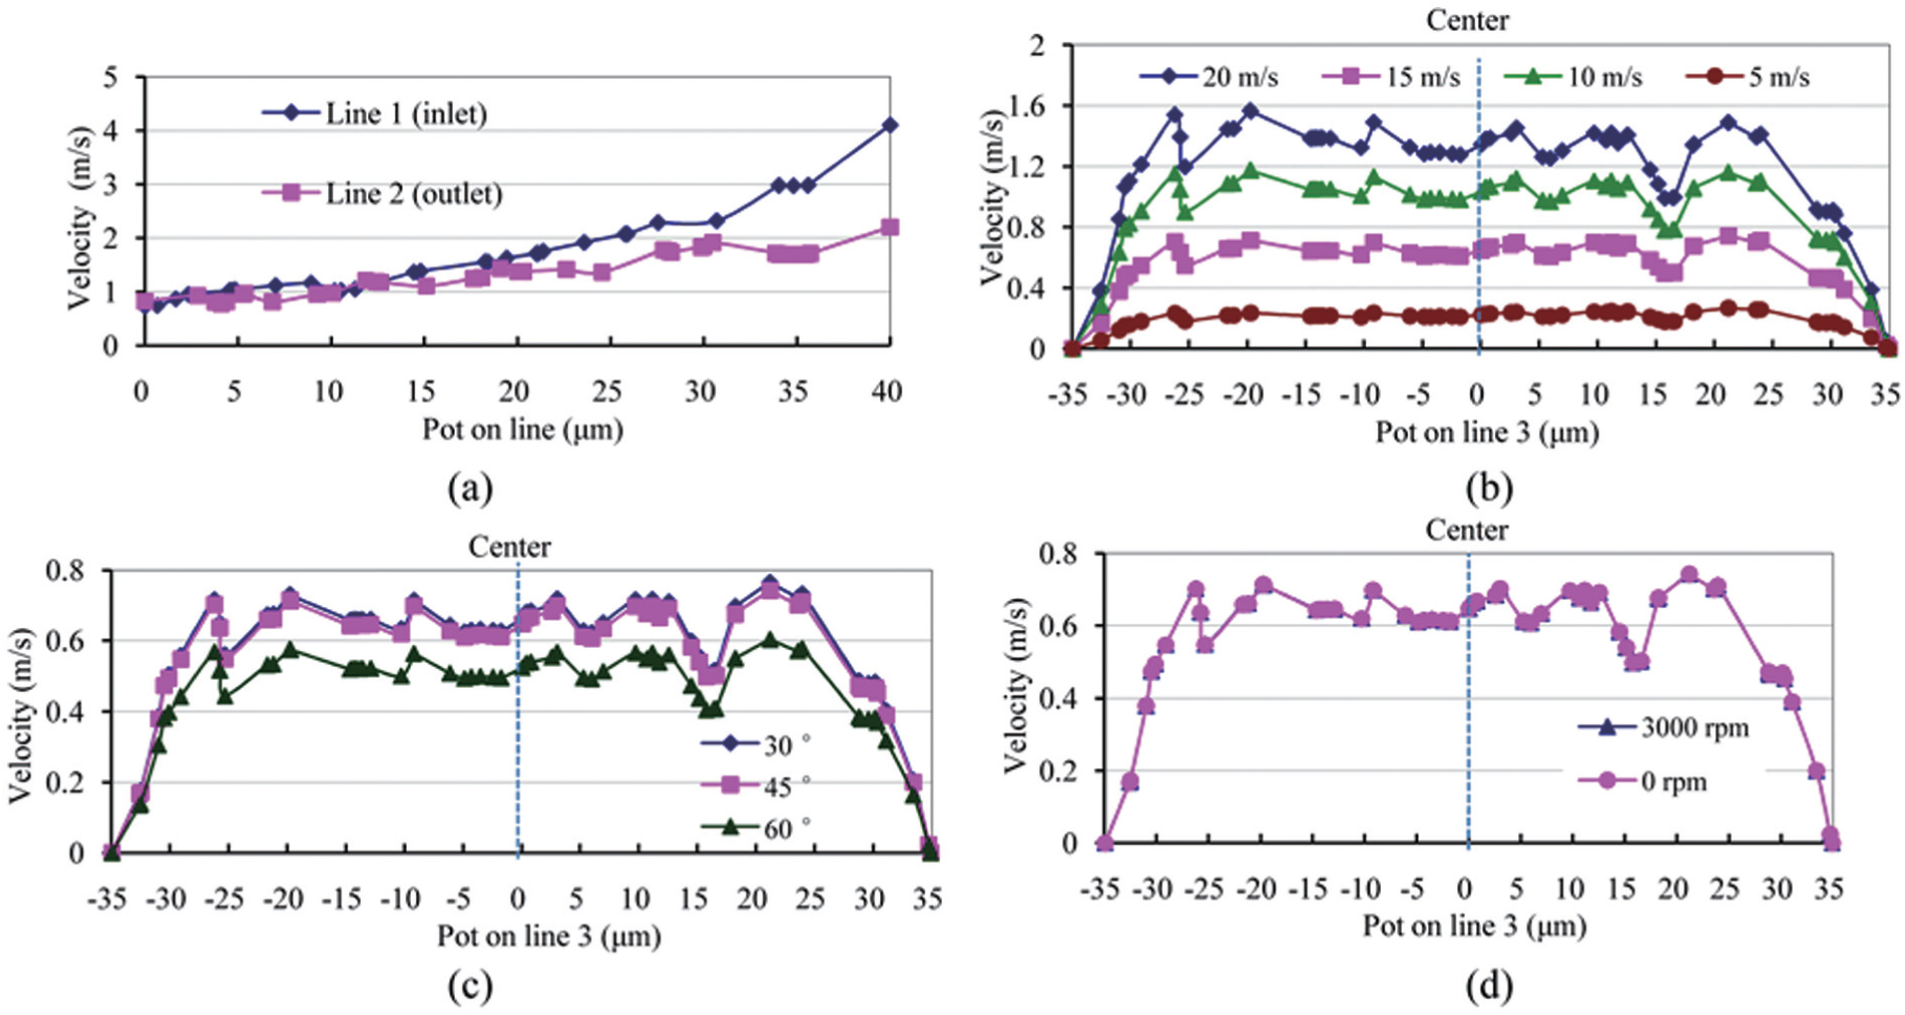
(a) Velocity along lines 1 and 2 of Figure 6(e), (b) velocities along line 3 of Figure 6(e) for different inlet velocities, (c) velocities along line 3 of Figure 6(e) for different flowing angles, and (d) velocities along line 3 of Figure 6(e) for different electrode rotation speeds.
Figure 7(a) shows that the fluid velocity at the bottom of the discharge gap is very small, so the fluid mostly reaches the outlet from the sides of the electrode rather than through the bottom of the discharge gap. Therefore, fluid rushing is worse at the bottom of the discharge gap. However, when processing micro-holes by micro-EDM, debris is mainly generated at the bottom of the discharge gap. Since the fluid flowing through the bottom of the discharge gap plays a major role in removing discharged debris, improving the velocity here can enhance debris removal. The flow conditions can be improved by changing the inlet velocity of the working fluid, the rushing angle, and the rotating speed of the electrode. Simulation of different values for these parameters can reveal the changes in the flow field at the bottom of the discharge gap and provide a reference for selecting their optimal values.
Analysis of field simulations at different flow velocities
Simulations with different working fluid velocities at the inlet can be used to obtain the fluid velocities at the centreline (line 3 in Figure 6(e)) at the bottom of the discharge gap. These results are shown in Figure 7(b).
From Figure 7(b), it can be seen that for each inlet velocity, there are obvious variations in fluid velocity at the bottom of the discharge gap. So, rushing debris at the bottom of the discharge gap is largely consistent, and the velocity changes occur primarily near the gap’s corners. Also evident is the reduction of the fluid velocity to zero at the bottom corners. If the inlet velocity of the working fluid increases, then the velocities on line 3 also increase overall. It can thus be said that changing the inlet velocity of the working fluid can easily change the velocity of the working fluid at the bottom of the discharge gap. In theory, the greater the inlet velocity of working fluid, the better the situation will be for debris removal. However, too high a velocity may increase the rushing force and electrode vibration, which will affect normal processing. Therefore, an appropriate value for inlet velocity can provide a satisfactory processing situation.
Analysis of field simulations for different rushing angles
The variation of velocities at the bottom of the discharge gap on the centreline (line 3 in Figure 6(e)) is shown in Figure 7(c) for different working fluid rushing angles. The fluid velocity on line 3 shows an overall increase with the reduction of the rushing angle. The change is small between the rushing angles of 30° and 45°. However, when the angle is 60°, the overall velocity is decreased compared to when the angle is 45°, which indicates that the rushing angle of the working fluid need not be too large.
Analysis of field simulations for different rotating speeds of the electrode
Electrode rotation is in fact equivalent to wall boundary rotation, so this particular simulation may be performed by setting different speeds for the wall boundary.
Figure 7(d) compares the fluid velocity at line 3 for electrode rotation speeds of 3000 and 0 r/min (0 r/min represents a non-rotating electrode), and an inlet velocity of 10 m/s. From Figure 7(d), it can be seen that there is no difference between the two conditions. This is due to the small diameters of the electrodes used to machine micro-holes giving negligible tangential velocities at the rotating electrode wall boundary. When the electrode diameter is 50 µm and its angular velocity is 3000 r/min, the linear speed can be calculated with

From Figure 7(d), it can be seen that when the inlet velocity is 10 m/s, the velocity below the electrodes can reach about 0.6 m/s, which is much greater than the linear speed of electrode rotation. However, relative motion exists between the fluid and the electrode surface for the rotating of the electrode. This may help to prevent adsorption of the working fluid on the electrode surface, which is a benefit to micro-EDM.
Experiment on processing micro-holes in different flowing conditions
From the results of the experiments contrasting the processing of micro-hole arrays in kerosene and deionised water, deionised water was chosen as the dielectric fluid. In order to provide deionised water with high enough resistivity, however, there are different requirements for the working system. The ion content in deionised water determines its resistivity. If the deionised water contacts with air over a large area, CO2 can easily enter the water and generate a new ion, decreasing the resistivity of the water. Therefore, the working fluid system should have a system that can recycle and reproduce deionised water. The device continuously circulates clean water after filtration, sterilisation, and so on. Through the multi-stage ion exchange resin, it is possible to obtain a higher resistivity for deionised water. Meanwhile, the resistivity of deionised water is monitored with the resistivity measurement device, which is used to control the production time when circulating the deionised water and ensures a stable resistivity. Deionised water is introduced to the EDM device and the micro-hole array by a water supply apparatus, which is able to adjust the flow of the working fluid to satisfy its different requirements during processing. The following experiments were all conducted in unchanged RC discharge circuit, where the open-circuit voltage is 26 V, the resistivity is 1 kΩ, and the capacitance is 47 pF.
Experiments with different inlet velocities
From the flow field simulation results in section ‘Simulation analyses in the flow field of deionised water’, it can be inferred that changes in the flow velocity will produce changes in the flow field in the discharge gap, which in turn will affect the rushing debris during the discharge process. If other experimental parameters are left unchanged, the flow of the working fluid is related to the inlet velocity by

where
Flow rates and corresponding velocities of the working fluid.
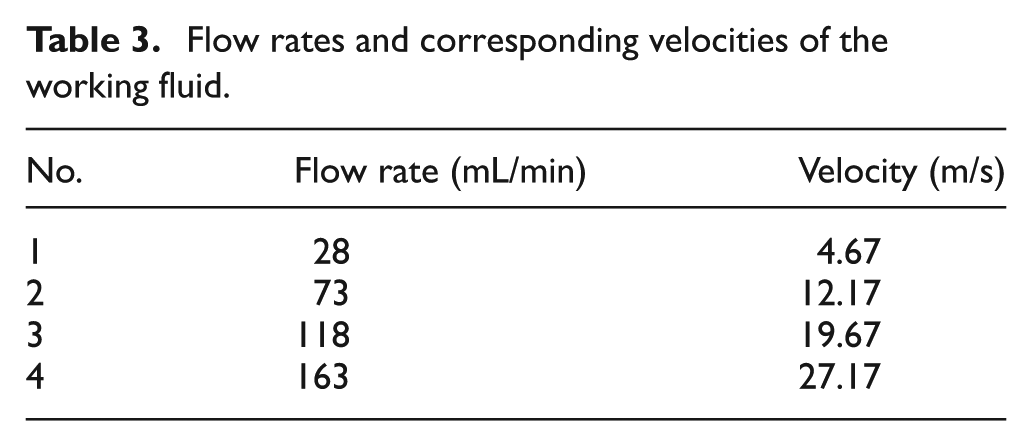
The experiment aims not only to validate the simulation results for different working fluid inlet velocities, but also to study the effect of different gaps on the flow field, which will at last provide a basis for the choice of deionised water flow parameters.
Figure 8(a) shows the average diameters of the micro-holes processed in different flows of deionised water; it can be seen that the average diameter of the holes increases with the increase in flow rate. There is little change in the diameter of the hole when the flow is varied from 73 to 118 mL/min. The diameter change is large only when the flow is reduced to the minimum value or increased to the maximum value. As can be seen from Figure 8(b), when the flow of deionised water increases, the processing efficiency is greatly improved and the machining time for the average hole can decrease 12 s, from 34 to 22 s. During the experiment, it was also observed that slower flow rates caused more short circuits and instability when processing. The smaller the flow velocity, the more obvious was this phenomenon. At times, the processing was even impossible to carry out.
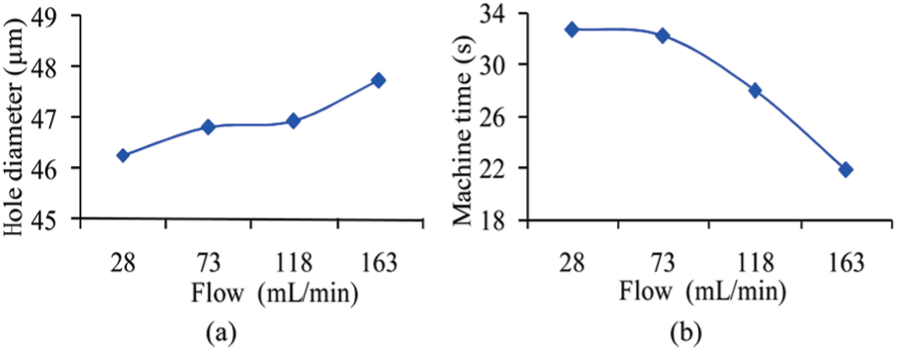
Effects of flow rate on (a) hole diameter and (b) machining time.
The changes in flow rate mainly alter the situation of the flow field in the discharge gap, thereby affecting the rushing of debris. Referring to the previously described simulation results for the different flow fields, the velocity in the bottom of the discharge gap decreases when the flow of deionised water is slow, making it difficult for the working fluid to carry away the debris and causing it to accumulate in the discharge gap. Debris blockage of the discharge gap severely affects the processing as it increases instances of arc discharge and short circuiting, ultimately decreasing processing efficiency. Figure 9(a) shows images of electrodes after machining array holes at different fluid flow rates. It is obvious that there are attachments on the electrode when the flow rate is small, and that a slower flow corresponds to more attachments on the electrode. Figure 9(b) shows SEM images of micro-holes processed in different flows of deionised water. It can be seen that slower flow rates give worse results in hole processing. This shows that residual debris will adhere to the electrode and the wall of the hole in the high temperatures during discharge. Meanwhile, due to the adhesion, the debris can also cause a decrease in processing efficiency. Additionally, it was found that too large a flow of deionised water would cause vibration of the electrode. Therefore, one must select an appropriate flow rate value for the working fluid in micro-EDM; 163 mL/min is concluded to be a suitable flow rate for deionised water.
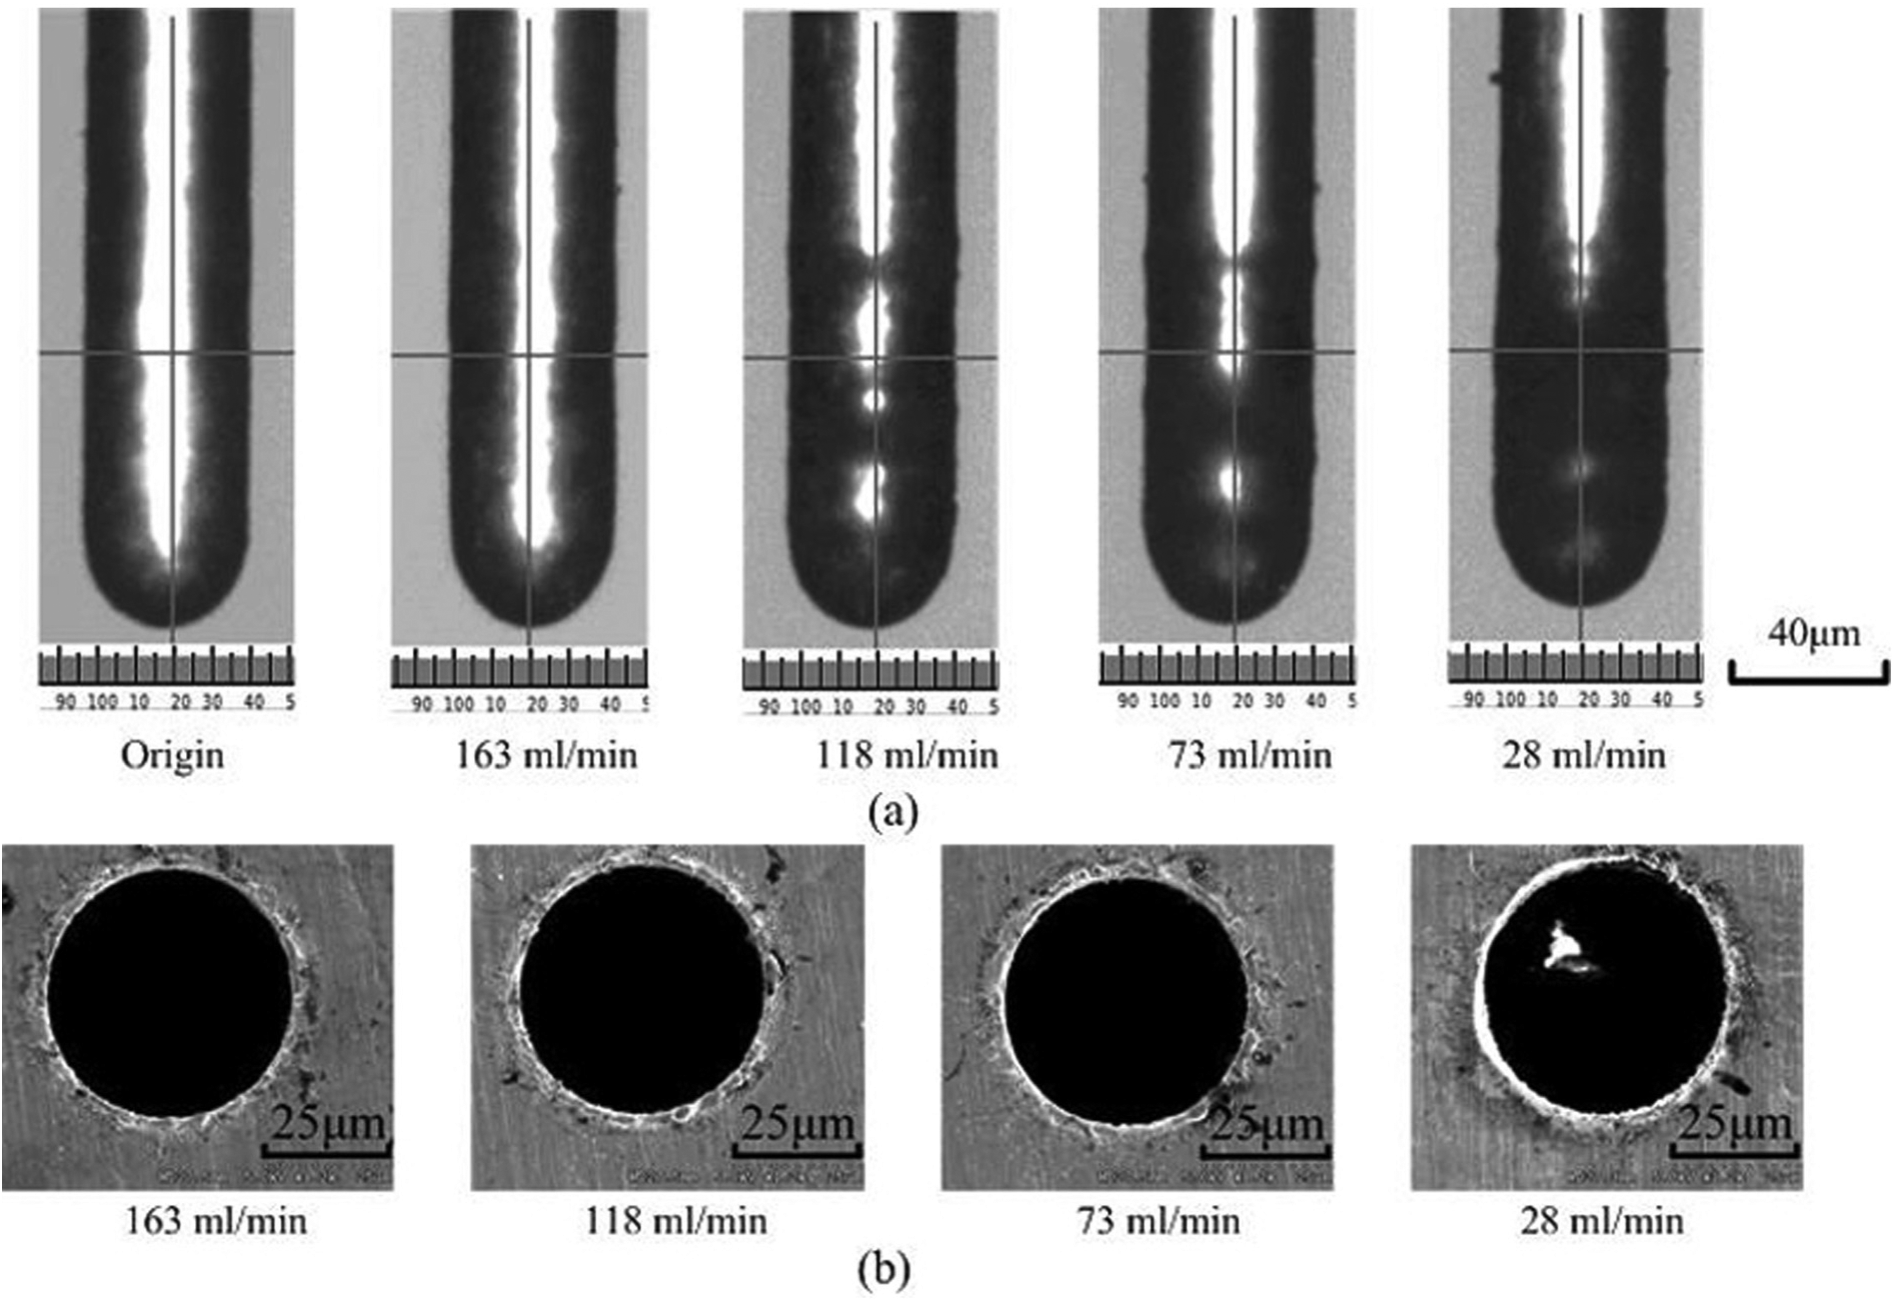
(a) Images of electrodes after machining 10 holes in different flow rates and (b) SEM images of micro-holes machined in different flow rates.
Experiments with different rushing angles
By the simulation results, changes in the rushing angle between the jet of fluid at the inlet and the surface of the work-piece will affect the flow field of the working fluid in the discharge gap. With other experimental conditions unchanged, micro-hole array machining experiments with different rushing angles were conducted to verify the simulation results.
Figure 10(a) is a diagram of the average diameter of the micro-holes machined with different rushing angles. Evidently, there is little difference in the hole diameters resulting from different rushing angles. However, it can be seen that the average hole diameter for a rushing angle of 60° was smaller than those for 30° and 45°. It is noted that, in the simulation, the flow velocity in the bottom of the discharge gap was identical for rushing angles of 30° and 45°, and the velocity was a minimum when the angle was 60°. If the velocity in the bottom of the discharge gap is large, debris is easily taken away and discharge occurs as normal. Meanwhile, because of short circuits and arc discharge, it is possible to increase the diameter of the hole. This proves that the physical experiments are consistent with the simulation results.
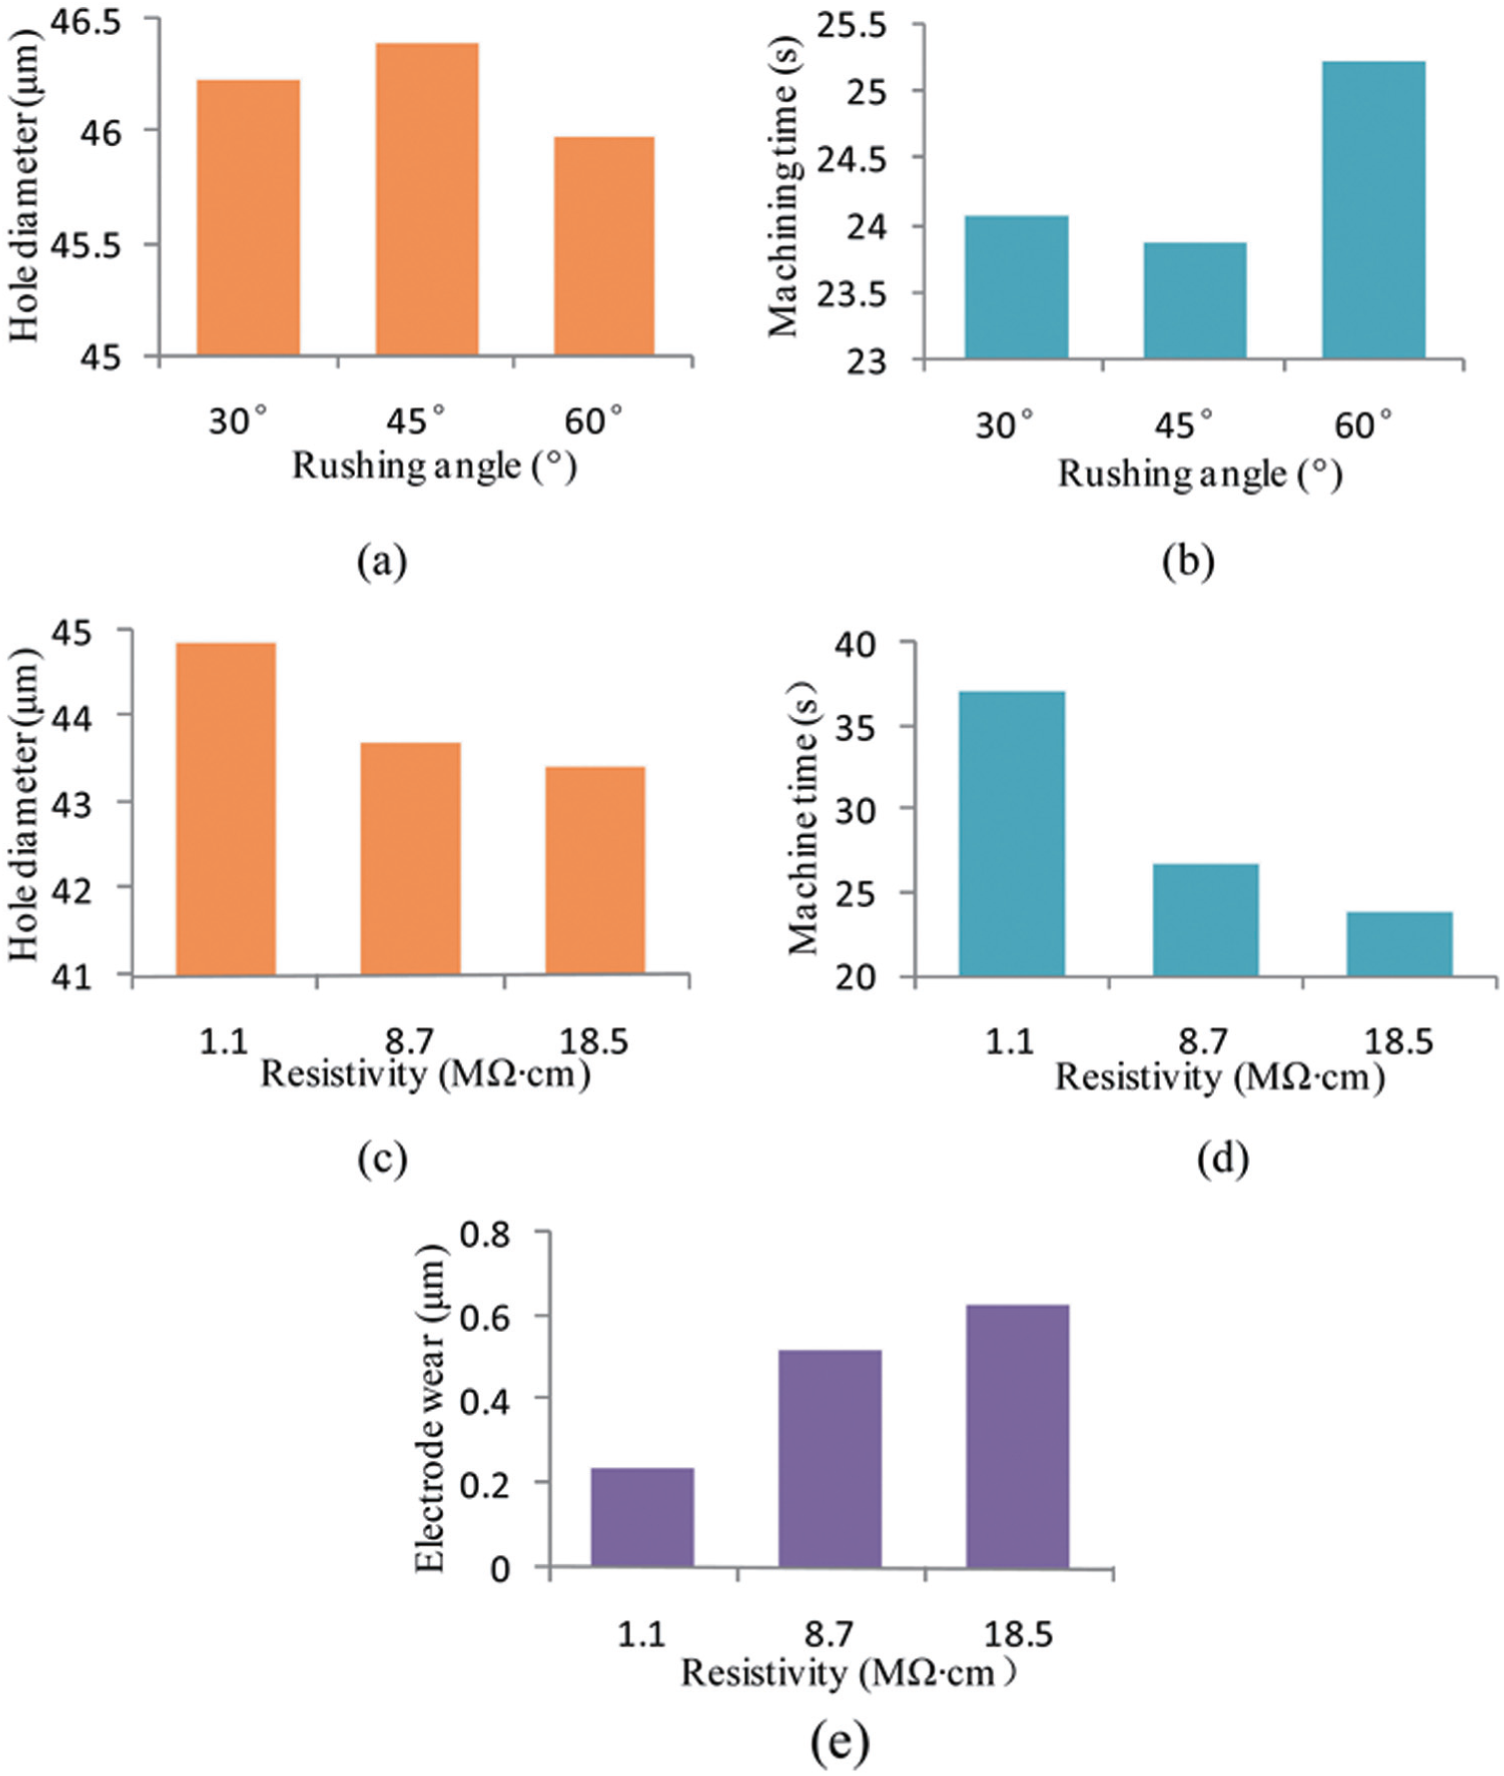
Plots of (a) hole diameter and (b) machining time versus the rushing angle and plots of (c) hole diameter, (d) machining time, and (e) electrode wear as functions of the resistivity of deionised water.
Figure 10(b) shows an obvious difference in the machining times for different rushing angles. This is because the different short circuit occurrence rates (due to the different rushing angles) produce different processing efficiencies. An angle of 60°, which is the maximum value in the experiment, gives the longest machining time. At 30° and 45°, the processing efficiency is relatively high and the discharge in the gap is normal, resulting in unstable processing, for which values the experimental results are able to match the simulation results. From the simulation results and experimental analysis, it can be seen that selecting a smaller rushing angle is very important for processing array holes in micro-EDM, and that the angle should be kept unchanged so that it does not cause inconsistent hole diameters and unstable machining times.
Experiments with different resistivities of deionised water
As noted in Table 1, the insulation performance of deionised water is worse than that of kerosene. If the deionised water is polluted, the resistivity of the water rapidly declines, and its insulation performance further weakens. Thus, when the resistivity of deionised water is lower, the discharge distance between the electrode and the work-piece is larger, which is good for discharge. This can also enhance the electrochemical effect, increasing the amount of erosion of the work-piece material. 14 In this way, the resistivity of the deionised water may impact upon processing accuracy, processing efficiency, and electrode wear. Three kinds of deionised waters with different resistivities obtained by the working fluid system were used in machining experiments with other experimental conditions unchanged. The obtained experiment results are shown in Figure 10(c)–(e).
From Figure 10(c), it can be seen that when the resistivity of deionised water decreased, the processed holes became bigger. This is because the insulation of water decreases with the resistivity, which in turn enlarges the discharge gap. Meanwhile, when using deionised water as the dielectric fluid, electrochemical effects accompany the discharge processing. Reduction in the resistivity of deionised water enhances the electrochemical corrosion and results in more erosion of the work-piece material, which also increases the discharge gap. When the minimum value of resistivity is selected, electrochemical corrosion in the processing plays a major role and the effect of discharge is weakened; the discharge gap then increases significantly, and the processing is unstable.
It can be seen from Figure 10(d) that decreasing the resistivity of deionised water causes a decrease in processing efficiency. When the resistivity decreases, the insulation of deionised water is poor, and a discharge channel is very easy to form. Therefore, in this case, more short circuits occur and the machining time is increased. For the minimum resistivity in the experiment, the processing was even more difficult to perform.
Electrode wear in the experiment represents the change in length of the electrodes before and after processing. From Figure 10(e), it can be seen that the electrode wear decreased with the decline in the resistivity of deionised water. Electrochemical activity was enhanced at low resistivity, and electrochemical corrosion and spark discharge both contributed to work-piece erosion. When the resistivity is low, electrochemical corrosion plays a major role in the processing, and the electrode wear is almost negligible. As a result, low resistivity can reduce electrode wear.
Edge burrs are characteristic of holes processed in EDM. Figure 11 shows the electrodes and the holes machined with different resistivities of deionised water. It can be seen that a larger resistivity results in larger edge burrs caused by spark discharge. With increasing resistivity, machining burrs significantly reduce and the edges improve in quality. This can also be explained by the reduction in electrical resistivity causing an enhancement in electrochemical action, as electrochemical action does not produce burrs. The hole processed when the resistivity of the deionised water was 8.7 MΩ cm looks better than the hole processed when the resistivity was 18.5 MΩ cm. However, if the resistivity is too low, the hole may be destroyed by electrochemical action, as shown in Figure 11(c). In reality, the burrs around a micro-hole always have some impact on the usefulness of the hole. Moreover, from the micrometre-scale electrode images captured during deionised water processing, it is evident that the oxides generated by the work-piece material may adhere to the electrode, and that decreasing the deionised water resistivity increases the amount of such oxides. This is also bad for the holes due to the secondary oxide discharge during processing.
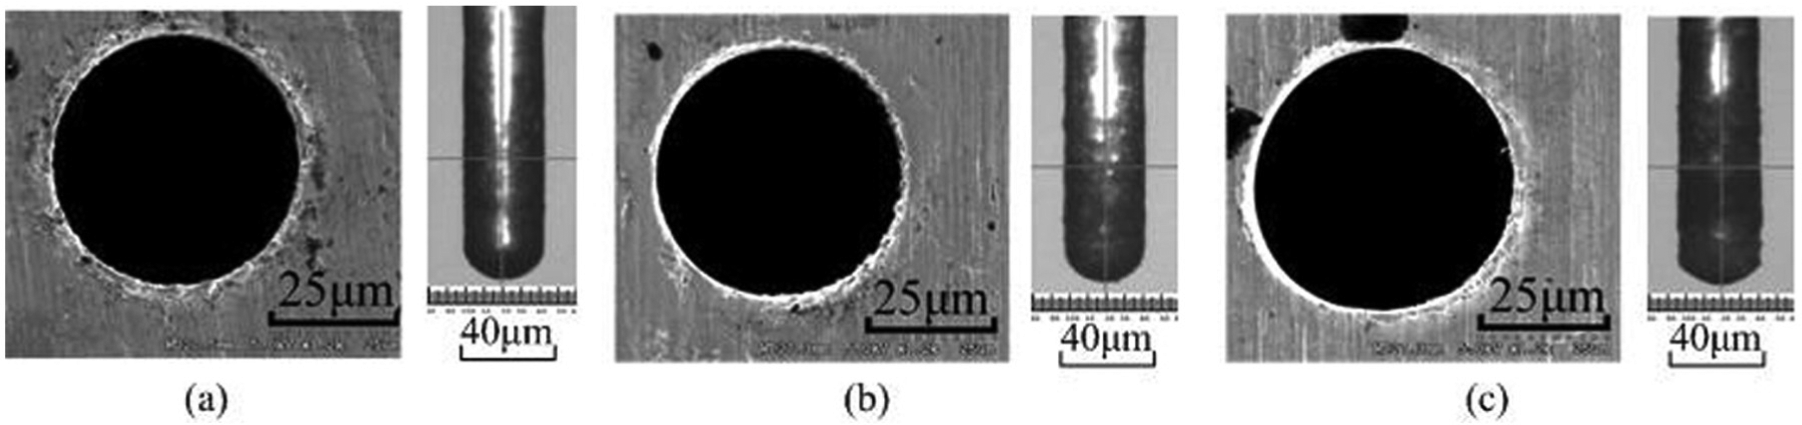
Images of electrodes and holes after processing with different resistivities of deionised water: (a) 18.5, (b) 8.7, and (c) 1.1 MΩ cm.
Considering the above results, a greater deionised water resistivity is more beneficial in micro-hole array processing. In addition, the working fluid system can easily supply deionised water with a resistivity greater than 16 MΩ cm.
Application experiments
The purpose of analysing the dielectric is to obtain desirable discharge conditions for machining micro-hole arrays in micro-EDM. If the working fluid can provide good rushing and cooling functions, the flow field will be in a steady state and the consistency of the array hole diameters can be guaranteed.
A 16 × 16 micro-hole array – a design often used in printer ejector mechanisms – was fabricated using the best parameters obtained: deionised water as the dielectric with resistivity higher than 16 MΩ cm, an inlet flow of 163 mL/min, and a rushing angle of 45°. Figure 12 is an SEM image of the resulting array. Figure 13 is a plot of the diameters of the 256 holes. The average diameter of the holes is 44.47 µm and the maximum diameter deviation is 1.3 µm; this satisfies the accuracy requirements of many applications in modern industry.
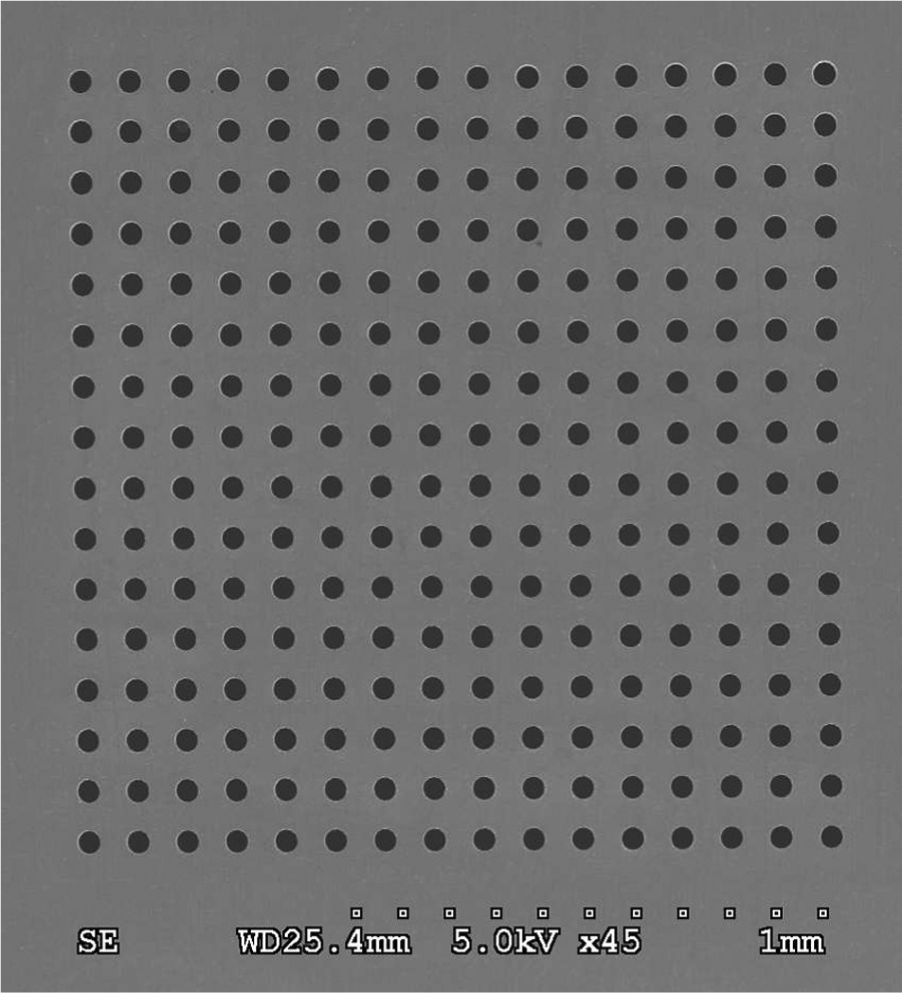
SEM image of a 16 × 16 micro-hole array.
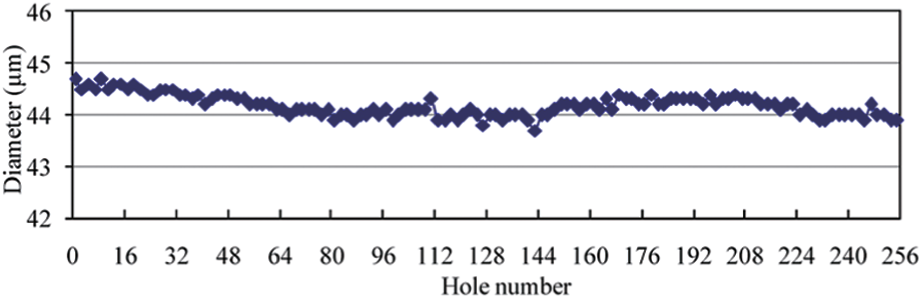
Diameters of the 256 micro-holes.
Conclusion
This article made a comparative analysis of the processing performances of kerosene and deionised water as working fluids for processing array holes by micrometre-scale electrical discharge machining (micro-EDM). The analysis and experimental results showed deionised water to be more suitable when machining micro-hole arrays.
Simulations and experiments were conducted on the effects of the deionised water flow field in micro-hole array processing. It was found that appropriately increasing the flow rate and reducing the rushing angle can improve the quality of the micro-holes. In addition, using deionised water with high resistivity can increase processing efficiency and reduce the impact of abnormal discharges on the hole.
Using the experimental results, this study successfully made an array of 256 micro-holes (a common printer ejector design) with an average diameter of 44.47 µm and a maximum diameter deviation of 1.3 µm. This accuracy is suitable for many modern industrial applications.
Footnotes
Declaration of conflicting interests
The authors declare that there is no conflict of interest.
Funding
This research was supported by the ‘863’ Program of China (Grant No. 2007AA04Z345), the National Natural Science Foundation of China (Grant No. 51175120), and the Technology Research and Development Program of Jiangsu Province of China (Grant No. BE201248).