
Abstract
The present study focuses on experimental modelling of travelling wire electrochemical spark machining process using coupled methodology comprising Taguchi methodology and response surface methodology. Experiments were conducted on Pyrex glass workpiece using L27 orthogonal array considering applied voltage, pulse on-time, pulse off-time, electrolyte concentration and wire feed velocity as input parameters and material removal rate, surface roughness (Ra) and kerf width (Kw) as output parameters. The multi-response optimization is also pe rformed using a coupled analysis comprising grey relational analysis and principal component analysis. The optimal process parameter setting demonstrates the enhancement of material removal rate by 154% and reduction of surface roughness and kerf width by 21% and 11%, respectively, against the initial parameter setting.
Keywords
Introduction
Machining of Pyrex glass is difficult compared to other engineering electrically nonconducting materials because of its typical characteristics such as high hardness, brittleness, fracture toughness and chemical inertness. This is used in scientific piping, laboratory ware, fabrication of electrodes for pressure microsensors and resonance detection microsensors. It is also used to fabricate components of microelectromechanical systems (MEMS) and micro channels. Electrochemical spark machining (ECSM) process, comprising the characteristics of electrochemical machining (ECM) and electrodischarge machining (EDM), has been found a suitable machining technique for the glass and other nonconducting materials. The process was first developed by Kurafuji and Suda. 1 The mechanism of spark generation and material removal was explained by Basak and Ghosh. 2 ECSM process has been used in different configurations such as Die Sinking-ECSM, Hole Sinking-ECSM, Die Drilling-ECSM, Hole Drilling-ECSM, Wire Cutting-ECSM, Disc Cutting-ECSM, Cylindrical Grinding-ECSM, Surface Grinding-ECSM and Pocket Milling-ECSM. Experimental study of ECSM has also been performed by other researchers.3–6 Researches of ECSM up to 2005 has been summarized by Wuthrich and Fascio. 7
Travelling wire electrochemical spark machining (TW-ECSM) generally employs a continuously travelling wire electrode to slice the workpiece by generating spark between wire electrode and electrolyte and keeping electrically nonconducting workpiece in the closed vicinity of the spark. The material of the workpiece is melted, vaporized and eroded due to the transmission of spark energy to the workpiece. 8 The machining performance of TW-ECSM also depends on other process parameters like electrolyte concentration, wire feed velocity and pulse on-time. TW-ECSM set-up was developed first time in 1985 for cutting glass and ceramic by Tsuchiya et al. 9 After its inception, many researchers have given attention for the experimental as well as theoretical study of TW-ECSM process.
El-Hofy and McGeough 10 experimentally studied the effect of mode of electrolyte flushing on metal removal rate during wire electrochemical arc machining (WECAM) of rectangular mild steel plate and recommended that the use of coaxial mode of flushing is better from machining action and accuracy point of view. Jain et al. 11 performed experiments on their self-developed set-up of TW-ECSM for cutting glass epoxy and Kevlar epoxy composites using NaOH electrolyte. They observed that the wire wear rate and the overcut follow a similar behaviour as the machining rate, but the wire wear rate was about two magnitudes smaller than the material removal rate (MRR). They found that there is an increase in MRR at higher voltage along with the presence of thermal cracks, large heat-affected zone (HAZ) and irregular machined surfaces. They also studied the effect of introducing some bubbles artificially into the process during machining and found that the MRR as well as the overcut decreased slightly. Singh et al. 12 have reported the feasibility of using TW-ECSM process for machining of electrically partially conductive materials like piezoelectric ceramics (lead zirconate titanate (PZT)) and carbon fibre–epoxy composites. They observed that MRR increases with increase in supply voltage. MRR also increases with increase in electrolyte concentration up to around 20 wt%; beyond this concentration, it starts decreasing. Mitra et al. 13 introduced in-depth study of the basic material removal mechanism of the travelling wire electrochemical discharge machining (TW-ECDM) process and the design details for the development of TW-ECDM set-up, which would be compatible to the needs of investigating the machining characteristics for the effective machining of nonconducting engineering materials.
Peng and Liao 14 used TW-ECDM to slice the small size (10–30 mm diameter) optical glass and quartz bars. The input power was modulated to obtain the appropriate frequencies and duty factors for machining glass and quartz materials. Yang et al. 15 reported experimental study during TW-ECDM to get better overcut eminence by adding SiC abrasive particles into electrolyte. They observed the effect of adding abrasives on Ra and MRR. Panda and Yadava 16 developed for the first time a three-dimensional (3D) finite element transient thermal model for computation of MRR during TW-ECSM. They studied the effect of energy partition, duty factor, spark radius and ejection efficiency on nature and quantitative behaviour of MRR. Manna and Kundal 17 developed TW-ECSM set-up to overcome the machining problem of nonconductive aluminium oxide (Al2O3) ceramic and verified experimentally the feasibility of the fabricated set-up. Experiments were conducted based on Taguchi design to investigate the effect of process parameters such as supply voltage, electrolyte concentration, gap between tool and anode and wire speed on output MRR and spark gap width.
Considering the production capability, surface quality and cut accuracy, the output parameters can be selected as MRR, Ra and Kw. The applied voltage, pulse on-time, pulse off-time, electrolyte concentration and wire feed velocity can be considered as input parameters of the TW-ECSM process. However, the problem of selecting optimum parameters for TW-ECSM process is not still fully solved. The design of experiments (DOE) methods have been used quite successfully in industrial applications to optimize manufacturing processes. Taguchi methodology (TM) coupled with grey relational analysis (GRA) has been used to optimize the different machining processes.18,19 Sharma and Yadava 20 used a hybrid approach Taguchi methodology and response surface methodology (TMRSM), which comprises TM and RSM for modelling, and Taguchi methodology and grey relational analysis (TMGRA), which comprises TM and GRA for multi-objective optimization of pulsed neodymium-doped yttrium aluminium garnet (Nd:YAG) laser cutting process. Tzeng et al. 21 proposed a hybrid method, including back-propagation neural network (BPNN), genetic algorithm (GA) and response surface methodology (RSM) for the determination of optimal parameter settings of wire electrical discharge machining (WEDM) process.
Based on the literature survey, it is evident that the two potential coupled approaches TMRSM and grey relational analysis coupled with principal component analysis (GRAPCA) have not been applied so far in the study of TW-ECSM process with single or multiple performance measures. In this article, two different coupled methodologies have been applied: one coupled methodology, which comprises TM and RSM, TMRSM is used for modelling, and another coupled methodology GRAPCA, which couples GRA with PCA, is used for multi-response optimization during TW-ECSM of Pyrex glass. First, TM is used to determine the level of input parameters corresponding to maximum MRR and minimum Ra and Kw. These levels of input parameters are further used as central value in the design of central composite rotatable design (CCRD) matrix. Finally, second-order response surface models are developed for MRR, Ra and Kw after conducting experiments using CCRD matrix. 22 Furthermore, GRAPCA approach has been applied for multi-response optimization of the TW-ECSM process. Taguchi-based L27 orthogonal array (OA) was taken for performing the experiments, and these experimental results were used for finding the normalized quality characteristics using GRA. The PCA is specially employed to calculate the weight of each quality characteristic. These weights are further used for calculating the grey relational grade.
Experimental planning
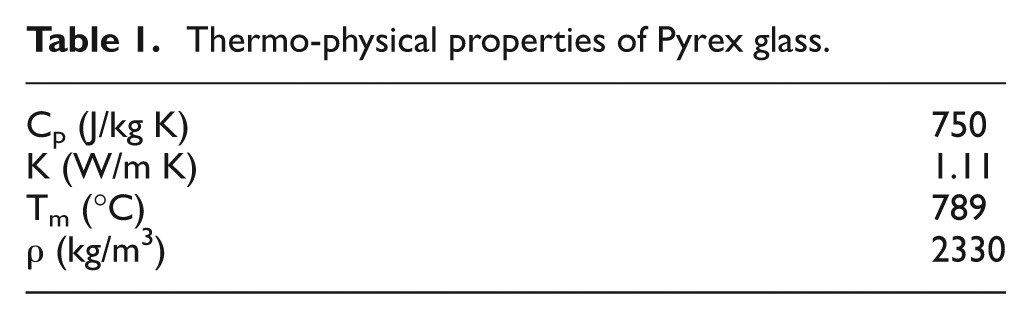
The experiments have been conducted considering five input parameters such as applied voltage, pulse on-time, pulse off-time, electrolyte concentration and wire feed velocity and three output parameters, that is, MRR, Ra and Kw, on self-developed TW-ECSM. The schematic diagram of experimental set-up of TW-ECSM is shown in Figure 1(a). The real photograph of a developed TW-ECSM set-up is demonstrated in Figure 1(b). Based on exhaustive pilot experiment, the range of parameters for a quality cut was decided. A graphite rod (of diameter 8 mm and length 55 mm) was used as anode, and brass wire of diameter 0.25 mm was used as cathode in this experiment. A rectangular Pyrex glass with dimension of 40 mm × 35 mm × 2 mm was taken as a workpiece, and physical thermal properties of workpiece are given in Table 1. Workpiece was held at constant distance of about 40 mm from the anode. Cathode (wire) was always kept in physical contact with the workpiece, which was mounted on the supporting platform.
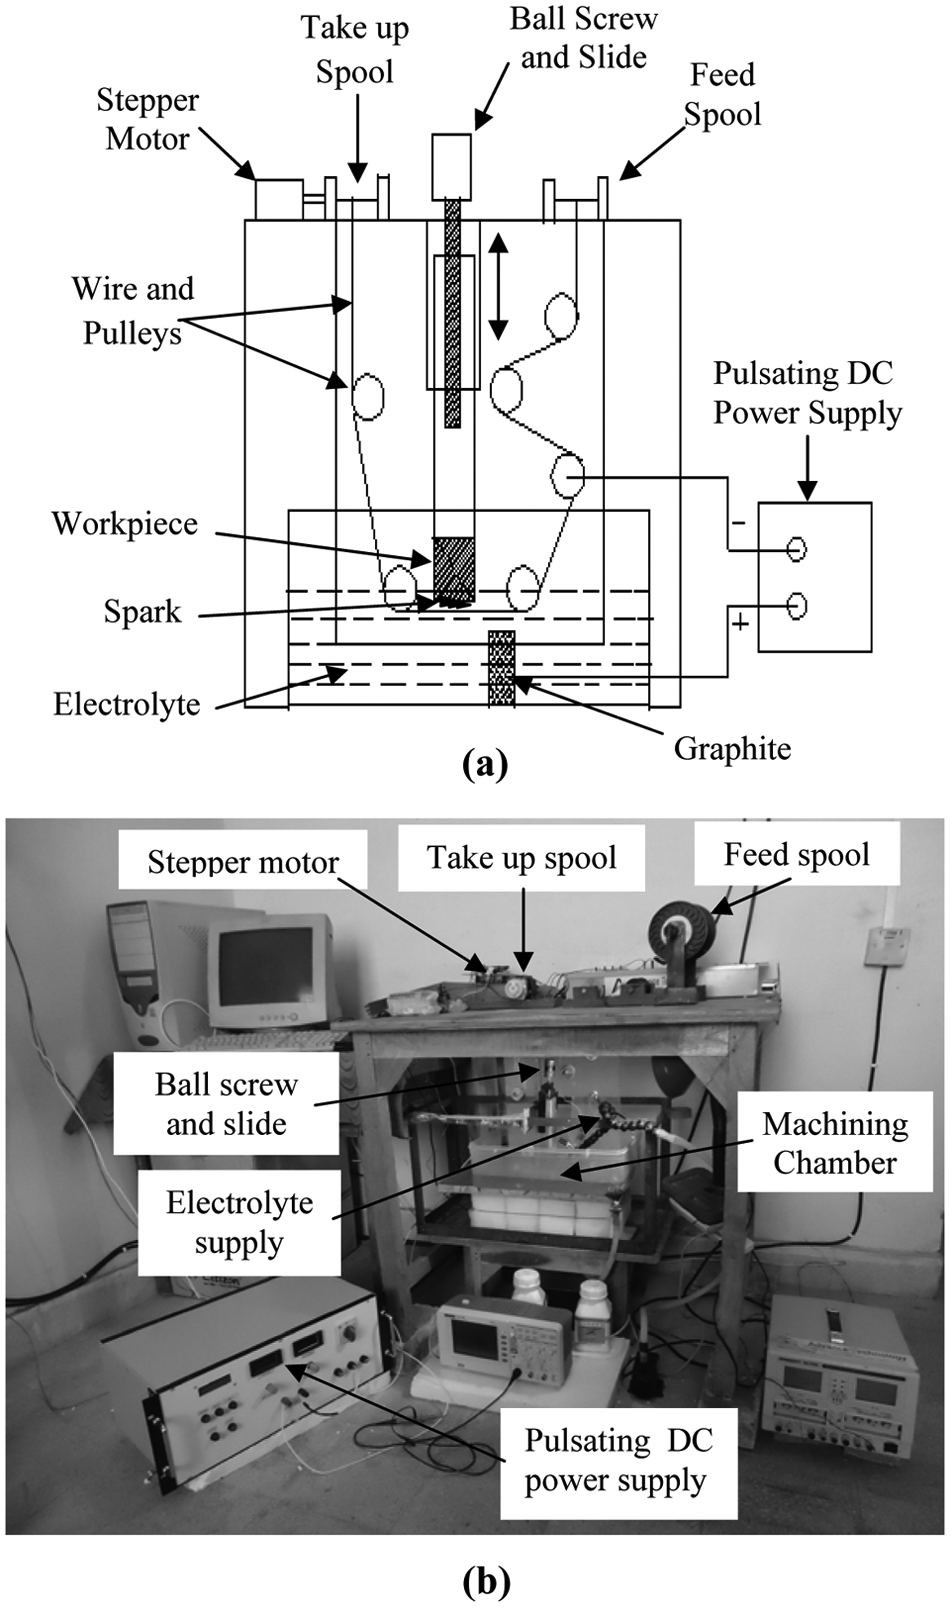
(a) Schematic diagram and (b) photographic view of the developed tabletop TW-ECSM set-up.
Thermo-physical properties of Pyrex glass.
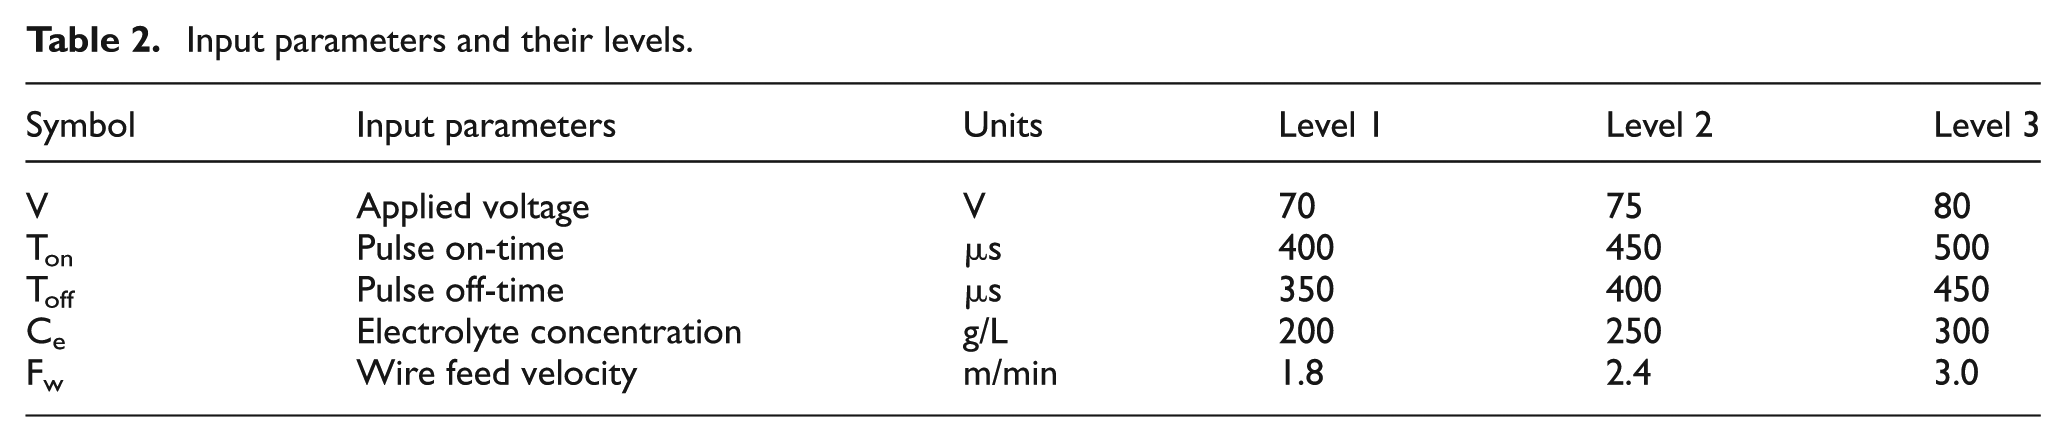
Brass wire was broken at above 95 V because of its low current-carrying capacity. Hence, applied voltage was in the range of 60–90 V and current was in the range of 0.5–3 A. Very low wire speed would lead to a situation similar to the stationary tool, resulting in overheating and finally breaking of the wire. Too high wire speed was also not desirable because it would be uneconomical. Hence, the wire was driven by stepper motor with a speed in the range of 0.6–4 m/min. NaOH has higher specific conductance; reactions take place at higher rates, so a larger amount of gases were evolved. Hence, higher MRR was achieved. Thus, all the experiments reported in this article were carried out using NaOH solution as electrolyte. An aqueous solution of NaOH with a range of 100–400 g/L solution at 20 °C–40 °C was used. Each experiment was tested for about 10–12 min, during which voltage and current were recorded on a voltmeter and ammeter, respectively. The minimum linear feed rate to the workpiece, which could be achieved using the present set-up, was 0.008 mm/s. This feed rate was higher than the cutting rate observed during the experiments. The pulsating direct current (DC) power supply has been used during the experiments due to better spark stability and more spark energy than constant DC power. Hence, experiments carried out using pulse on-time in the range of 350–650 µs and pulse off-time in the range of 300–600 µs, respectively, with pulse DC source. The five input parameters with three levels are shown in Table 2.
Input parameters and their levels.
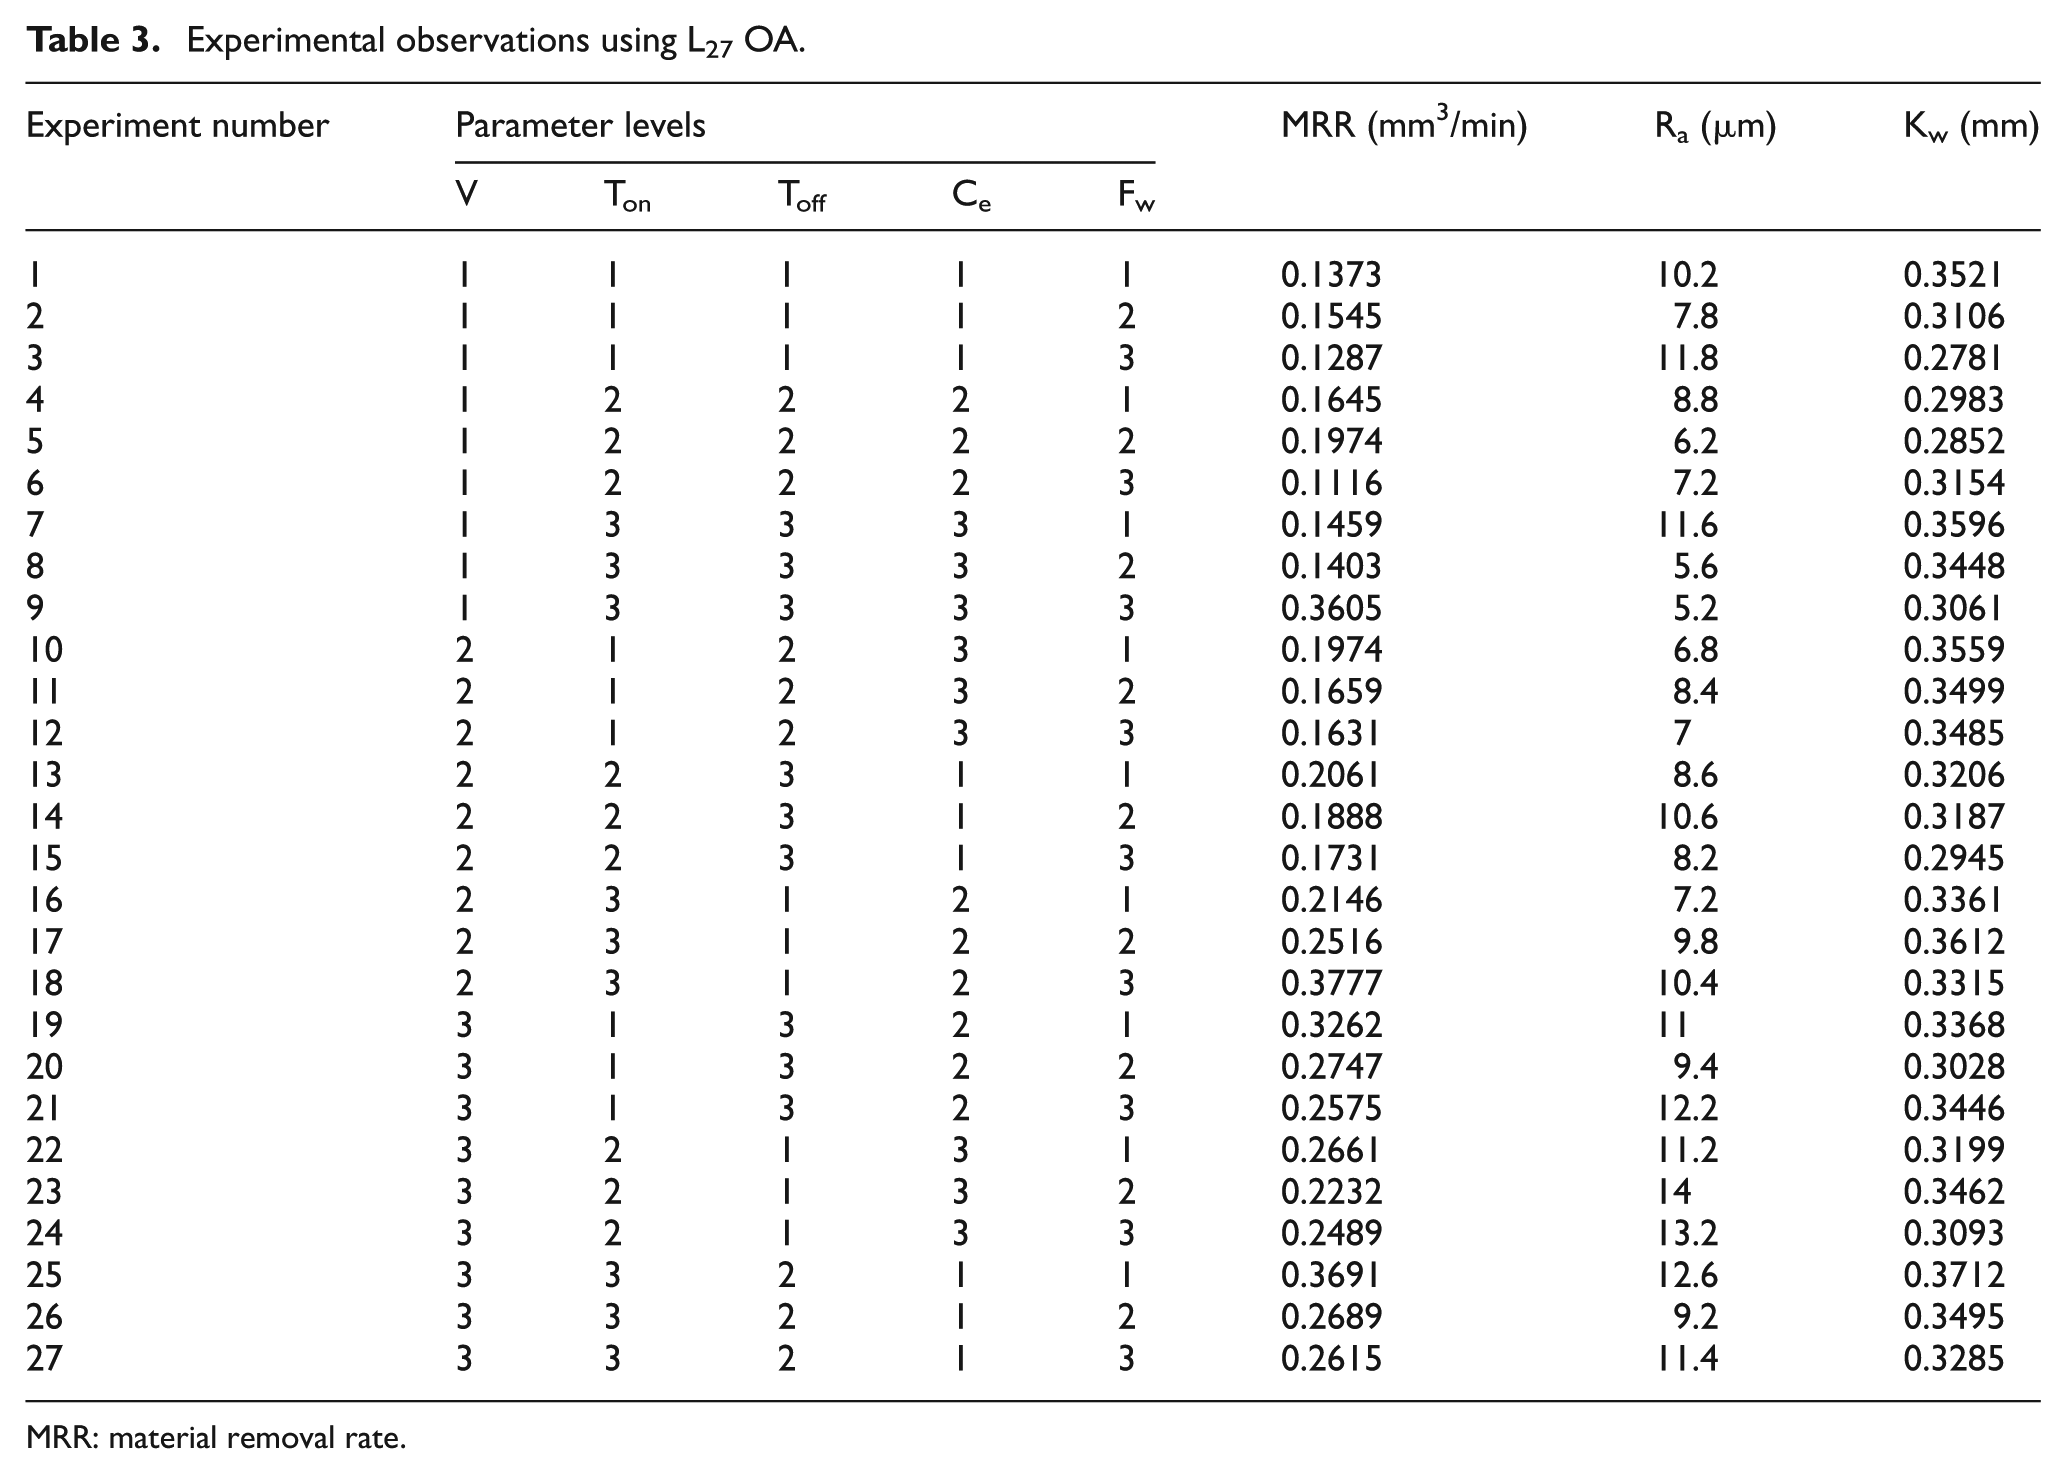
The MRR has been determined by finding the difference in weight of the specimen before and after the machining, using a weighing digital microbalance (accuracy of 10 µg; CAS India Private Limited, India). The value of Ra was measured using surface roughness tester (Taylor Hobson, UK). The optical measuring microscope (Sipcon Instrument Industries, India) was used for measuring Kw. The initial setting of input parameters is applied voltage (70 V), pulse on-time (400 µs), pulse off-time (350 µs), electrolyte concentration (200 g/L) and wire feed velocity (1.8 m/min). Based on the TM for DOE, an L27 OA has been selected to conduct the experiments. 23 The experimental results are given in Table 3.
Experimental observations using L27 OA.
MRR: material removal rate.
Experimental modelling of TW-ECSM process using TMRSM
The modelling approach is used to identify the relationship between independent variables and the associated dependent variables and to predict the trend of dependent variables as a function of independent variables. 24 In the present case, the main objectives are higher values of MRR and lower values of Ra as well as Kw. These characteristics in the Taguchi methodology are expressed as higher-the-better (HB) type for MRR and the lower-the-better (LB) type for Ra and Kw. The quality loss values for different quality characteristics in each experimental run, normalized quality loss (NQL), total normalized quality loss (TNQL) and multiple signal-to-noise ratio (MSNR) are calculated using the following formulas25,26
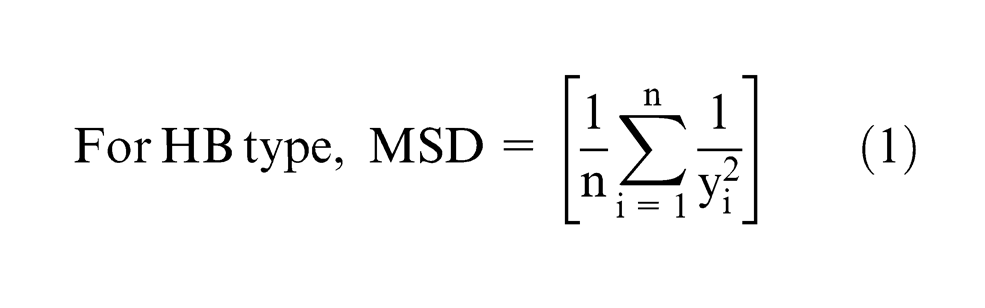
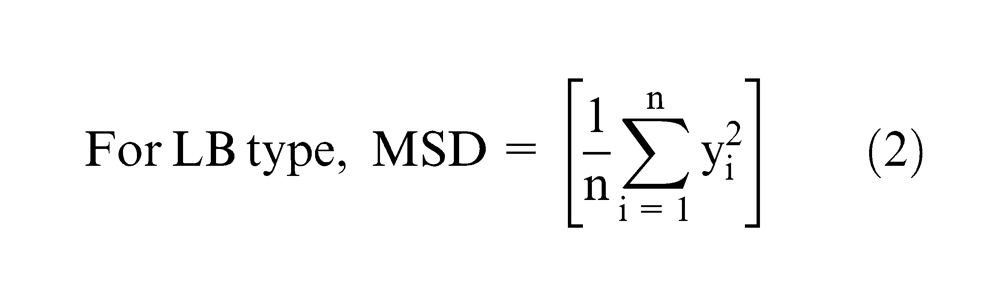
where MSD is mean square deviation or quality loss function

where yij, Yj and
Quality loss values and NQL values for MRR, Ra and Kw, TNQL and MSNR.
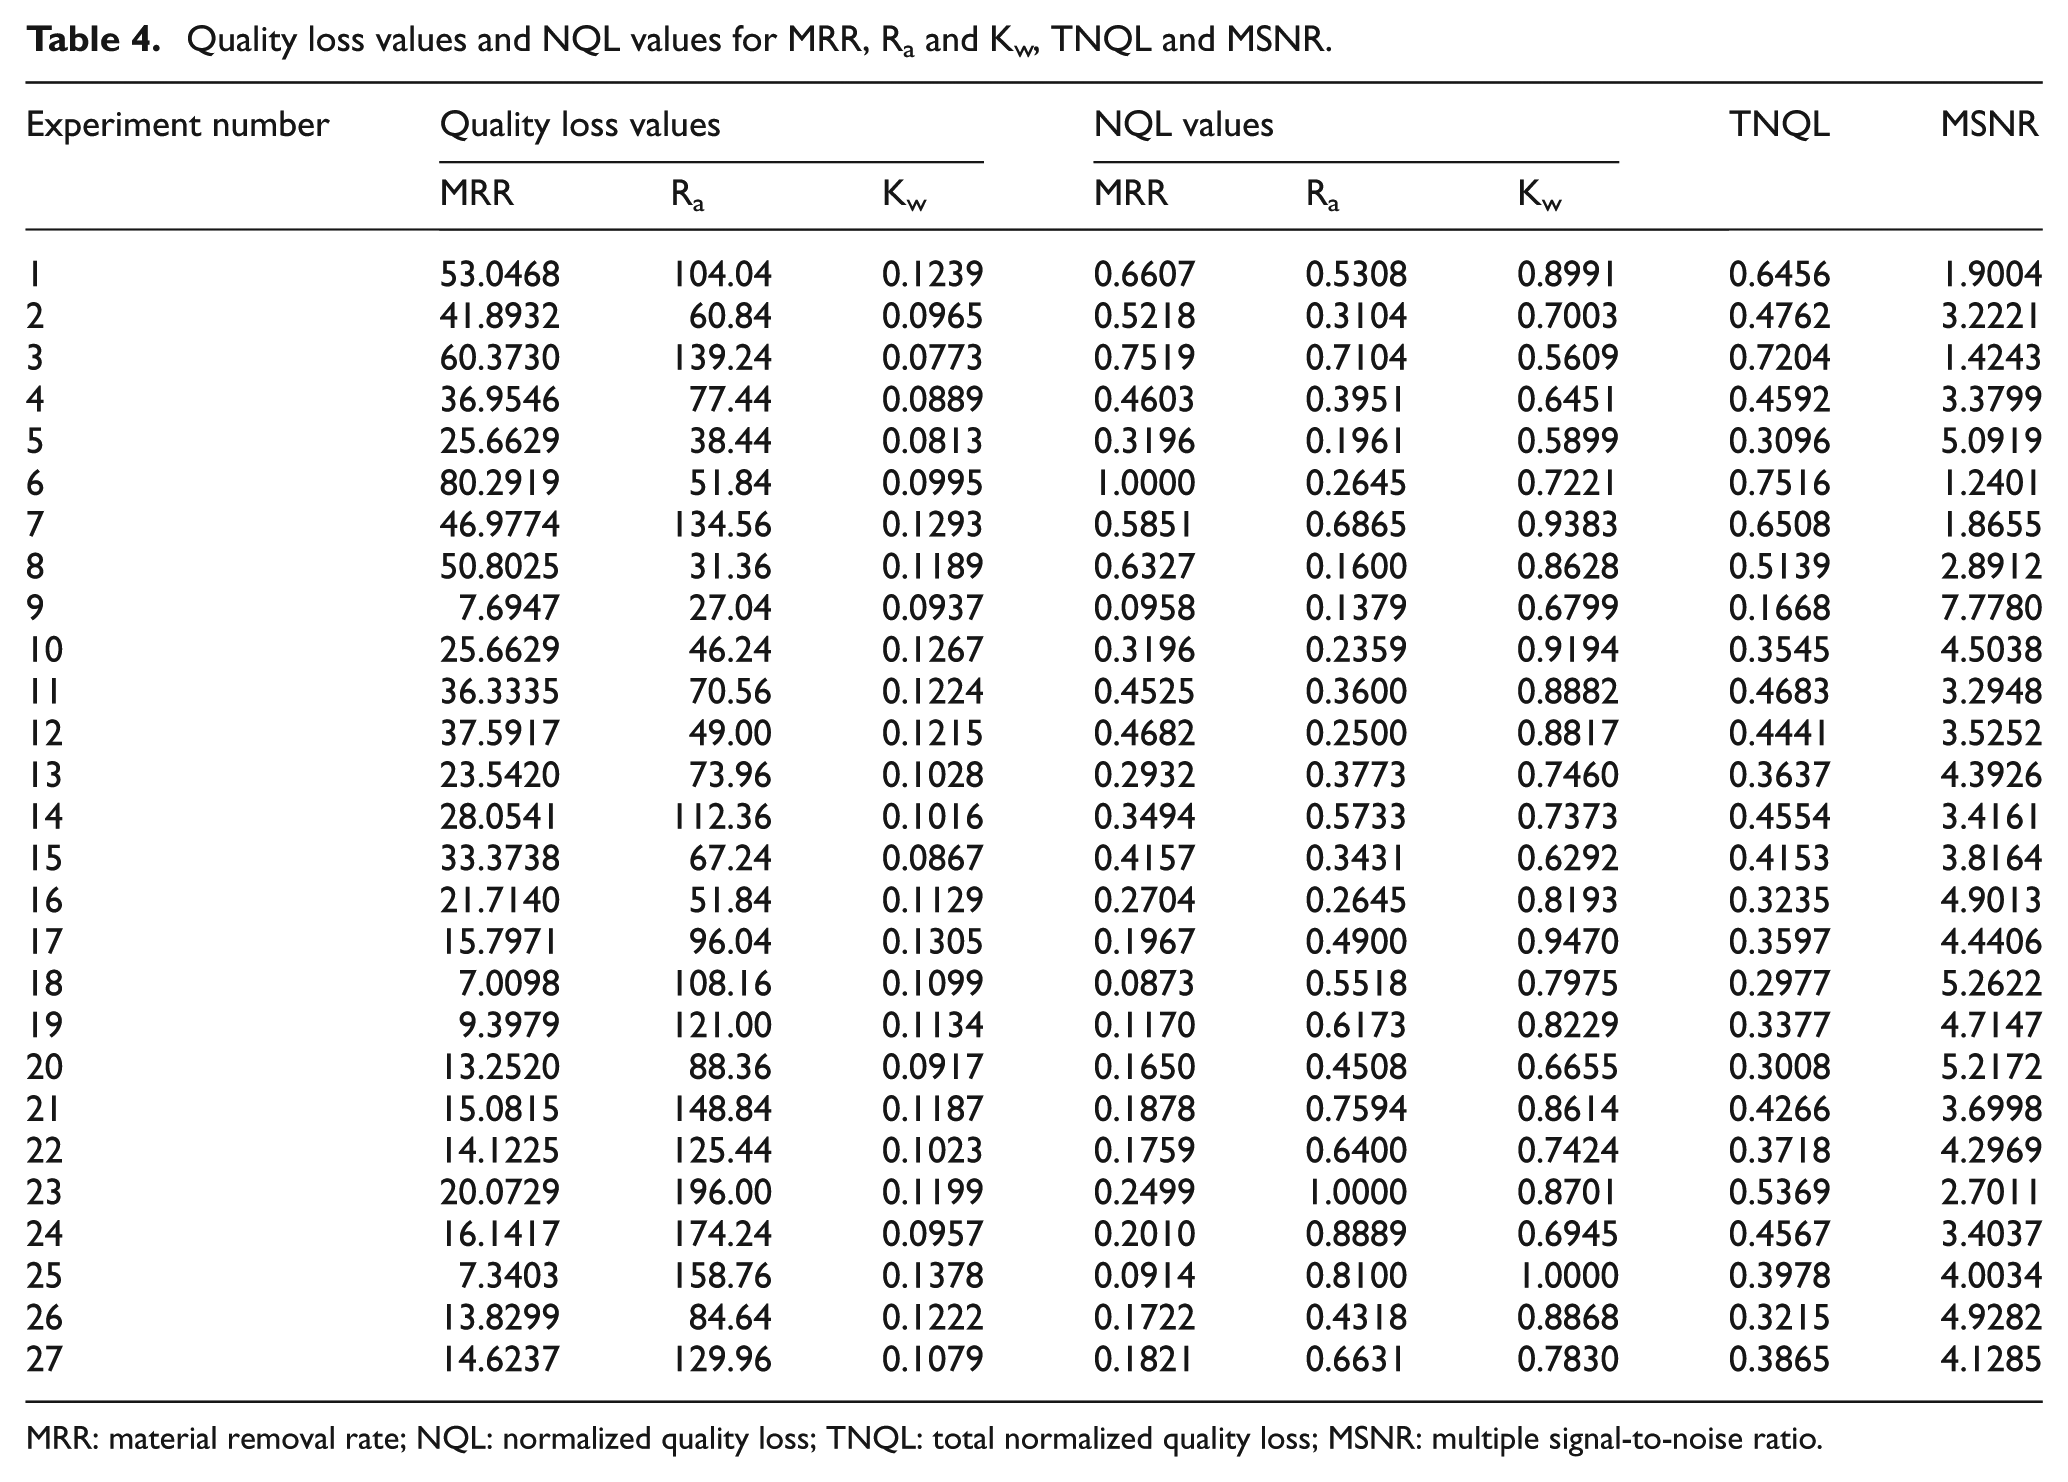
MRR: material removal rate; NQL: normalized quality loss; TNQL: total normalized quality loss; MSNR: multiple signal-to-noise ratio.
Effect of parameter levels on MSNR.
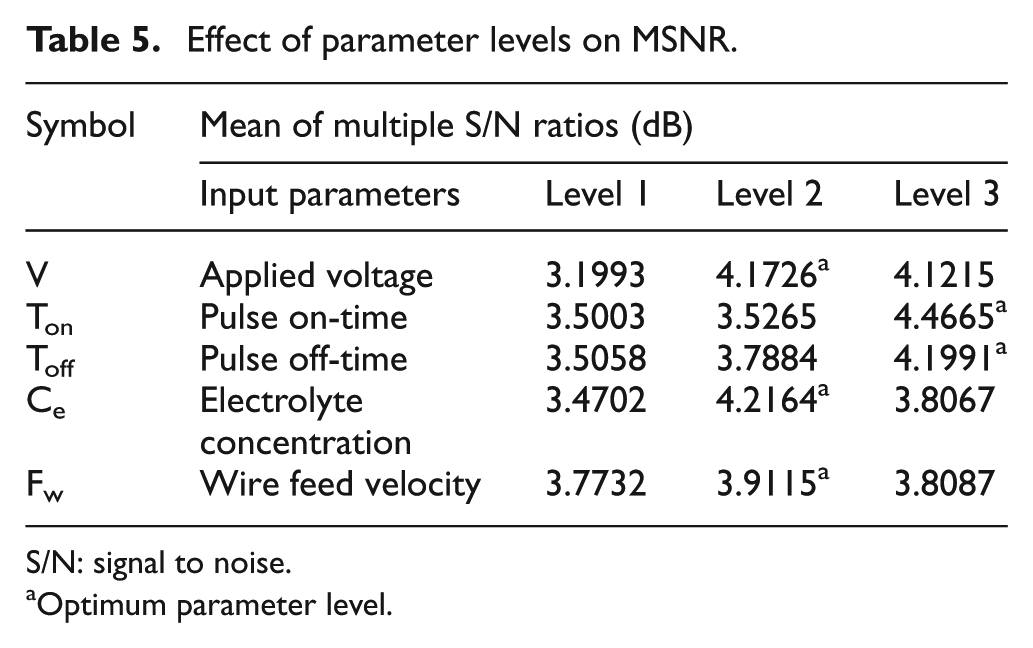
S/N: signal to noise.
Optimum parameter level.
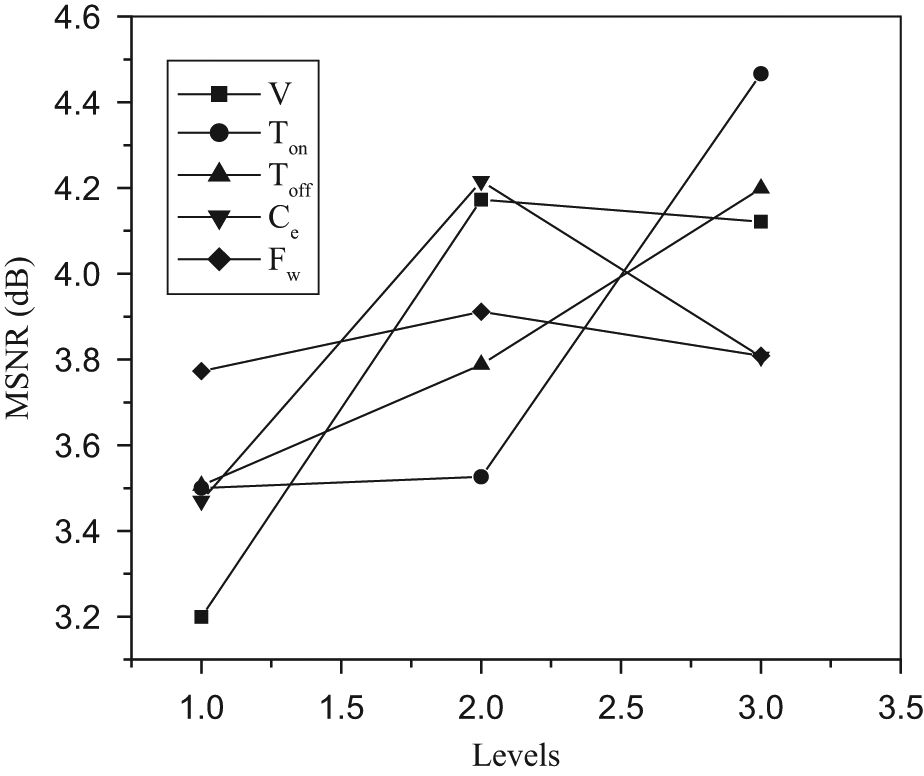
Main effect of input parameters on MSNR.
The general non-linear second-order response surface mathematical model, which analyses the parametric influences on the various response criteria, can be described as follows 24
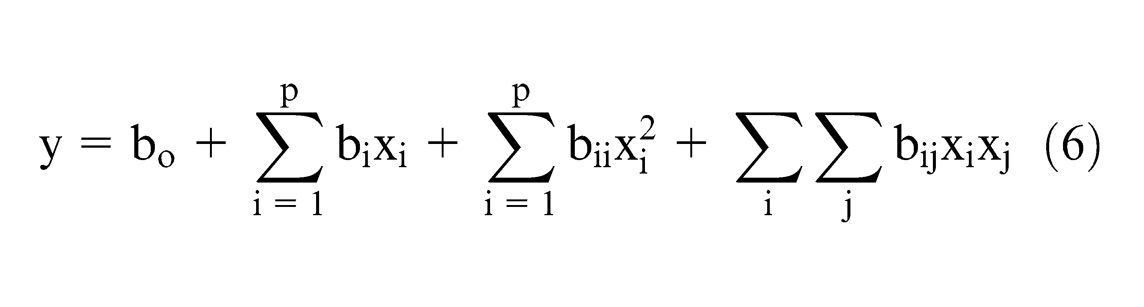
where y is corresponding response, that is, MRR, Ra and Kw of the TW-ECSM process, all bs are regression coefficients determined by least square method, xi is the coded values of ith machining parameters and p is number of machining parameters.
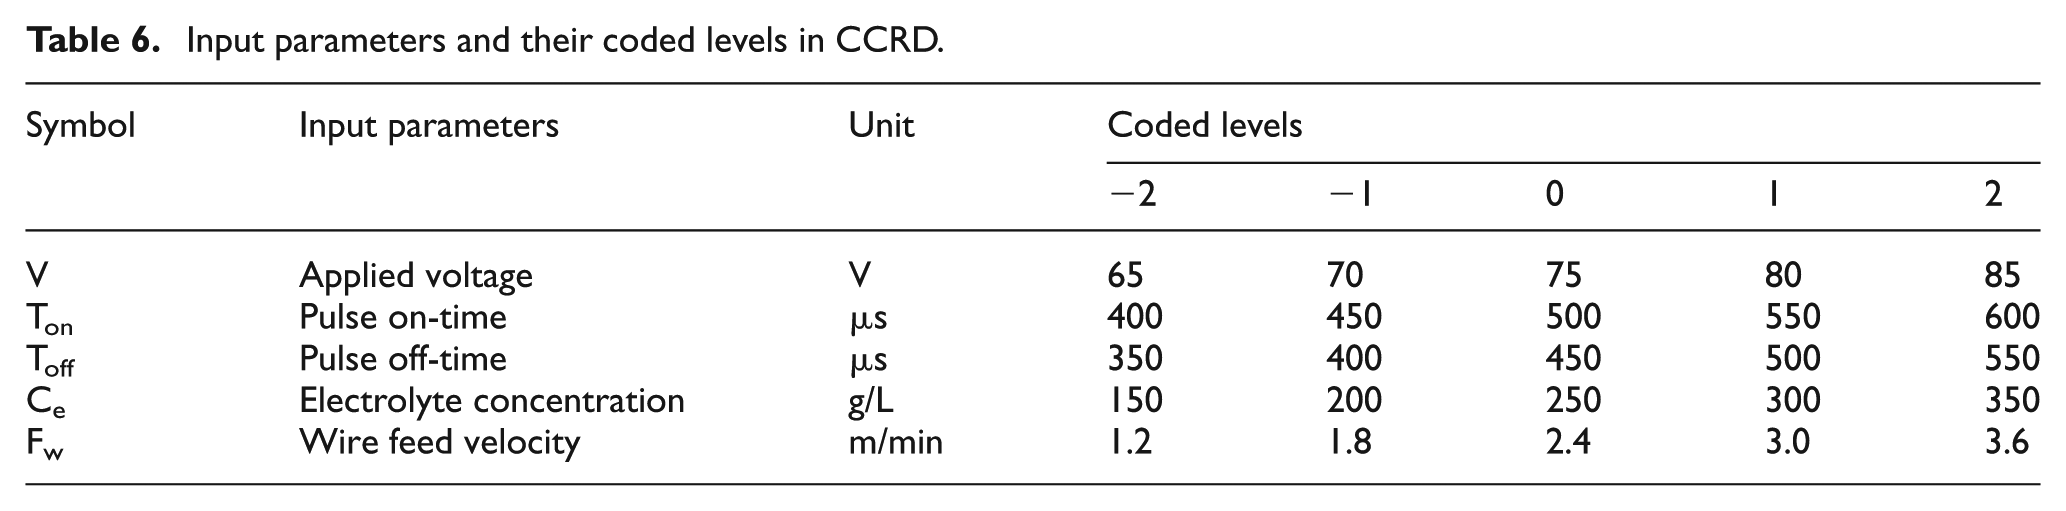
In this experimental investigation for machining with TW-ECSM, each x-variable was coded and the upper and lower levels of x were taken as +2 to −2 of every input parameter in order to design the experiments in an optimized way. The input parameters, their numerical and coded values used in CCRD matrix are given in Table 6. The second-order polynomial response surface model for MRR, Ra and Kw has been developed from the experimental response values obtained using CCRD experimental matrix, as shown in Table 7. The mathematical model on MRR, Ra and Kw of TW-ECSM has been established using Minitab software. These models are given as follows
Input parameters and their coded levels in CCRD.
Experimental observations using CCRD.
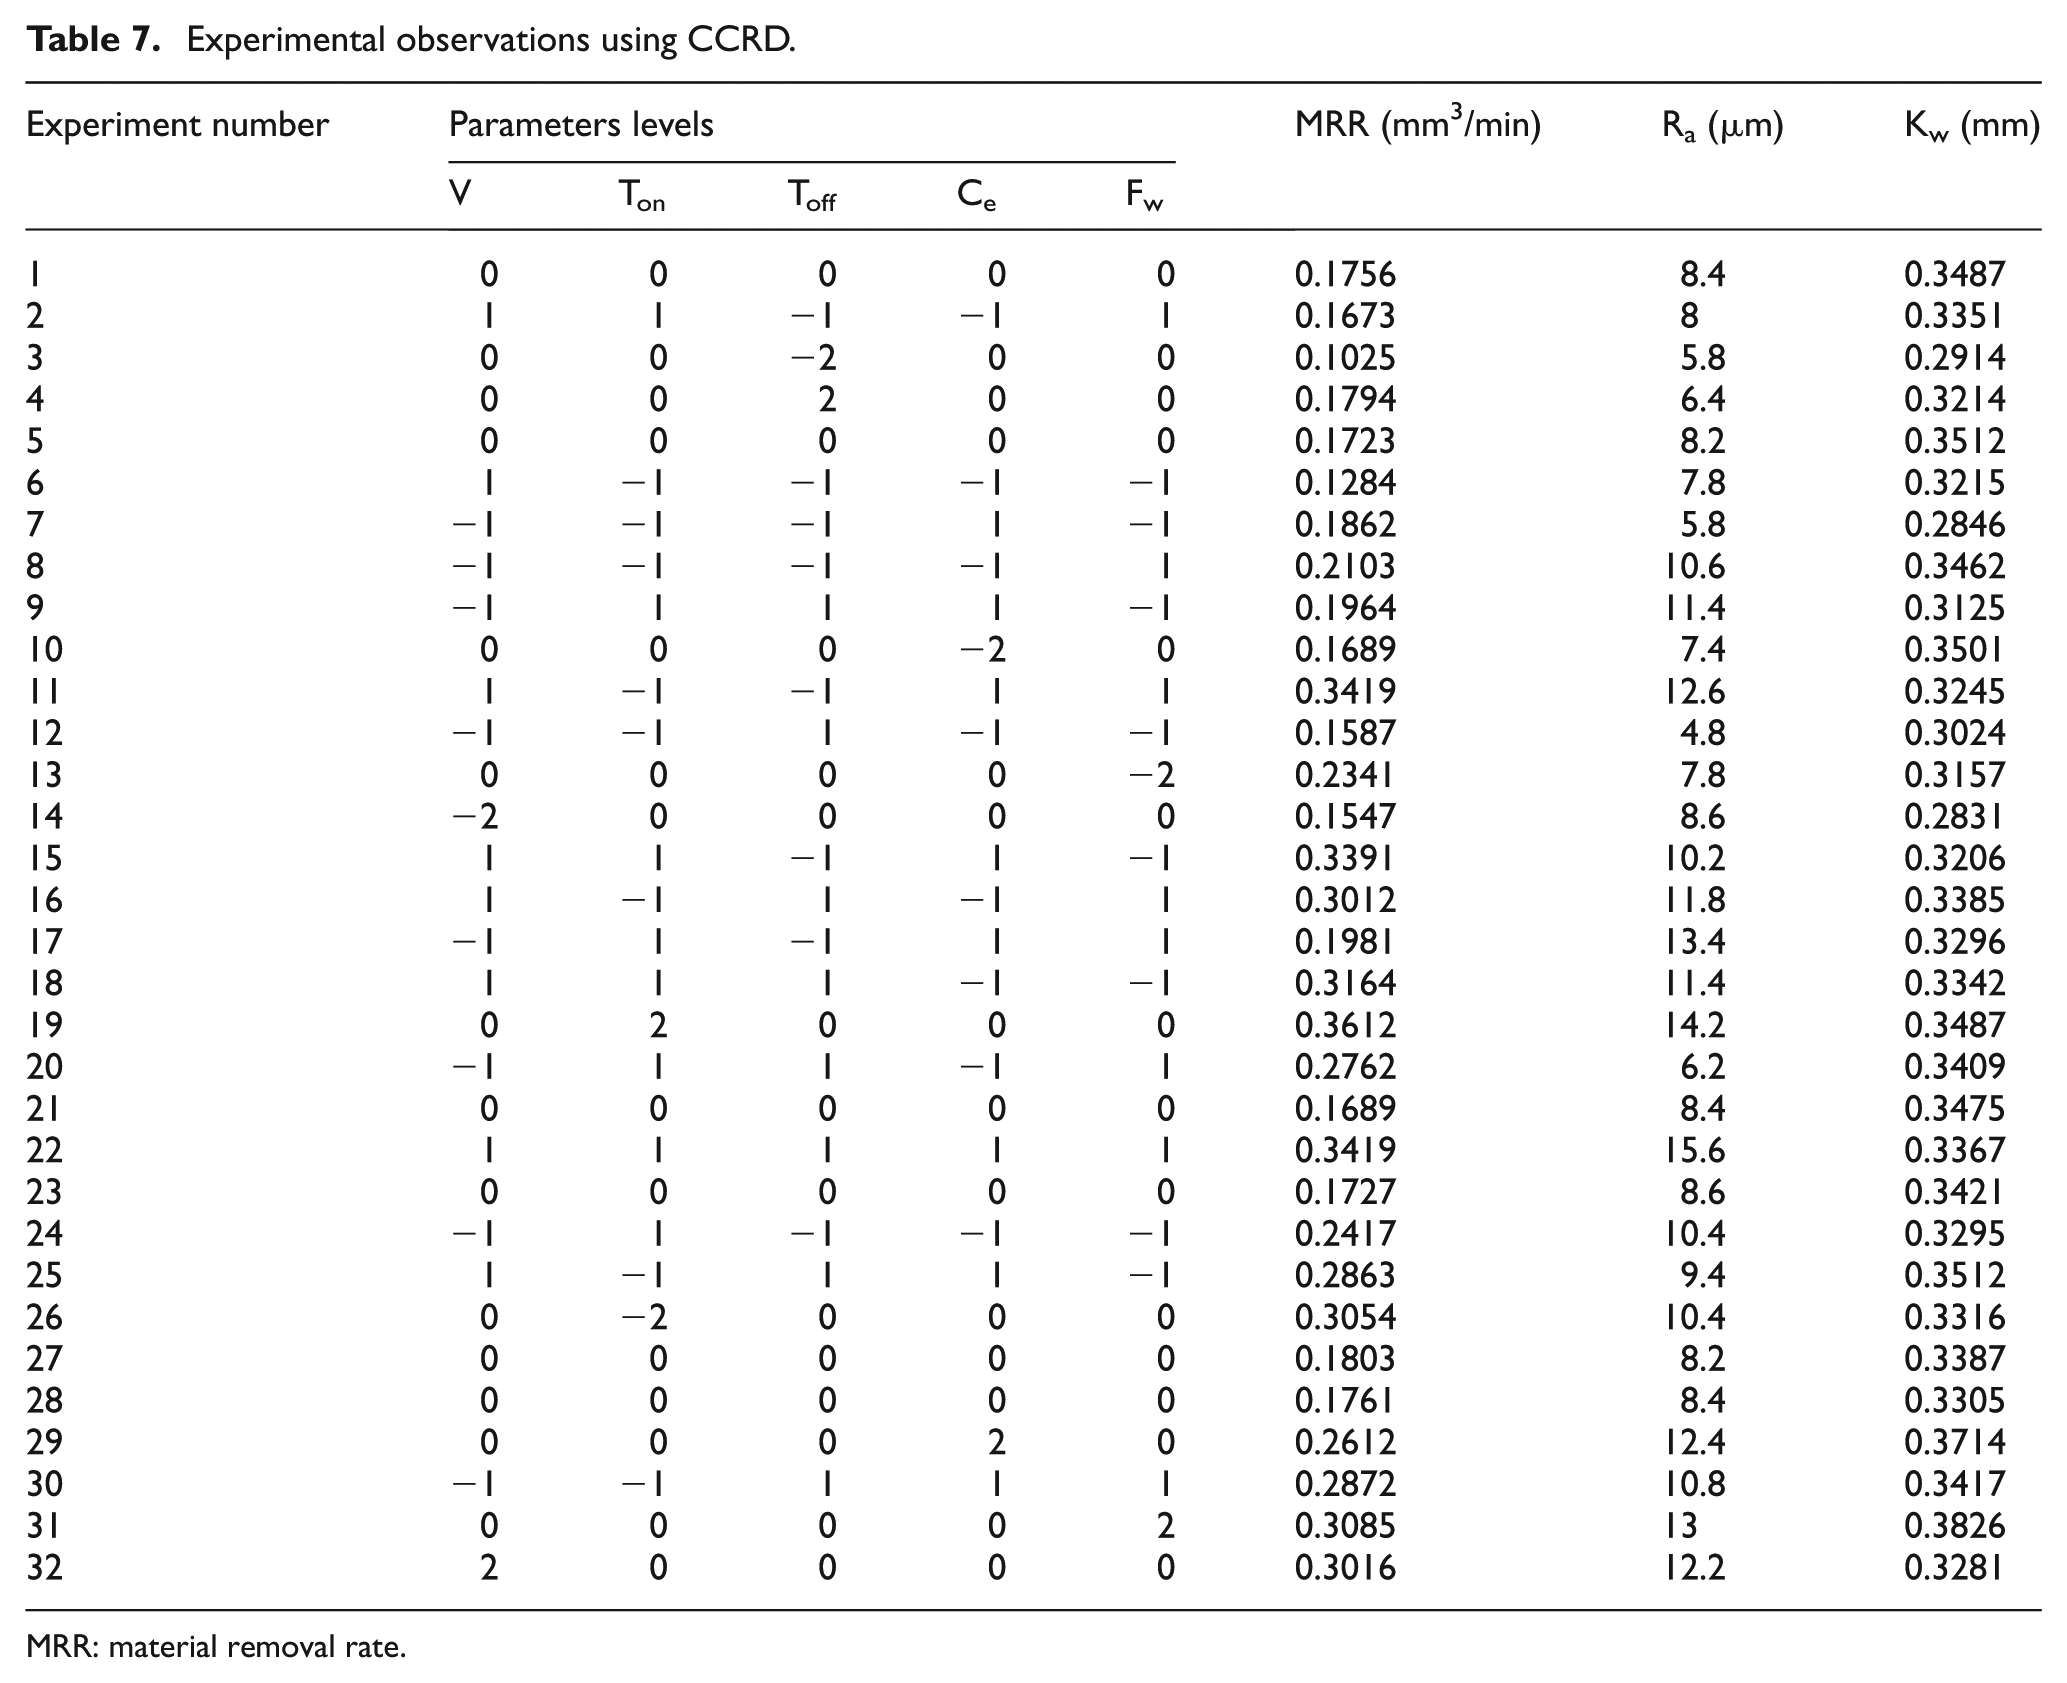
MRR: material removal rate.
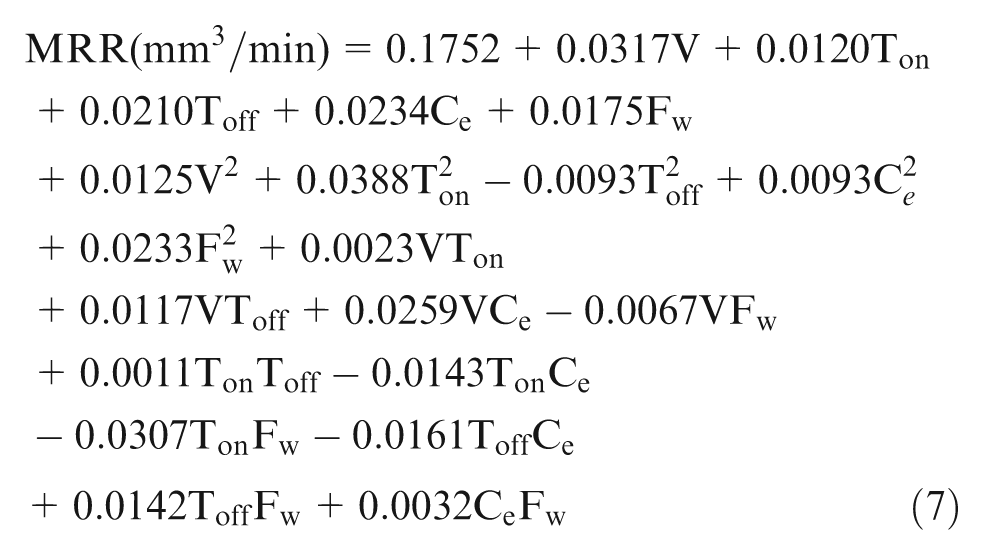
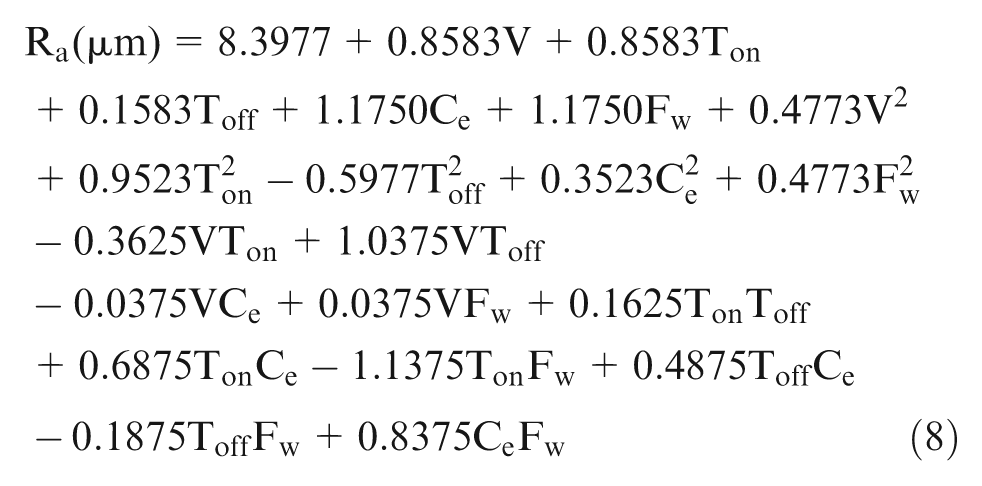
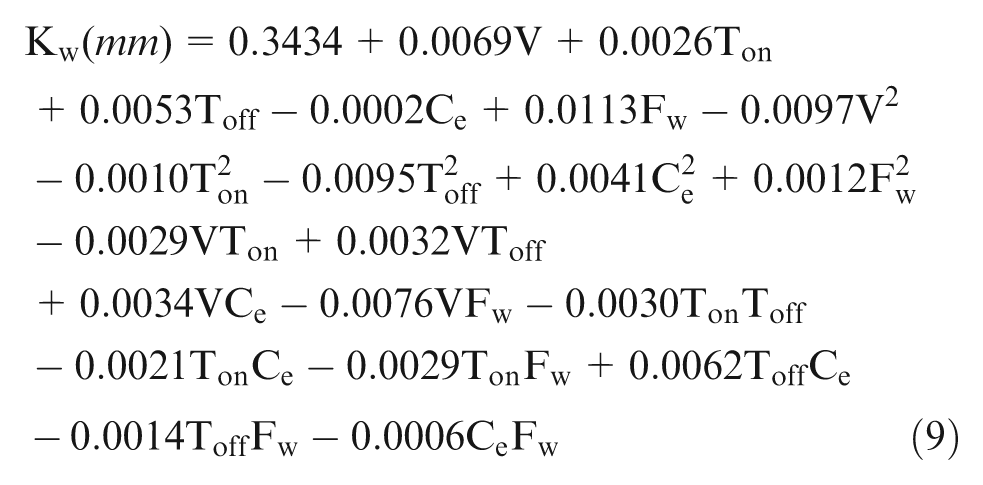
where V is applied voltage (V), Ton is pulse on-time (µs), Toff is pulse off-time (µs), Ce is electrolyte concentration (g/L) and Fw is wire feed velocity (m/min).
From the developed models, it is evident that the applied voltage, electrolyte concentration, square effect of pulse on-time and interaction effect of pulse off-time and wire feed velocity are the significant factors for MRR because the absolute value of corresponding coefficients for these terms are quite high in comparison to other terms. Similarly, Ra is significantly affected by electrolyte concentration, wire feed velocity, square effect of pulse on-time and interaction effect of applied voltage and pulse off-time. Kw is also significantly affected by wire feed velocity, applied voltage, square effect of electrolyte concentration, interaction effect of pulse off-time and electrolyte concentration. The calculated S values of the regression analysis for MRR, Ra and Kw are obtained as 0.007305, 0.2371 and 0.01108, respectively, which are very small values, and R2 values for both the responses are 99.6%, 99.7% and 90.9%, respectively. The value of adjusted R2 for MRR, Ra and Kw is 99%, 99.2% and 74.3%, respectively. All these values are close to unity, and R2 values are greater than adjusted R2 values as a result the data for each response are well fitted in the developed models.
Analysis of variance (ANOVA) technique is used to check the adequacy of the developed model for the desired confidence interval and tabulated in Table 8. Here, the calculated F-values of the lack of fit for MRR, Ra and Kw are 5.55, 3.71 and 2.98, respectively, which are smaller than the tabulated F-value of 10.7 at 99% confidence level. Furthermore, p-values of the source of regression, linear and square effects are lower than 0.01 for both the responses, which implies the above models are significant. Therefore, the developed second-order response surface model for MRR, Ra and Kw is adequate at 99% confidence level.
Results of ANOVA for developed models.
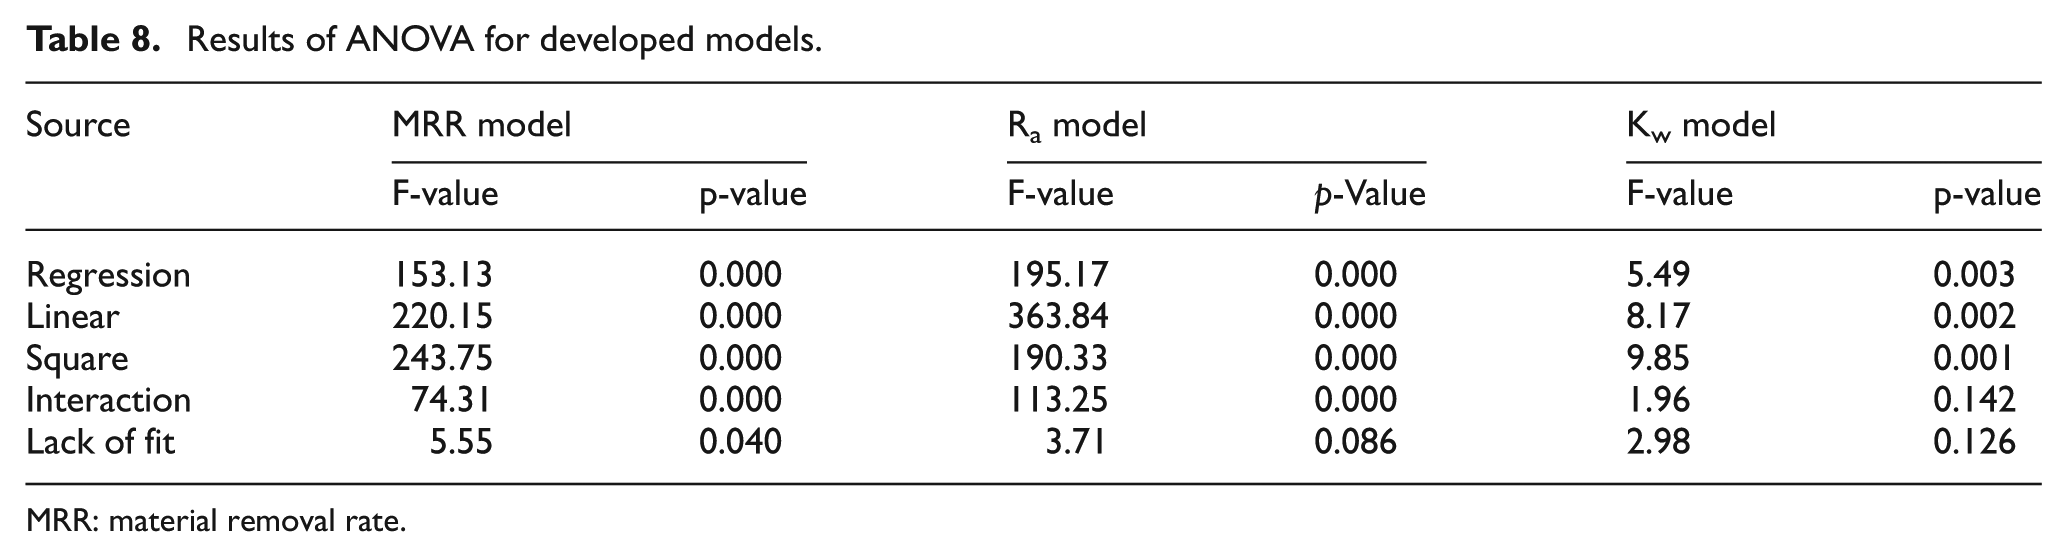
MRR: material removal rate.
Analysis of the parametric influences
The influences of each process parameter such as applied voltage (V), pulse on-time (Ton), pulse off-time (Toff), electrolyte concentration (Ec) and wire feed velocity (Fw) on performance parameter such as MRR (mm3/min), Ra (µm) and Kw (mm) during cutting of 2-mm-thick rectangular Pyrex glass sheet using TW-ECSM have been analysed based on the developed response surface model, for example, equations (7)–(9) and discussed in the following section.
Effect of process parameters on MRR
The effect of applied voltage and pulse on-time on MRR in TW-ECSM process was observed during cutting of Pyrex glass keeping the other parameters at constant value is shown in Figure 3(a). From the surface plot, it is observed that MRR increases with increase in applied voltage as well as pulse on-time because of the fact that at high applied voltage and pulse on-time, a large number of gas bubbles are generated, which implies higher discharge energy per spark and hence more heat is generated resulting in enhanced MRR.
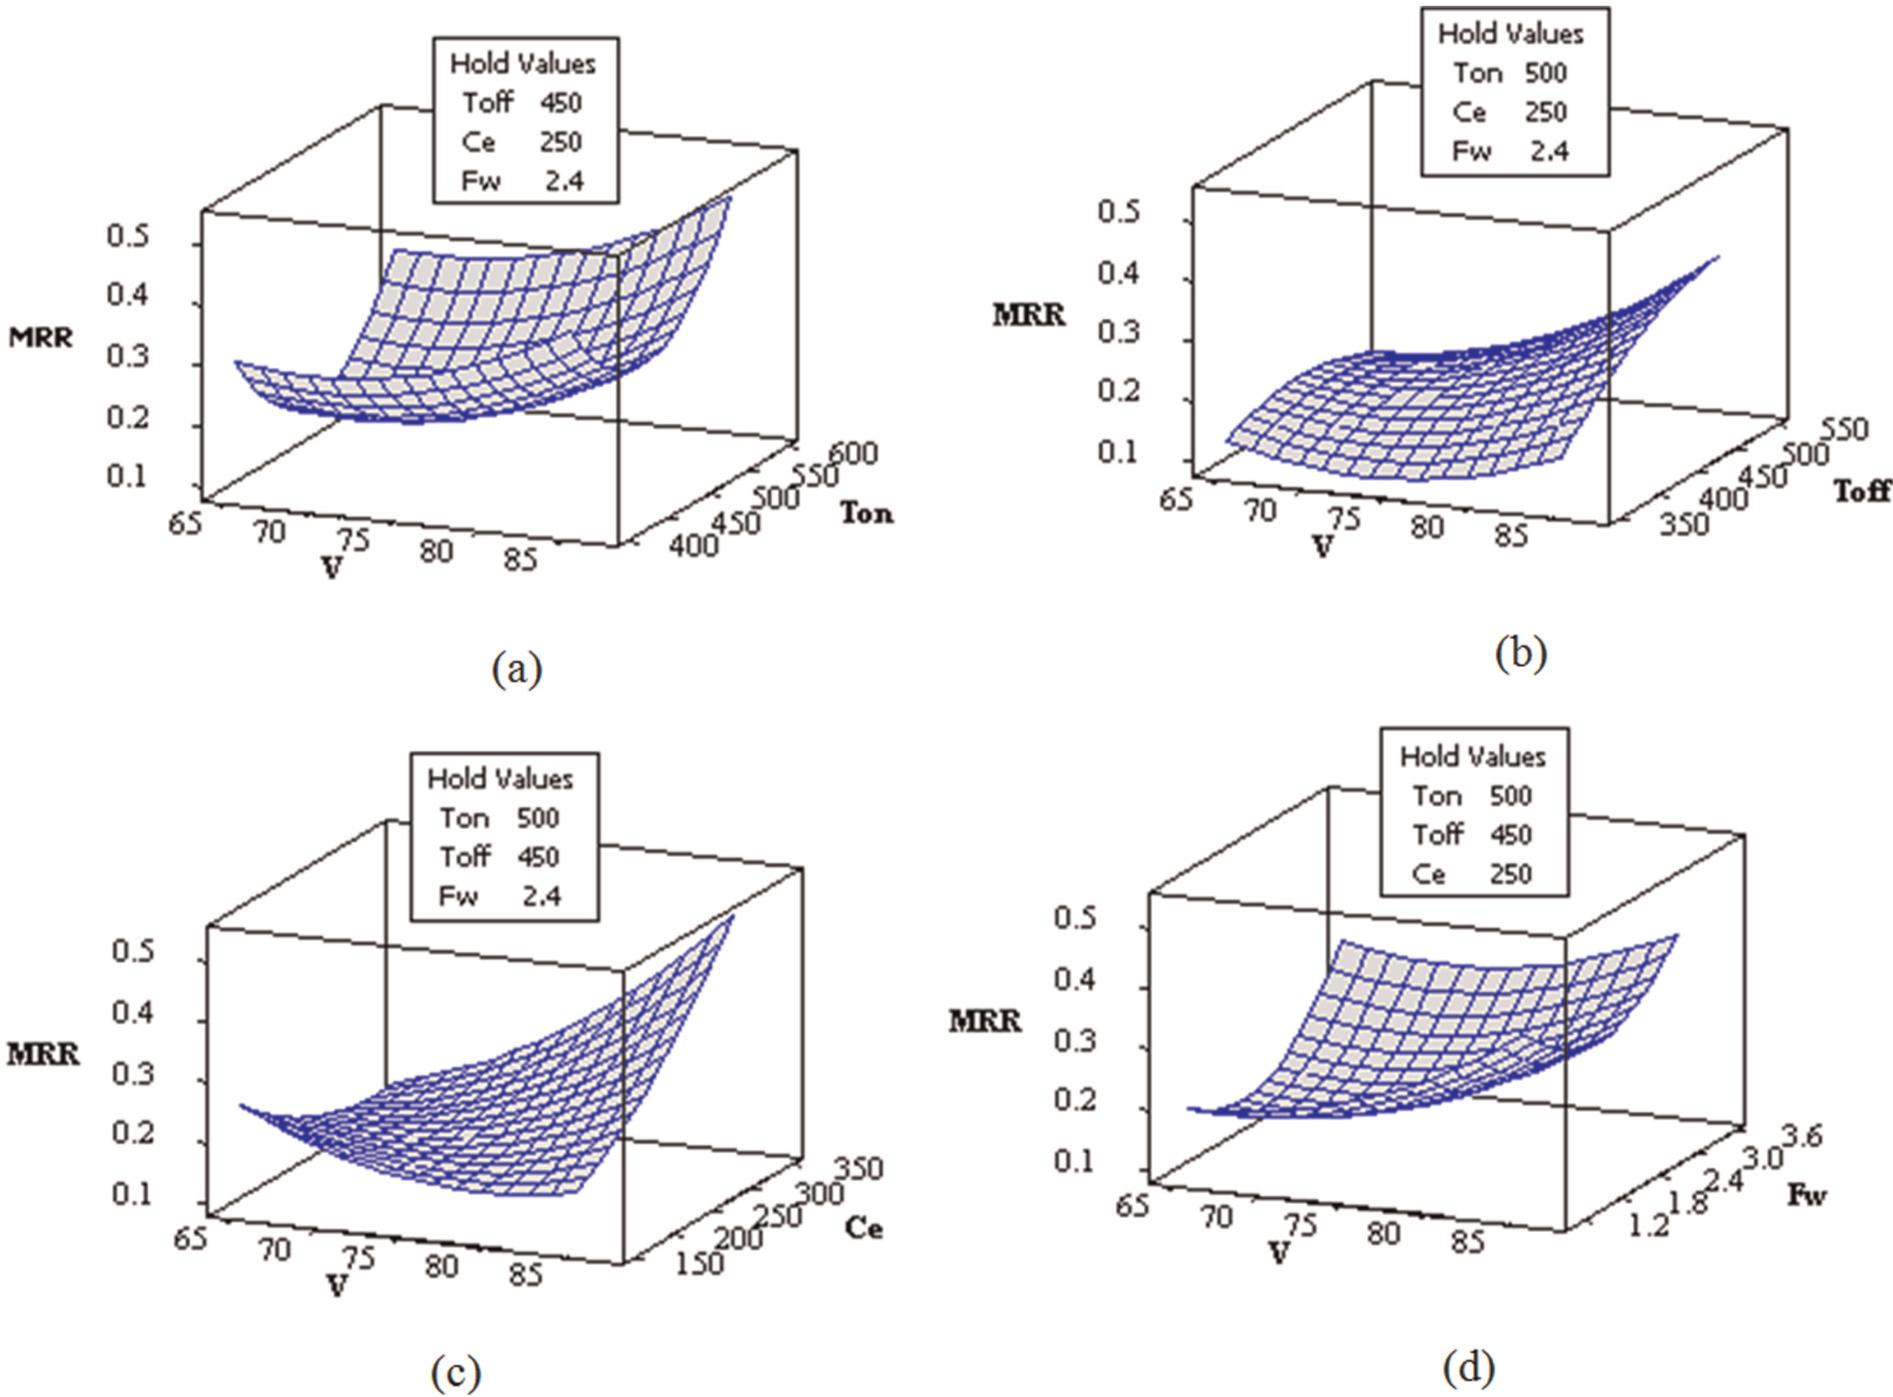
Response surface plot of MRR with (a) applied voltage (V) and pulse on-time (Ton), (b) applied voltage (V) and pulse off-time (Toff), (c) applied voltage (V) and electrolyte concentration (Ce) and (d) applied voltage (V) and wire feed velocity (Fw).
Figure 3(b) shows the effect of applied voltage and pulse off-time on MRR by keeping pulse on-time, electrolyte concentration and wire feed velocity constant at 500 µs, 250 g/L and 2.4 m/min, respectively. Response surface plot shows that MRR first increases and then decreases with increase of pulse off-time. This occurs due to availability of ample time to clear the disintegrated particles from the gap between the tool electrode and workpiece, which prohibits the arcing phenomenon. This leads to the formation of more stable spark resulting in the increase of MRR.
The combined effect of applied voltage and electrolyte concentration on MRR is illustrated in Figure 3(c). The pulse on-time, pulse off-time and wire feed velocity were taken at a constant value of 500 µs, 450 µs and 2.4 m/min. Surface plot reflects that MRR decreases with increase of electrolyte concentration because of decrease in circuit current owing to reduction of specific conductance with the rise of electrolyte concentration.
The effects of applied voltage and wire feed velocity on MRR have been demonstrated in Figure 3(d) at constant pulse on-time of 500 µs, pulse off-time of 450 µs and electrolyte concentration of 250 g/L. It is observed that MRR increases with increase in applied voltage as well as wire feed velocity because high wire feed velocity implies the increase of electrochemical dissolution rate. The electrochemical dissolution increases due to continuous exposure of new surface area of the wire into the electrolyte resulting in high current intensity and evolution of abundant amount of hydrogen gas bubbles, which promotes discharge action. This discharge energy increases the spark stability, thereby increasing the MRR.
Effect of process parameters on Ra
Based on the non-linear model of Ra established through the RSM, the effect of applied voltage and pulse on-time on Ra by keeping the other parameters at constant value is shown in Figure 4(a). The surface plot demonstrates that Ra increases with increase in applied voltage and pulse on-time. The reason is that at high applied voltage and pulse on-time, discharge energy per spark is high thus causing generation of large amount of hydrogen gas bubbles and thus increasing the spark intensity. Since the formation of crater on the machined surface primarily depends on the spark intensity, therefore it leads to increase in Ra.
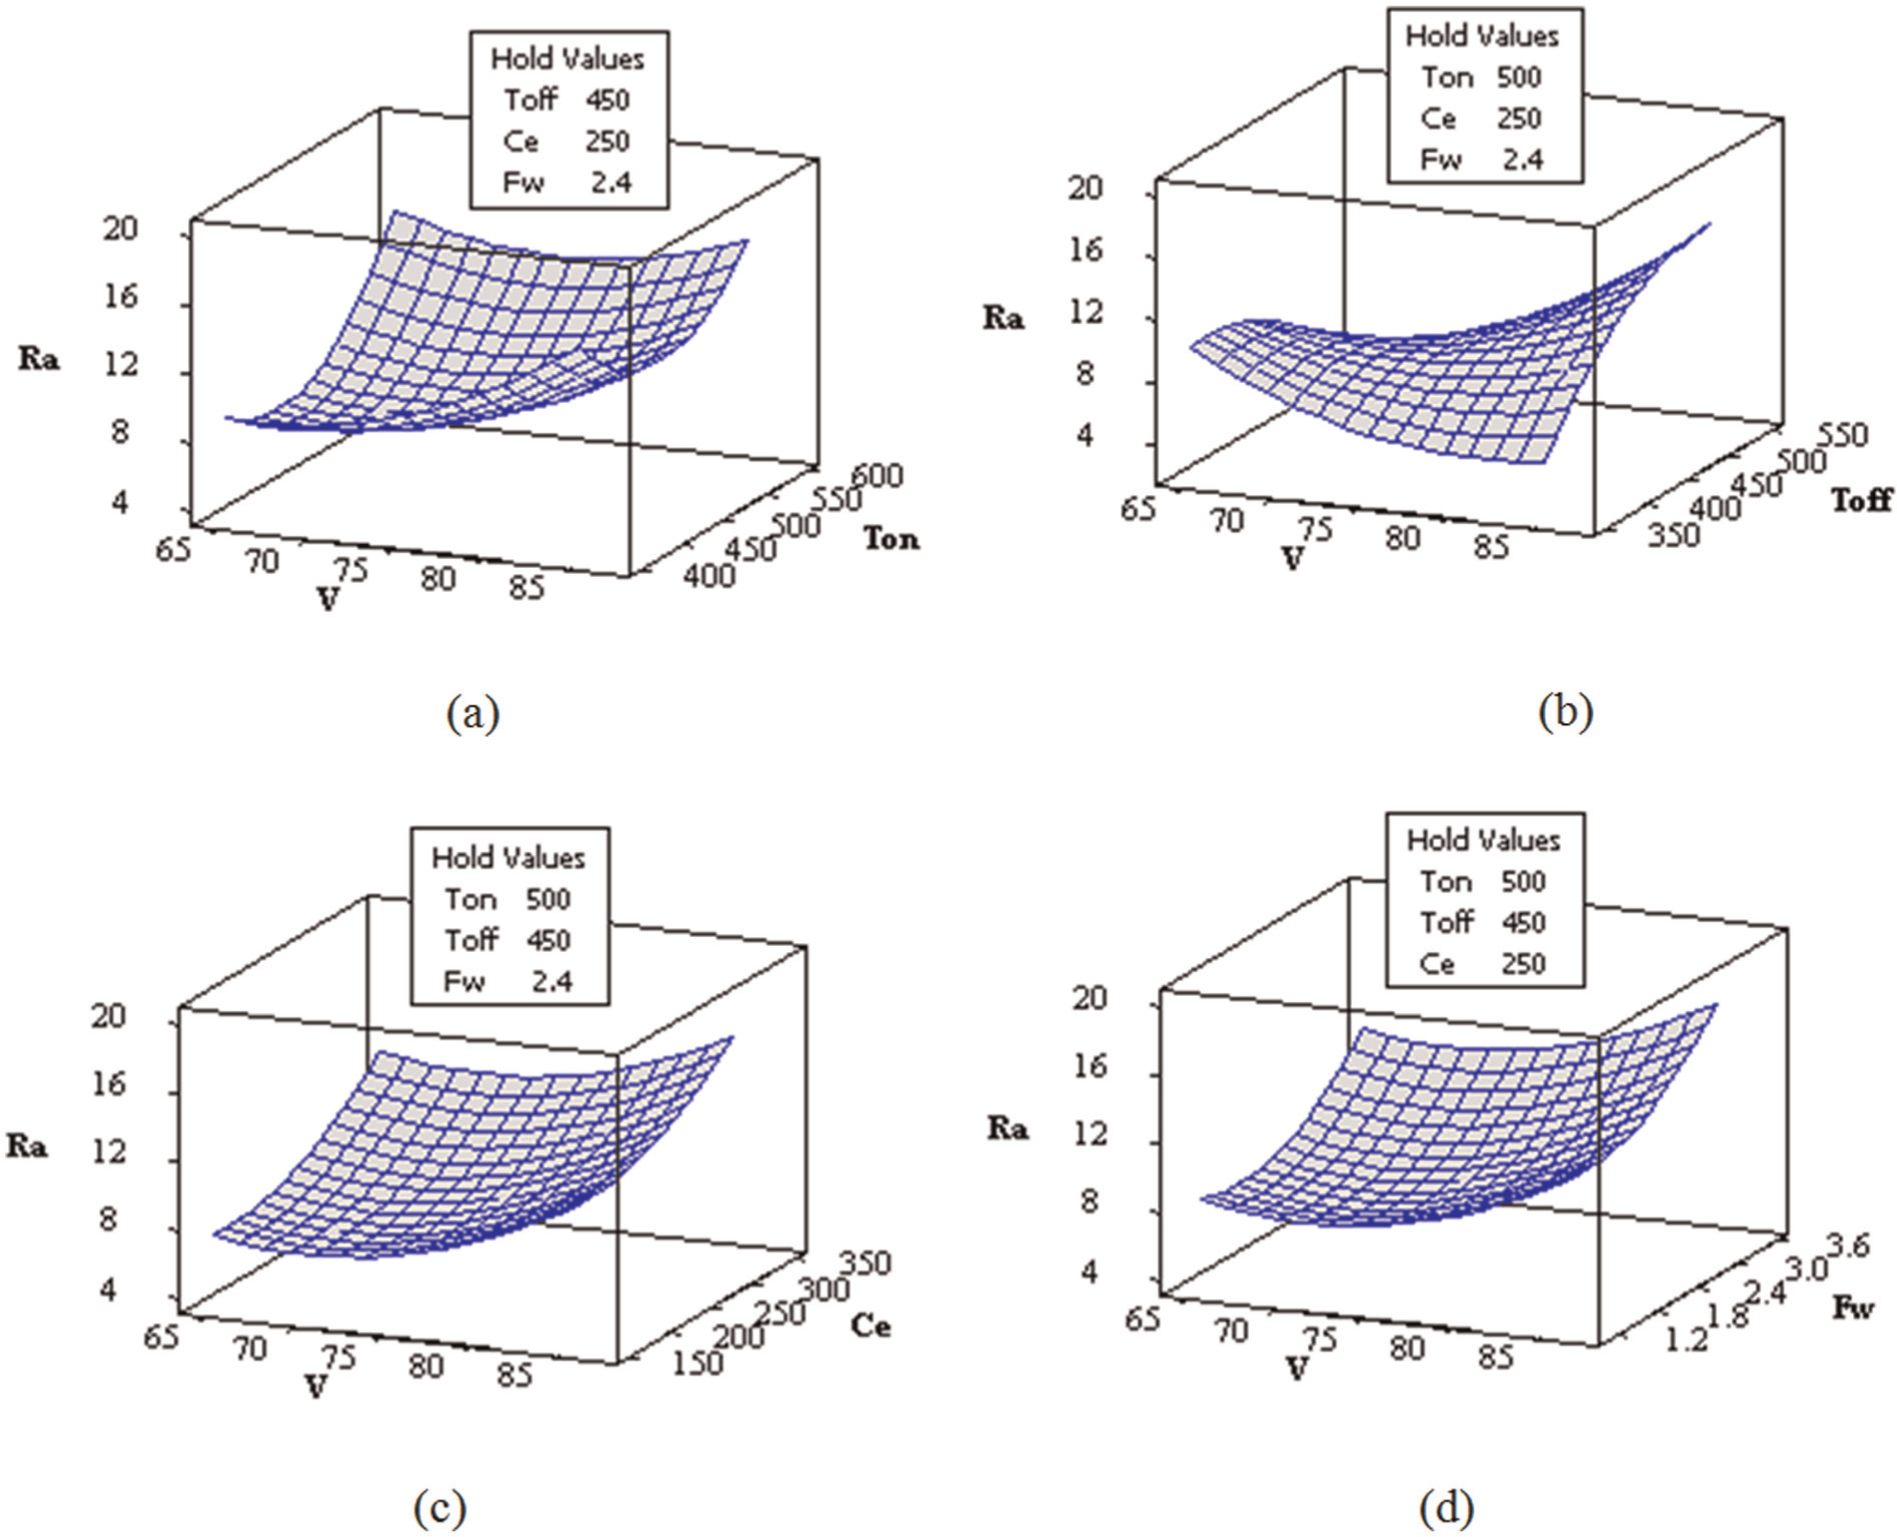
Response surface plot of Ra with (a) applied voltage (V) and pulse on-time (Ton), (b) applied voltage (V) and pulse off-time (Toff), (c) applied voltage (V) and electrolyte concentration (Ce) and (d) applied voltage (V) and wire feed velocity (Fw).
Figure 4(b) illustrates the effect of applied voltage and pulse off-time on Ra by keeping pulse on-time, electrolyte concentration and wire feed velocity constant value at 500 µs, 250 g/L and 2.4 m/min, respectively. Here, Ra decreases with increase of pulse off-time due to cooling effect on the tool electrode and workpiece surface. The surface plot also depicts that Ra decreases with increase of applied voltage. At high applied voltage, the spark intensity is enough to melt and remove most of the material due to which the formation of recast layer does not take place, decreasing the Ra value.
The combined influence of applied voltage and electrolyte concentration on Ra is depicted in Figure 4(c) at constant pulse on-time (500 µs), pulse off-time (450 µs) and wire feed velocity (2.4 m/min). It is observed from the surface plot that Ra increases with increase of electrolyte concentration and applied voltage. The reason is that the specific conductance increases with increase of electrolyte concentration, and greater number of gas bubbles is generated due to increase of applied voltage, which produces a crater of large depth, increasing the Ra.
Figure 4(d) shows the effect of applied voltage and wire feed velocity on Ra. It is observed that Ra increases with increase in applied voltage and wire feed velocity because increase of wire feed velocity implies the feeding of new contact surface in the electrolyte, resulting in a greater amount of spark generation in the sparking zone to produce large crater, which in turn increases the Ra.
Effect of process parameters on Kw
The effect of applied voltage and pulse on-time on Kw keeping the other parameters at constant value, that is, pulse off-time (450 µs), electrolyte concentration (250 g/L) and wire feed velocity (2.4 m/min), is shown in Figure 5(a). It is seen from the surface plot that Kw increases with increase in applied voltage for lower value of pulse on-time and decreases for higher value of pulse on-time. The reason behind is that at higher pulse on-time, higher spark energy is produced, thus increasing accumulation of debris at cutting zone. The debris attaches on the workpiece, which causes unwanted spark, resulting in rapid erosion of tool material, thus removing small material from the workpiece, which consequently decreases the Kw.
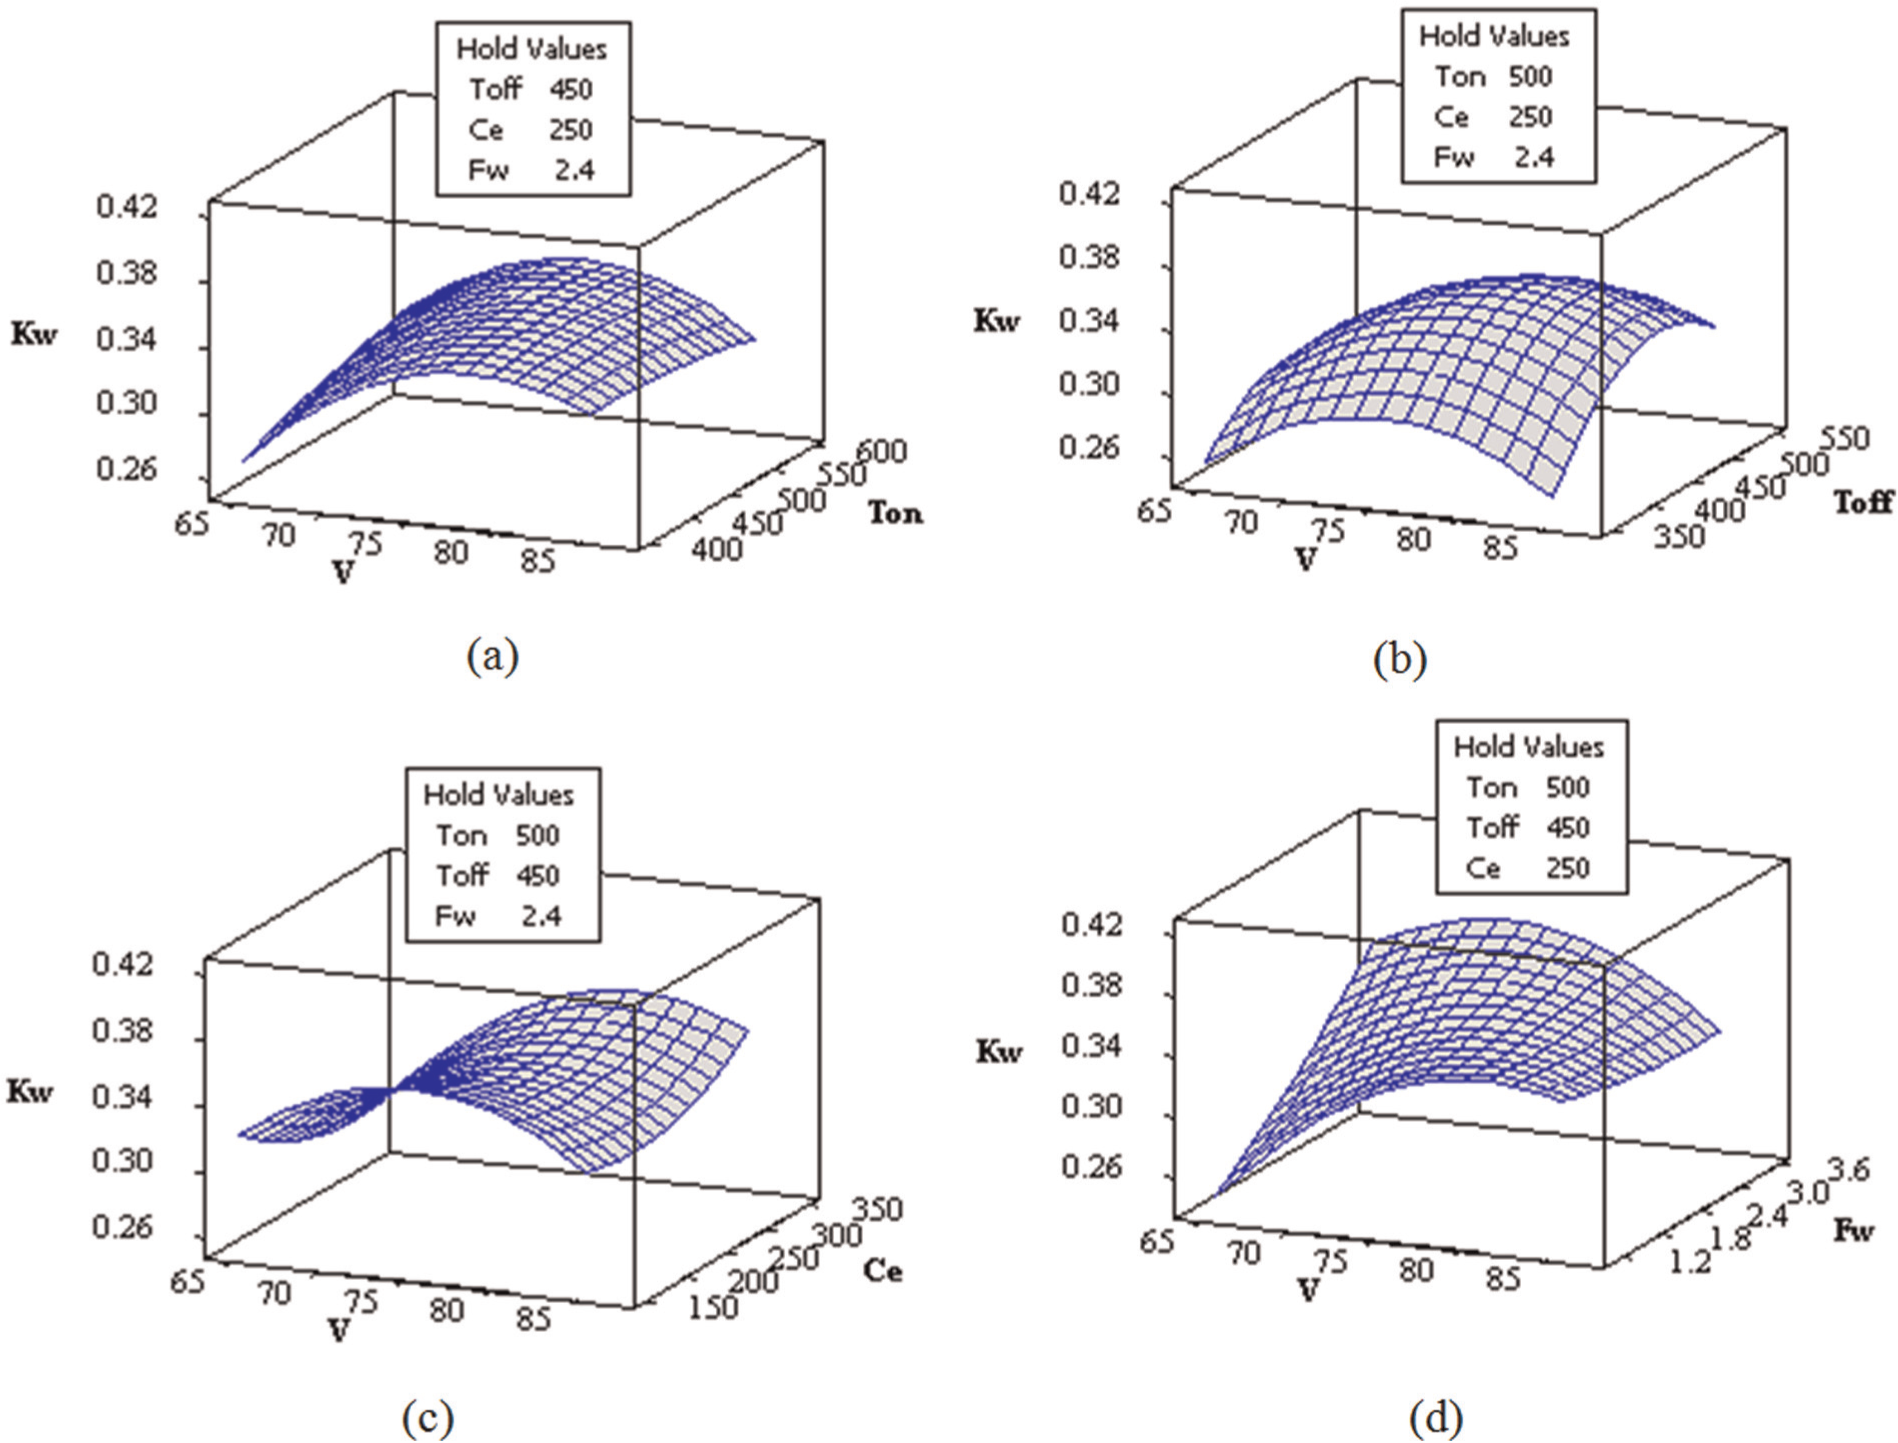
Response surface plot of Kw with (a) applied voltage (V) and pulse on-time (Ton), (b) applied voltage (V) and pulse off-time (Toff), (c) applied voltage (V) and electrolyte concentration (Ce) and (d) applied voltage (V) and wire feed velocity (Fw).
Figure 5(b) demonstrates the influence of applied voltage and pulse off-time on Kw keeping other parameters constant. Kw increases with increase of pulse off-time for the first part of the curve and then it decreases after reaching the peak value. The fact is that there is enough time to clear the debris particles from the gap between the wire electrode and workpiece, which implies increase in the overcut on the machined surface. With the rise of pulse off-time, the workpiece has sufficient time between the occurrences of two sparks, which may lead to reduction of temperature, thus decreasing the Kw.
The effects of applied voltage and electrolyte concentration on Kw (at constant pulse on-time, pulse off-time and wire feed velocity) have been illustrated in Figure 5(c). The variation on Kw is in curvilinear manner with change of applied voltage and electrolyte concentration, which means initially Kw increases with increase of electrolyte concentration and then it decreases after reaching its maximum value. At higher electrolyte concentration, more electrochemical reaction occurs between wire electrode and auxiliary electrode, which produces more gas bubbles at the sparking zone, thus generating large number of sparks. The increase in number of spark will produce at the surface of workpiece resulting in overcut hence increase the Kw.
Figure 5(d) shows the influence of applied voltage and wire feed velocity on Kw. Here, pulse on-time, pulse off-time and electrolyte concentration were kept at a constant value of 500 µs, 450 µs and 250 g/L, respectively. It has been found from the RSM plot that Kw increases with increase in applied voltage as well as wire feed velocity. The reason is that at high wire feed velocity, the electrochemical dissolution rate increases resulting in rise of current intensity and formation of large amount of gas bubbles, which further promotes the discharge energy per spark. Thus, more amount of heat energy penetrates the workpiece, which produces large overcut during machining. These phenomena enhance the Kw.
Optimization of TW-ECSM process using GRAPCA
Optimization is used to find an alternative with the most cost-effective or highest achievable performance under the given constraints, by maximizing desired factors and minimizing undesired ones. The prime objective in TW-ECSM is to maximize MRR and minimize Ra and Kw simultaneously. In this study, a suitable hybrid multi-response optimization approach, for example, GRAPCA, has been applied first time for TW-ECSM process.
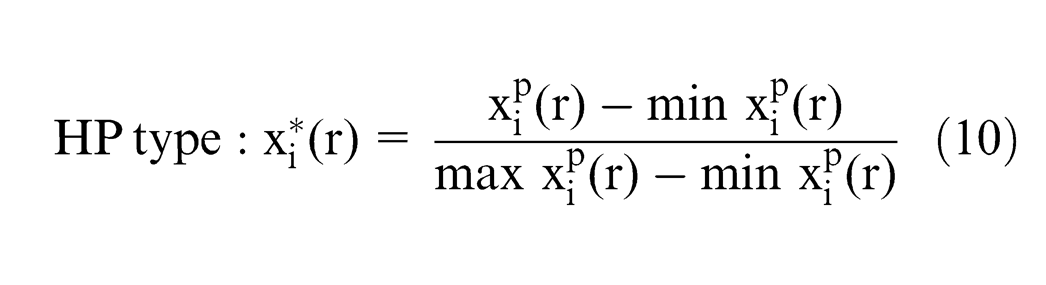
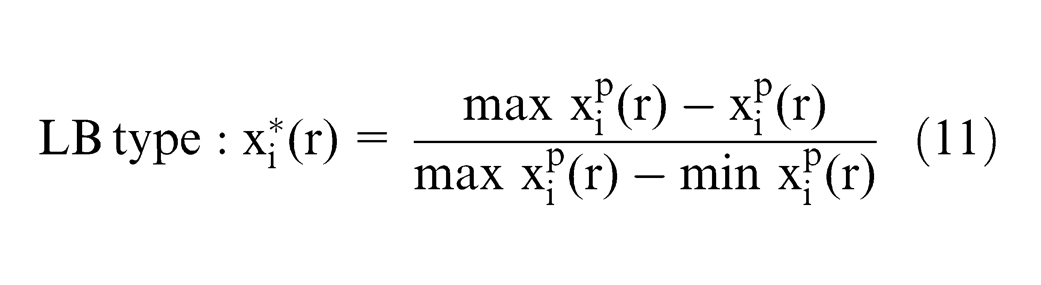
GRA is a measurement-based approach in grey system theory that analyses the degree of relation in a discrete sequence. In this method, data preprocessing is normally required since the range and unit in one data sequence may differ from the others. In the present case, higher values of MRR, lower values of Ra as well as Kw are the indication of better performance of TW-ECSM process. Hence, the original sequence of both quality characteristics should be normalized using the following equation27,28
Here,
where
Sequence of each quality characteristic after data preprocessing.
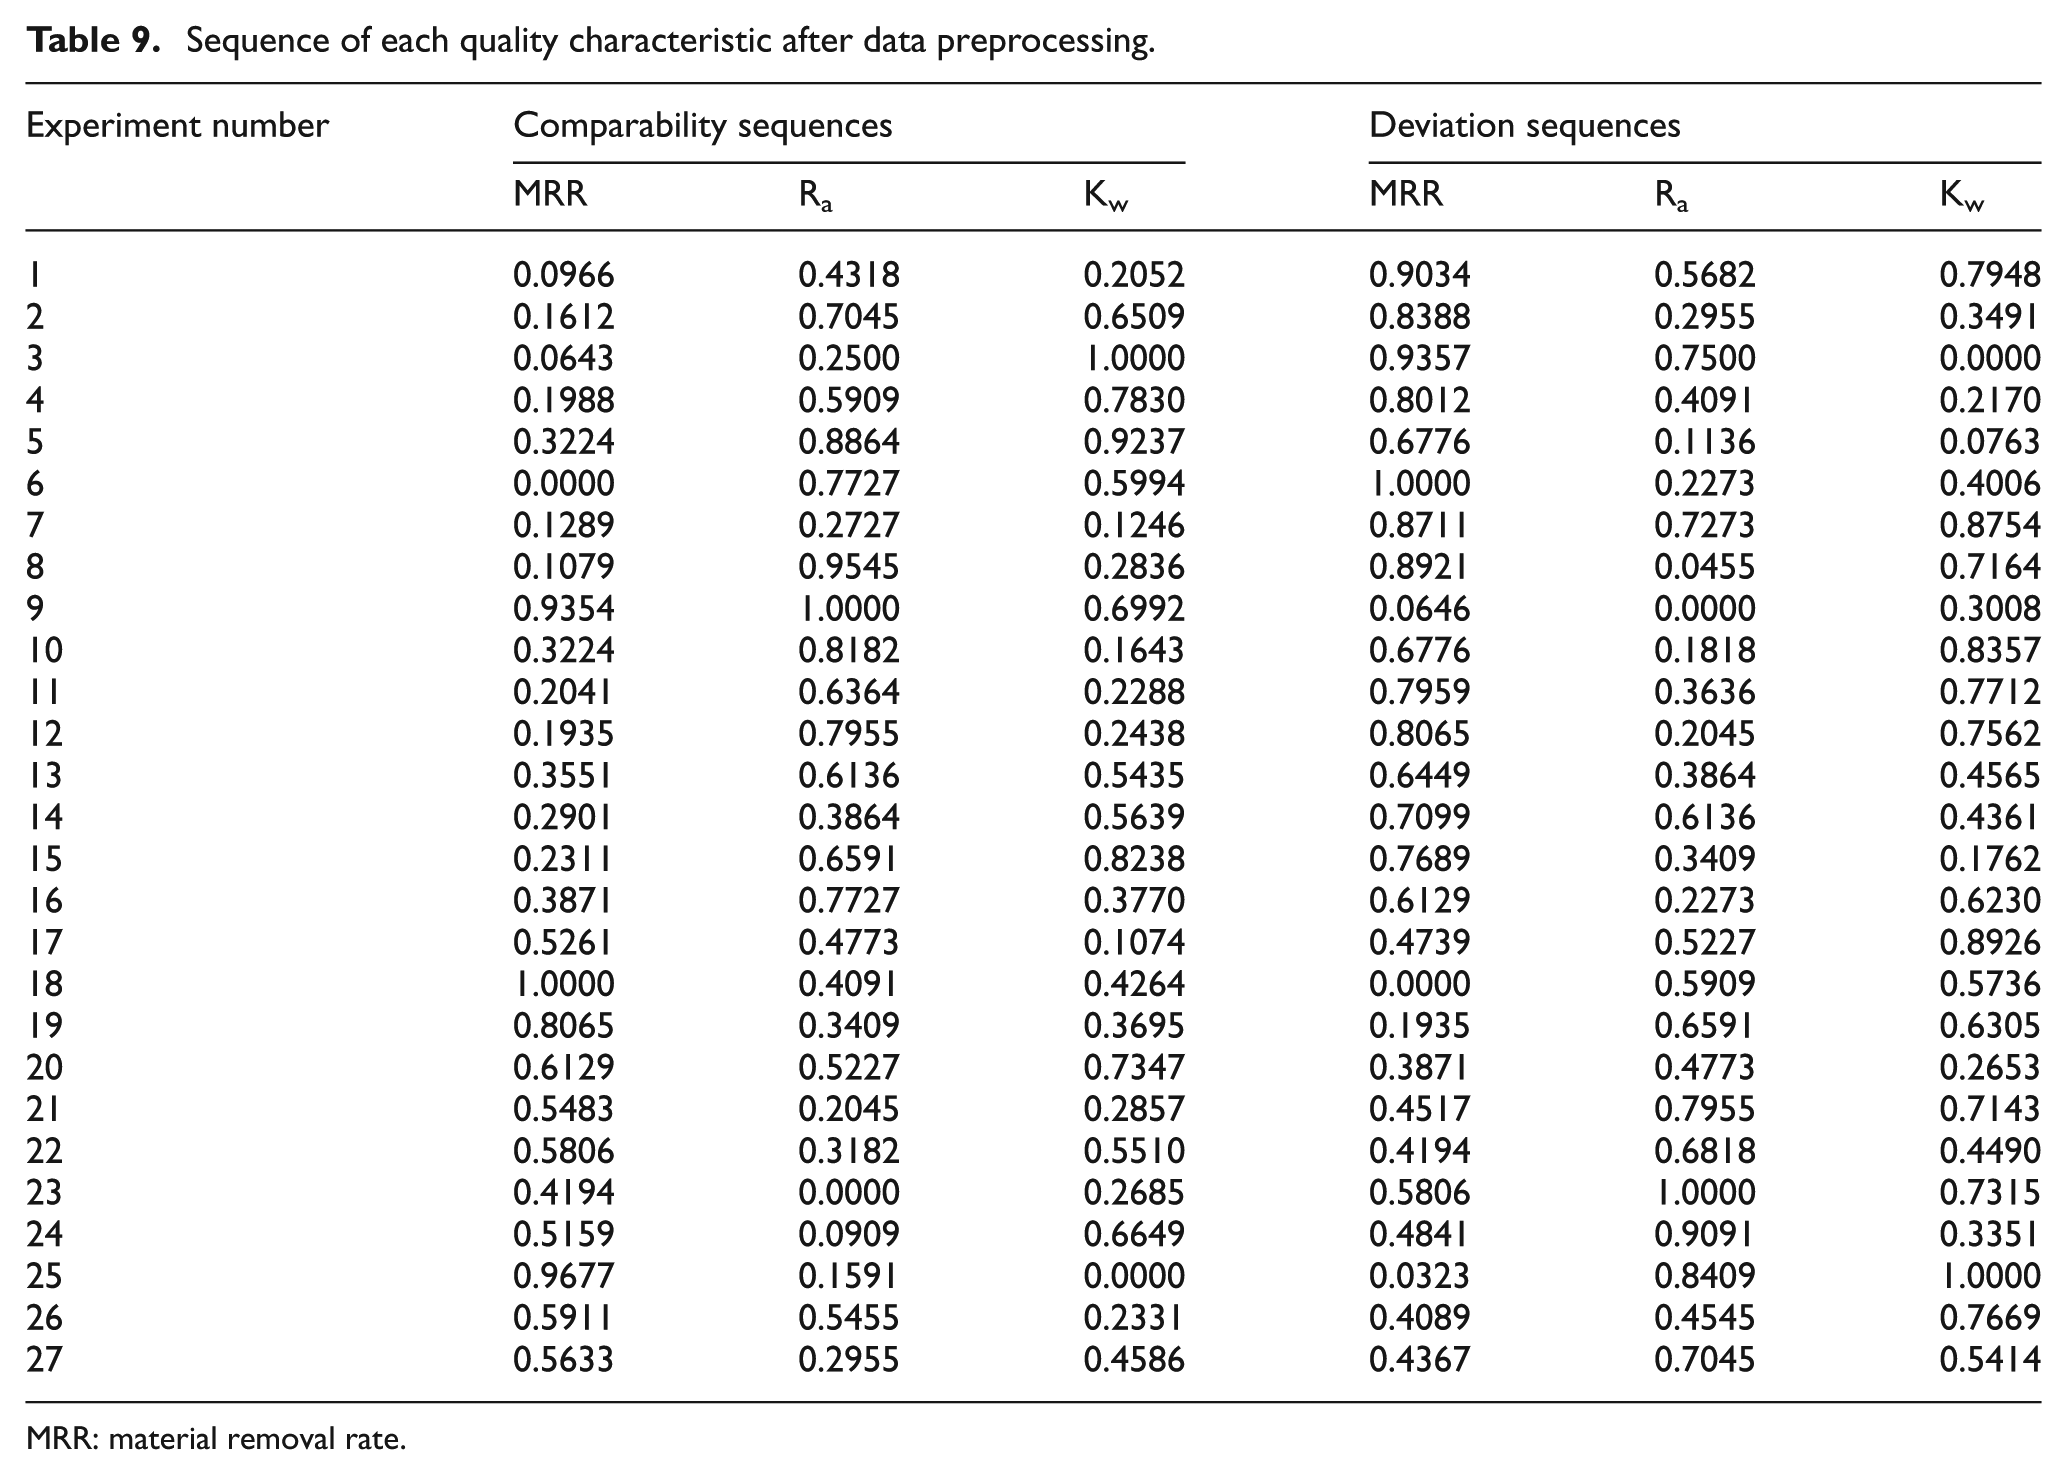
MRR: material removal rate.
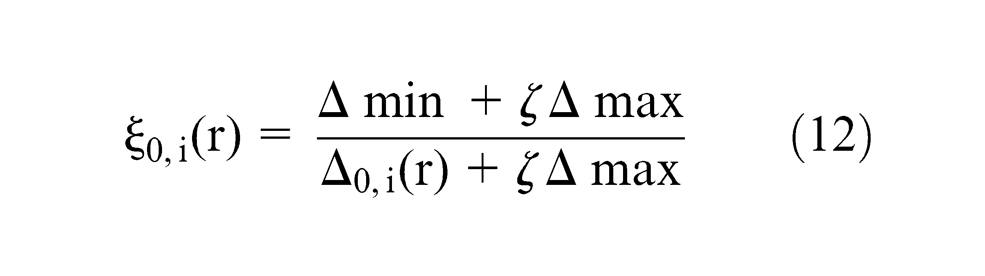
Here, the distinguishing coefficient is
Grey relational coefficient, grey relational grade and order for each experiment.
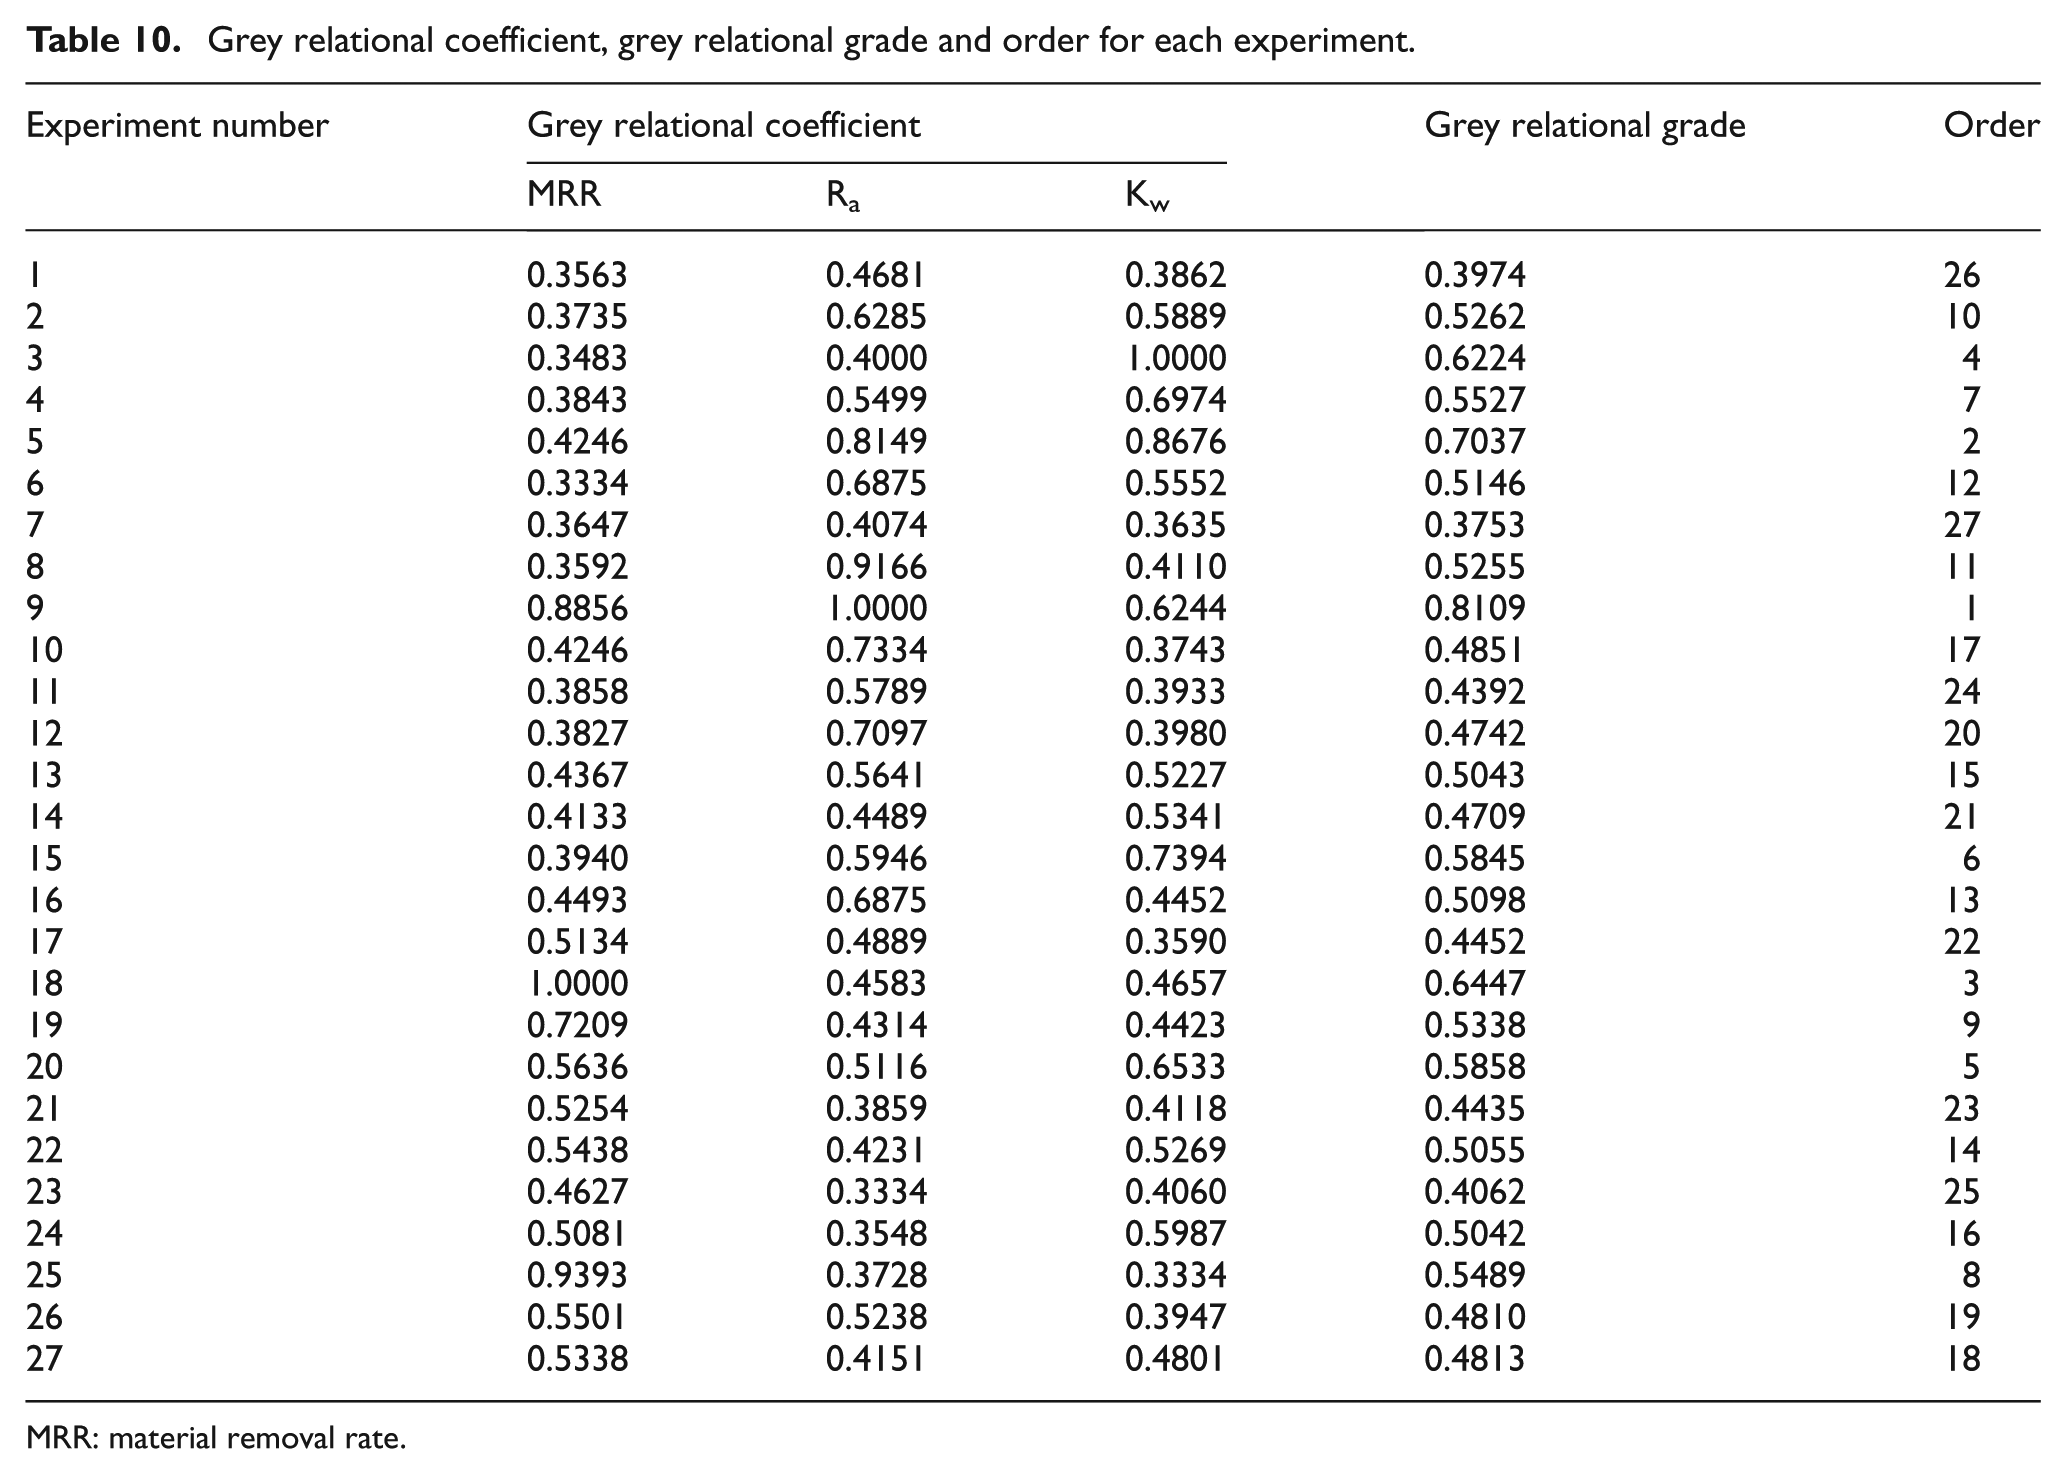
MRR: material removal rate.
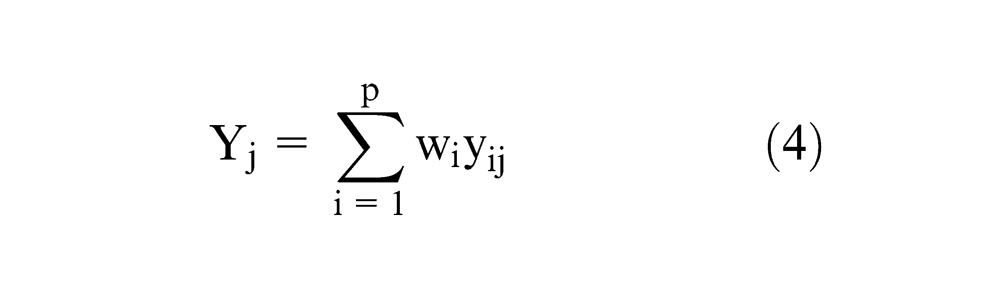
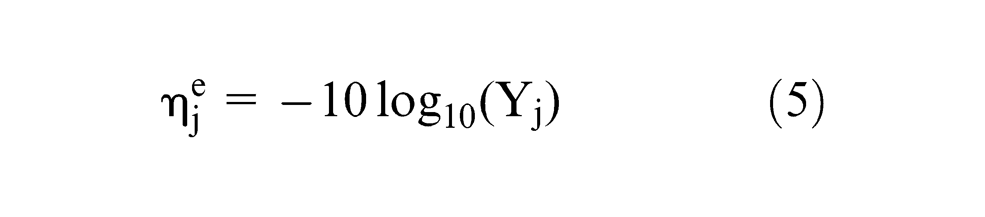
In PCA, the quality characteristics are converted into uncorrelated new variables known as principal components (PCs), which are linear combination of the original variables. It is a method of dimensionality reduction without sacrificing the accuracy. In this approach, the original data sets are transformed into another set of uncorrelated variables known as PC by calculating the eigenvectors of the covariance matrix of the original data sets. Therefore, the eigenvalues, eigenvectors and PC are calculated as follows29,30
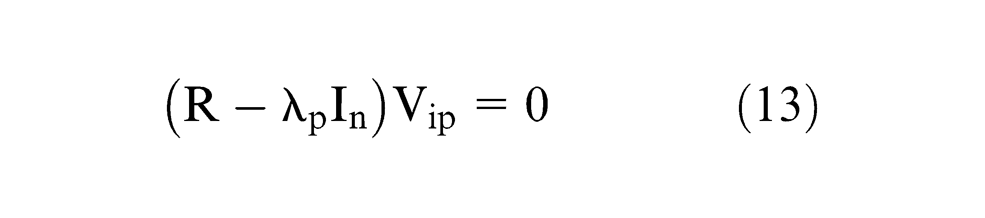
where λp and Vip are eigenvalues and related eigenvectors.
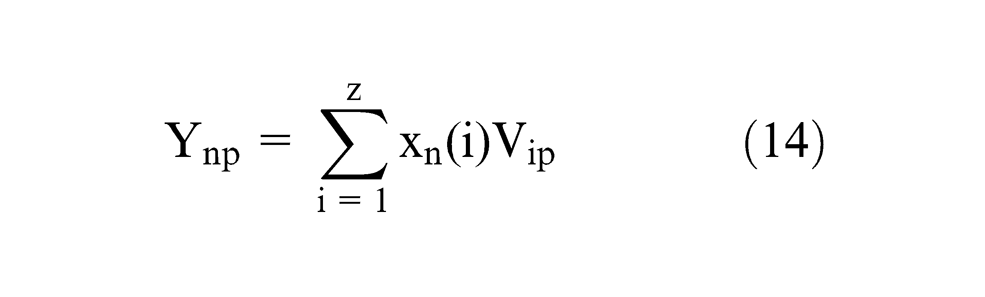
The determination of the related eigenvalues and eigenvector from equation (13) is shown in Table 11. The evaluation of PC is also given as follows
Eigenvalues, explained variation and eigenvector for principal components.
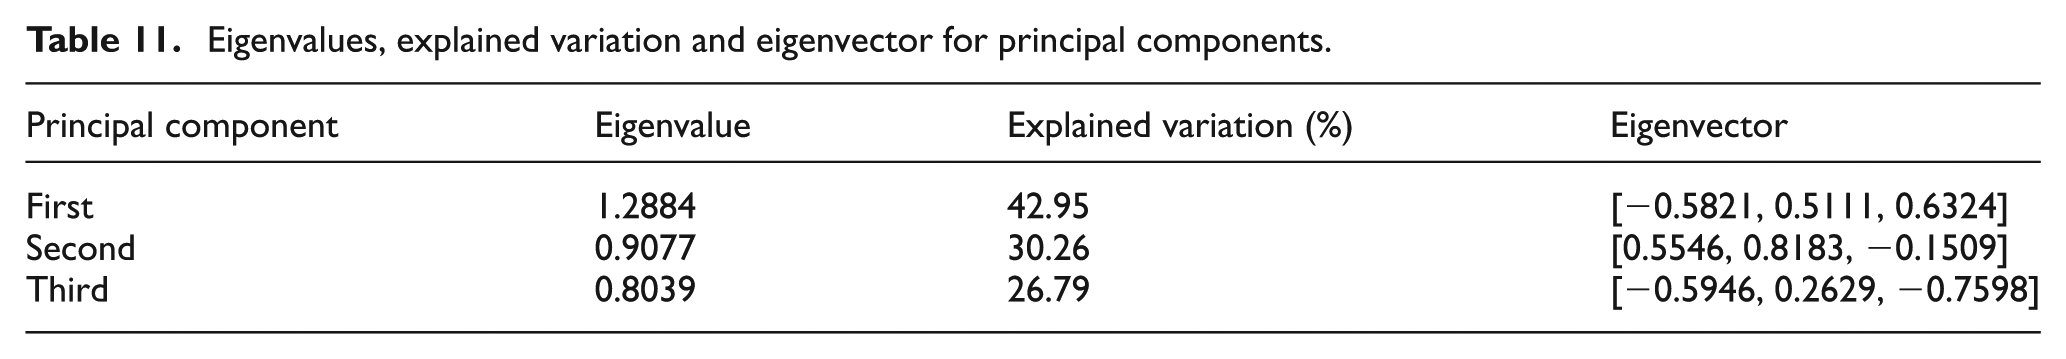
where Ynp is the PC. 29
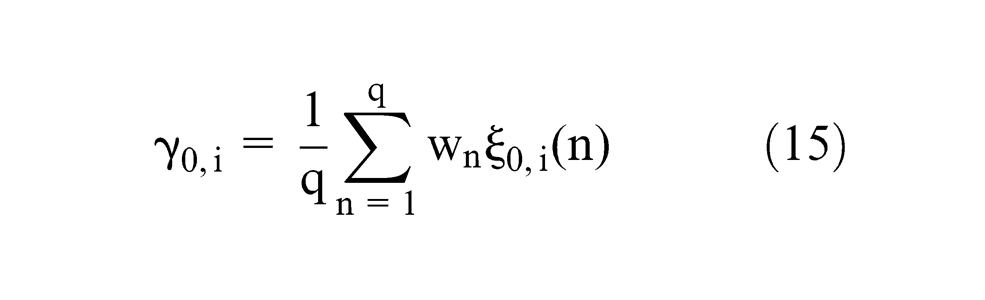
The square of eigenvector corresponds to the contribution of individual output to the PC, as shown in Table 12. For the first PC, the variance contribution is describing the whole original variables, that is, the three output characteristics are 42.95%. Hence, the square of the related eigenvectors is decided in this article as the weighting values of each output (Table 11). Therefore, the grey relational grade is computed using equation (15) as follows 29
Contribution of each individual quality characteristic for the principal component.
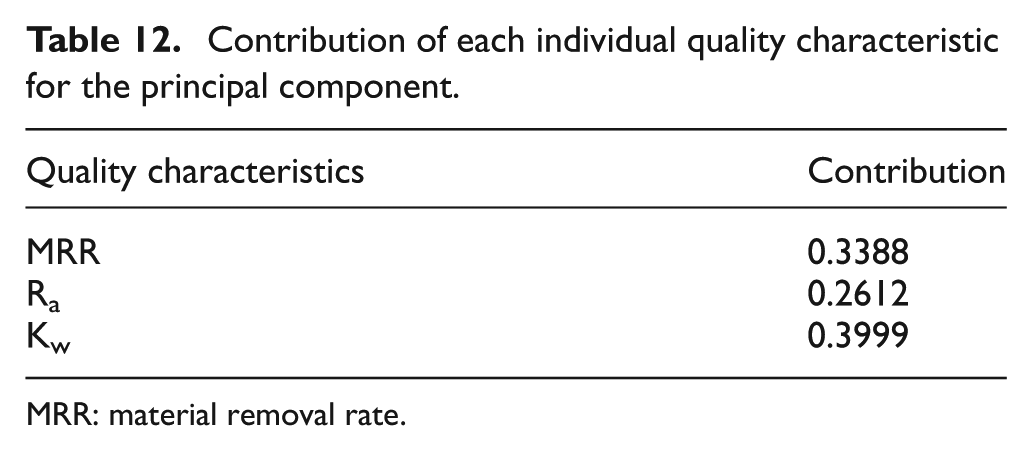
MRR: material removal rate.
Here, the grey relational grade is denoted by
Response table for the grey relational grade.
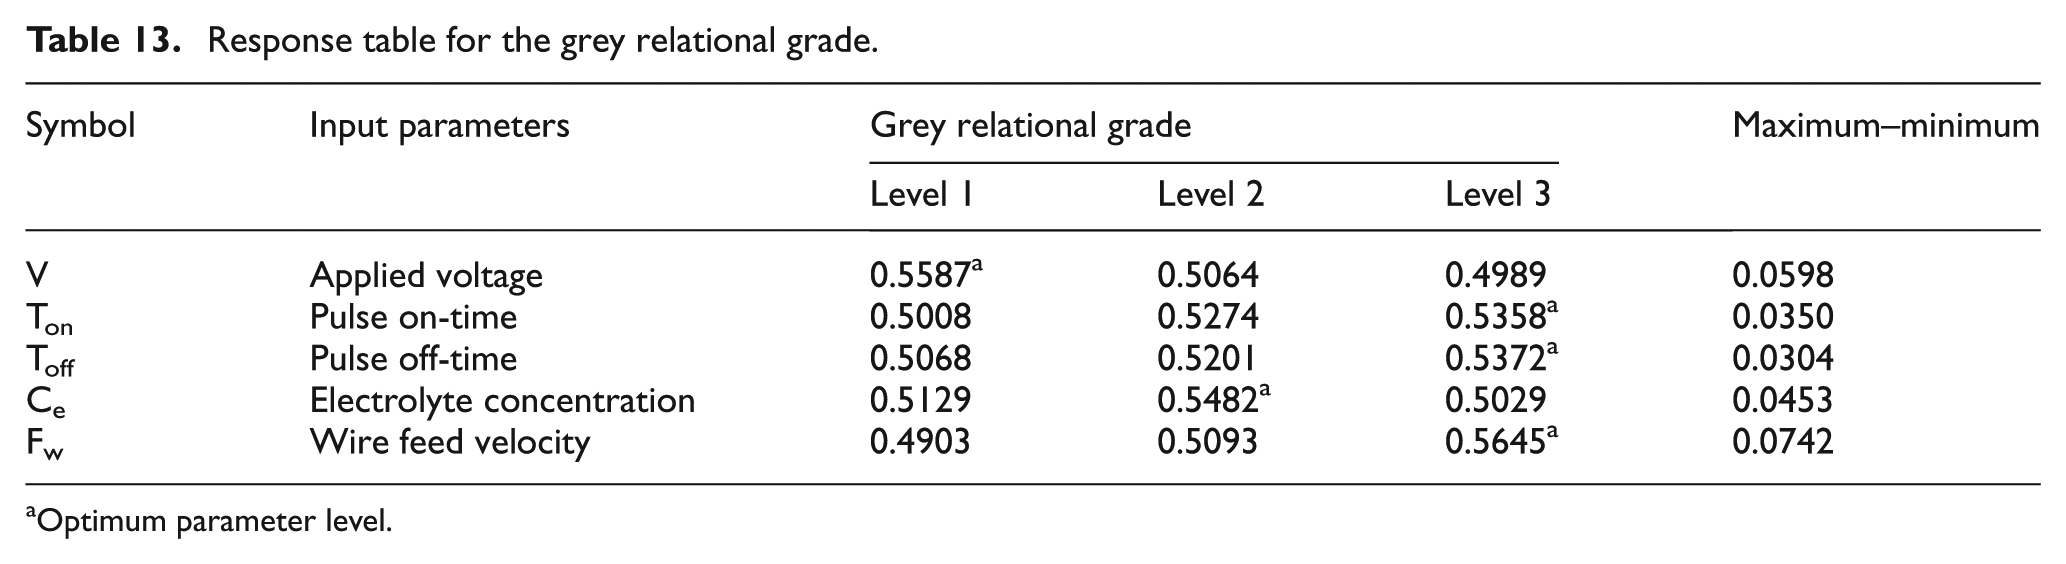
Optimum parameter level.
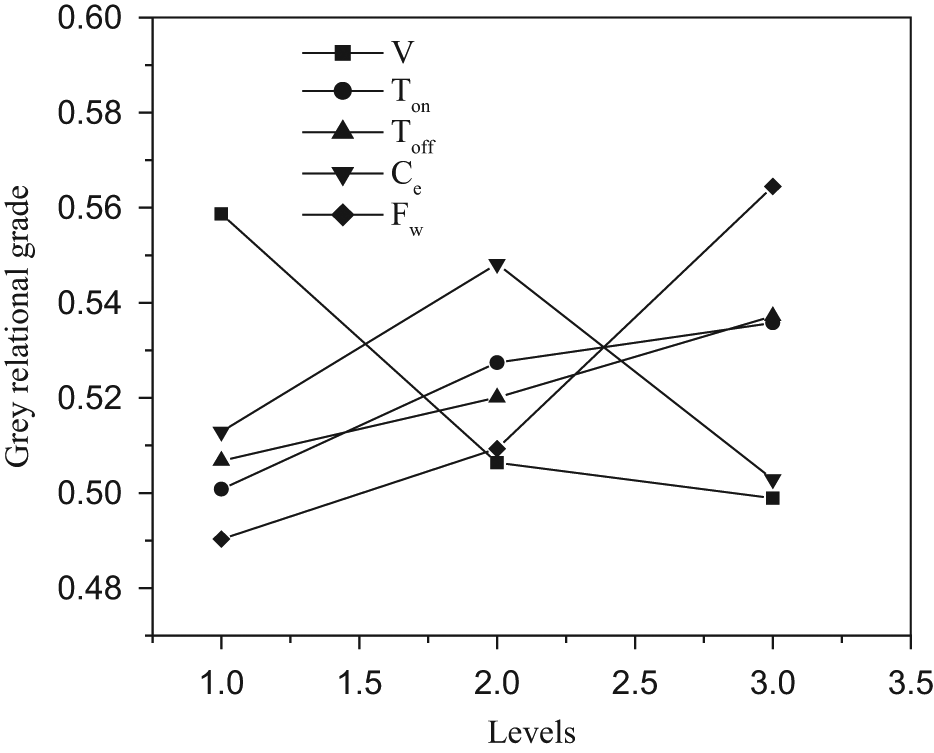
Effect of input parameters on grey relational grade.
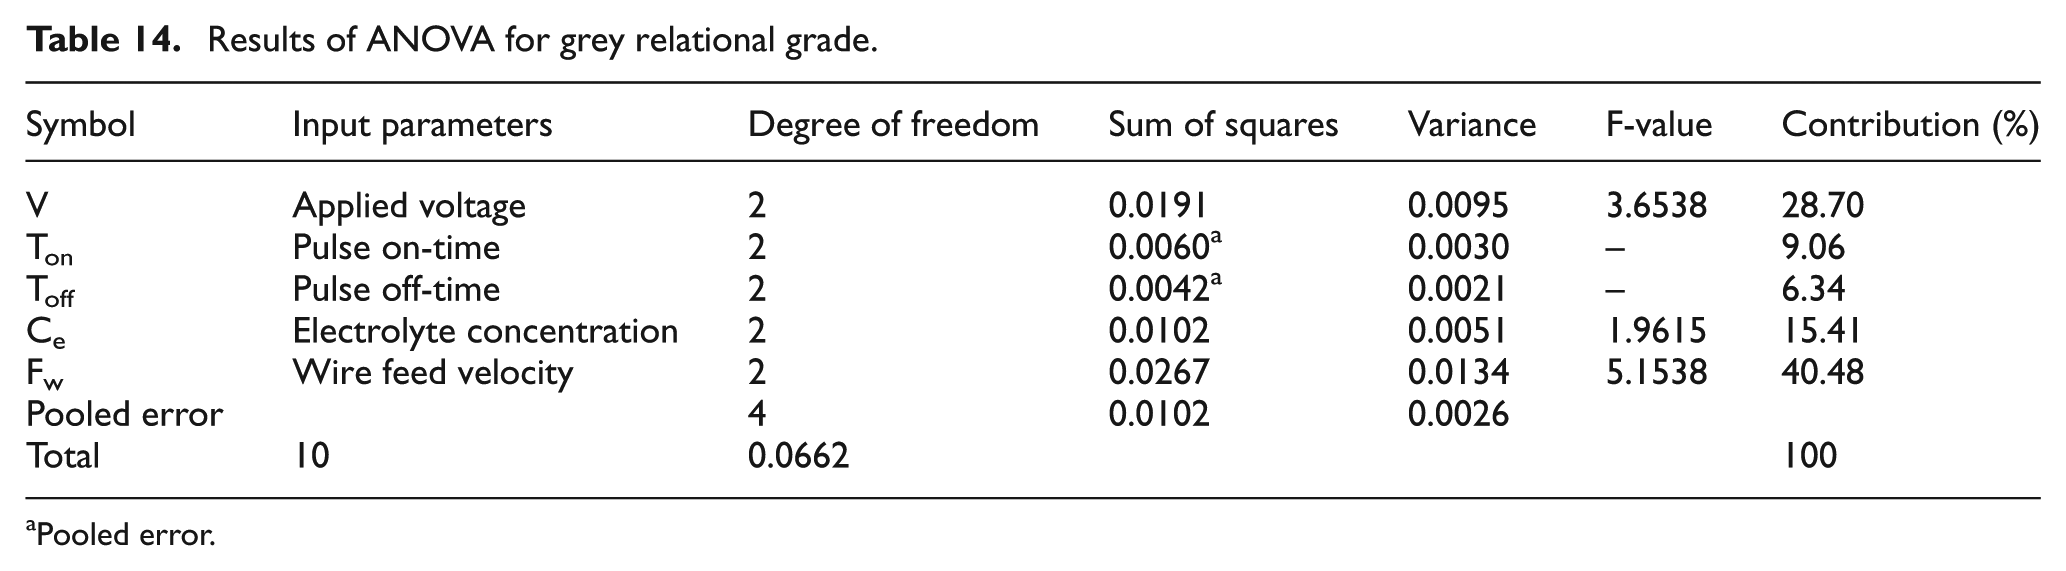
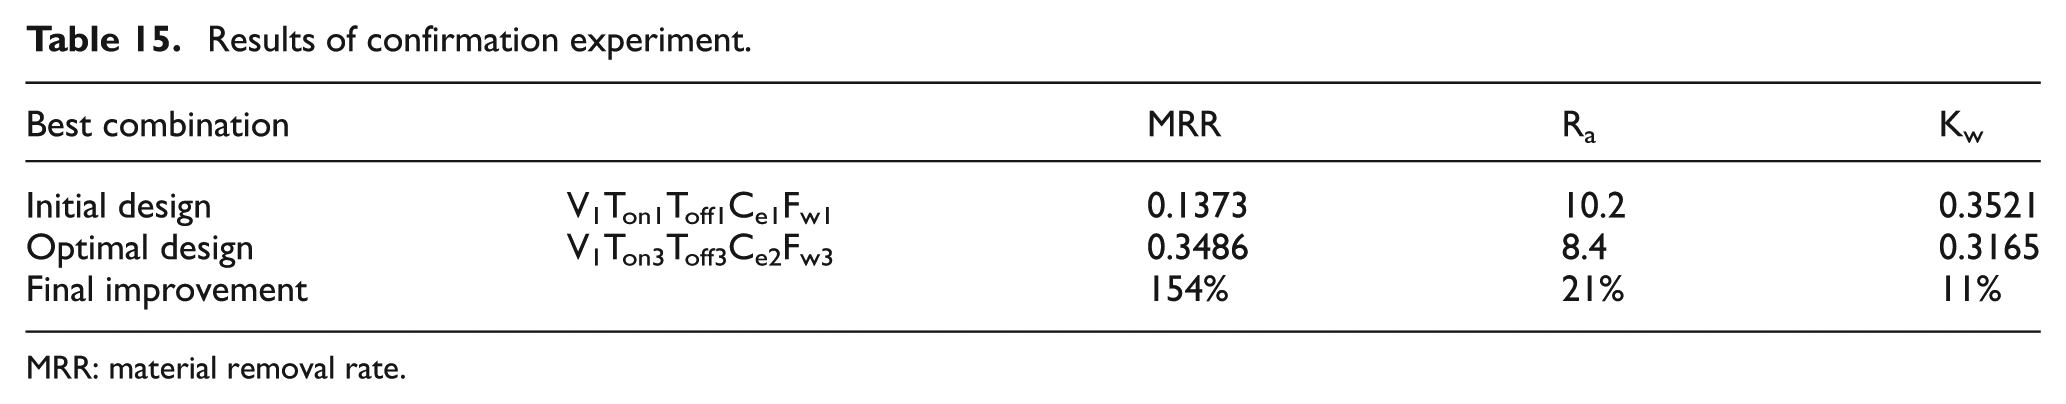
In order to decide the parameter, which significantly affects the output characteristic of TW-ECSM, ANOVA was applied. The ANOVA results for the grey relational grade are depicted in Table 14. It confirms that the wire feed velocity is the most significant TW-ECSM process parameter followed by applied voltage for affecting the multi-performance characteristics. It is necessary to identify the enhancement of the output characteristics using the optimal level of input parameters. Table 15 shows the results of confirmation experiments, which are obtained by comparing the results of the optimal and the initial process parameters. It has been observed that MRR is improved by 154%, Ra is reduced by 21% and Kw is decreased by 11% while machining at optimum parameter setting. Thus, the GRAPCA can be effectively applied for the multi-response optimization of TW-ECSM process.
Results of ANOVA for grey relational grade.
Pooled error.
Results of confirmation experiment.
MRR: material removal rate.
Conclusion
In the present study, the second-order mathematical model one each for MRR, Ra and Kw has been developed for TW-ECSM process using the coupled methodology TMRSM. Another coupled methodology GRAPCA has also been used for multi-response optimization of TW-ECSM process. Based on the modelling and optimization results, the following conclusions can be drawn:
The developed non-linear response surface model for MRR, Ra and Kw using CCRD matrix has been found adequate at 99% confidence level. It has also been observed that regression coefficient, linear and square effects are significant for all the models.
Developed model predicts that MRR is significantly affected by the applied voltage, electrolyte concentration, square effect of pulse on-time and interaction effect of pulse off-time and wire feed velocity. Electrolyte concentration, wire feed velocity, square effect of pulse on-time and interaction effect of applied voltage and pulse off-time have been obtained as the significantly affected factors for Ra. Kw is also significantly affected by wire feed velocity, applied voltage, square effect of electrolyte concentration, interaction effect of pulse off-time and electrolyte concentration.
It has been found that the pulse off-time has least effect on MRR, Ra and Kw compared to other process parameters. For achieving low value of Kw, a higher value of electrolyte concentration is required.
It has been observed from ANOVA table that the most important controllable input parameters significantly affecting the multi-performance characteristics of TW-ECSM process are wire feed velocity (40.48%), applied voltage (28.70%), electrolyte concentration (15.42%), pulse on-time (9.06%) and pulse off-time (6.34%).
The PCA applied to calculate the related weights of individual output characteristics while applying the GRA for multi-response optimization is competent of objectively demonstrating the relative significance for each output characteristics.
The optimal combination of the cutting parameters found from the proposed method is V1Ton3Toff3Ce2Fw3. From the results of confirmation test, it has been observed that MRR is improved by 154%, Ra is reduced by 21% and Kw is decreased by 11%, while machining at optimum parameter setting.
Footnotes
Appendix 1
Declaration of conflicting interests
The authors declare that there is no conflict of interest.
Funding
The financial supported was provided by the Council of Scientific and Industrial Research (CSIR), Government of India, New Delhi, for this experimental study of the project entitled ‘Experimental and Numerical Study of Traveling Wire Electrochemical Spark Machining of Advanced Engineering Materials’ (project grant no. 22/0486/09-EMR-II).