
Abstract
Making real-life decisions regarding selection of optimum parameters in machining of materials, especially when faced with conflicting objectives, is a tough task. Multi-objective methods are usually used to deal with such problems. This article applies grey relational analysis to the multi-responses that were obtained during turning of AISI 304 austenitic stainless steels on a computer numerical control lathe. The experiments were conducted using the Taguchi design of experiments technique. In grey relational theory, a grey relational grade is found such that it indicates an optimum level of machining parameters that produce smaller magnitudes of surface roughness, flank wear, tool vibrations and a higher magnitude of material removal rate. The combination of the following machining parameters produces a better turning performance: speed of 210 m/min, feed rate of 0.15 mm/rev, depth of cut of 1.0 mm and a nose radius of 0.4 mm. The significant factors affecting the overall responses of turning process were evaluated by analysis of variance. Thereafter, optimum values of overall responses were predicted. Finally, a second-order multi-objective model was developed, which relates the machining parameters to the grey relational grade using response surface methodology.
Keywords
Introduction
Of all stainless steel applications, austenitic stainless steel grade is the most widely used one. But austenitic stainless steels are difficult to machine because of their high ductility and work hardening properties. It is also difficult to obtain surface integrity. High surface roughness and flank wear are the common problems faced during its machining.1,2 Many researchers have struggled to improve the surface integrity of austenitic stainless steel workpieces. Employing multi-coated cutting tools is one of the best ways to improve their machinability.
Machining parameters such as speed, feed rate, depth of cut (DOC) and tool geometry drastically affect performance measures such as surface roughness and material removal rate (MRR). To study the effect of these parameters on performance measures, we generally rely on operator’s experience or guidelines provided by tool manufactures, which is not scientific, economical or consistent. The design of experiments (DoE) methodology is a scientific tool that can be effective in studying the impact of various parameters on performance measures. Taguchi’s orthogonal array is one type of DoE that can provide optimum process parameters and a response variable. 3 The Taguchi method has already contributed towards improving product quality, manufacturability and reliability at lowest societal costs by its robust experimental design. This method is designed for optimizing a single-response/objective problem. However, the performance of manufactured products is evaluated by multiple quality characteristics/responses. 4 Optimization of a single-response results in non-optimum values for remaining responses. This is due to the existence of complex relationships between the various responses. Grey relational analysis (GRA) is one technique that helps in addressing such problems. Deng proposed GRA to measure the degree of approximation.
A majority of recent works focused on optimization of different process parameters. Pawade and Joshi 5 employed Taguchi-based GRA (TGRA) to optimize certain machining parameters and cutting edge geometry during high-speed turning of Inconel 718. Ranganathan and Senthilvalen 6 conducted hot turning operations on stainless steel to optimize different parameters such as speed, feed rate, DOC and workpiece temperature on a conventional lathe using Taguchi technique, and output parameters such as surface roughness, tool life and metal removal rate were simultaneously optimized by employing GRA. Lin 7 applied TGRA to turning operations to optimize multiple performance characteristics such as tool life, cutting force and surface roughness concluding that the multiple performance characteristics were simultaneously improved. The TGRA was applied to various machining processes including chemical–mechanical process, 8 selection of optimum process parameters in turning of red mud–based aluminium metal matrix composites, optimization of hot turning operations and drilling operation.9–11
This work deals with turning of stainless steel 304 on computer numerical control (CNC) lathe under different process parameters, namely, cutting speed, feed rate, DOC and nose radius of cutting insert. The TGRA is used for the simultaneous optimization of the four responses: surface roughness, flank wear, tool vibration and MRR. Sixteen experimental runs were conducted on the basis of Taguchi orthogonal array to determine the best factor level combination. The factor levels are evaluated according to the four response variables. The influence of the process parameters on these response variables is assessed. The optimum value of overall responses is also predicted.
Experimental works
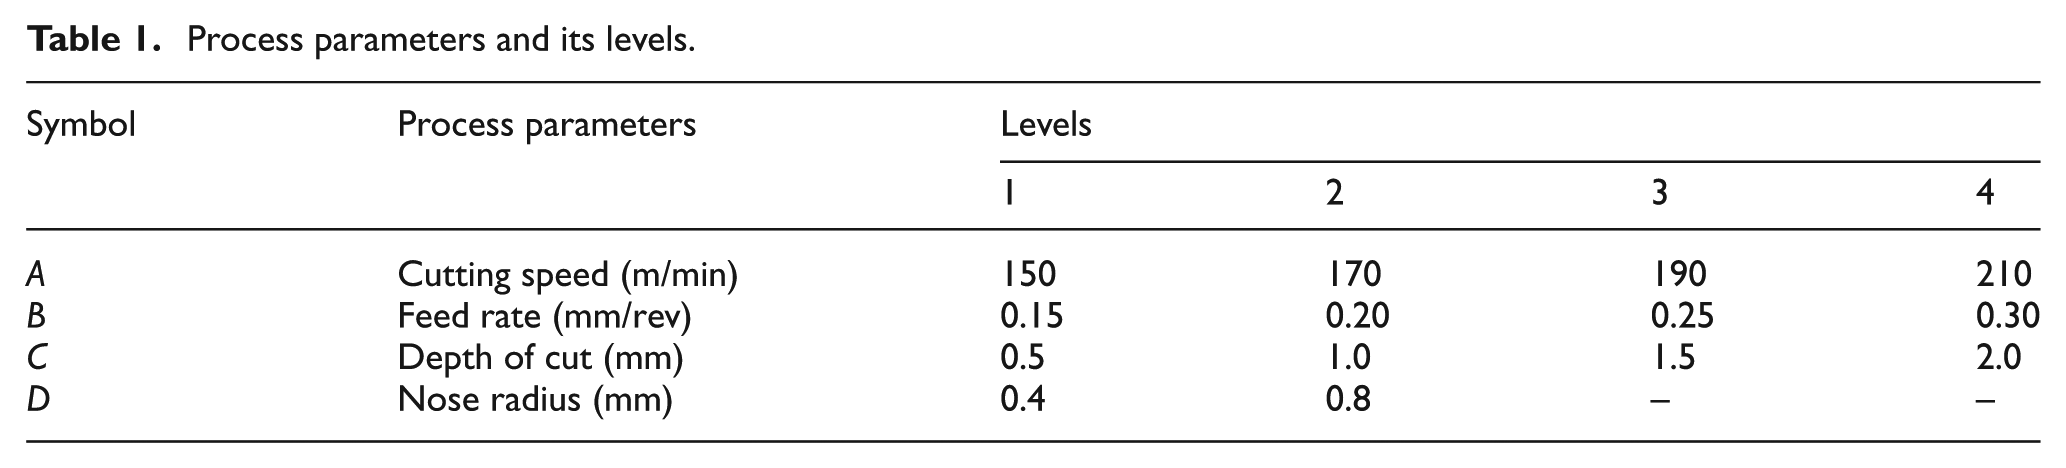
This study attempts to relate the machining variables to the responses using Taguchi DoE. Turning is the most common machining process, which removes material by rotating a cylindrical workpiece against a single-point cutting tool. The cutting tests were carried out on a Parishudh TC-250 CN, India, CNC lathe with a variable speed of up to 3250 r/min and a power rating of 7.5 kW using a multi-coated chemical vapour deposition (CVD) (TiN-Al2O3-TiCN-TiN) cutting insert of various nose radii. A standard L16 orthogonal array with 16 rows was used for experimentation. To perform the experimental design, four levels of cutting parameters and two levels of nose radii were selected and are listed in Table 1. The feasible range of cutting parameters was recommended by manufacturer of cutting inserts. The experimental results of CNC turning of AISI 304 austenitic stainless steel were assessed to determine the multiple responses, such as surface roughness, flank wear of cutting tool, tool vibration and MRR. The surface roughness of the machined surface of workpiece material was measured by Talysurf-10. The cutting tool flank wear was measured by metallurgical microscope (DMI Crown II, India) having a magnification of 100× to 1000× and the MRR was calculated. The cutting tool vibrations were recorded with the help of piezoelectric shear accelerometer and multi-channel dynamic signal analyser (CoCo-80, USA). The experimental set-up is shown in Figure 1.
Process parameters and its levels.
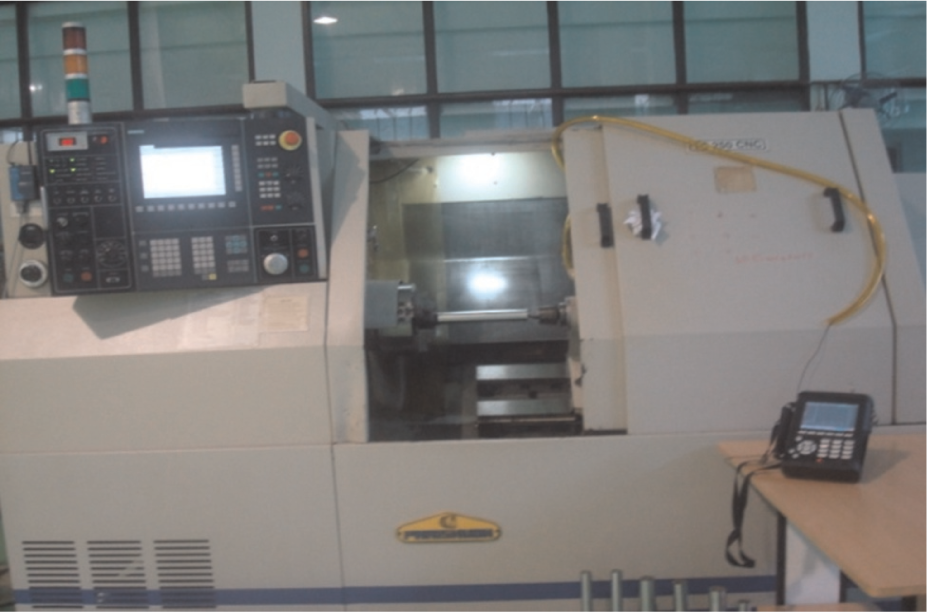
Experimental set-up.
Work material
An AISI 304 austenitic stainless steel workpiece of 50 mm diameter and 330 mm length is used in this investigation. The chemical composition of the alloy includes the following: Cr = 18.275; Ni = 8.473; Mn = 1.351; C = 0.051; Si = 0.412; Mo = 0.301; Cu = 0.318, Ti = 0.005; V = 0.049; W = 0.03; Co = 0.019; Nb = 0.020 and Fe = balance.
GRA
When we face conflicting responses, improvement in one response leads to the degradation of the other. There is no clear correlation between the performance characteristics. In other words, a ‘grey’ relation exists, which is incomplete and uncertain. 12 This grey relation also exists in this work. There are four responses, which are output measures of the experimentation, that is, surface roughness, cutting tool vibrations, tool flank wear and MRR. Of the four responses, surface roughness and MRR are direct performance measures. Flank wear and tool vibrations are responses that affect these performance measures. As can be seen, a ‘grey’ relation exists between these four responses. Except the values of MRR, remaining responses need to be minimized. Such type of optimization problems can be solved using GRA, which is used in this work. GRA is employed to convert the multi-objective optimization model into a single-response grey relational grade (GRG). In GRA, raw data are preprocessed and normalized to fit between zero and one and is called grey relational generation. Next, in order to represent the correlation between the desired and the experimental data, the grey relational coefficient (GRC) is calculated from the normalized data. Then, the overall grey relation grade is determined by averaging various GRCs. This GRG is used for the overall evaluation of the multiple process responses. As a consequence, optimization of the complicated multiple process responses is converted into a single-response process optimization problem with the objective function of the multiple GRGs. The highest GRG represents the optimum level of a process parameter. In this work, the following steps are followed while applying the GRA.
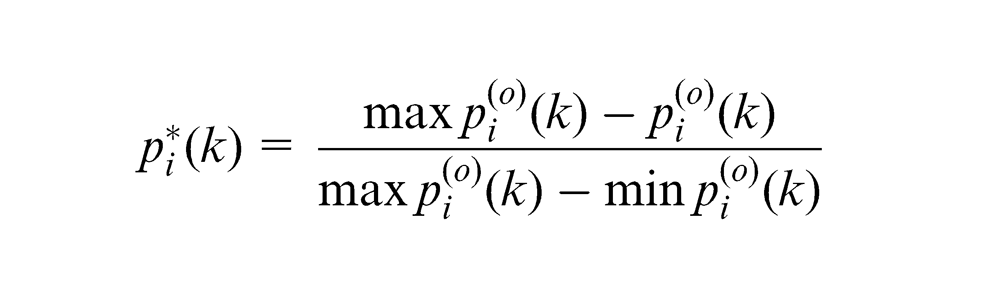
Step (a). A ‘lower-the-better’ linear data preprocessing method for surface roughness, cutting tool vibration and tool flank wear can be expressed as
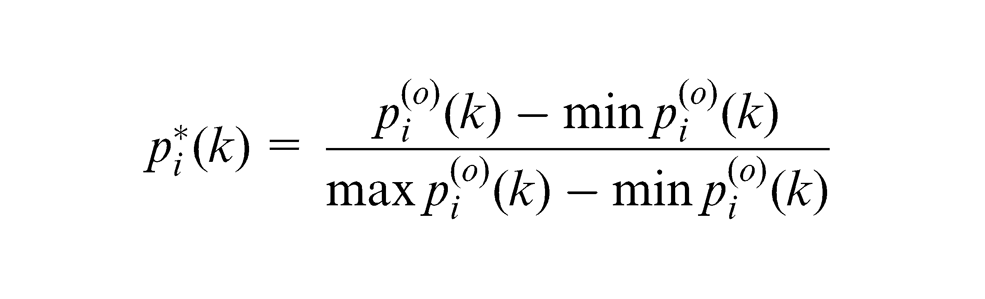
A ‘higher-the-better’ response for MRR can be expressed as
where
An ideal sequence is
Step (b). Deviation sequence can be found by
Step (c). The GRC can be calculated as
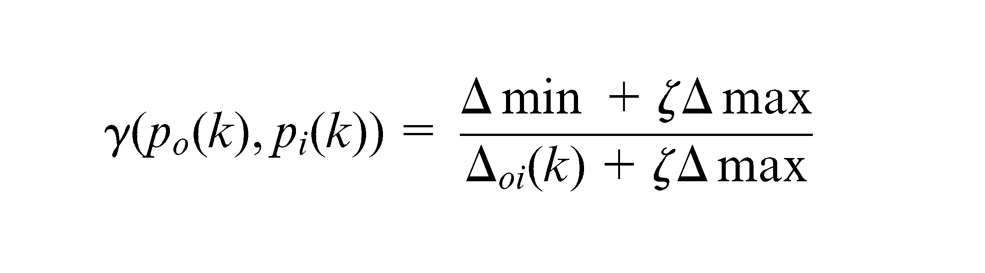
where
Step (d). The GRG
where n is the number of process responses. A higher value of GRG represents not only a stronger relational degree between the given sequence and the reference sequence but also indicates that a corresponding cutting parameter is closer to the optimum value.
Experimental results and discussions
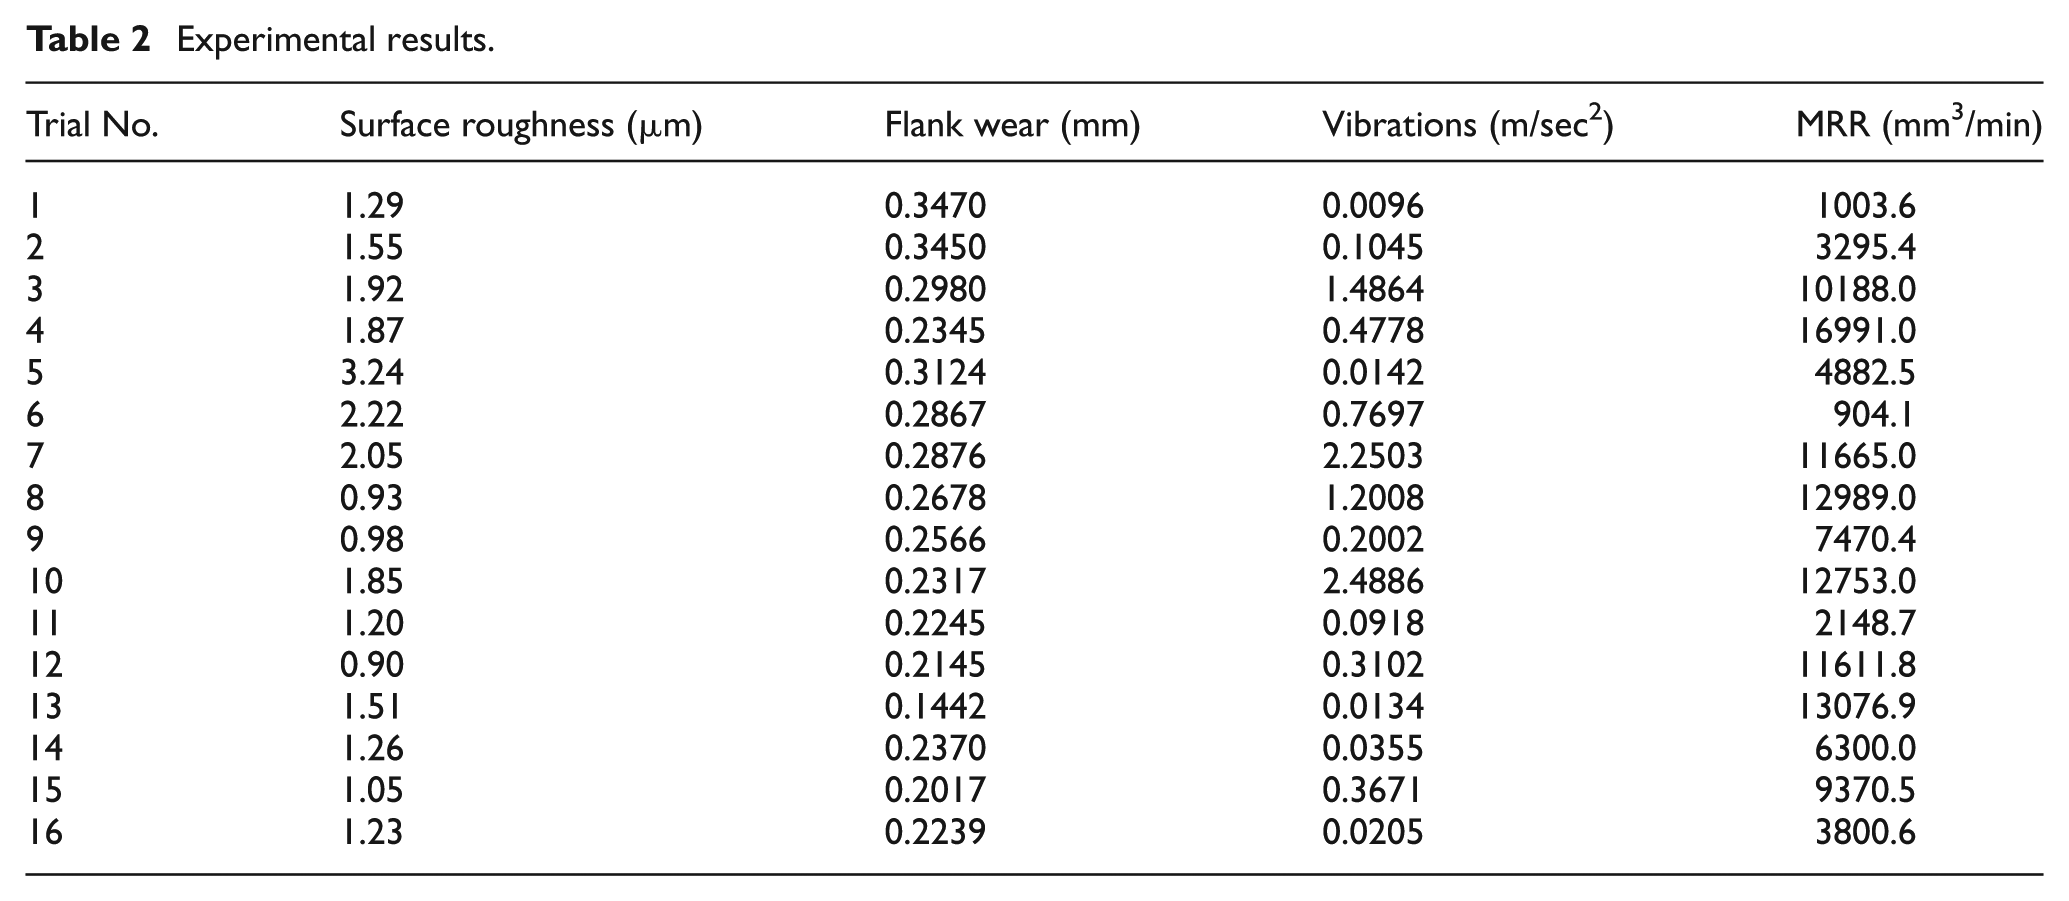
The experimental results were analysed through statistical analysis with the help of Minitab-14. In order to know the statistical significance of process parameters, analysis of variance (ANOVA) was employed. Table 2 shows the experimental results of the responses. Table 3 shows ANOVA results for the selected responses: surface roughness, flank wear of cutting tool, tool vibration and MRR. Some of the values of percentage of contribution in Table 3 are represented in boldface to indicate the statistical importance of input parameters at 95% confidence level.
Experimental results
ANOVA results for performance characteristics.
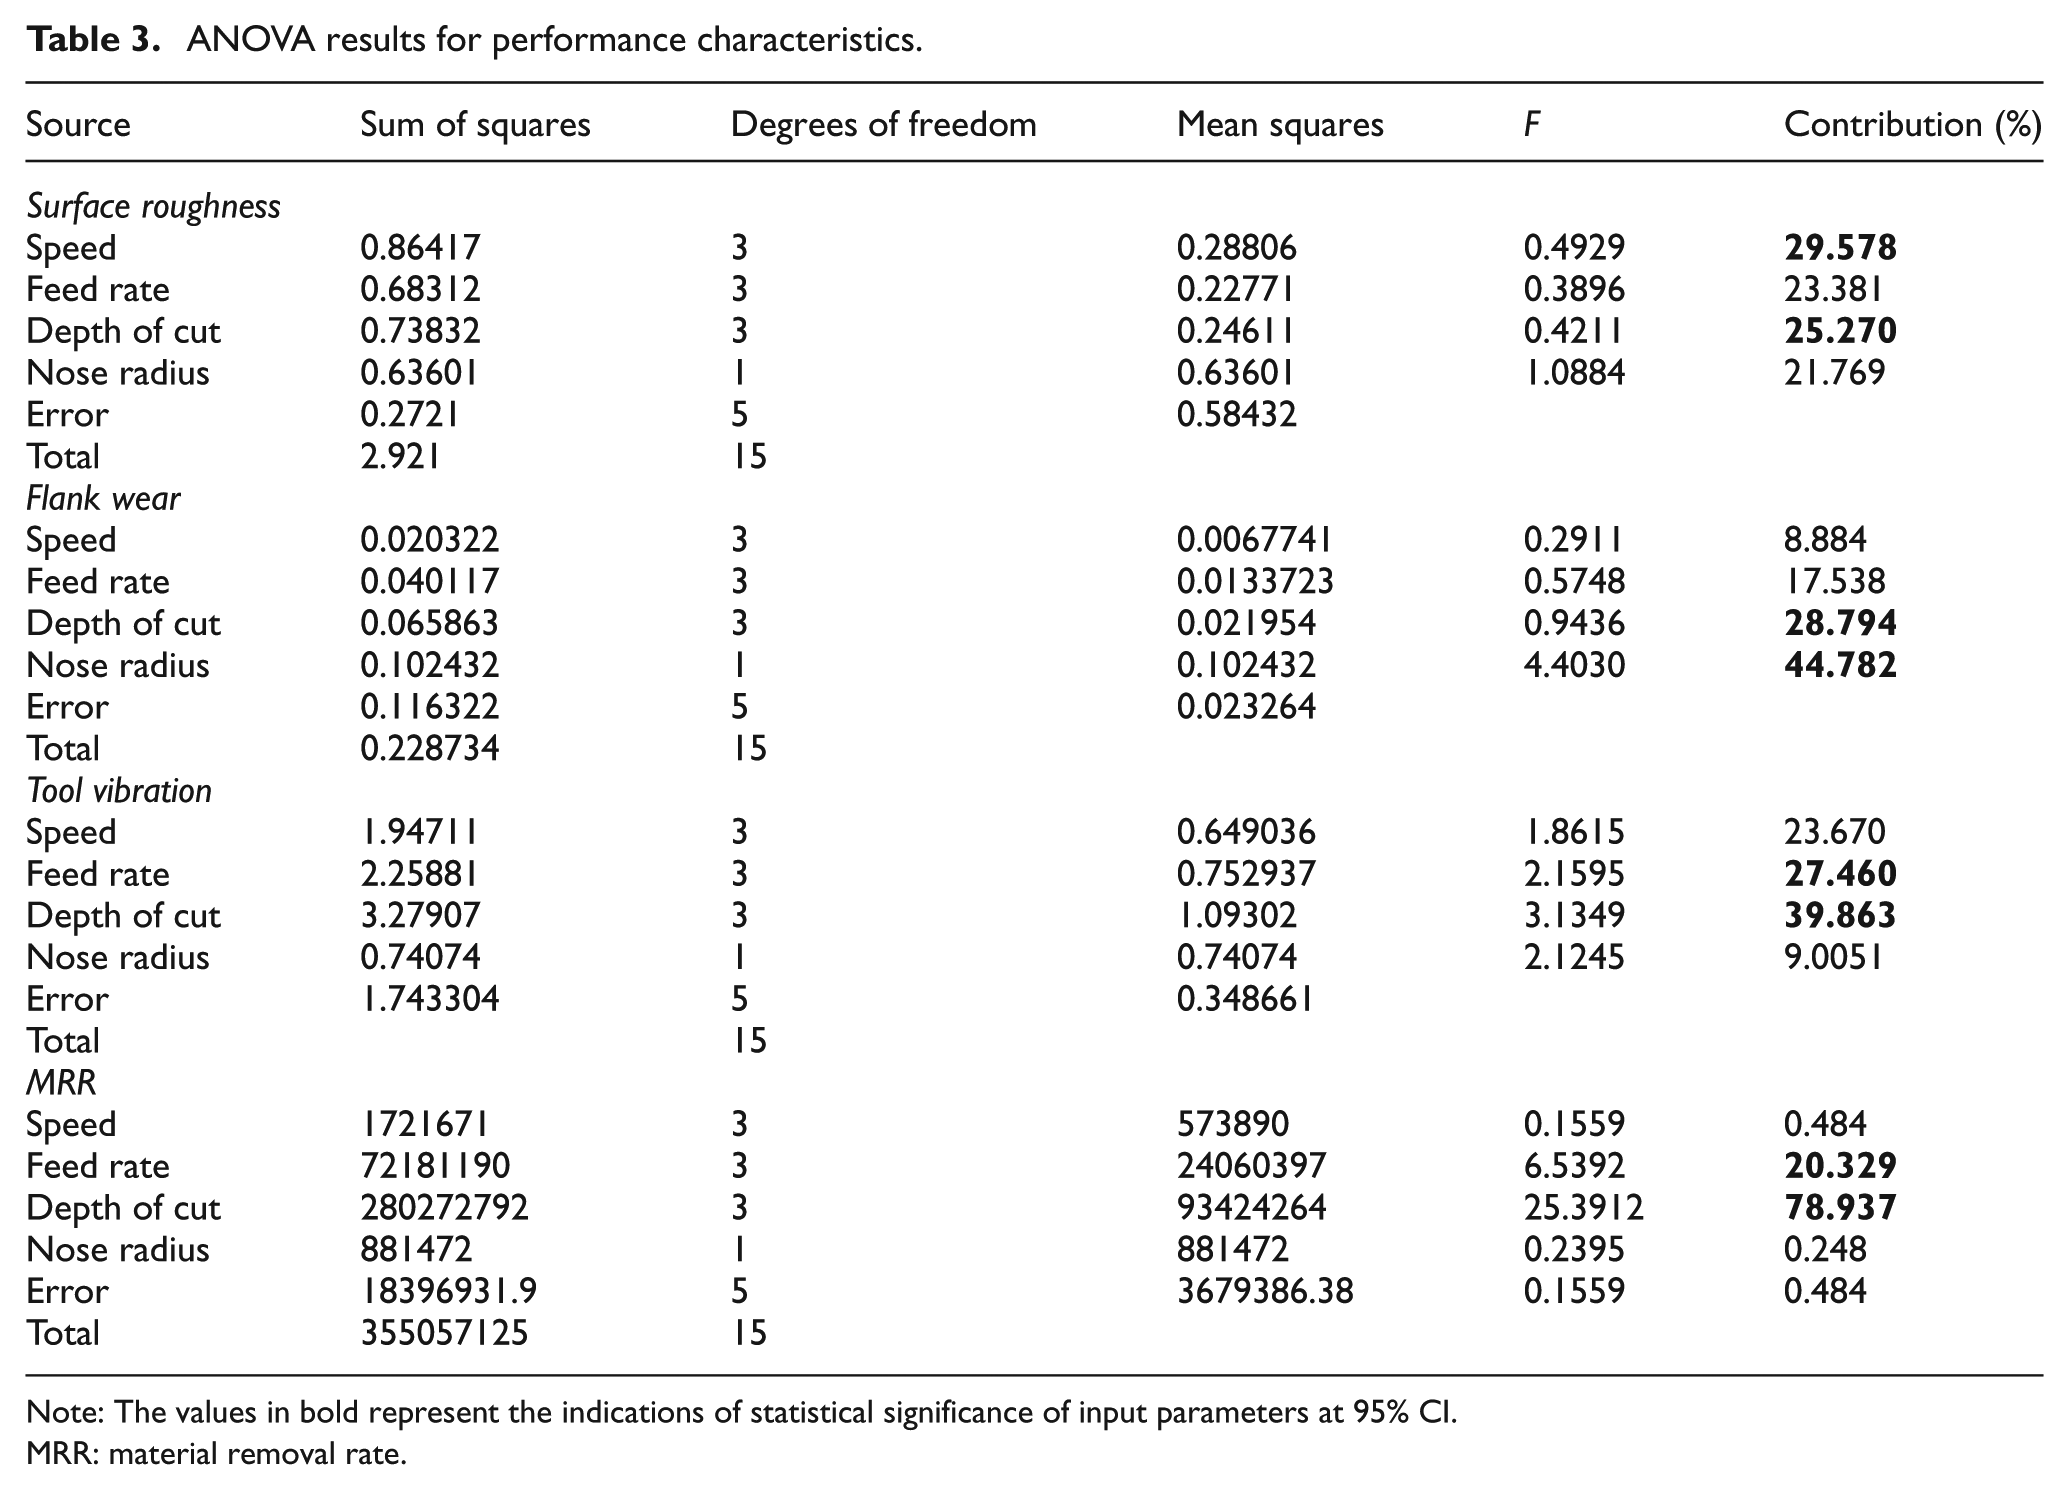
Note: The values in bold represent the indications of statistical significance of input parameters at 95% CI.
MRR: material removal rate.
Application of GRA for turning
On the basis of the characteristics specified in Step (a), the signal-to-noise (S/N) ratio is determined. The weighted GRGs (as specified in Steps (c) and (d)) are presented in Table 4 for each experimental trial using L16 matrix when machining with CVD (TiN-Al2O3-TiCN-TiN) coated cemented carbide insert. In Table 4, experiment number 12 has the highest weighted GRG among the 16 experiments. Therefore, experiment 12 produces the best experimental sequence for the multiple responses of the process. The mean values of the GRG for each level of the turning process parameters that are calculated by ‘larger-the-better’ type are shown in Figure 2. The highest influence of machining parameters is indicated by the steep slope observed in the GRG graph (Figure 2). This shows that the cutting speed and feed rate are the most influencing factors in the responses. As per the GRA, better multiple responses are indicated by larger values of GRG. Hence, it can be concluded that the optimal setting of process parameters as A4-B1-C2-D1 is best.
GRC and weighted grey relational grade.
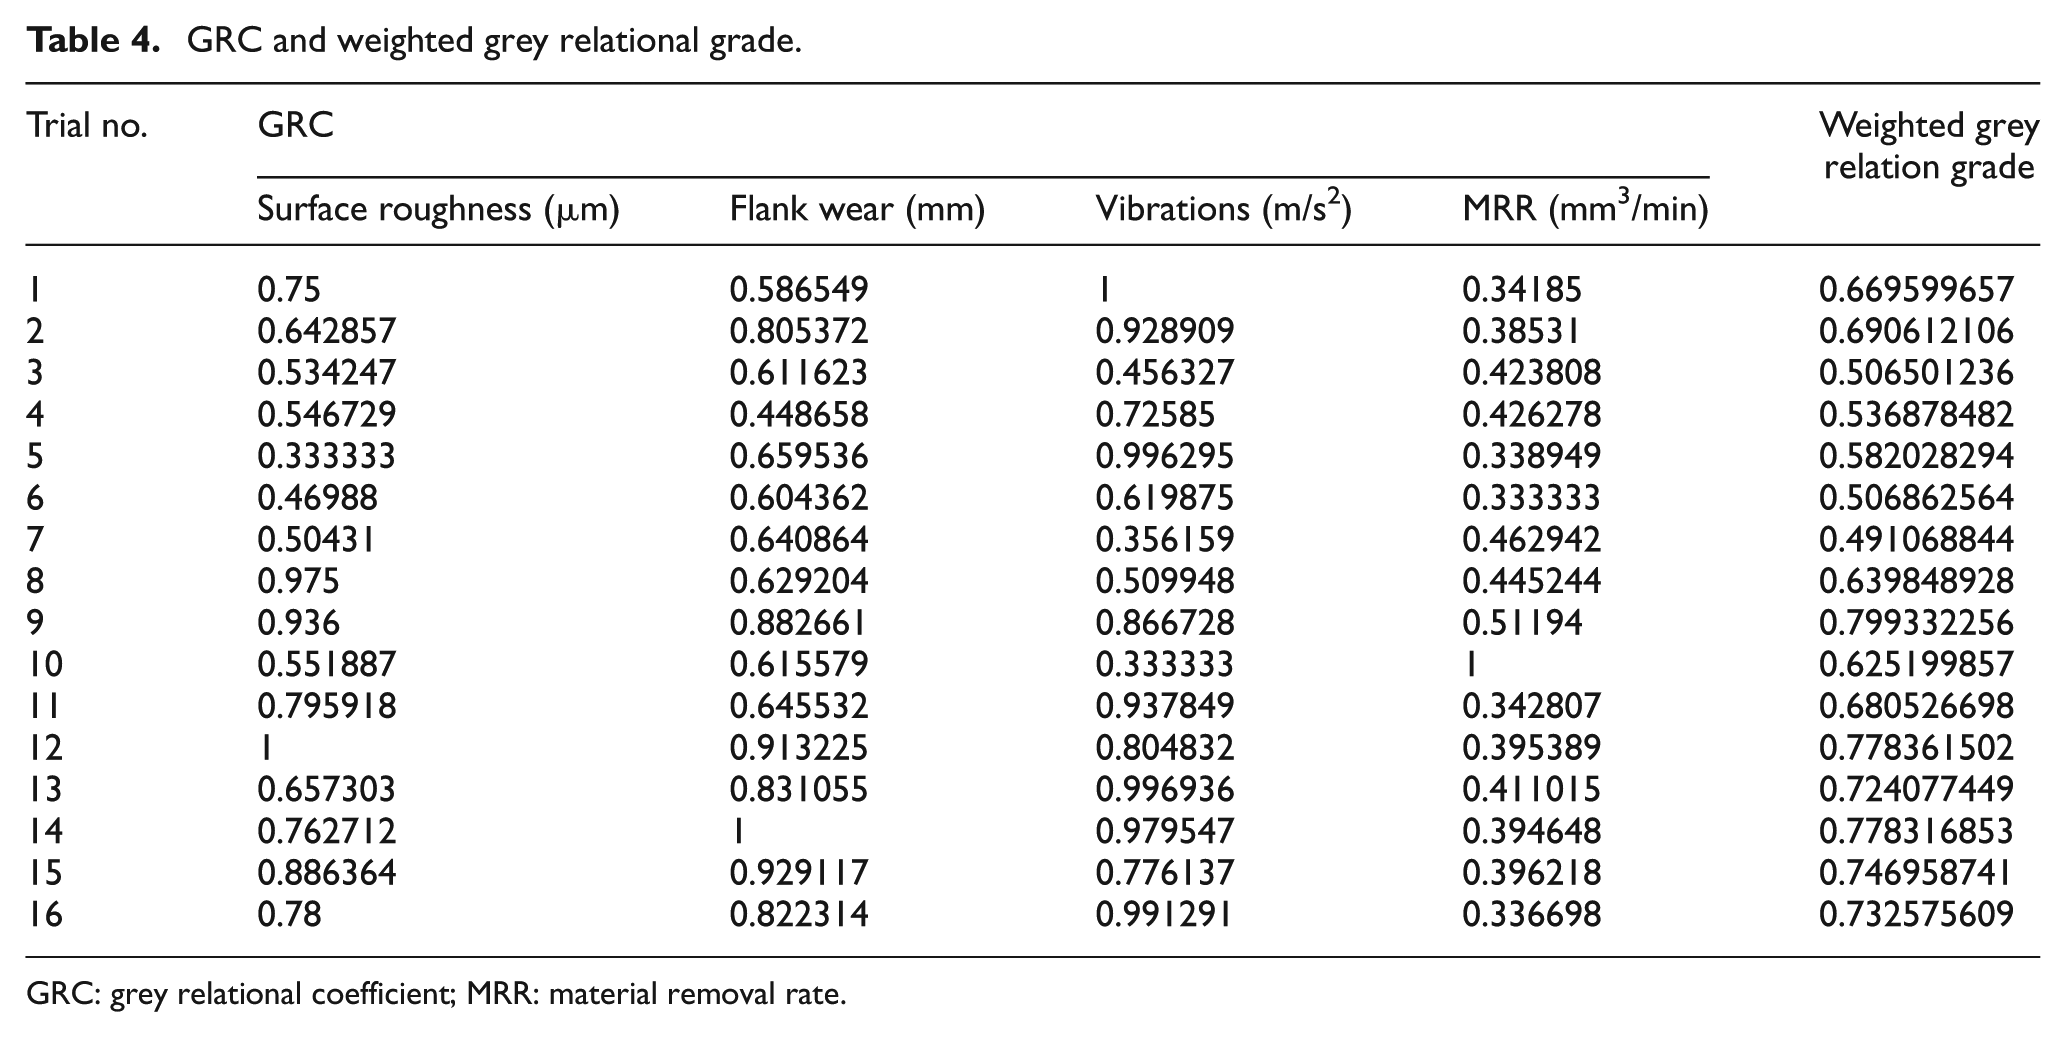
GRC: grey relational coefficient; MRR: material removal rate.
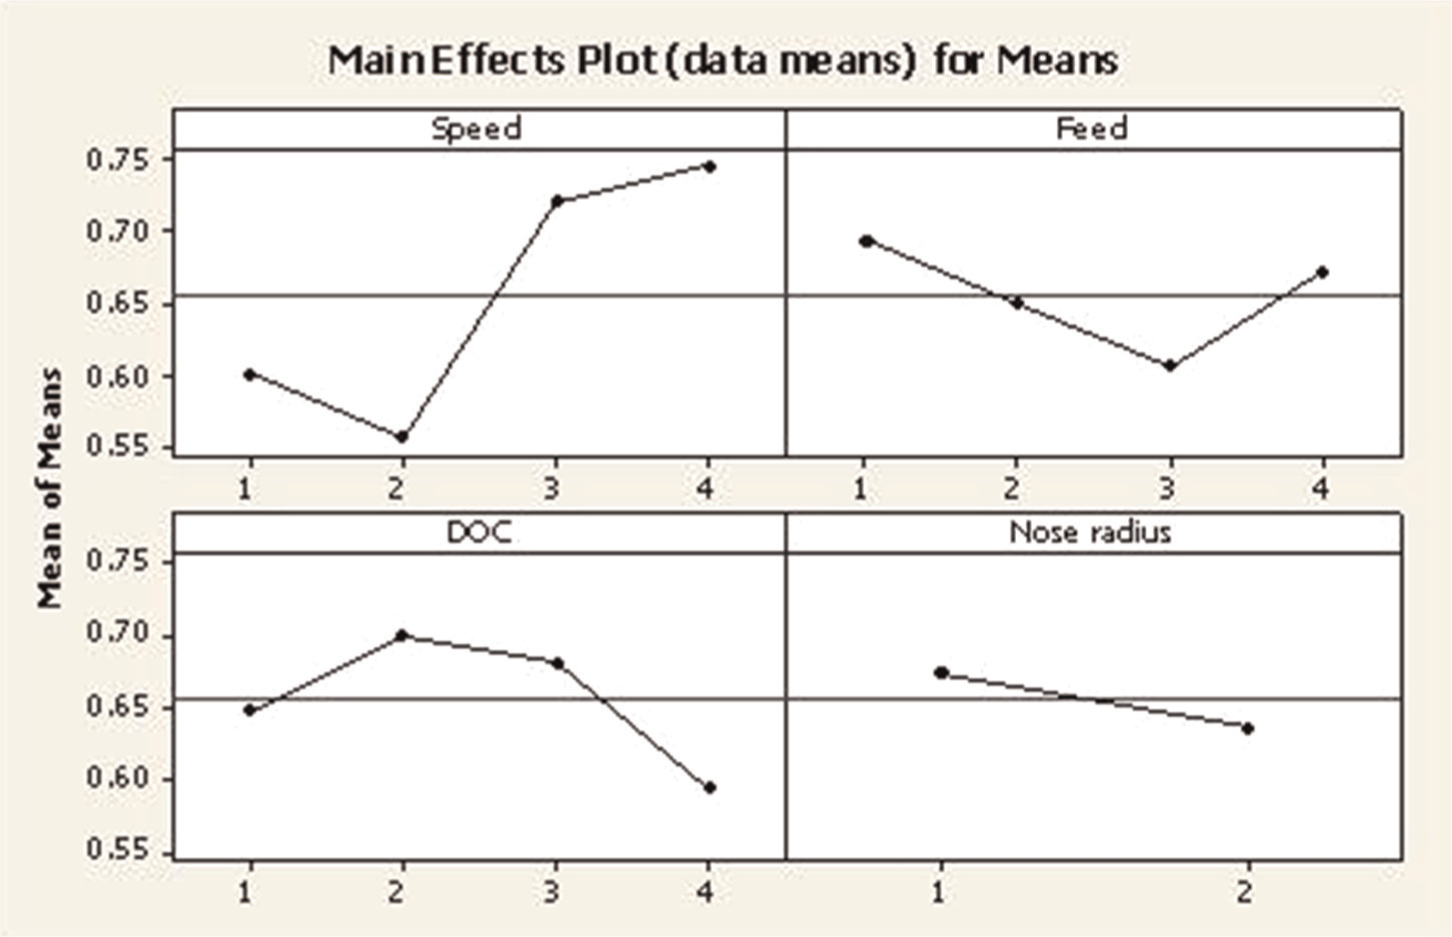
Weighted grey relational grade graphs.
The GRA graph shows the higher value of GRG at fourth level of the cutting speed (210 m/min), which yields the best surface finish value. An increase in cutting speed and decrease in flank wear are observed in the graph. Consequently, the highest MRR is obtained at high cutting speeds of 210 m/min as can be observed from the GRG graph. Usually, at higher cutting speeds, cutting temperature increases, and this softens and decreases the strength of built-up-edge (BUE). This may lead to good surface finish and low flank wear at higher cutting speeds. Furthermore, low vibrations are also observed at higher cutting speeds. A higher GRG is observed at the first level of feed, that is, 0.15 mm/rev (Figure 2). Tool vibrations are low at the low feed rate (0.15 mm/rev) and increase with an increase in the feed rate up to 0.25 mm/rev. This is because of the increase in the cross-sectional area of tool nose radius. If the effects of feed rate values on the values of the flank wear are examined between 0.15 and 0.25 mm/rev, there is an increment in the wear values. The MRR decreases with the increase in the feed rate.
From Figure 2, it is observed that the surface roughness increases with an increase in the DOC to 2.0 mm. MRR comes down when there is an increase in DOC to 0.2 mm. As far as the flank wear is concerned, it has a proportional relation with the DOC up to 2.0 mm. The tool vibration also shows the same tendency. The reason could be that higher cutting forces are required to remove the material as the DOC increases. Consequently, the tool vibration also increases. The higher value of the GRG grade is seen at the first level of nose radius, 0.4 mm. As a result, the overall machining responses in terms of surface roughness, flank wear, tool vibration and MRR are better at the cutting speed of 210 m/min, the feed rate of 0.15 mm/rev, the DOC 1.0 mm and the nose radius of 0.4 mm, which indicates the higher value of GRG. Table 5 shows results of the ANOVA for GRG and points out that speed is the most significant factor (67.96%), which affects the overall multiple responses.
ANOVA for grey relational grade.
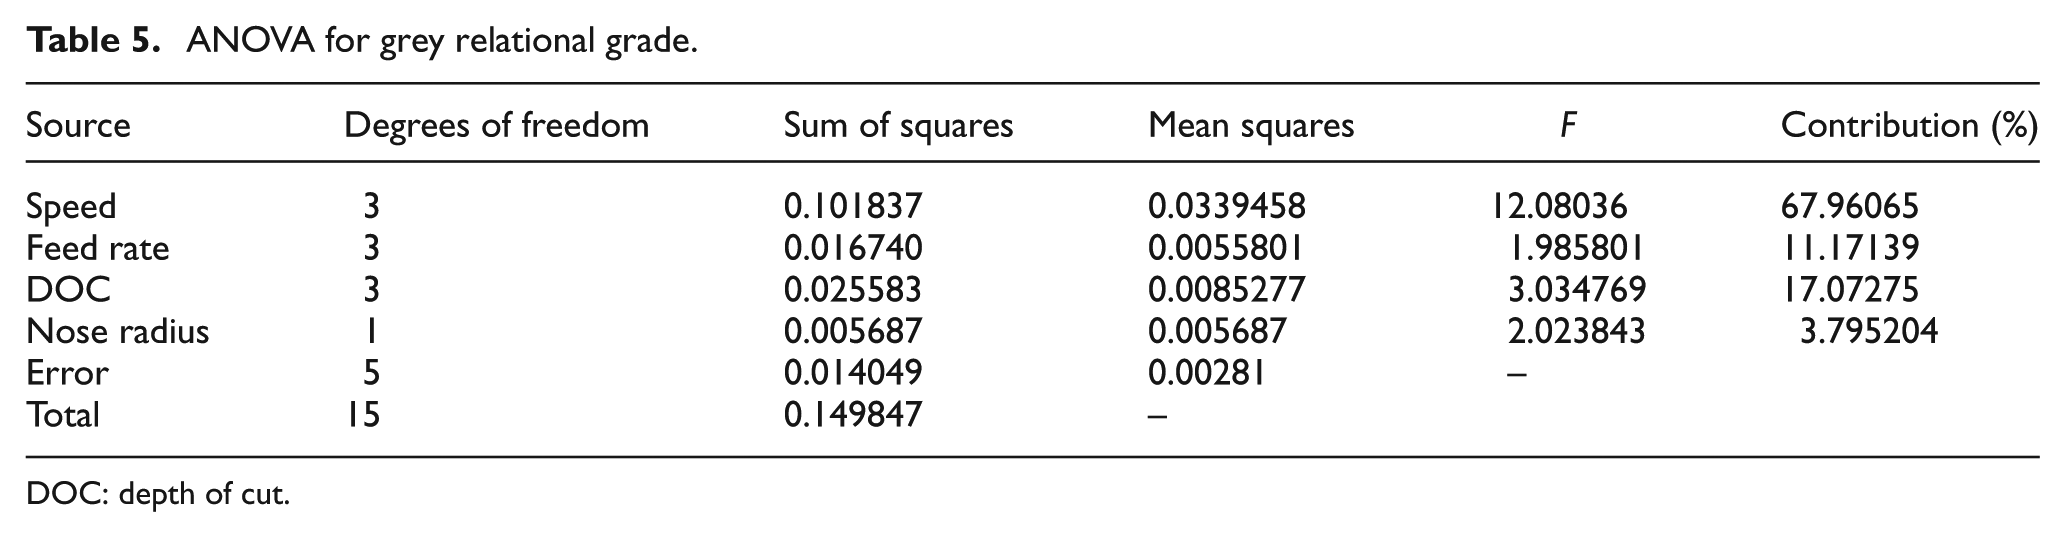
DOC: depth of cut.
Prediction of optimum value of GRG
The optimum value of the GRG along with respective confidence interval (CI) is predicted in this section. The optimum value is the predicted mean (µ), which can be estimated only considering the significant factors that are identified by ANOVA. Statistically predicted mean gives a 50% chance of the true average being greater than µ. Values of a statistical parameter are provided as a range for a defined confidence level. The range is expressed as CI. Therefore, the predicted mean of GRG when the two most significant factors are at their better levels is
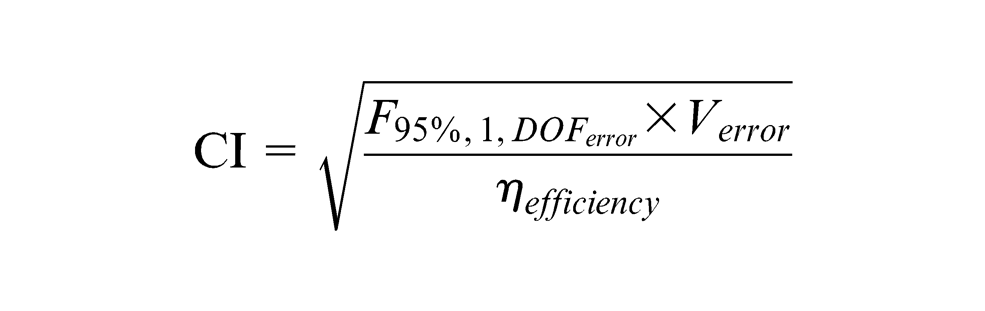
where
The predicted value of GRG (0.78946) falls within the optimum range of GRG at 95% CI. The 95% confidence interval of the predicted mean (optimum value of RG) is

Response table for weighted grey relational grade.
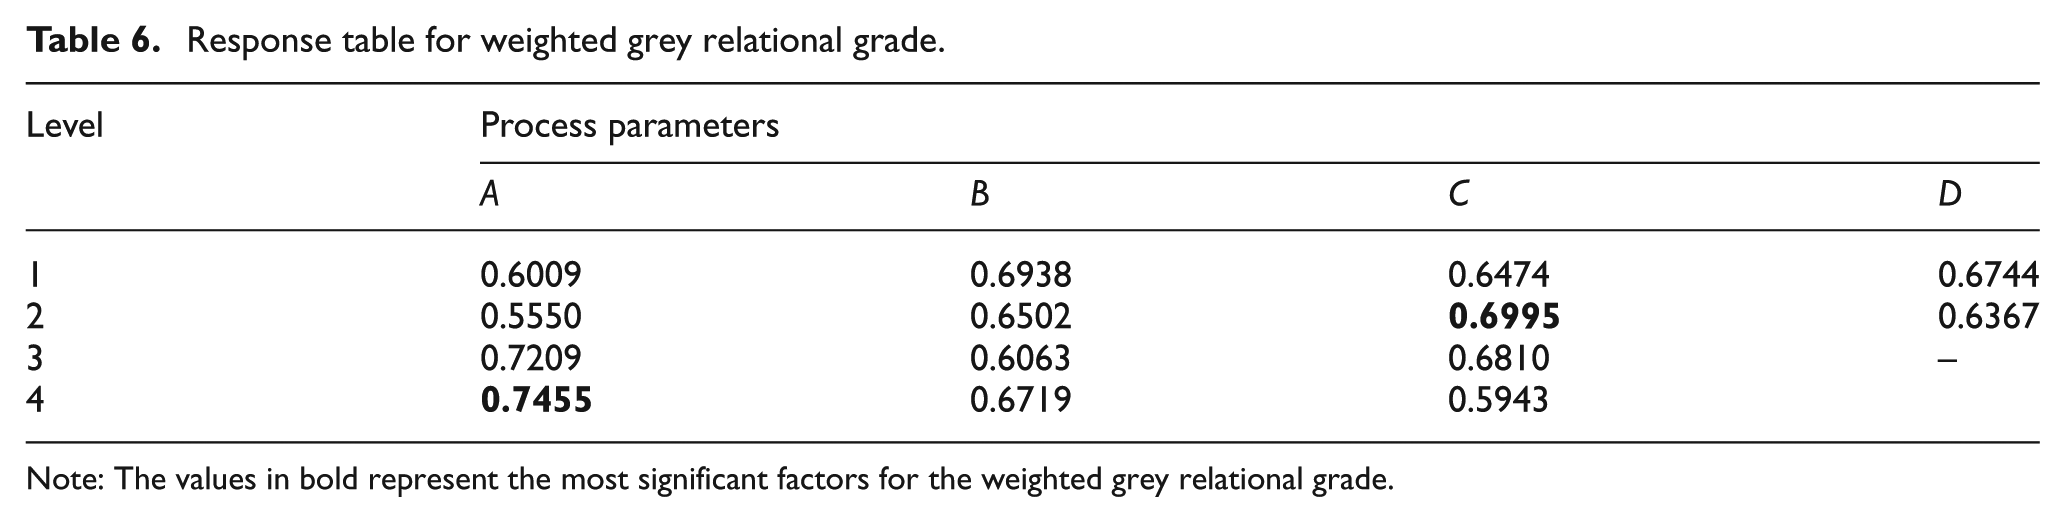
Note: The values in bold represent the most significant factors for the weighted grey relational grade.
Table 7 shows comparison of the estimated values of the responses with those of the actual parameters by using optimal machining conditions. A 9% improvement is observed when estimated values are used. It is clearly shown that the multiple responses in turning operations are greatly improved.
Comparison of expected GRG between initial and optimal conditions.
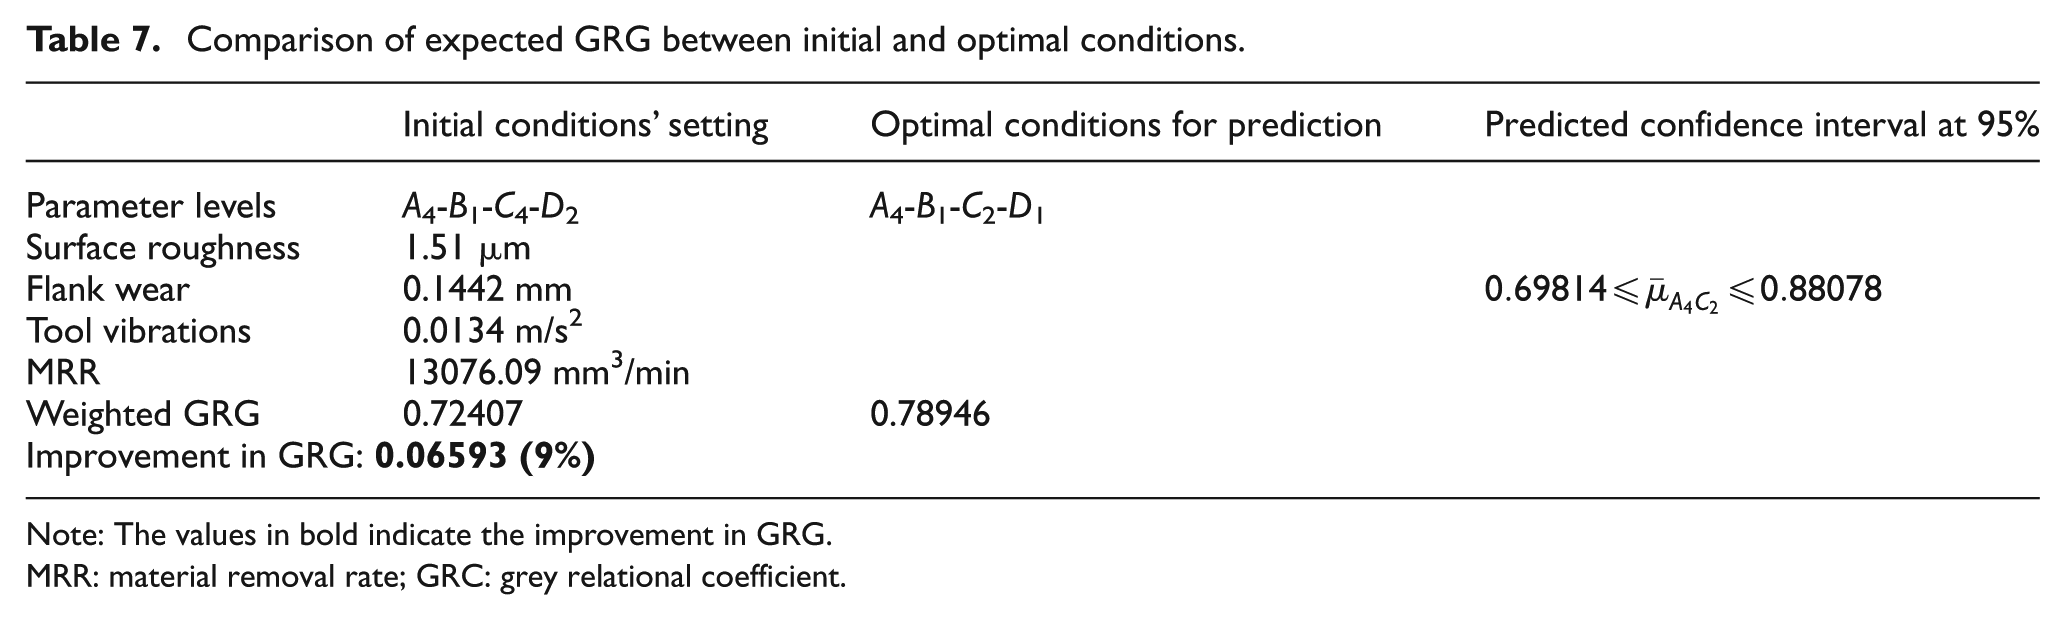
Note: The values in bold indicate the improvement in GRG. MRR: material removal rate; GRC: grey relational coefficient.
Model development
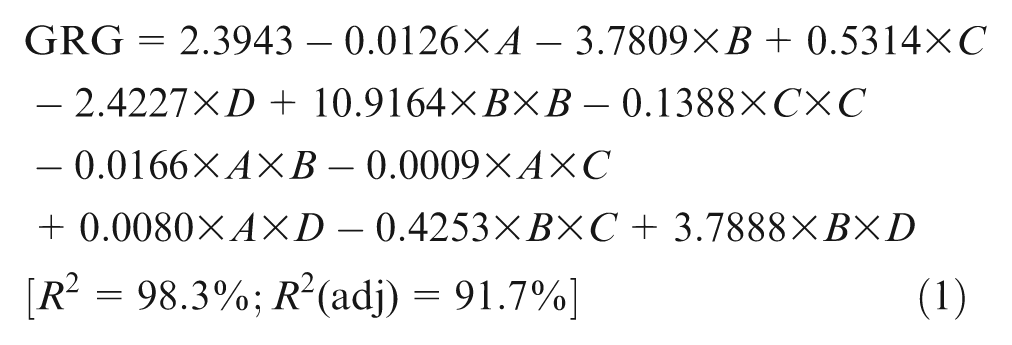
A second-order model is developed using response surface methodology (RSM) to predict the behaviour of GRG. RSM is a collection of statistical and mathematical techniques that are useful for modelling and analysis of problems. RSM helps to develop a suitable approximating model for the true system. 13 The process parameters cutting speed (A), feed rate (B), DOC (C) and nose radius (D) were considered as independent variables, and GRG was considered as a dependent variable. The model is developed using Minitab 14 software as
Model adequacy checking
Once a model is developed based on the experimental data, it is essential to ensure that it yields an adequate approximation to the true system. 13 The following techniques were used to check the model adequacy.
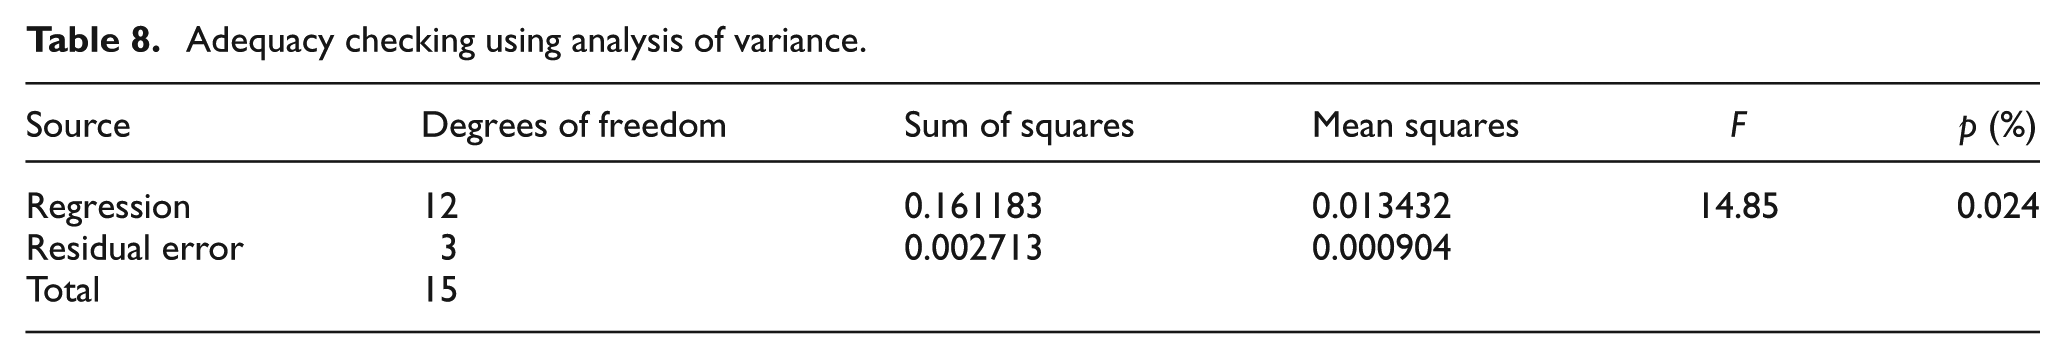
Results of ANOVA for the GRG are presented in Table 8. This analysis was considered for a level of significance of 5%. From the ANOVA in Table 8, it is evident that the calculated F value is greater than the F value in the table (F0.05,12,3 = 8.7446) and p value is less than 5%.
When the value of the coefficient of multiple determination (R 2 ) approaches unity, the fitted model shows better results. The obtained value of 98.3% for R 2 is in reasonable agreement with the value of 91.7% for R2 (adjusted) (equation (1)).
The residual plots for GRG are shown in Figures 3 and 4. Generally, residuals fall on a straight line implying that errors are distributed normally. From Figure 3, it can be concluded that all the values are within the CI level of 95%. Hence, these values yield better results in future prediction. Figure 4 indicates that there is no obvious structureless pattern or unusual structure.
Adequacy checking using analysis of variance.
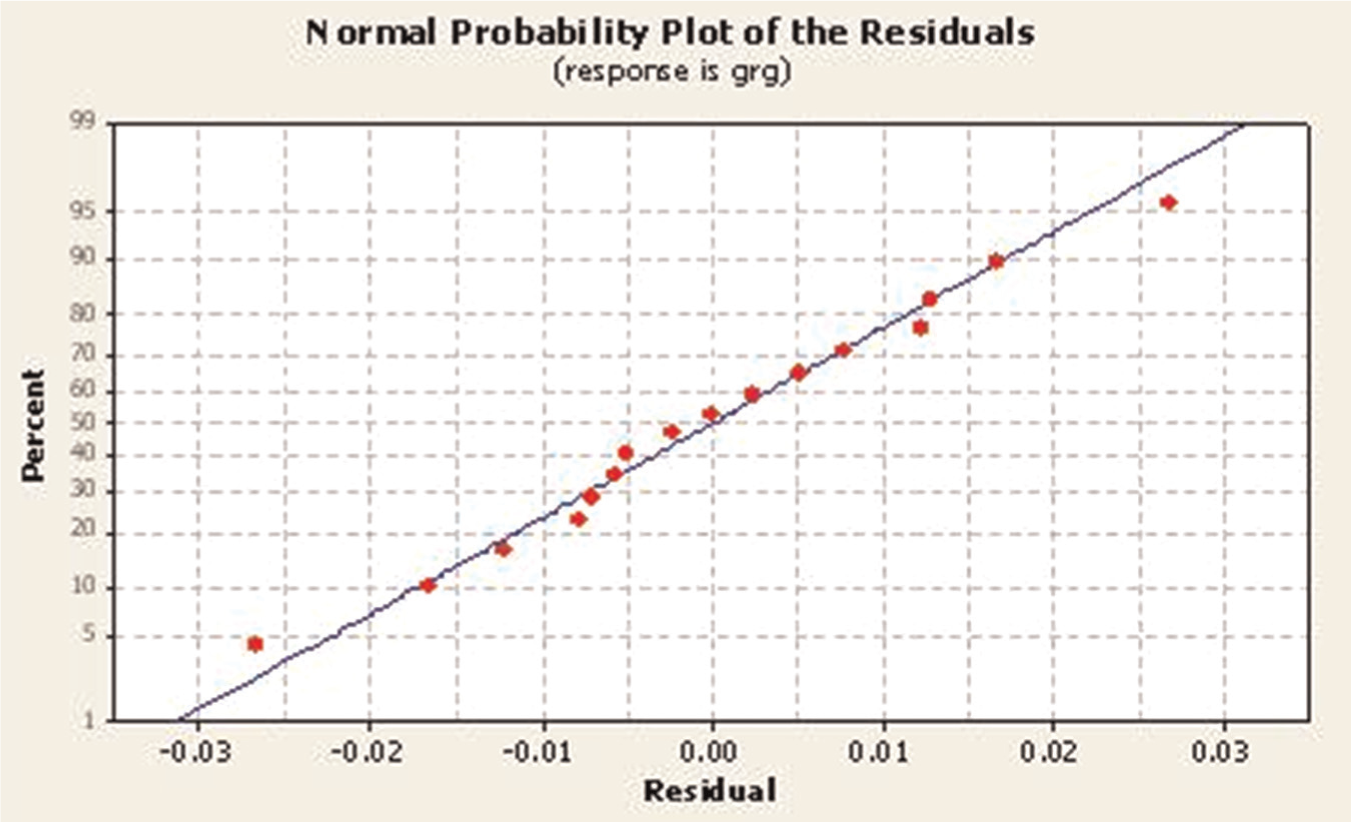
Normal plot for residuals.
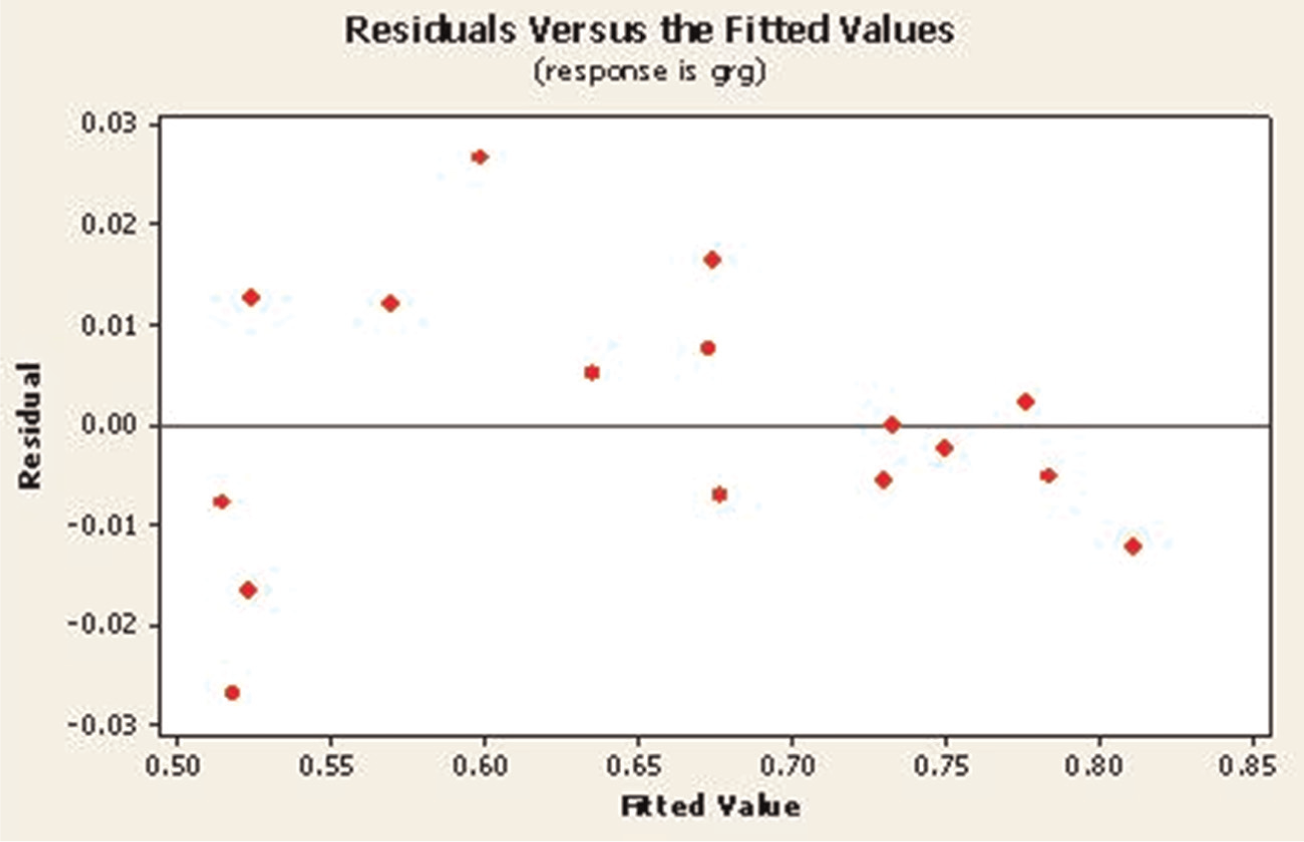
Plot for residuals versus fitted values.
As a whole with the F, p and R2 values, residual plots do not reveal any model inadequacy. Therefore, it can be concluded that the second-order model was quite adequate and the fitted values give better results for future prediction of GRG.
Conclusion
In order to optimize multi-responses, that is, surface roughness, cutting tool vibrations, flank wear and MRR simultaneously when turning AISI 304 austenitic stainless steel workpieces, the TGRA has been proposed. An orthogonal array of 16 experiments is used to perform experiments. The following conclusions are based on the TGRA.
The experimental results clearly show that a combination of cutting speed of 210 m/min, feed rate of 0.15 mm/rev, DOC of 1.00 mm and nose radius of 0.4 mm gives optimum results for turning of AISI 304 austenitic stainless steel by employing multi-response optimization using GRA.
The combination further led to predict an optimal value for the GRG between 0.69814 and 0.88078 with 95% CI.
Based on ANOVA results, the cutting speed is the biggest influencing factor of having 67.96% contribution ratio, while DOC and feed rate have contribution ratio of 17.07% and 11.17%, respectively, on surface roughness, cutting tool vibrations, flank wear and MRR in turning of the workpieces.
A significant increase in the value of predicted weighted GRG from 0.72407 to 0.78946 (9% increment) confirms the improvement in the performance of CNC turning process using optimal values of process parameters.
The developed model using RSM is accurate and can be effectively used for the prediction of GRG in turning of AISI 304 stainless steels within the limits of parameters investigated.
Footnotes
Declaration of conflicting interests
The authors declare that there is no conflict of interest.
Funding
This research received no specific grant from any funding agency in the public, commercial or not-for-profit sectors.