
Abstract
Beryllium–copper alloys have several industrial applications but are exposed to serious machinability challenges by conventional machining processes because of excessive tool wear and poor surface finish. This study explores the machinability of beryllium–copper alloy in an electro discharge machining process based on particularly dielectric medium parameters, oil and deionized water. Machinability characteristics were evaluated for material removal rate (MRR), electrode wear ratio (EWR) and the quality of the machined surfaces in terms of surface roughness (R a ). Experimental results were statistically analyzed and optimized using analysis of variance, Taguchi’s orthogonal array and grey relation analysis. Response surface methodology has been used for modeling and prediction of the optimal experimental conditions. It was observed that the dielectric medium is a significant parameter, as is the working current for the machinability of beryllium–copper alloys. Electrode shape deformations, depending on electro discharge machining parameter variations, were also analyzed as an appendix section.
Keywords
Introduction
Machinability of advanced engineering materials is difficult for traditional processes in many cases such as drilling, turning and milling. Nontraditional manufacturing processes like electro discharge machining (EDM), because of their distinctive mechanism of material removal, are feasible options in such requirements. 1 In EDM, conversion of electrical energy to thermal energy, by repeated occurrence of electrical sparks between the electrode tool and the workpiece, causes material removal from workpiece and tool by melting and evaporation processes. 2 Major process parameters, such as electrical parameters (current, voltage, pulse duration, polarity, etc.), flushing (flushing method and direction, pressure) and material characteristics (electrode, workpiece and dielectric medium) have been identified by many studies for the improvement of EDM performance. 3
Electrical discharge machining of beryllium-copper (Be-Cu) alloy workpieces as an unusual material was examined in this study. Be-Cu alloys have been widely used in many industries, such as electronics, medical, aerospace and automotive, for the manufacturing of various parts owing to their remarkable material characteristics, like high fatigue strength and hardness, excellent wear and corrosion resistance and non-magnetic property.4,5 In spite of its common use in industrial applications there is a remarkable lack of evidence for the machinability characteristics of Be–Cu alloys in comparison to other materials, such as iron-based metals or metallic alloys and composites. Limited literature is available for this topic. One of the important studies, 6 made by cooperating with some prominent manufacturing and metals companies and organizations, has reported serious and high-risk problems regarding the machinability of beryllium and its alloys by traditional manufacturing processes, both in terms of the high cost and the health hazards. These manufacturing processes include turning, milling, drilling, tapping, reaming and grinding. Some of the problems have been summarized as:
unusual powdery chips, as a result of rubbing, can shorten the tool life in comparison with those other difficult-to-machine metals or alloys;
machining of those materials can cause mechanical stress on the machine tool spindle;
a heavy depth of cut can cause warping and twinning, microtearing of the grain’s lattice, of the surface owing to low fracture toughness;
a built-up edge was also claimed as the biggest problem causing a poor surface finish.
In addition, beryllium and its compounds can be hazardous owing to their toxic properties. Chronic beryllium disease (CBD) has been reported as a health problem in workers exposed to beryllium–copper machining. 5 Another study has correspondingly reported that the surface integrity and the tool wear became a serious problem in cutting of beryllium–copper alloy because of its high strength. 7 In the EDM method, there is no mechanical contact between the workpiece and tool/electrode. The problems mentioned above (rubbing, powdery chips, mechanical stress, warping, twinning, build-up edge, etc.) related to the machining of beryllium–copper alloys by traditional cutting methods will not be seen in EDM. In addition, toxic effects of beryllium–copper alloys during machining can be reduced by immersing of workpieces into a dielectric medium in EDM. Beryllium–copper alloys have good thermal and electrical properties. Therefore, EDM of beryllium–copper alloys can be executed more effectively and safely. 8
Approach
In this study, a dielectric medium type was varied by employing oil and deionized water in addition to the pulse duration and the working current variations for evaluating the machinability of beryllium–copper alloy workpieces. The main functions of the dielectric medium in EDM processes are to:
insulate the gap before high energy is accumulated;
concentrate the discharge energy to a tiny area;
recover the gap condition after the discharge;
flush away the discharge products. 1
Experimental results were analyzed and optimized by using analysis of variance (ANOVA), Taguchi method, grey relational analysis and response surface methodology for achieving optimal machining performance. The Taguchi method was utilized for optimization of the single performance characteristics, while grey relational analysis was utilized for optimization of the multiple performance characteristics. Then, grey relational grade results were modeled mathematically using response surface methodology to graphically depict variation of related response levels and for their prediction. Figure 1 shows a flowchart for overall understanding of the approaches used in this work. Consequently, the main objective of this study is to determine machinability characteristics of the beryllium–copper alloys, especially depending on different kinds of dielectric mediums with help of statistical and optimization analyses, which is the distinctive scope of this study in comparison with the related study. 9
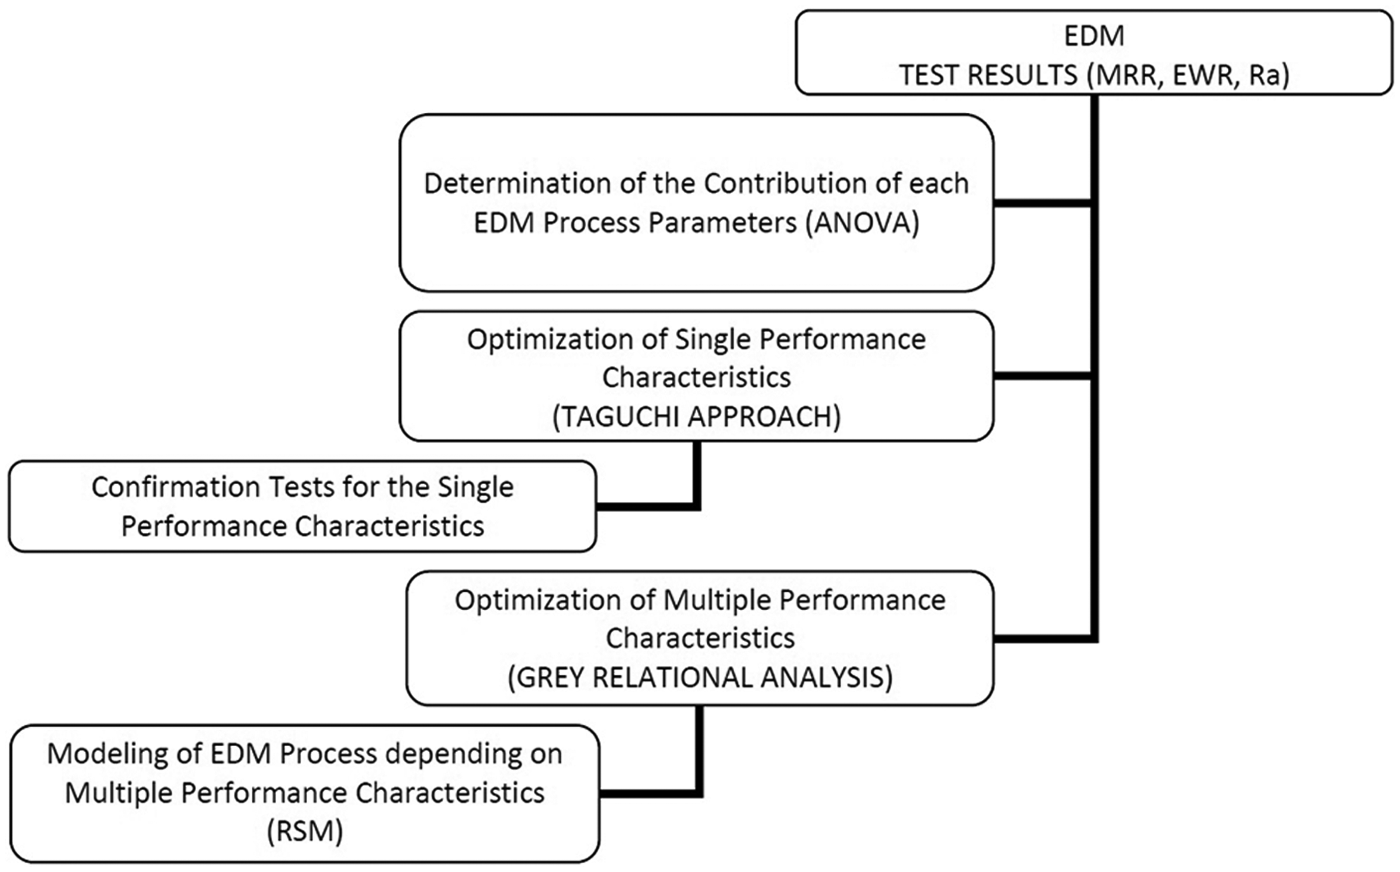
A flowchart for the overall content of this study.
Experimentation
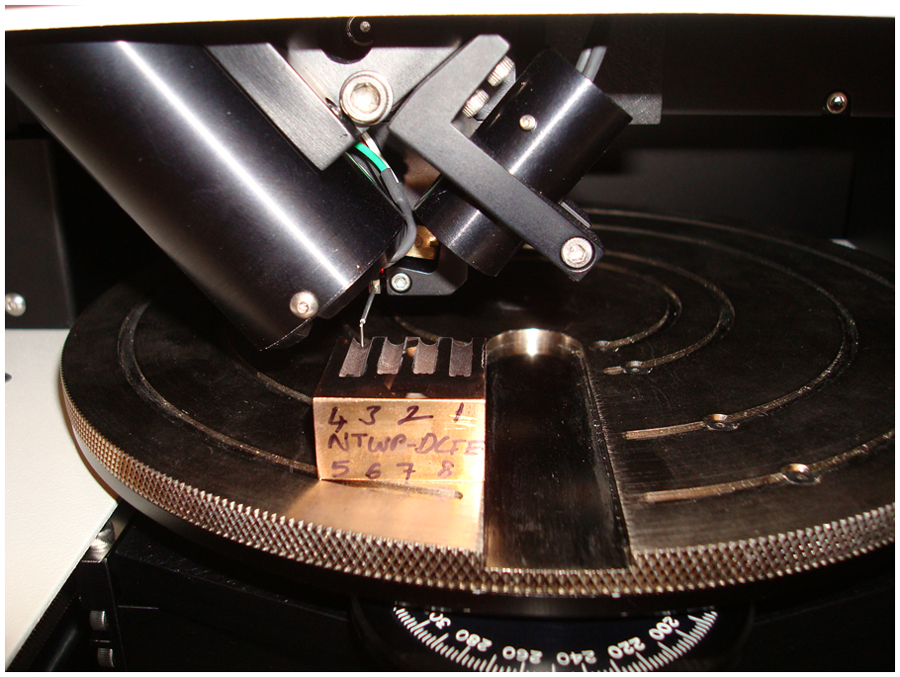
Experiments were conducted on a ZNC/50A Drilling Electro-Discharge Machine, as shown in Figure 2, at the Center for Nontraditional Manufacturing Research (CNMR) in the University of Nebraska–Lincoln.
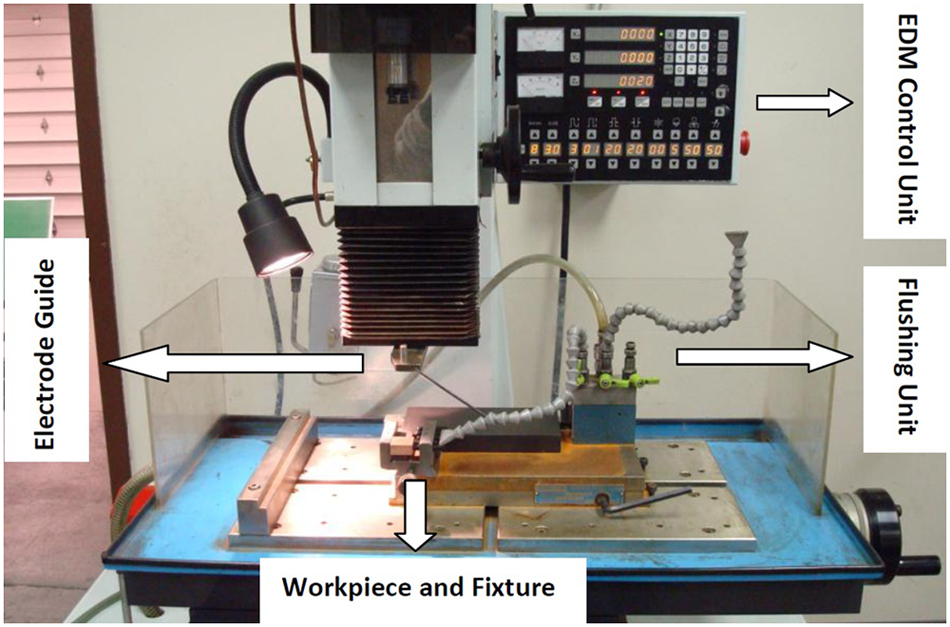
Electro discharge drilling (EDM hole popper).
Electrode, workpiece and dielectric medium materials
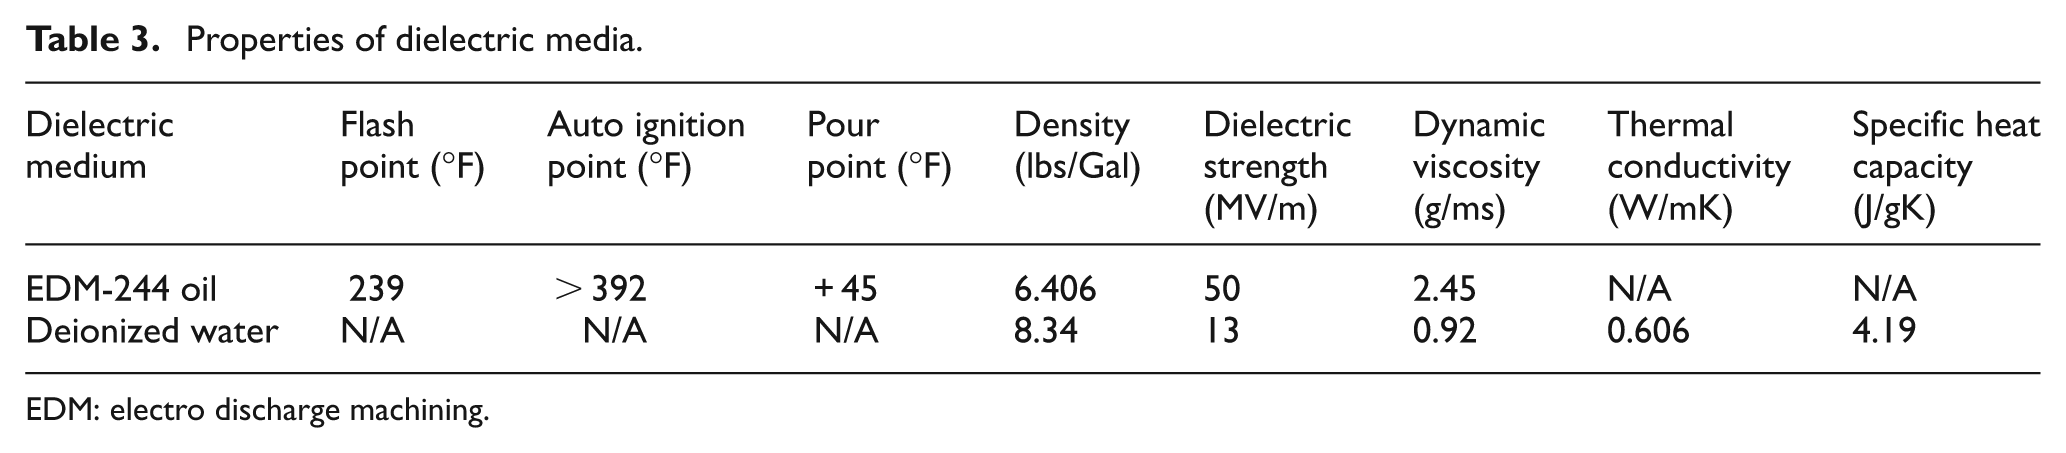
Moldmax beryllium–copper alloy workpiece (with dimensions of 26 × 26 × 13 mm) and Web type two-channel C-122 copper electrodes (with dimensions of Ø3 × 300 mm) were used in this study. A cross sectional view of the electrodes is shown in Figure 3. Copper has some advantages, such as easily obtainable, consistent in quality and low in cost, in comparison with those graphite and tungsten electrodes. 10 Two kinds of dielectric medium, Commonwealth EDM-244 oil and deionized water, have been employed in the tests. Tables 1–3 show some properties of the copper electrode, the beryllium–copper alloy workpiece 9 and dielectric medium materials, respectively.
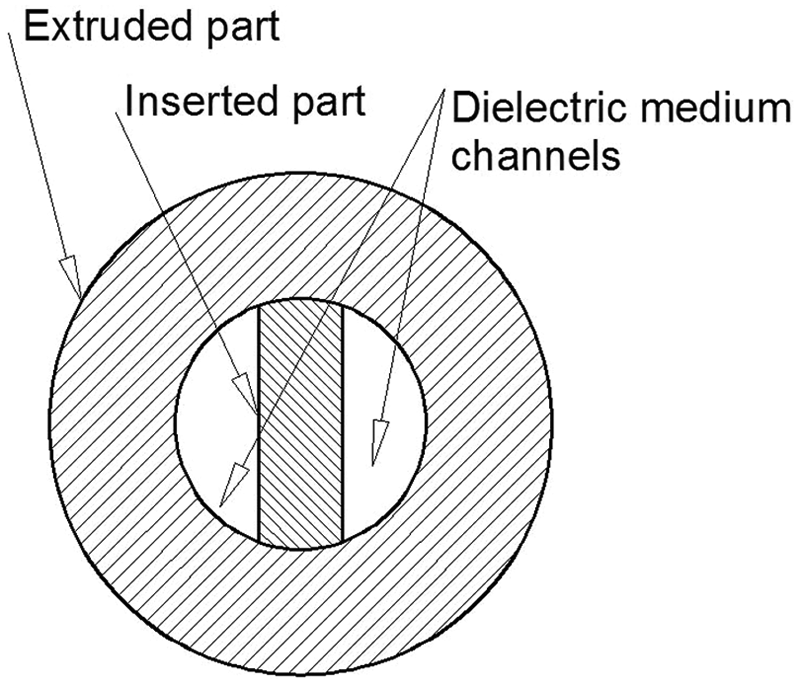
Cross sectional of a web-type multi-channel copper electrode.
Chemical, physical and mechanical properties of C-122 copper electrodes.
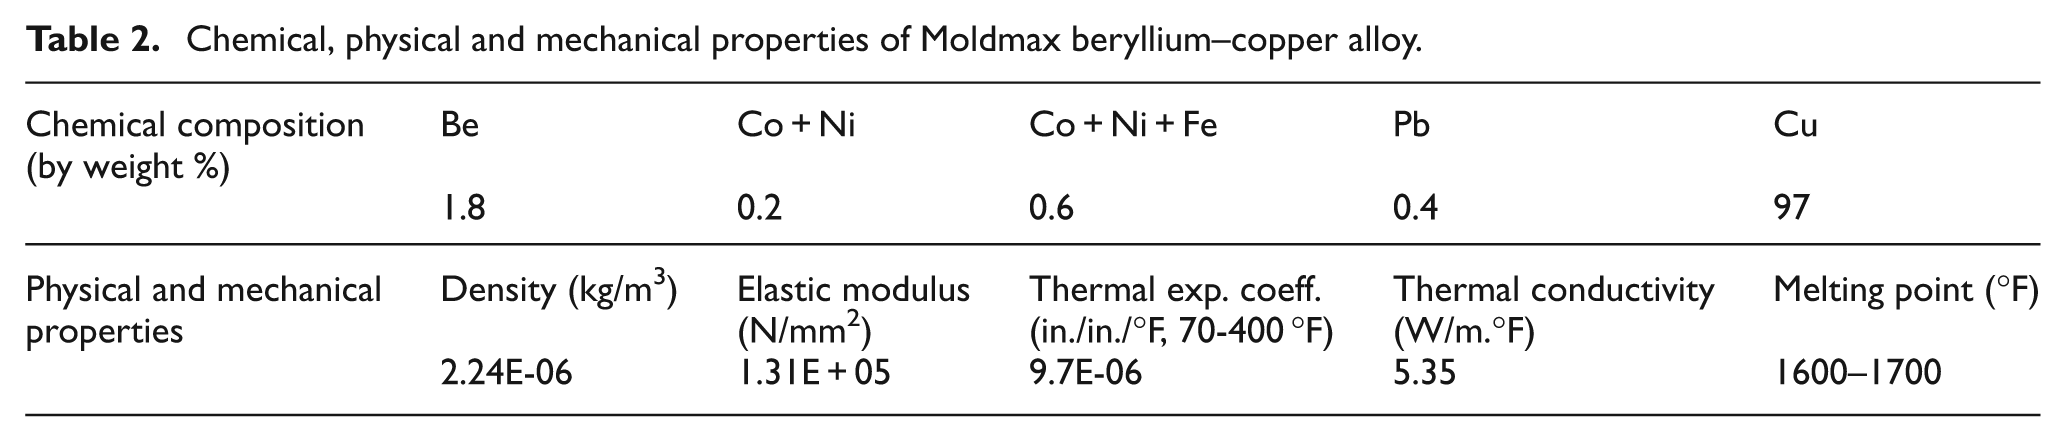
Chemical, physical and mechanical properties of Moldmax beryllium–copper alloy.
Properties of dielectric media.
EDM: electro discharge machining.
Material removal rate (MRR)
Material removal rates were determined by weight difference of the specimens before and after machining using a Sartorius precision scale type E-1200S having a maximum 1210 g capacity and 0.001 g resolution. MRR was calculated by

where w f is the weight of the workpiece before the EDM process, w l is the weight of the workpiece after the EDM process, tsec is the time of the EDM process and ρ is the density of the used workpiece material.
Electrode wear ratio (EWR)
Electrode wear ratios or relative electrode wears were determined as a percentage of

where V T is the volume difference of the tool (electrode) before and after the EDM process and V W is the volume difference of the workpiece before and after the EDM process.
Average surface roughness (R a )
The average surface roughness R a was measured using an AMBIOS XP-2 Stylus Profiler, as shown in Figure 4, with a maximum vertical range of 100 µm. Stylus speed, stylus tip radius, stylus force, measurement length and data points were 0.05 mm/s, 2.5 micron, 10 mg, 10 mm and 12500, respectively. All surface roughness measurements were carried out from the top of each drilled hole. The calibration was made before the measurements. All samples were cleaned in acetone by using an ultrasonic cleaner (3210 Branson) for 20 min before the measurements.
AMBIOS XP-2 Stylus Profiler.
Statistical Analysis And Optimization Study
Statistical examinations and optimization studies were performed according to results of ANOVA, Taguchi’s optimization technique and grey relational analysis. Moreover, results of grey relation analysis were modeled by response surface methodology.
Design of experiment (DOE)
Experimental design was made according to the L32 (21(42)) mixed level orthogonal array (OA) based on the Taguchi method to study the effect of various process parameters in the drilling of meso-scale holes in beryllium–copper alloy workpieces. Three machining parameters were used as control factors and each parameter was designed to have different levels, as shown in Table 4. Working current and pulse time were chosen as variable parameters since the erosion rate of the EDM process is a function of electric discharge energy, and the erosion rates and process performance are affected mainly by pulse parameters, such as discharge current and discharge time. 1 Therefore, the other inputs, such as working voltage, capacitance, spindle speed, gap voltage and servo feed speed, were kept constant as 150 V, 3 µF, 187 r/min, 20 V and 50 mm/min, respectively. Flushing was provided by forced flowing of the dielectric medium through two channels of the electrodes. A drilling depth of 20 mm was adapted to obtain a blind hole. These experimental conditions, based on EDM machining parameters, are similar to the related study. 9 However, experiments of this study were entirely repeated again and so totally different results were obtained depending on other uncontrolled factors, such as pressure of the dielectric medium and characteristics of renewed electrode and workpiece materials.
EDM parameters and their levels.
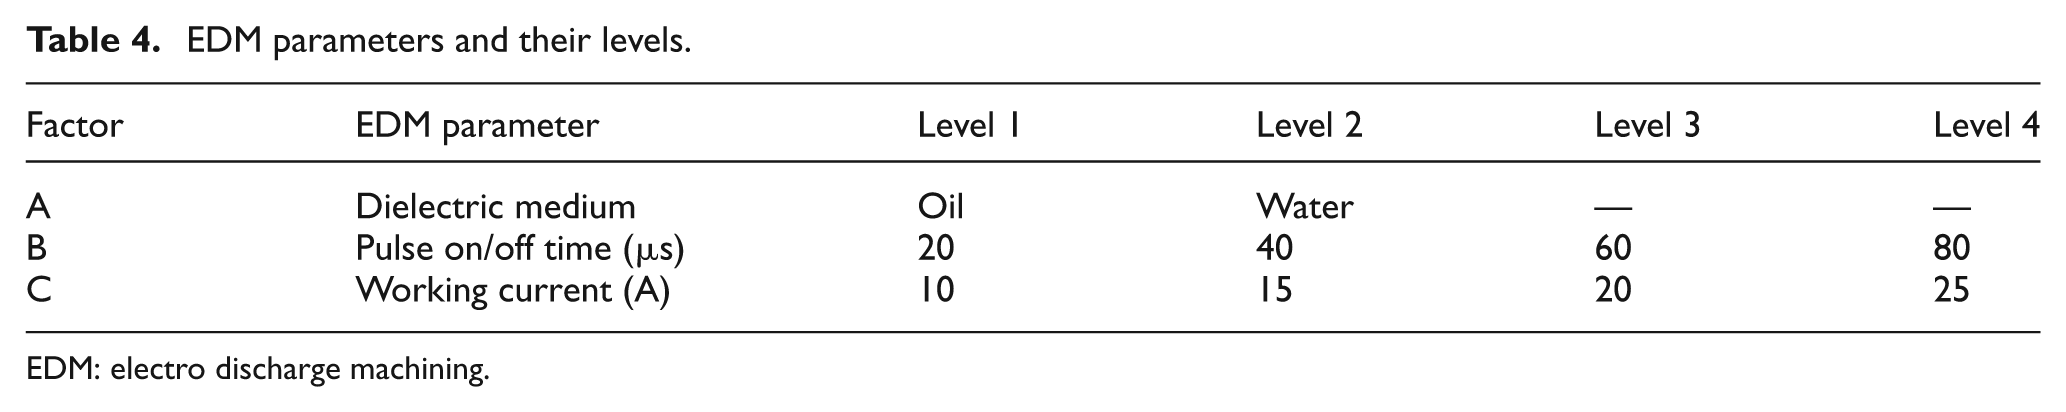
EDM: electro discharge machining.
ANOVA
ANOVA can be used for the statistical analysis of the data to study the contribution of the individual factors. The relative importance of the EDM parameters with respect to the MRR, EWR and R a was investigated to determine more accurately the optimum combinations of the EDM parameters by using ANOVA. Significance of the process parameters are also identified by ANOVA. In these analyses, type III sums of squares (the default) have been chosen, hence, the contribution of each factor is measured after having removed the effects of all other factors. The percentage contribution ratio (PCR) in the ANOVAs helps in expressing a total percentage that each factor and their interactions contributing to the total variation observed in an experiment. If the percentage error contribution is lower than 15%, then it can be assumed that no important factors are neglected from the experiment. However, if it is higher than 15%, it implies that certain important factors are neglected and conditions are not accurately controlled or measurement error is excessive. The PCR is calculated by equations (3) and (4) 11


where
Taguchi approach
Taguchi orthogonal experimental design has been utilized to investigate the optimal combinations of the EDM process parameters to maximize the MRR and minimize the EWR and R a . This approach is an effective method to analysis responses influenced by multi-variables. Procedure of the Taguchi method is composed of the following steps.
Selection of the quality characteristics.
Selection of noise factors and control factors.
Selection of OA.
Conducting the experiments.
Analyzing and determining of optimum parameters.
Prediction of optimum performance.
Confirmation of experimental design. 12
In the OA of Taguchi’s design, mean response for each run in the array is analyzed using an appropriately chosen signal-to-noise (S/N) ratio. The S/N ratio is a quality indicator that the effect of changing a particular parameter on the performance of the process can be evaluated. These S/N ratios are derived from the quadratic loss functions expressed in equations (5) and (6)
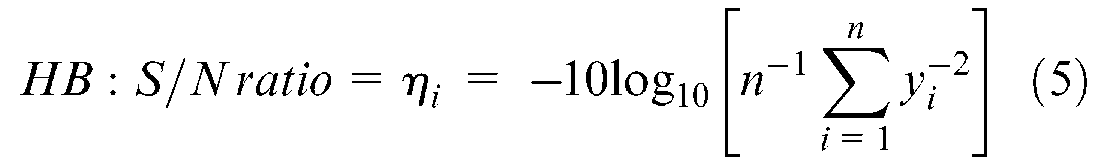
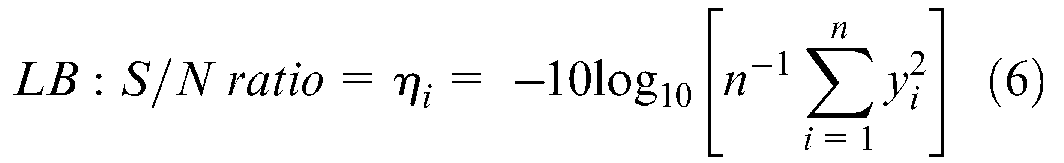
where i and n are the number of observations in an experimental design and y i is the performance characteristic in the observed data. 13 The objective of this research is to determine the optimal EDM conditions to achieve maximum MRR and minimum EWR and R a in machining of the beryllium–copper alloy. Hence, while the higher-the-better (HB) approach was utilized for MRR analysis, the lower-the-better (LB) approach was utilized for EWR and R a analyses. The greater η i value will correspond to a better performance regardless of category of the performance characteristics.
Grey relation analysis
Grey relational analysis can be supportive to the Taguchi’s optimization approach for multiple performance characteristics of the EDM process, necessary to investigate optimization of EDM parameters for MRR, EWR and R a responses together. In the first stage of the grey relational analysis, the experimental results of the MRR, EWR and R a have been normalized in the range between 0 and 1 by grey relational generating for the analysis. These normalized results regarding the large value, express the situation of better performance and the best normalized result will be equal to 1. 14 For this study, the normalized experimental values Y i (k) of the MRR are expressed by equation (7) according to HB performance characteristic
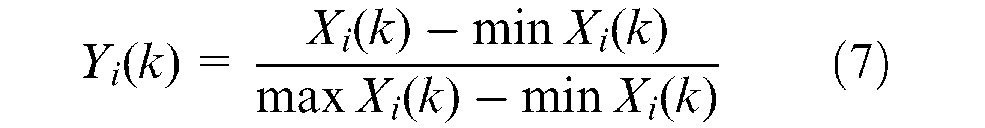
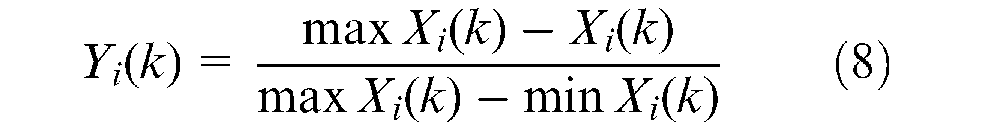
where X i (k) is the kth experimental result in the ith experiment, minX i (k) and maxX i (k) are the minimum and maximum values of X i (k), respectively. The normalized experimental results Y i (k) of both EWR and R a can be expressed by equation (8), according to the LB performance characteristic
After that, the grey relational coefficients showing the relationship between the optimal (best = 1) and actual normalized values have been determined by equations (9) and (10)


where ξ i (k) is the grey relational coefficient, Δmin and Δmax are the minimum and the maximum values of Δ 0i , respectively, ζ is the identification coefficient adjusting with regard to the systematic actual need, defined in the range [0, 1] and commonly suggesting the value of 0.5, Δ 0i (k) is the absolute differences of two comparative sequence, Y 0 (k) is the reference sequence which is equal to 1 and Y i (k) is the objective/comparison sequence in the analysis. The higher grey relational coefficient ξ i (k) will represent that the corresponding experimental result is closer to the optimal or the best normalized value for the single performance characteristics or local grey relation measurement. After derivation of the grey relational coefficients, the grey relational grade has been determined as the last stage of the analysis for evaluation of the multiple process responses by taking the average value of the grey relational coefficients by

where γ
i
is the grey relational grade and
Results And Discussion
ANOVA
Results of ANOVA for MRR, EWR and R a are given in Tables 5–7, respectively. In these demonstrations: the source includes the controlling factors A (the dielectric medium), B (the pulse on/off time), C (the working current), the error factor and the total of all observations. SS is sum of squares of the controlling factors. DF is degree of freedom symbolizing the number of independent variables. While the degree of freedom of each factor is the number of its levels minus one, the degree of freedom of the error factor is the total degree of freedom minus the sum of the degree of freedom of each controlling factor, and the total degree freedom is the number of observations minus one. MS is the mean square or variance of the factors, derived from the dividing of each sum of square by each degree of freedom. F is the value of the F-ratio having the ability to determine the effect of each controlling factor. The largest F value indicates the effect of the most important controlling factor, with parallel to the PCR value. The P value proves the importance of the factors according to the level of significance and confidence interval. 15 It can be clearly seen, based on 0.05 significance level and 95% confidence interval, that the most important factors affecting the MRR are dielectric medium (13.78% contribution) and the working current (74.43% contribution). The dielectric medium (70.74% contribution) and the working current (19.45% contribution) are the most important variables affecting EWR. On the other hand, the dielectric medium (56.49% contribution) and the working current (24.82% contribution) are the most important factors also for the R a response. It should be noted that percentage error contribution values are lower than 15% for the analysis of MRR (12.62% contribution) and EWR (9.41% contribution), which means that any significant factor is missing in their original data. However, the percentage error contribution value of R a (18.32% contribution) is a little bit higher than 15%, which means certain important factors are overlooked and the experimental data are no longer considered representative. 15 This result can be related to the higher range of R a responses between its minimum and maximum values, depending on the EDM parameter variation when comparison to other responses. So, the R a results will be considered as they stand in the following analyses. ANOVA also indicates that the pulse on/off time seems to be an insignificant parameter for the MRR, EWR and R a responses. These results are remarkable and opposite to the results of the relevant study. 9 As described in the section ‘Design of experiment’, it was assumed that the uncontrolled factors of the EDM process have caused those results. Interestingly the dielectric medium type (oil or deionized water) is a factor more effective than the working current variation in terms of excellent EWR and R a results.
ANOVA for the MRR.
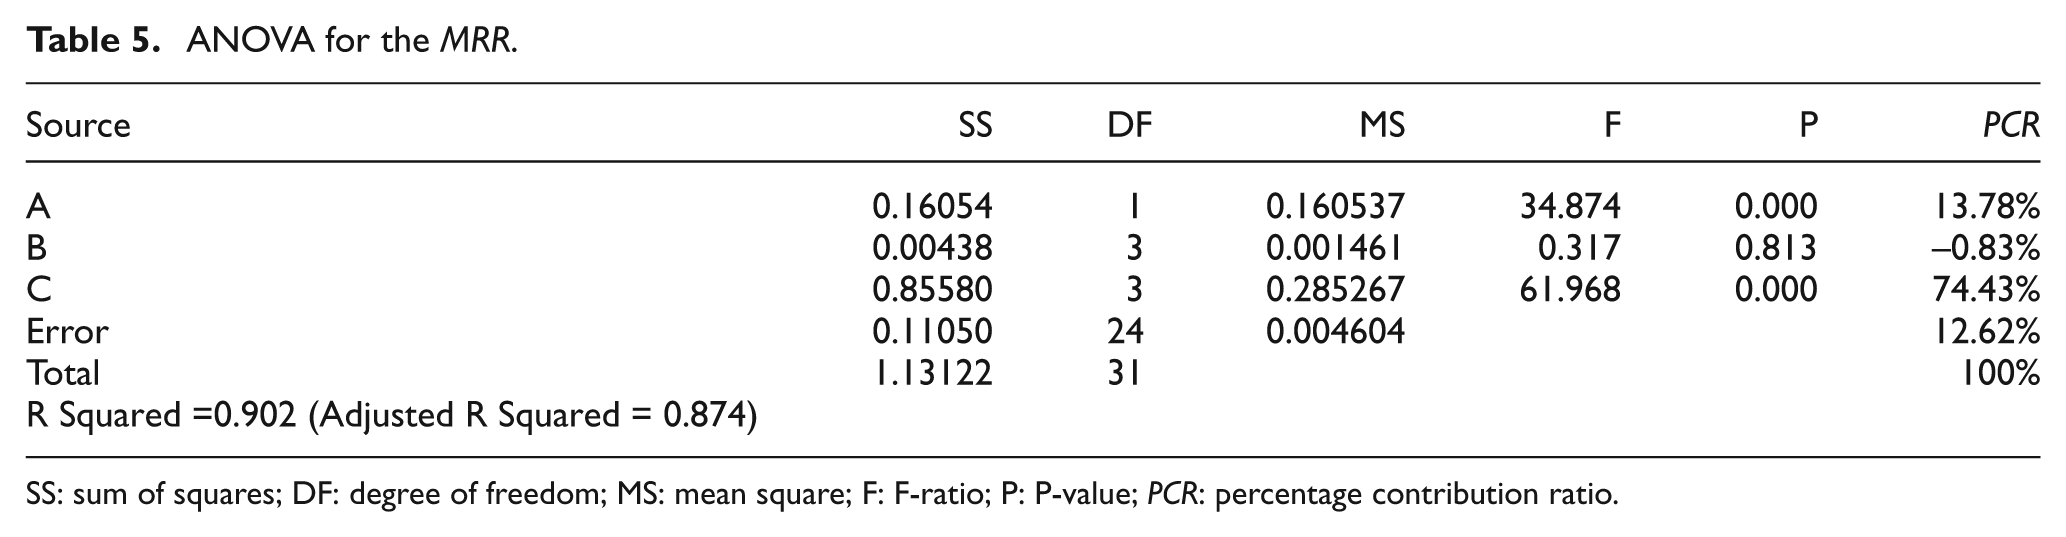
SS: sum of squares; DF: degree of freedom; MS: mean square; F: F-ratio; P: P-value; PCR: percentage contribution ratio.
ANOVA for the EWR.
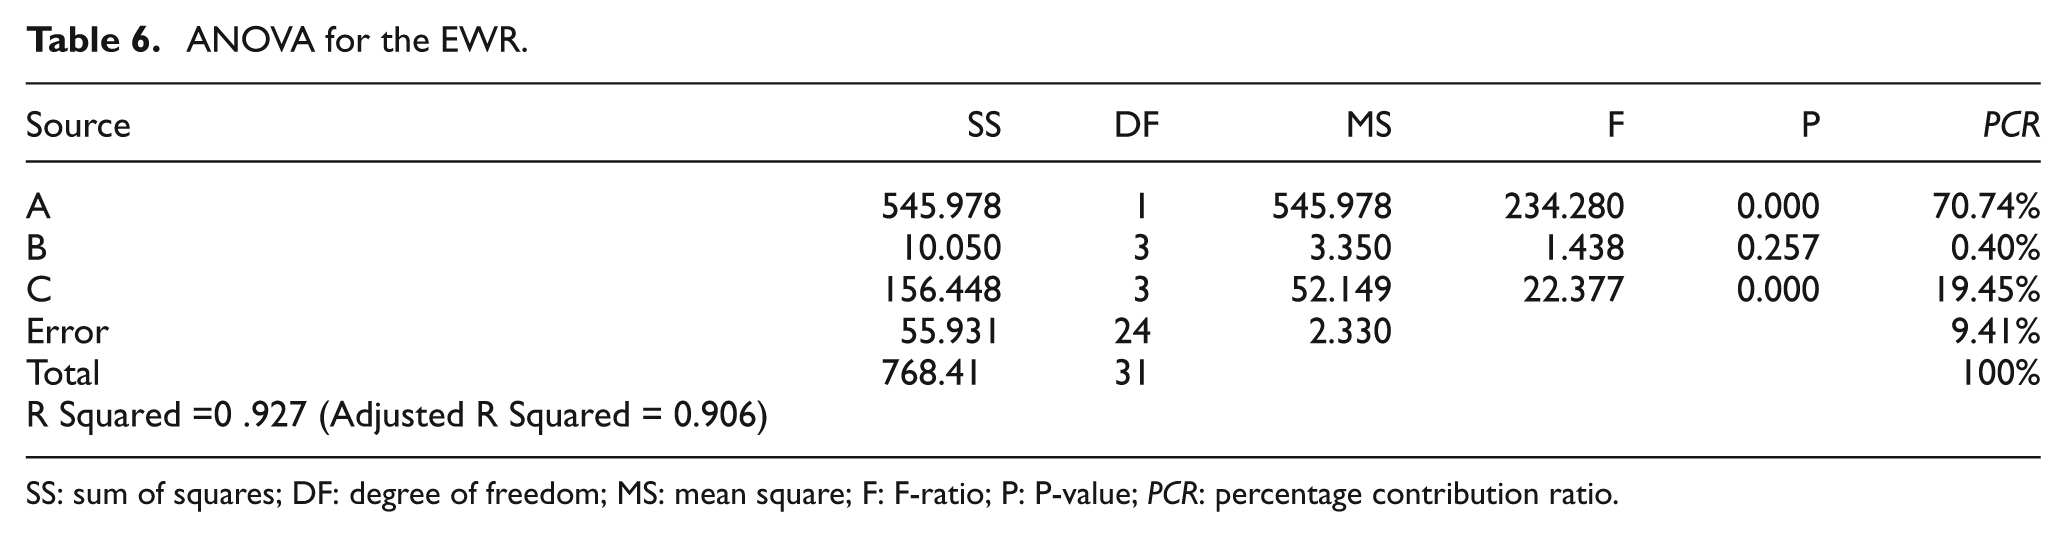
SS: sum of squares; DF: degree of freedom; MS: mean square; F: F-ratio; P: P-value; PCR: percentage contribution ratio.
ANOVA for the R a .
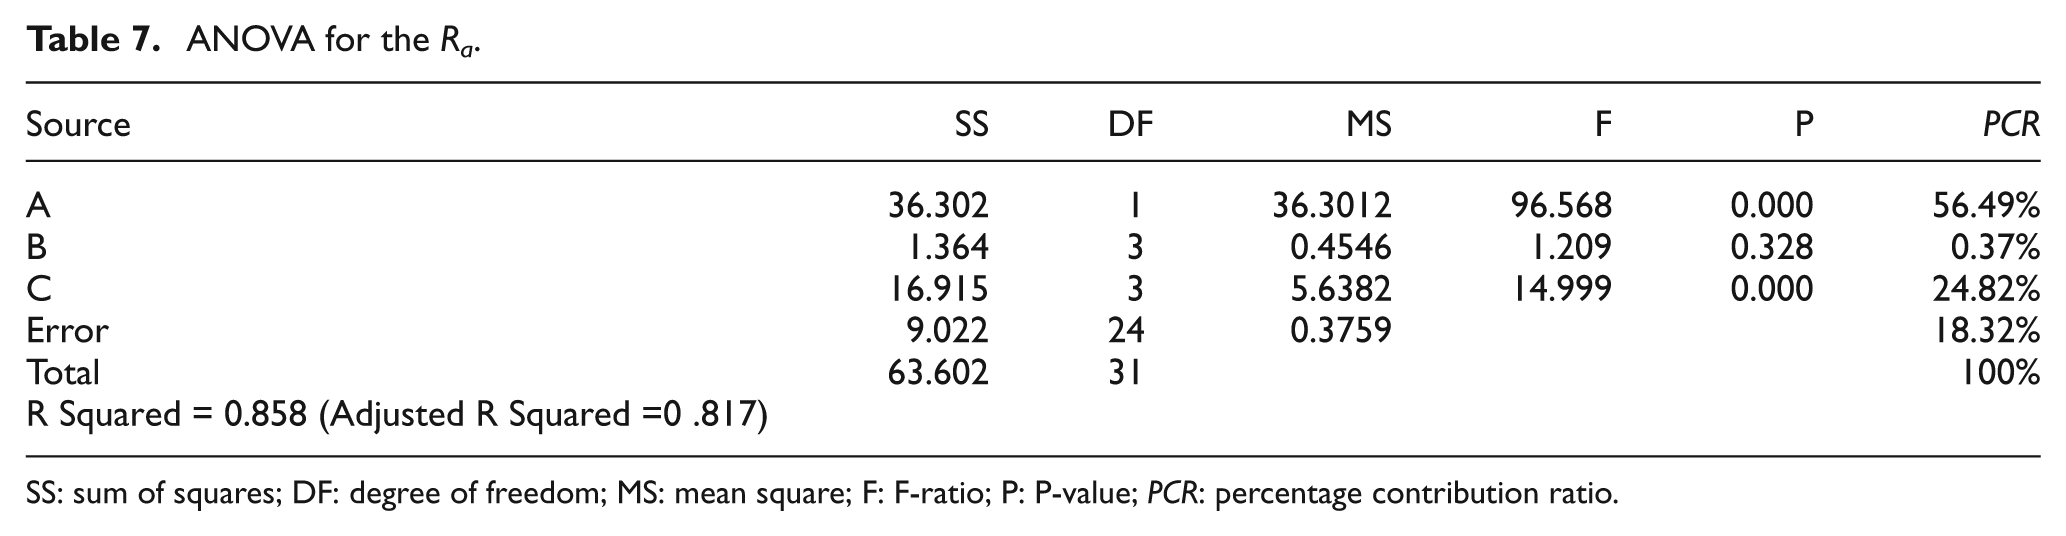
SS: sum of squares; DF: degree of freedom; MS: mean square; F: F-ratio; P: P-value; PCR: percentage contribution ratio.
Taguchi optimization
Table 8 shows experimental and S/N ratio results according to the L32 orthogonal experimental design. The S/N response values calculated by equation (3) for the MRR are shown in Table 9. Based on the results of the S/N ratio responses, the optimal EDM parameters for the better MRR were obtained as the dielectric medium at Level 1 (oil), the pulse on/off time at Level 2 (40 µs) and the working current at Level 4 (25 A). For the EWR and R a , the S/N response values calculated by equation (4) are shown in Tables 10 and 11, respectively. The optimal EDM parameters for the better EWR were obtained as the dielectric medium at Level 2 (deionized water), the pulse on/off time at Level 3 (60 µs) and the working current at Level 1 (10 A). For the better R a , the optimal EDM parameters were obtained as the dielectric medium at Level 2 (deionized water), the pulse on/off time at Level 1 (20 µs) and the working current at Level 1 (10 A). The absolute values of the main effects were also determined in Tables 9, 10 and 11 by finding the difference between the absolute values for levels 1 and 2 (in the case of factor, dielectric medium), and for levels 1 and 4 (in the case of factors, pulse time and working current), levels having minimum and maximum measures. The larger value of the main effect, the greater is the influence that the related factor has on the response. It can be seen that the factor C (working current) has the strongest effect on MRR and Ra responses while the factor A (dielectric medium) on EWR response. These results are parallel to the results of ANOVA. As determined in the ANOVA analyses, in fact, the variation of the pulse duration is negligible in terms of EDM performance in machining of the beryllium–copper alloy. However, it can be inferred that the highest working current and oil as a dielectric fluid should be preferred for the optimum MRR of the beryllium–copper alloy. The reason for this behavior is straightforward, as shown previously in numerous studies. When the working current is increased, more energy is supplied to the machining process, and therefore, more material is removed. It seems that an oil medium also has positive effects of concentrating the discharge channels and the discharge energy owing to its possible higher flash point, higher insulation capability and higher density. 1 However, the high temperature of the plasma channel causes decomposition of the oil generating carbon, which will increase the debris concentration. On the contrary, using the lowest working current and deionized water as a dielectric fluid should be preferred to achieve the optimum EWR and R a in the EDM of the beryllium–copper alloy. It seems that deionized water has more proper viscosities and high flowing rate, which facilitates the flushing away of the discharge products and thus improves the surface quality remarkably. Another reason is that conductivity of the deionized water is low and thus the debris concentration remains low. 16 Similar results were also reported previously, 17 relating to a shorter ignition time of deionized water.
Experimental design with L32 orthogonal array and experimental and S/N response results for different factors.
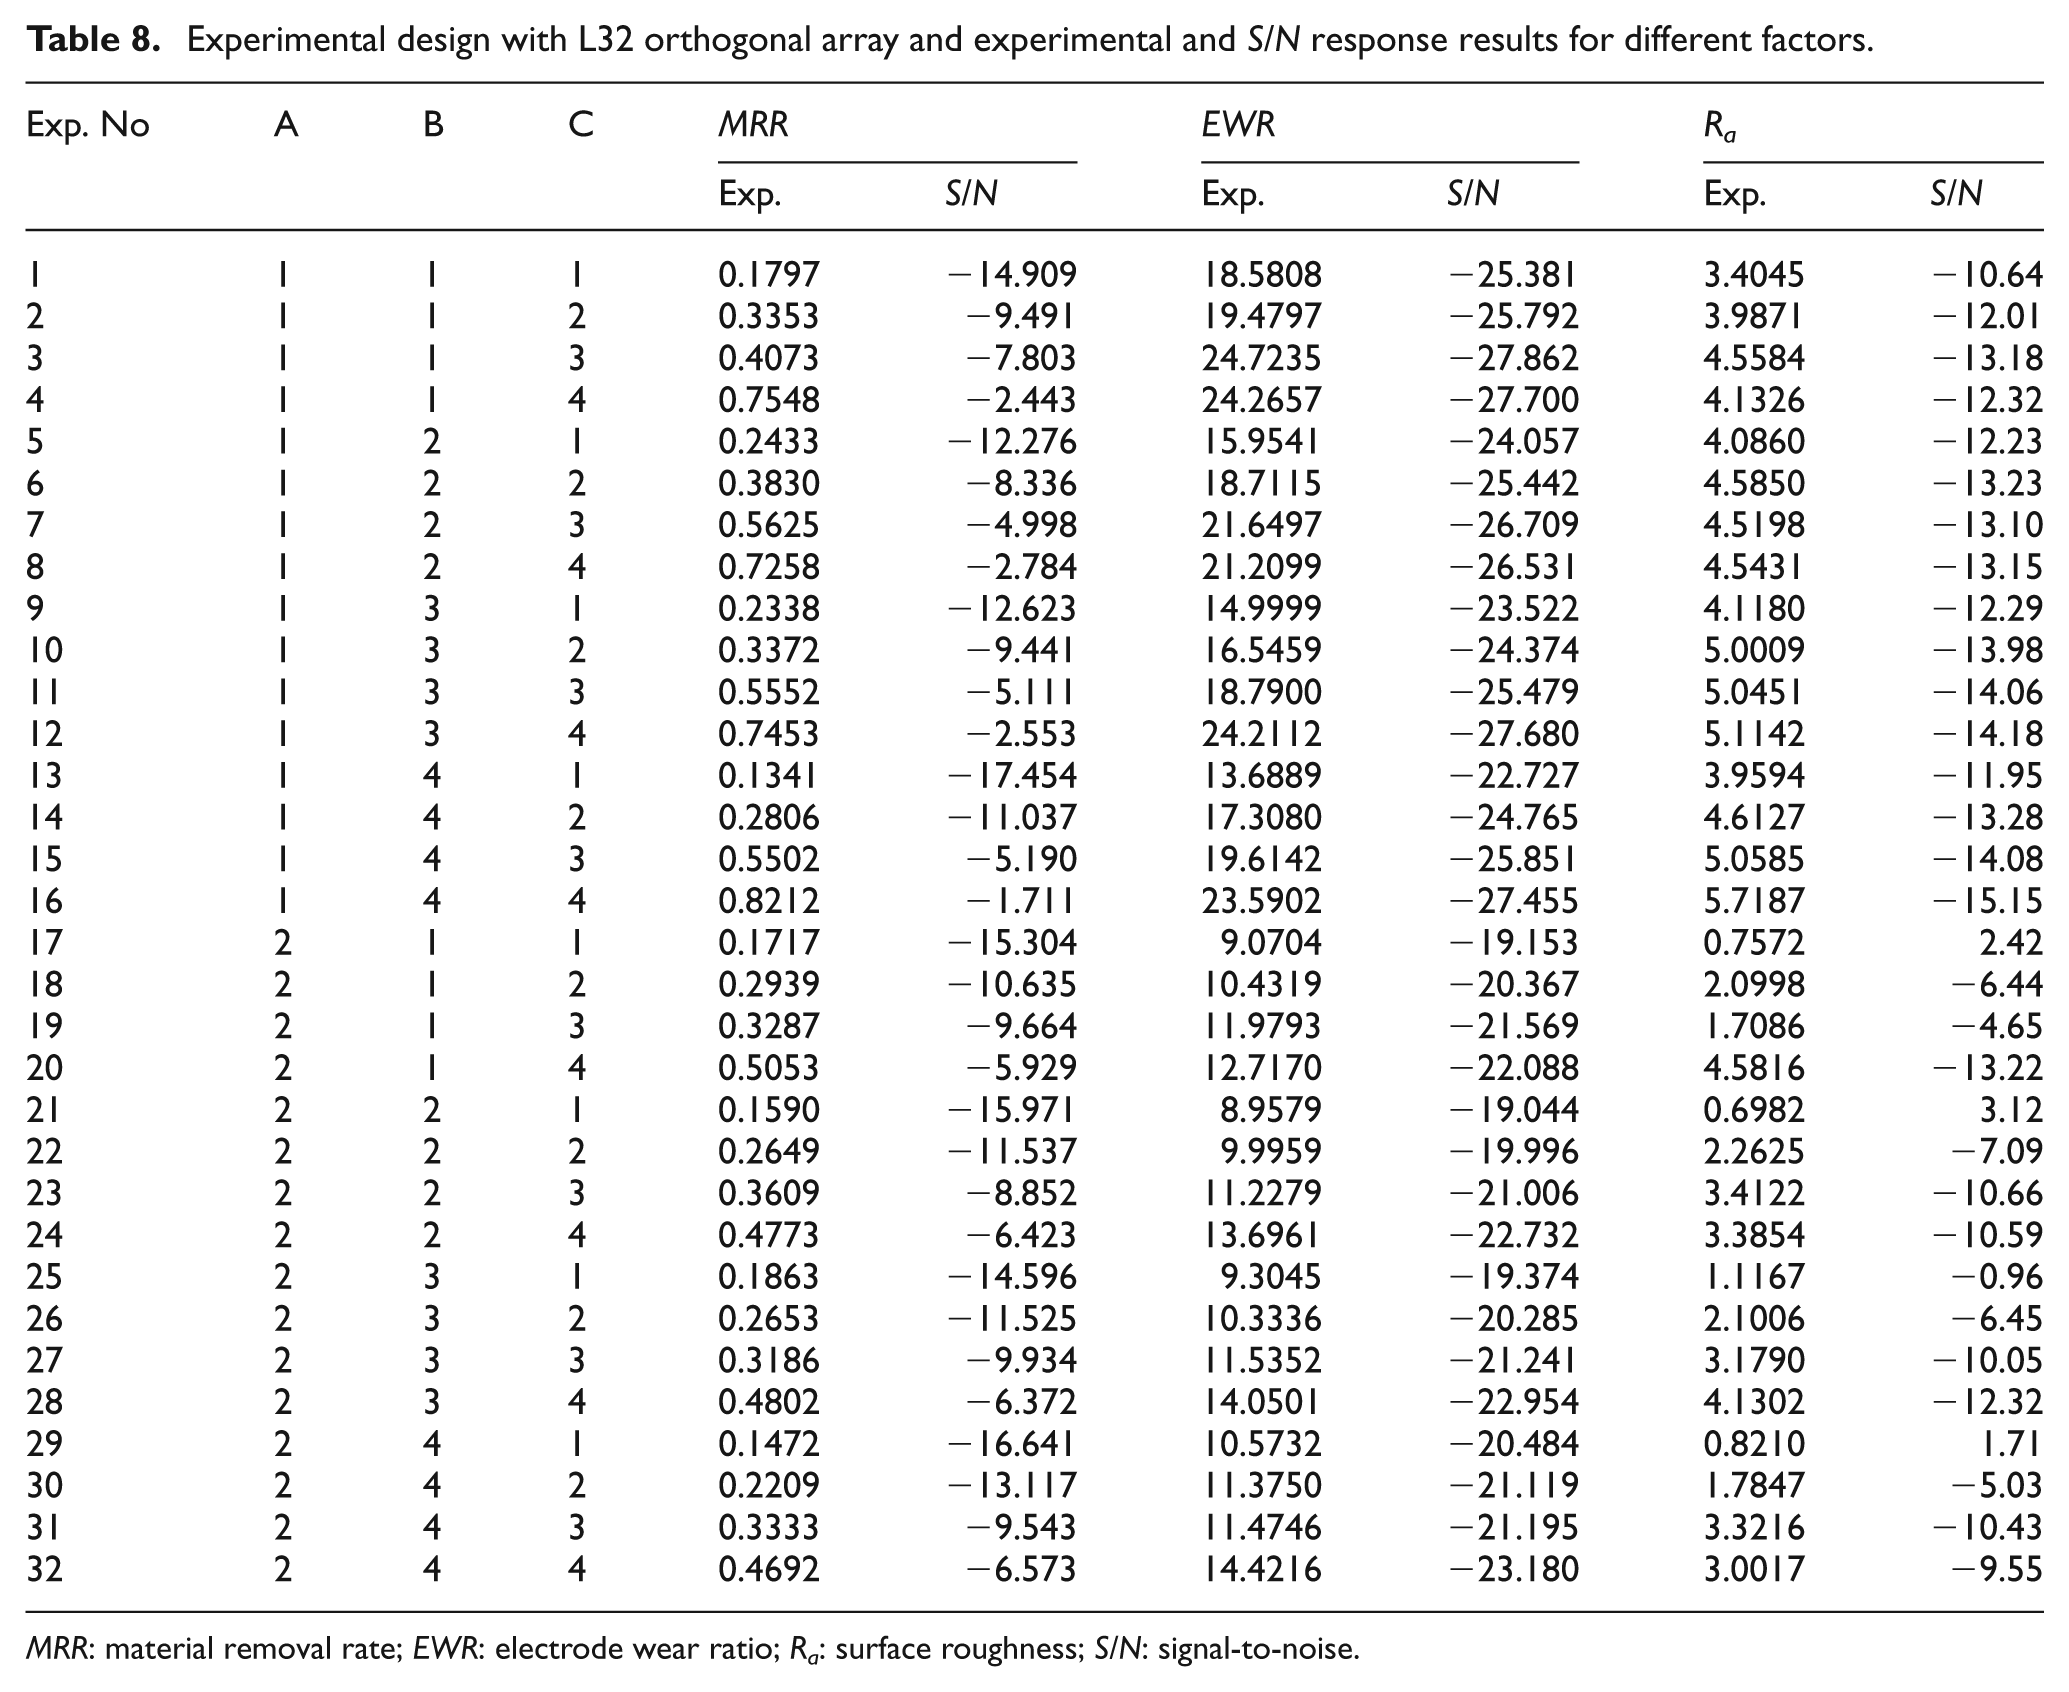
MRR: material removal rate; EWR: electrode wear ratio; R a : surface roughness; S/N: signal-to-noise.
S/N response table for MRR.
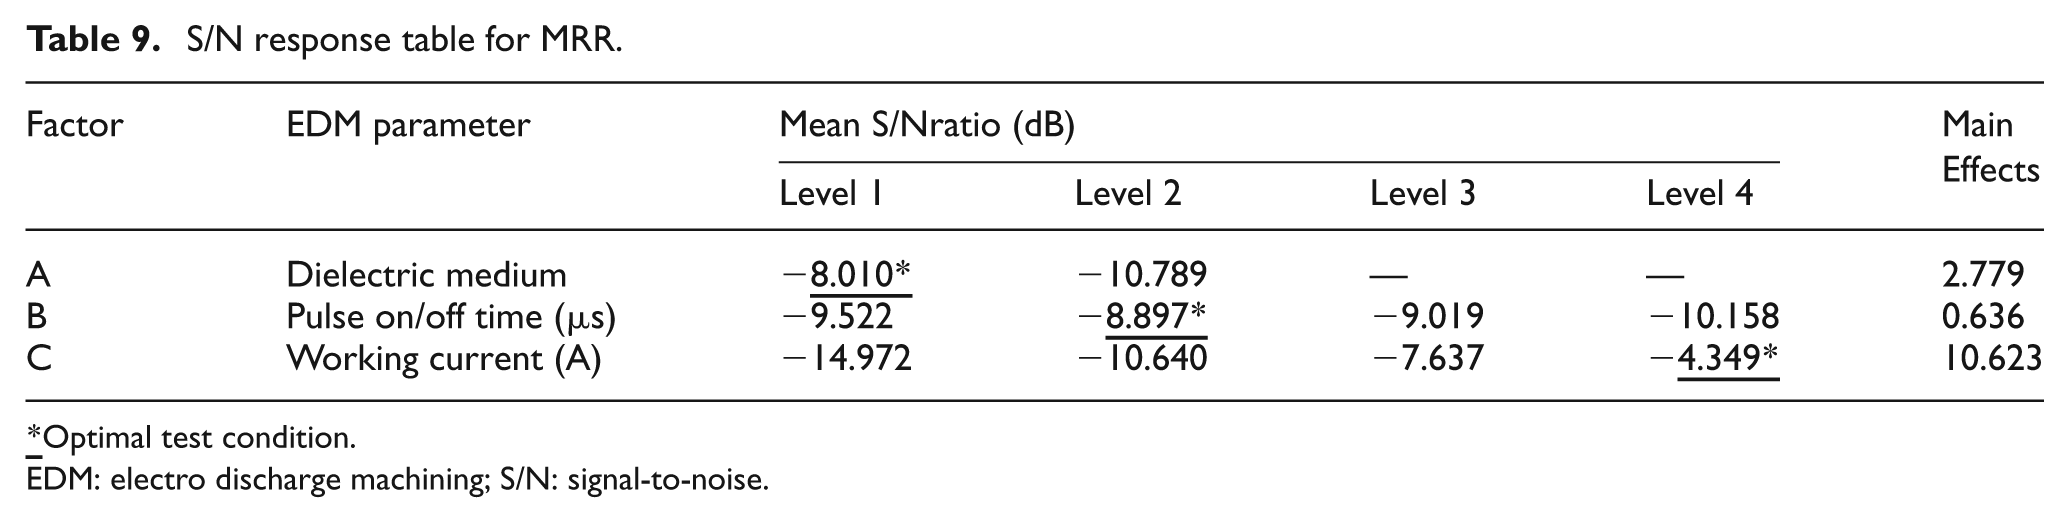
Optimal test condition.
EDM: electro discharge machining; S/N: signal-to-noise.
S/N response table for EWR.
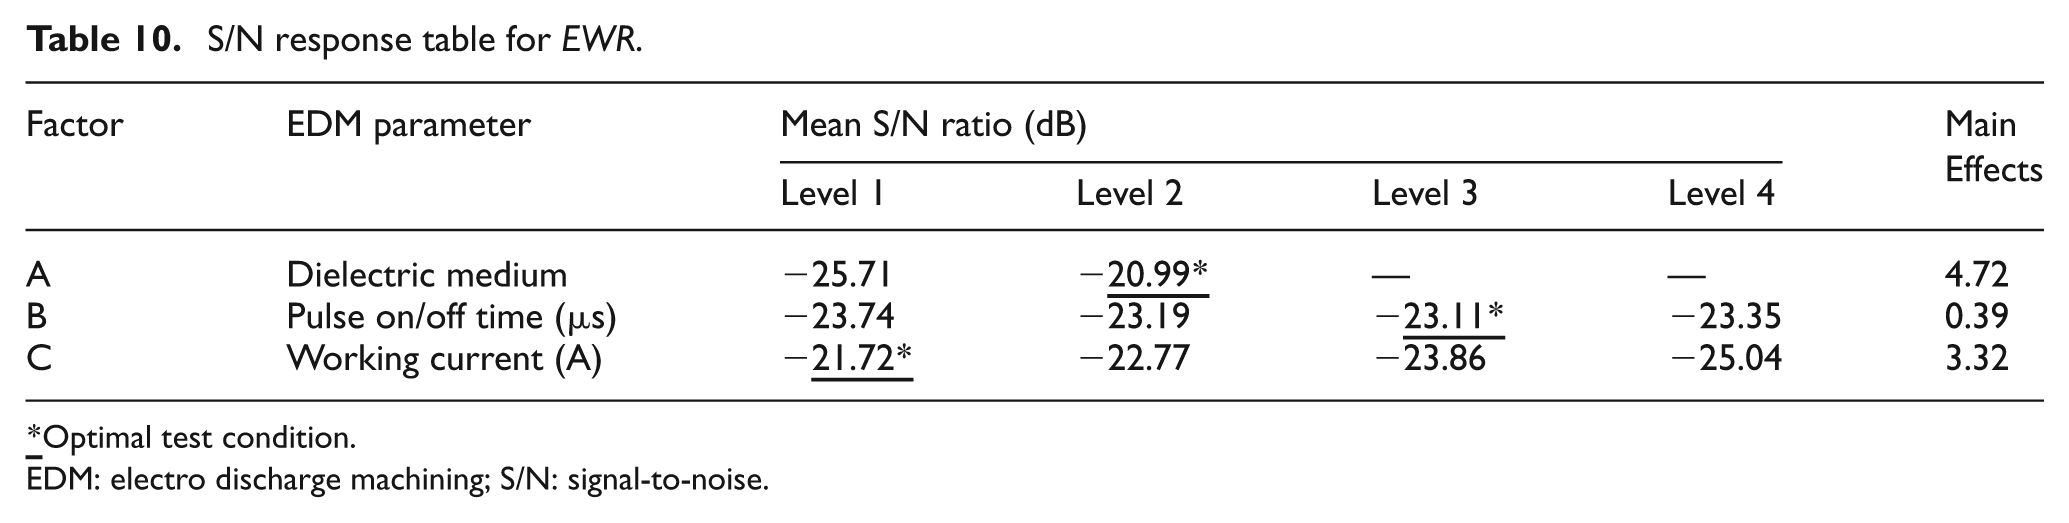
Optimal test condition.
EDM: electro discharge machining; S/N: signal-to-noise.
S/N response table for R a .
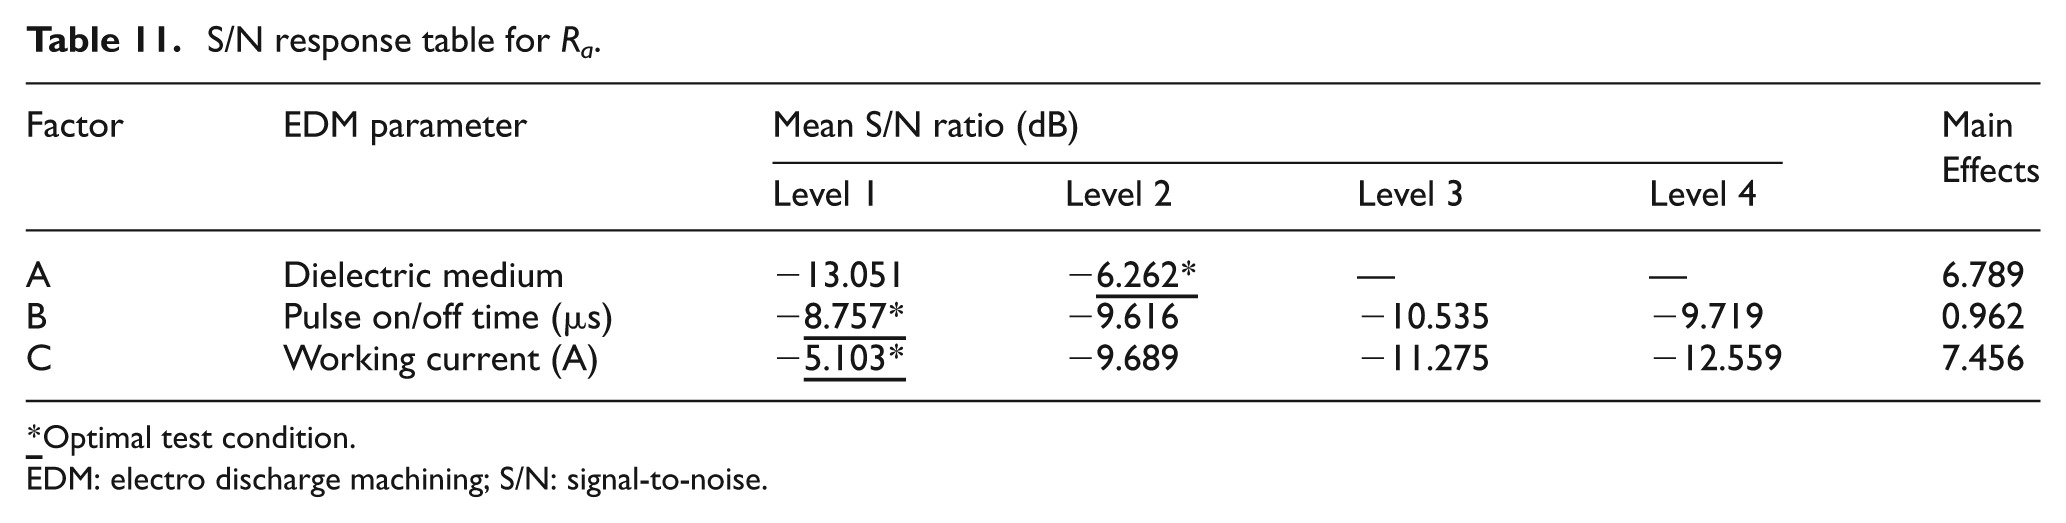
Optimal test condition.
EDM: electro discharge machining; S/N: signal-to-noise.
Confirmation tests for Taguchi optimization
A confirmation test is the final step of Taguchi’s approach for verification of the results. Optimal test conditions are determined for the significant factors and a selected number of experiments are carried out regarding those test conditions. The average results of the repeated tests are compared with the predicted results of the tested levels. The purpose of the confirmation experiments is to validate the optimum test conditions suggested by the experiment corresponding with the predicted value. In this study, confirmation tests were performed by utilizing levels of the optimal process parameters for MRR (A1B2C4), EWR (A2B3C1) and R a (A2B1C1) in EDM of the beryllium–copper alloy. Those experiments were repeated twice to reduce possible errors and the means of these results were used for the evaluation. Results were shown in Tables 12–14, respectively. The confirmation test for the MRR resulted in response values of 0.707308 mm3/s and 0.661953 mm3/s, 6.380979% and 9.368718% for EWR, and 0.9728 µm and 0.5804 µm for R a . The 95% confidence interval of the confirmation experiments can be computed by using equations (12) and (13)
Confirmation test for MRR.
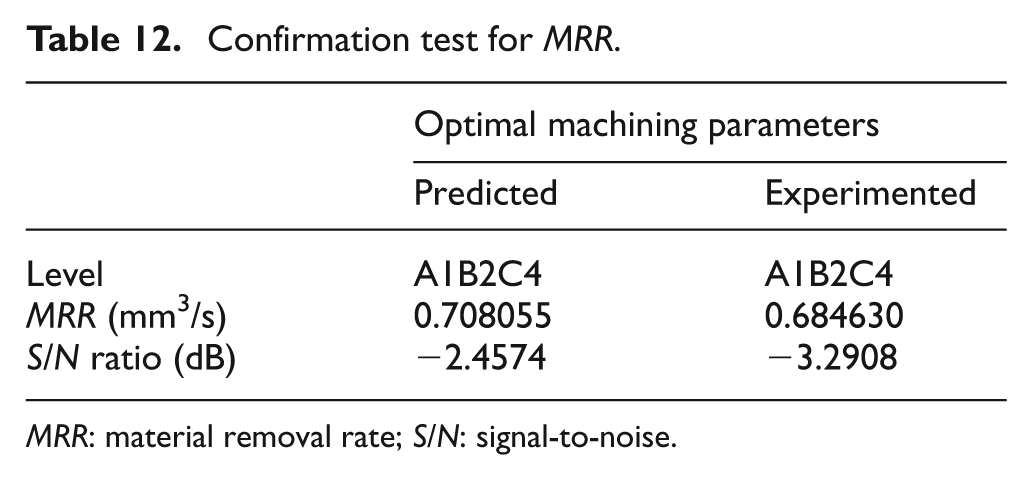
MRR: material removal rate; S/N: signal-to-noise.
Confirmation test for EWR.
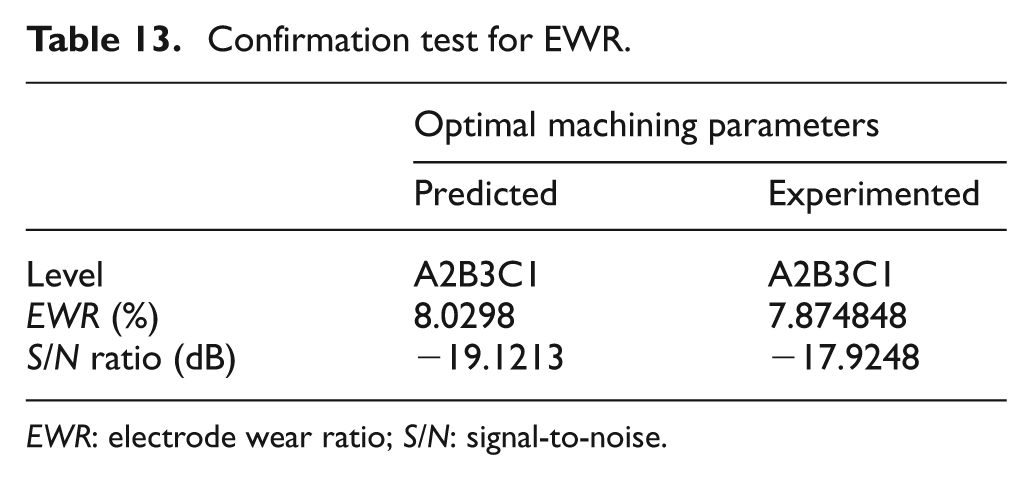
EWR: electrode wear ratio; S/N: signal-to-noise.
Confirmation test for R a .
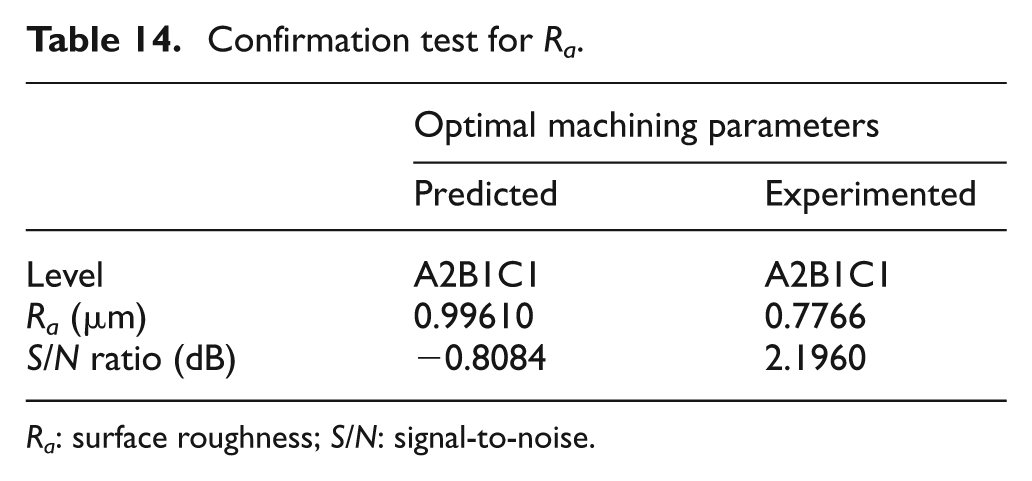
R a : surface roughness; S/N: signal-to-noise.
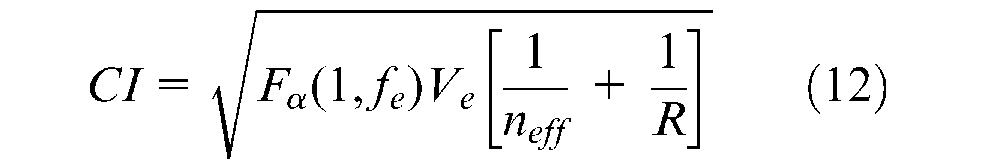

where F α (1, f e ) is the F-ratio at a confidence level of (1–α) against the degree of freedom 1 (tabulated F0.05(1, 24), the value for MRR, EWR and R a responses is 4.2597), f e is the degree of freedom for error, V e is error mean square or error variance, R is the sample size or number of confirmation experiments, n eff is the effective total number of tests, N is the total trial number in the OA and f t is the total degree of freedom in the estimation of means response (µ). The confidence interval (CI) at 95% has been determined as ±0.121 for MRR, ±2.728 for EWR and ±1.096 for R a . Hence, the predicted optimum MRR is 0.587 < µ MRR < 0.829, EWR is 5.302 < µ EWR < 10.758, and R a is −0.099 < µ Ra < 2.092. In a different manner, prediction error for MRR (0.023 mm3/s) is within the confidence interval value of ±0.121 mm3/s, for EWR (%0.155) is within the confidence interval value of ±%2.728, and for R a (0.219 µm) is within the confidence interval value of ±1.096 µm. Two confirmation experiments were conducted at the optimum levels of the process responses. The mean values of MRR, EWR and R a at the optimal setting of the process responses were found to be within the confidence interval of the predicted optimal of quality characteristics. Therefore, the optimum factor level combination and predictive model for the factor effects in these experiments are valid.
Grey relation analysis
Grey relation analysis results were given in Table 15 with the grey relational coefficients, the grey relational grades and their ranks for each experiment. The highest grey relational grade indicates that the related experimental results are the best among the multiple performance characteristics. Therefore, experiment 21 (A2B2C1), in which deionized water was used as the dielectric medium, 40 µs pulse duration and 10 A working current were used, has the highest grey relational grade value and thus that experimental condition has the best multiple performance characteristics among all experiments according to this analysis.
Grey relational coefficient, grey relational grade and rank for each experiment.
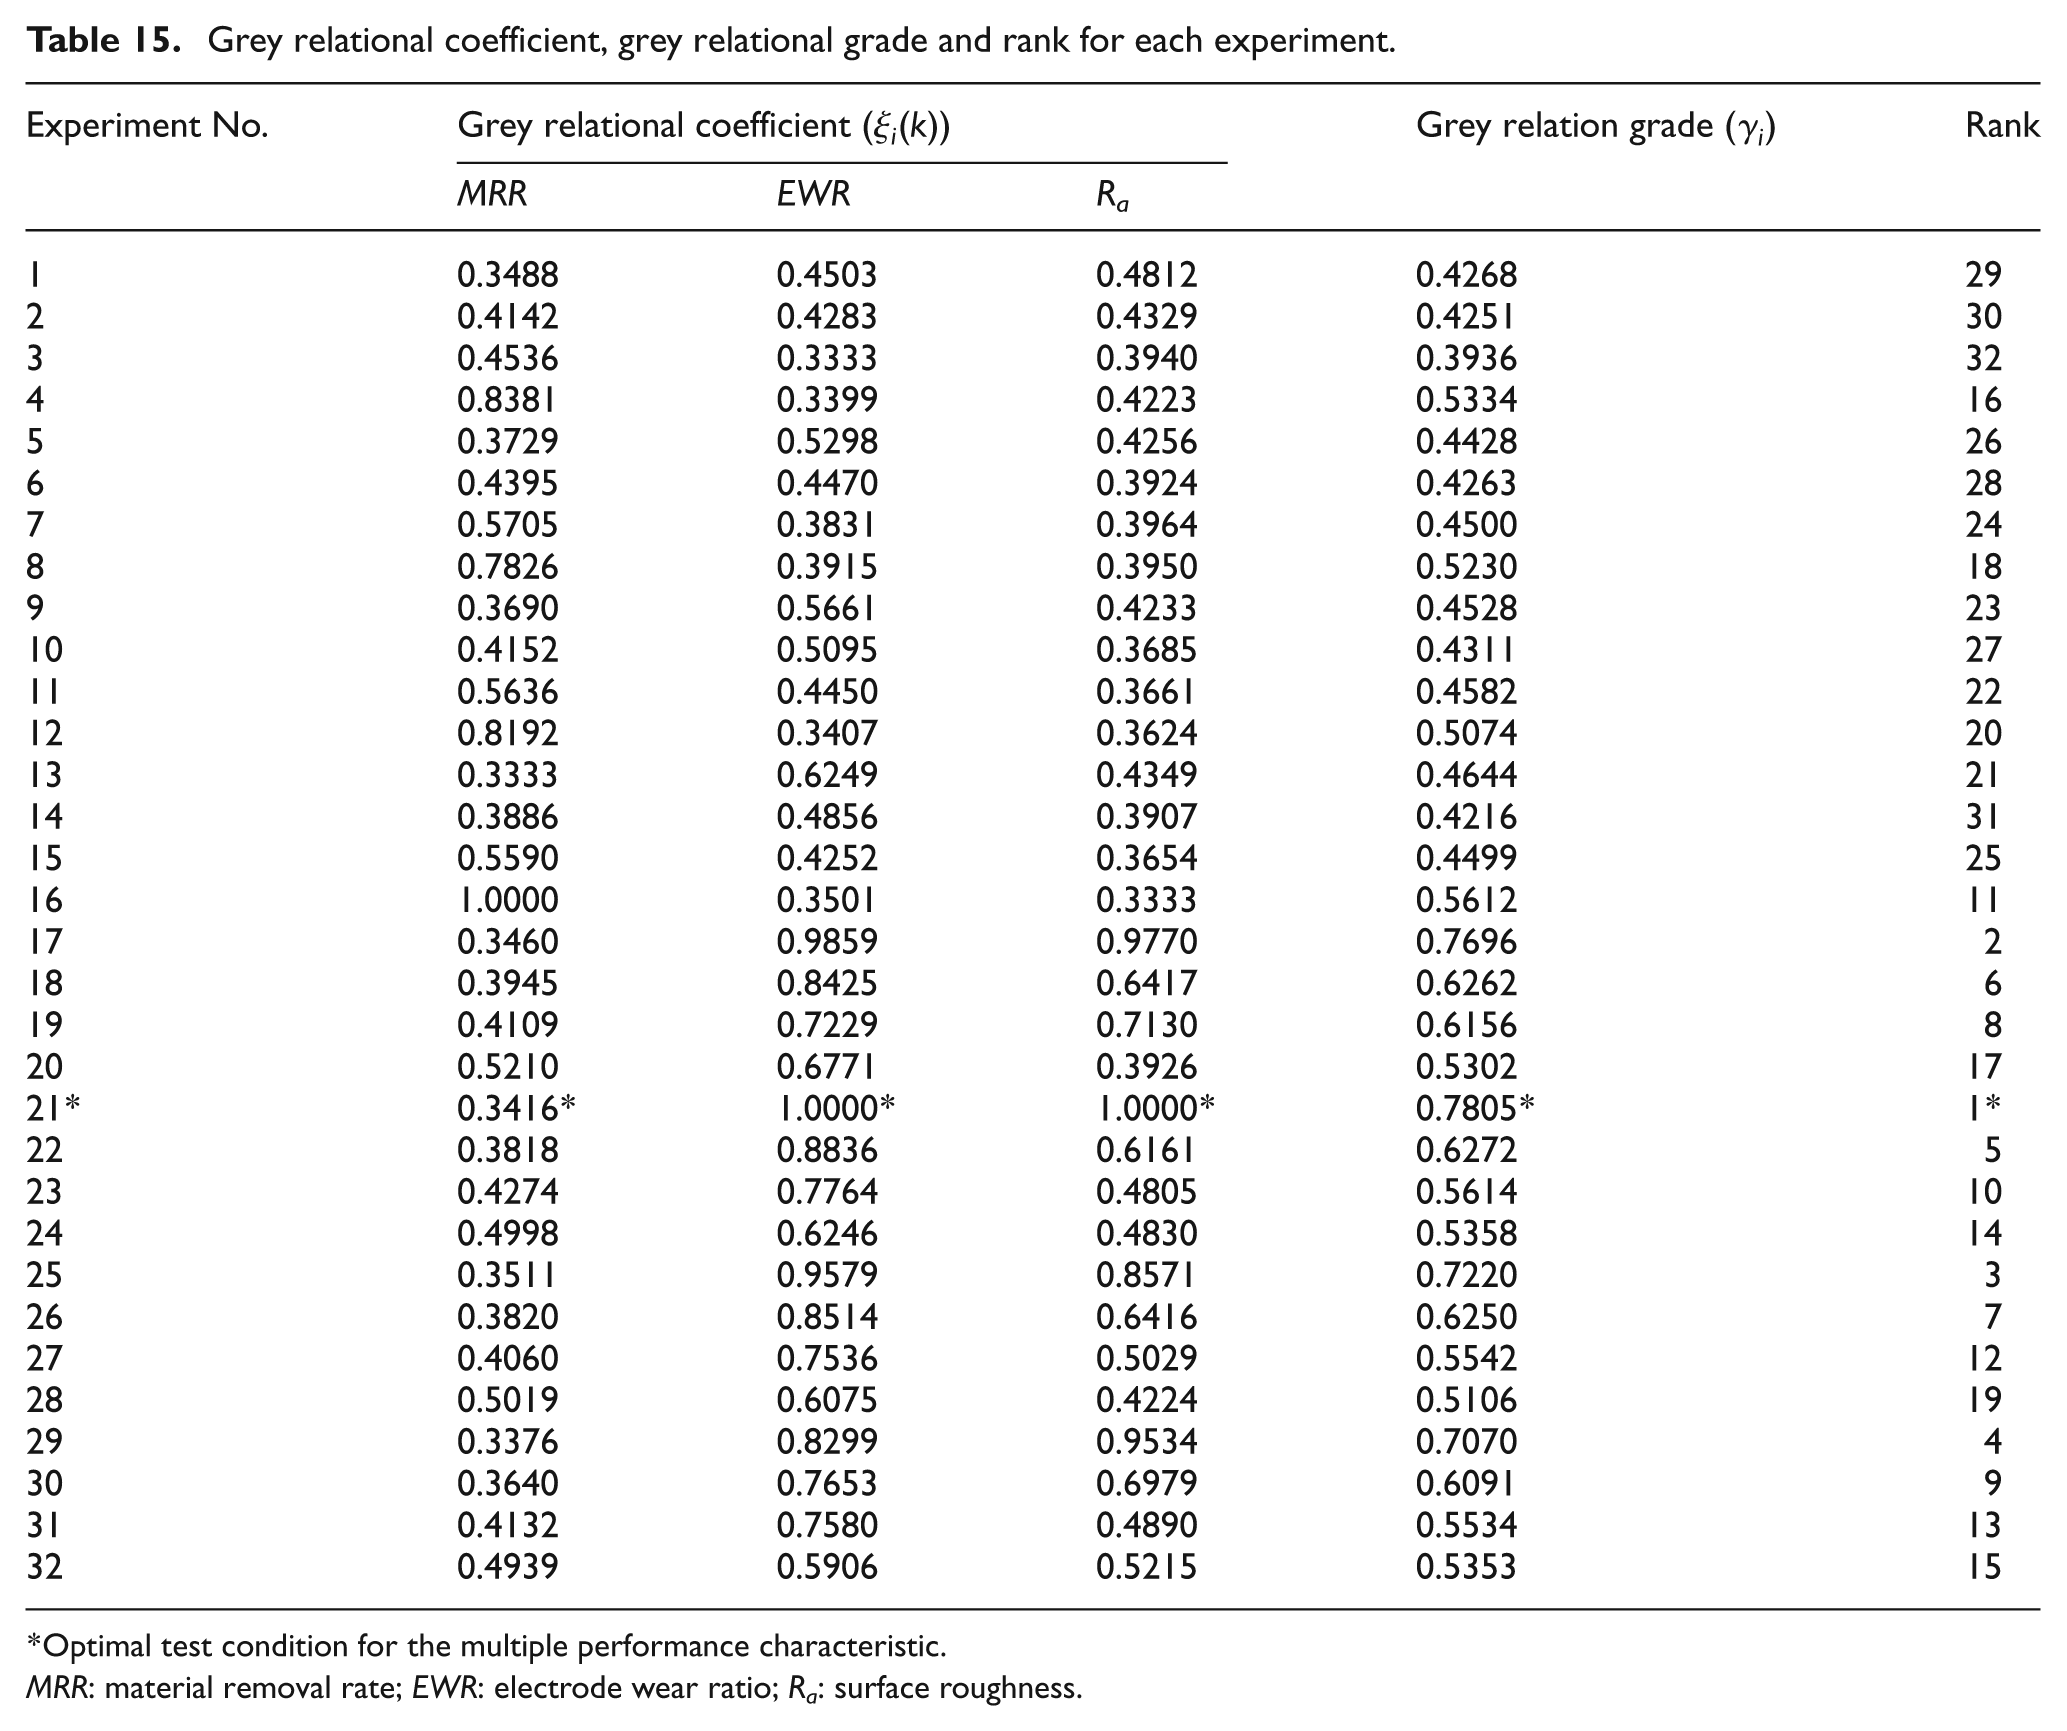
Optimal test condition for the multiple performance characteristic
MRR: material removal rate; EWR: electrode wear ratio; R a : surface roughness.
Response surface methodology for grey relational grade
A grey relational grade can be mathematically modeled and graphically expressed by response surface methodology to predict and to see its response dispersion depending on the dielectric medium and the working current variations. Pulse duration was neglected in these analyses owing to its insignificant effect on the EDM performance for machinability of beryllium–copper alloy. The objective of response surface methodology is not only to see the response dispersion over the graphical space, but also to determine the dense regions where the response reaches its optimal value. Generally, a second-order polynomial regression model, also called the quadratic model as expressed in equation (14), is utilized when the response function is unknown or nonlinear
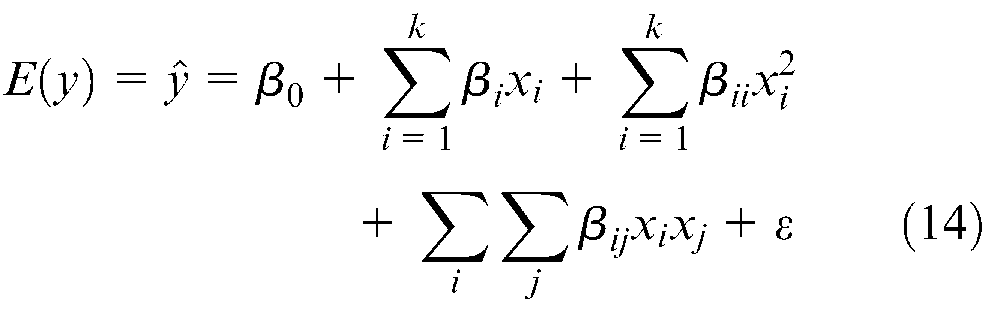
where E(y) is the expected response, ε represents the noise or error observed in the response y and β is the coefficient that can be calculated by means of using the least square method. 18 Thus, the second-order estimated response surface representing the grey relational grade (GRG) can be expressed as the following statistically adequate function (equation (15)) for EDM parameters, the working current (I A ) and dielectric medium (M d ) with regression coefficients and coded units
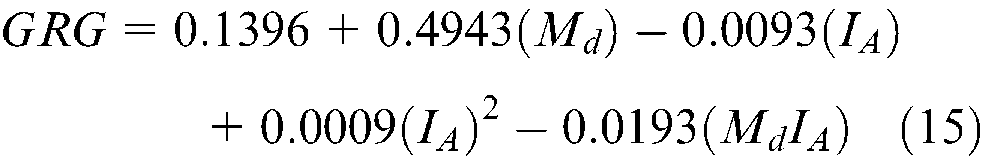
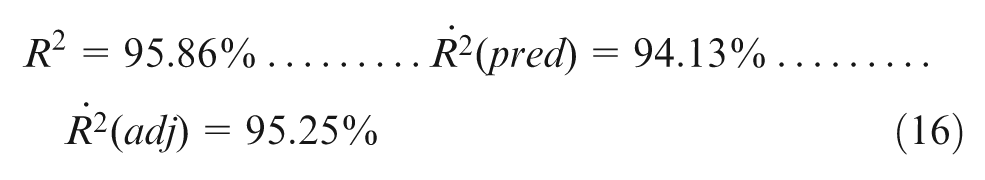
Equation (16) proves that the developed model can predict 95.86% of the variance for grey relational grades. In that equation, all coefficients of determination (R
2
, adjusted R
2
and predicted R
2
) are relatively high and close to each other, indicating that the model fits the data very well and has adequate predictive ability. Supplementally, Table 16 shows ANOVA for the full quadratic model in linear terms, the squared terms and the interactions of the terms. The small P-values of these terms (0.000) and the P-value for lack of fit (0.314) suggest that this model adequately fits the related grey relational grade data. Figure 5 shows normal distribution plots of residuals from the model. It can be seen that although there is a large AD (Anderson-Darling statistic) test value (1.204) and a small P-value (
ANOVA for the developed model.
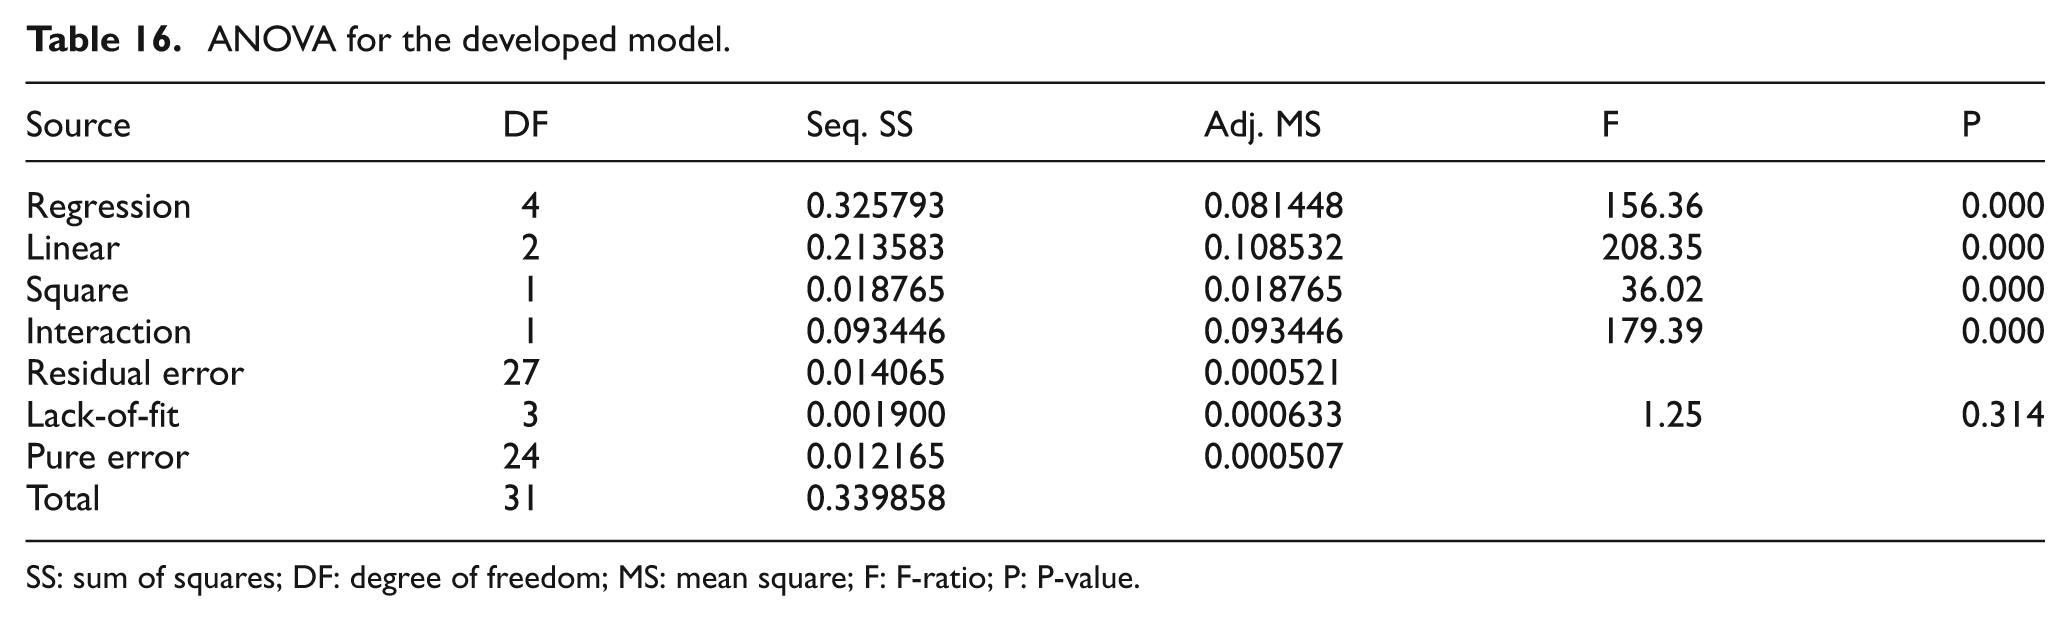
SS: sum of squares; DF: degree of freedom; MS: mean square; F: F-ratio; P: P-value
Estimated regression coefficients for predicted grey relational grades.
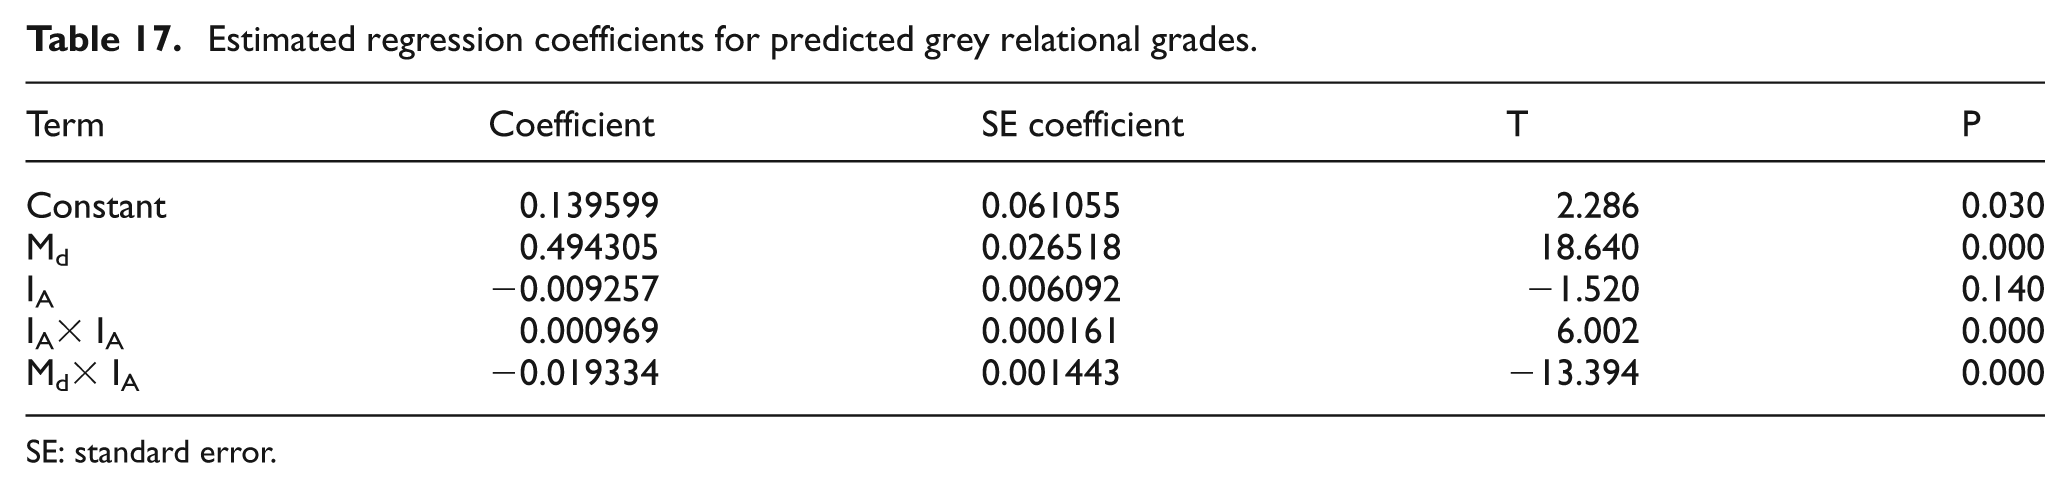
SE: standard error.
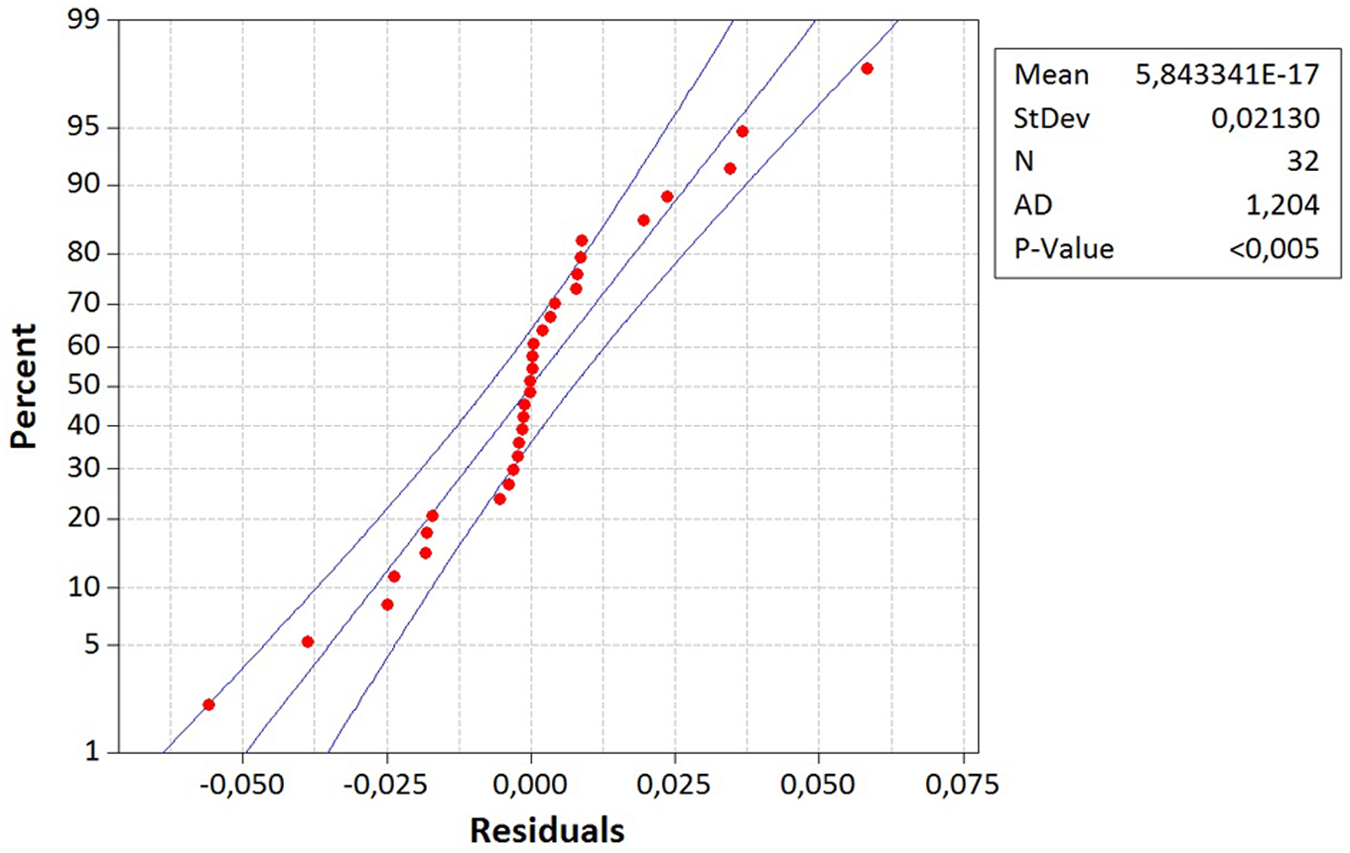
Normal distribution plot of residuals for grey relational grade.
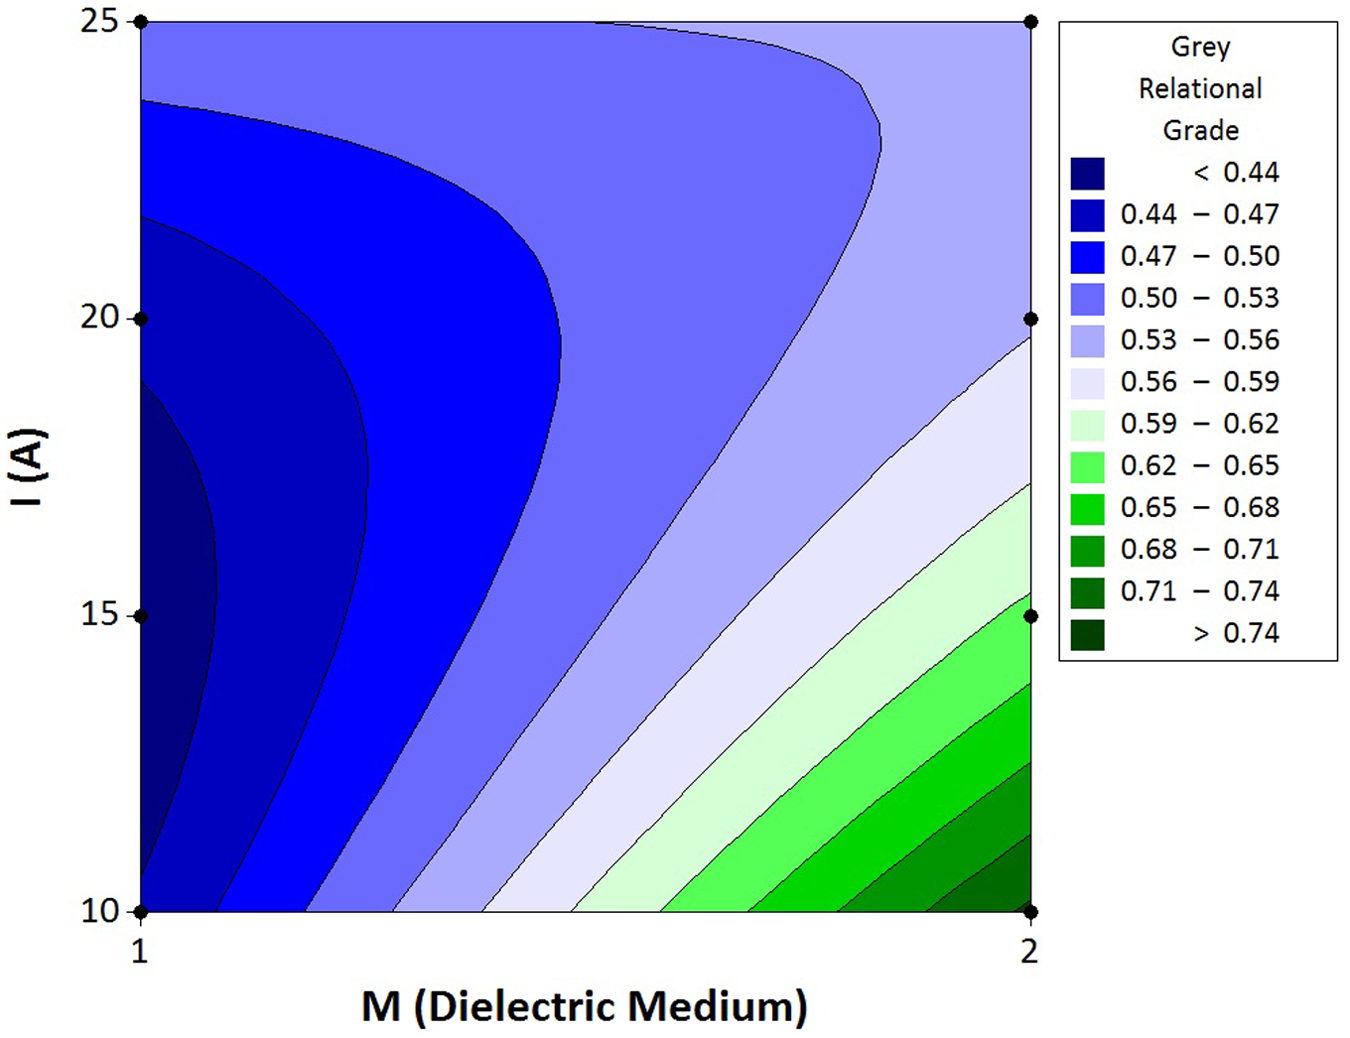
Grey relational grade contours in the working current and the dielectric medium (1: oil; 2: deionized water) planes.
Conclusions
The machinability of a beryllium–copper alloy by EDM has been investigated experimentally and statistically analyzed under different machining conditions with copper electrodes. ANOVA has been used to determine the importance of each EDM factors, the dielectric fluid, the pulse duration and the working current depending on the MRR, EWR and R a results. Experimental results have been optimized by Taguchi’s OA to find the optimal EDM parameters for each factor respectively. Multiple optimizations have been performed by grey relational analysis. Determined grey relational grades have been modeled and predicted by response surface methodology. The following conclusions regarding the machinability of beryllium–copper alloys can be drawn from this study.
While the working current is the most effective factor for the MRR, the dielectric medium is the dominant parameter in terms of EWR and R a . The pulse duration was found to be a negligible factor.
Using oil as the dielectric medium, a medium level pulse duration (40 µs) and the largest working current (25 A) should be preferred for achieving highest MRR.
Using deionized water as the dielectric medium, a higher level pulse duration (60 µs) and the smallest working current (10 A) should be preferred for the lowest EWR
Using deionized water as the dielectric medium, a lower pulse duration (20 µs) and the smallest working current (10 A) should be preferred for the lowest R a
Using deionized water as the dielectric medium, a medium level pulse duration (40 µs) and the smallest working current (10 A) should be preferred regarding multiple performance and optimal MRR, EWR and R a results.
The developed second-order response surface model to predict the optimal EDM performance via grey relational grade can be used effectively in EDM of beryllium–copper alloys within 95% confidence intervals.
The optimal machinability characteristics of the beryllium–copper alloy by EDM has been determined and modeled with the help of statistical and optimization techniques. It was found that the dielectric medium type is considerable as much as the working current for the machinability of beryllium–copper alloys.
Footnotes
Appendix 1
Appendix 2
Funding
This research received financial support from the NSF [grant number CMMI-0928873, and CMMI-0728294].