
Abstract
In this article, an attempt has been made to optimize the selected input process parameters for material removal rate (MRR), average surface roughness (Ra) and average circularity (Ca) of the hole made by electrical discharge machining in a nickel-based superalloy material especially used in aerospace applications. The concept of twist drill is introduced by attaching a self-developed setup on sinking an electrical discharge machining machine by replacing the actual tool holder of the electrical discharge machining machine and terming it as electrical discharge drilling. Also application of an altogether new approach of hybrid methodology comprising the Taguchi methodology coupled with response surface methodology for modeling and response surface methodology coupled with principal component analysis–based grey relational analysis for multiobjective optimization of process parameters is used. In this application of hybrid methodology, at the first stage, optimum level of process parameters is determined by the Taguchi methodology and used as the central value in response surface methodology for developing the second-order response model, and at the second stage, taking the reference of developed central composite rotatable design matrix of response surface methodology model, grey relational analysis with principal component analysis is applied to determine the grey relational grade for further determination of the optimum level of process parameter. It is observed that with the use of present hybrid approach in this experimental study, an appreciable improvement in MRR by 82.27%, Ra by 39.28% and Ca by 25.00% is achieved, which confirm the viability of using it with future scope for researchers.
Keywords
Introduction
Aerospace manufacturing industries are facing the great challenge of frequent change in the existing manufacturing processes, and these changes are the consequence of development of new engineering materials meant to sustain and maintain their desired design characteristics in all weather and frequent varying operating conditions. These materials possess high values of hardness, toughness, fatigue strength, resistance against corrosion, chemical degradation, creep and wear resistance and so on even at sustained elevated temperature for a quite long duration of operating time. These materials are superalloys, titanium alloys, metal matrix composites, sialon, aluminum oxide–titanium carbide and so on and at present these are commonly known as advanced engineering materials. Since advanced engineering materials possess the aforesaid properties, they pose challenges to conventional machining in the form of frequent tool failure and producing inaccurate geometry with poor surface finish. This not only results in difficult, costlier and time-consuming machining processes, in few cases, it is not even viable.
Lightness in weight, ease of manufacture and ease of post-maintenance during service use are the major factors that are given due consideration while designing the aerospace vehicle and its associated components. To accomplish these aforesaid requirements, the aerospace components are provided with holes of large aspect ratio, connecting channels and grooves with intricate shape through which fluid of combustion, hydraulics and compressed air is made to flow. In most of the cases, these holes are made with conventional twist drills wherever feasible and possible but where cutting (conventional twist drills) machining surrender, unconventional machining processes make entry. In general, to off-set the difficulties of cutting machining processes, many erosive machining processes (EMPs) such as electrical discharge machining (EDM), electrochemical machining (ECM), beam machining processes (BMPs), jet machining processes (JMPs), ultrasonic machining (USM) and so on have been developed and extensively used in industries1,2 under the terminology of advanced machining processes (AMPs). 3
EDM, a thermal energy–based AMP, is extensively used for making large aspect ratio holes in advanced materials and particularly in inaccessible areas of complex designed components. In this machining, high-frequency sparks are generated between anode and cathode electrodes. Here, workpiece and tool are made as anode and cathode, and the polarity of electrodes are decided based on the properties of workpiece material. These electrodes are submerged in dielectric fluid, which intensifies the spark energy into the confined space between tool electrode and work specimen known as inter electrode gap (IEG). In EDM, a series of high-frequency discrete electrical discharge is produced in the IEG, which melts the materials from workpiece as well as from tool electrode. These molten materials are removed by effective flushing in debris form. At present, in aerospace manufacturing industries, EDM is proven to be an inescapable substitute of cutting machining for making holes and channels and so on, but at the same time it also produces undesirable features on machined surface such as formation of micro cracks of thermal infested layers and so on. During EDM, temperature of sparks is between 8000 °C and 20,000 °C, which produce fumes and toxic smokes in dielectric fluid. These toxic smokes sneak into the surrounding atmospheres and are very harmful to operator as well as to environment. 4
Many authors have experimented to improve the production rate and quality of machined surface in EDM using tool electrodes of different materials and with suitably controlling the density of electrical discharges.5,6 Use of tool electrode prepared by powder metallurgy has also been reported in EDM, in which the tool worked as feed stock and alloyed with machined surface to produce improved machined surface. 7 Some authors have introduced rotation into the tool electrode of sinking EDM machine as of similar to conventional twist drill and termed it as electrical discharge drilling (EDD). With EDD, they were successful in making of large aspect ratio holes in advanced engineering materials along with improvement in MRR and surface finish. In this context, Jeswani 8 is the first who drilled holes of small diameter ranging between 0.19 and 0.71 mm in carbon steel with a tool electrode of copper wire. Jain 9 drilled precision blind holes in carbon steel using rotary EDM and analyzed the impact of the input process parameters of pulse time, tool electrode diameter and depth of penetration. Soni 10 used sinking EDM as well as rotary EDM and drilled holes in titanium alloy. He used tool electrode of tungsten copper for drilling the holes and compared the results of both machining. Mohan et al. 11 with hollow tubular electrode drilled holes in Al-SiC metal matrix composite with rotary EDM and confirm that MRR, Ra and tool electrode wear (TEW) improve as a result of effective flushing induced by tool rotation. Some authors have also utilized the concept of cooling of the tool electrodes and they found better results in terms of TEW. 12,13 Kuppan et al. 14 have drilled holes in Inconel 718 with 99.9% tubular copper electrode and find that MRR and Ra improve due to effective dielectric flushing. The authors have also used additives in dielectric fluid in EDM machining and claim better MRR and Ra.15,16 Water mixed dielectric has been reported in EDM to reduce the toxic threats arising due to de-composition of dielectric fluid as a result of high temperatures of sparks. 17
The use of single approaches for optimization of input process parameters can be traced back to 2000 and these are still continued. However, after year 2000, a new trend of using different hybrid approaches for optimization of various machining processes has been found at increased rate. In this series to mention, Lin et al. 18 have used Taguchi methodology (TM) with fuzzy logics for multiobjective optimization (MOO) of EDM process parameters. Lin and Lin 19 used TM with grey relational analysis (GRA) to optimize the EDM process with multiple performance characteristics and reported for appreciable improvement in MRR, Ra and TEW. Sharma and Yadava 20 have used altogether different approaches for the modeling and optimization. They have used TM with response surface methodology (RSM) termed as TMRSM for modeling and TM with GRA (TMGRA) for optimization during their experimental study of neodymium-doped yttrium aluminum garnet (ND:YAG) laser cutting of thin Al-alloy sheet for straight profile. Bhuyan and Yadava 21 have used TMRSM for modeling and TM coupled with weighted principal component analysis (PCA) for optimization of traveling wire electrochemical spark machining (TW-ECSM) and reports for reasonable results. Porwal et al. 22 have used artificial neural network (ANN) for modeling and combined with PCA-GRA for MOO of hole drilled in invar material by electro discharge micro machining.
Two materials, nickel-based superalloys and titanium alloys, have been extensively used in aerospace vehicles and aeroengines in particular in the form of turbine blades, discs of turbine, compressor blades and so on. Nickel alloys have a very specific property of high precipitation temperature, which ensures the retention of its strength at higher operating temperature. Therefore, it is extensively used in aerospace application, particularly in combustible section of aeroengines and accounts for about 50% by weight. 23 However, at the same time, it poses a challenge to conventional twist drills such as frequent tool failure and poor surface finish. 24 In the present experimental study, MOO of hole made by electrical discharge drilling (EDD) in nickel-based superalloy has been carried out. This study has been executed into two hybrid stages. In the first stage modeling has been done with TMRSM and in the second stage MOO of process parameters has been done by coupling of RSM with PCA-based GRA (RSMGRA). The authors have surveyed the literatures available in journals and find that aforesaid two hybrid approaches have not been used in one single experimental study, and therefore, the authors are encouraged to experiment with this hybrid approach. Three output parameters of MRR, Ra and Ca are considered in present study. The nature of quality characteristics is different. MRR is of higher-the-better (HB) type, whereas Ra and Ca are of lower-the-better (LB) type. In the first stage of application of present hybrid approach, optimum parameters are determined using TM, and these optimum parameters are considered as central values for RSM. With the use of central composite rotatable design (CCRD) matrix, the experiments are conducted and the second-order response model for MRR, Ra and Ca are developed 25 by making use of MINITAB software. Furthermore, experimental data obtained in CCRD are used in PCA-based GRA for MOO and observed that with the present hybrid approach of MOO, large improvement in MRR, Ra along with appreciable improvement in Ca are achieved.
Methodologies used
All the used methodologies in this study are available in the literatures and well known to engineering professionals; however, these are explained in subsequent paragraphs in brief for firsthand information.
Methodologies for modeling
TM
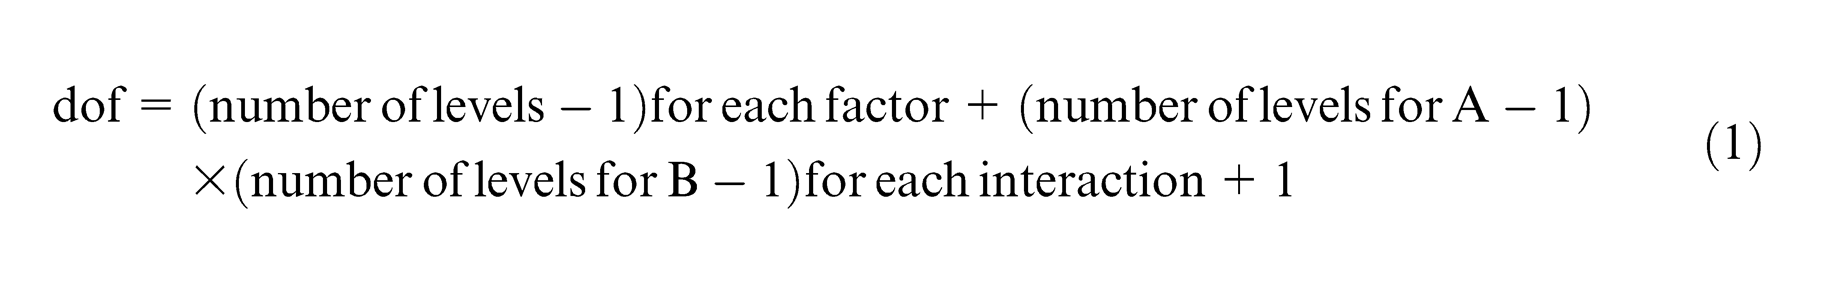
The main objective of TM is to determine the optimum level of input process parameters within the considered ranges and ensure that the process is insensitive to uncontrollable sources of variations such as environmental temperature, humidity and induced vibrations. In TM, experiments are conducted based on specially designed experimental matrix known as orthogonal array (OA) and selection of OA depends upon the degree of freedom (dof).26,27 The dof is computed as
In the design of experiments (DOE) of TM, signal-to-noise (S/N) ratio (η, dB), a representative of the quality characteristics of the observed output data (parameters) is computed as
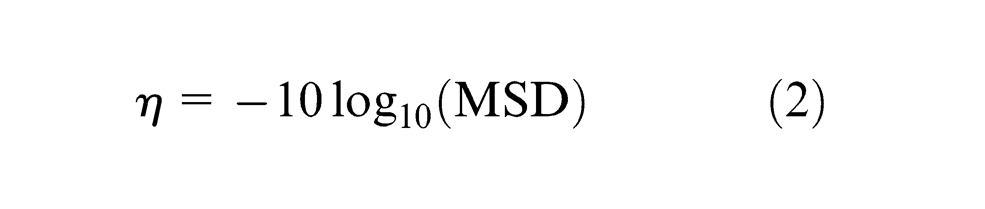
where MSD is mean square deviation and commonly known as quality loss function. Basically, there are three types of quality loss functions: LB, nominal-the-better (NB) and HB. The quality losses for LB and HB types are computed as (applicable in this study)
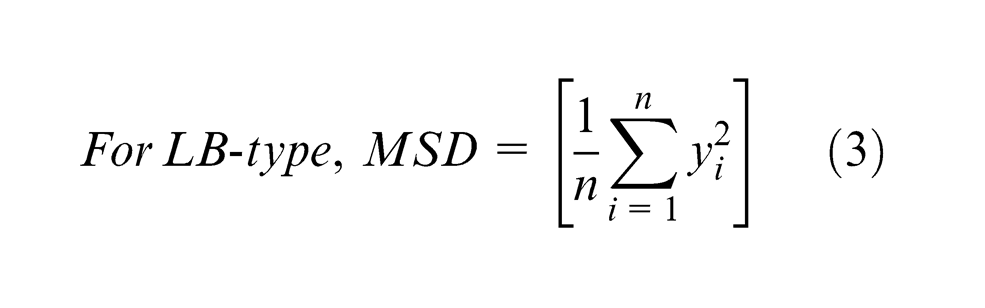

where yi is the observed response or quality value at the ith trial and n is the number of trials at same level of parameter. A single overall S/N ratio for all quality characteristics is computed in place of separate S/N ratios for each of the quality characteristic. This overall S/N ratio is known as multiple signal-to-noise ratio (MSNR). The MSNR for jth trial (
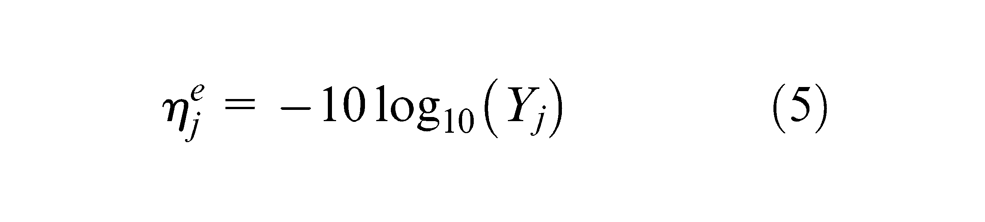
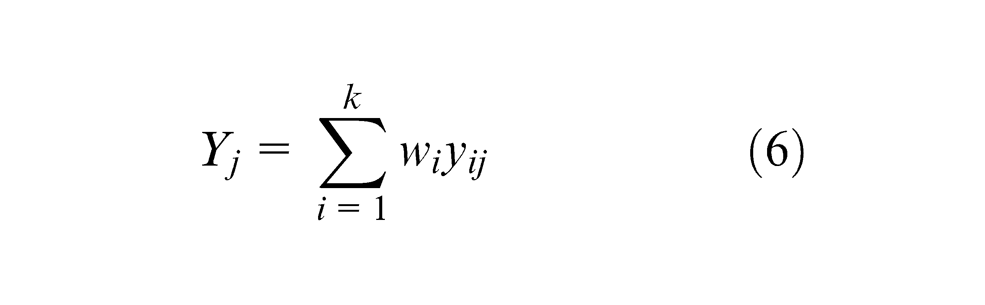
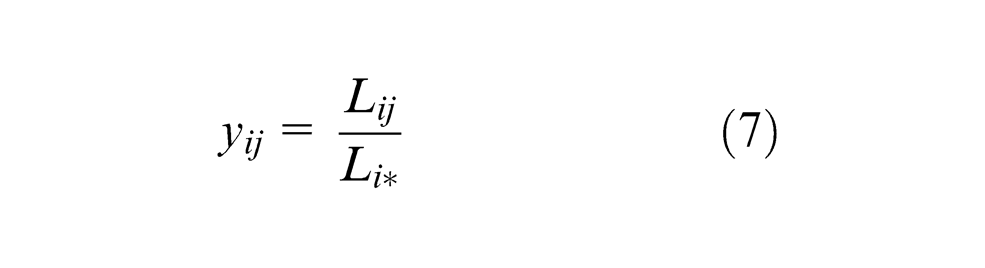
where Yj is the total normalized quality loss in jth trial, wi represents the weighting factor for the ith quality characteristic, k is the total number of quality characteristics and yij is the normalized quality loss associated with ith quality characteristic at the jth trial condition, and it varies from a minimum of 0 to a maximum of 1. Lij is the quality loss or MSD for the ith quality characteristic at the jth trial, and Li* is the maximum quality loss for the ith quality characteristic among all the experimental runs.
RSM
RSM is a statistical method, which can be used for both modeling and optimization for the complex problems of engineering science. In RSM, generally, second-order regression model is used because the first-order models often give lack-of-fit. 29 The primary objective of using RSM is to optimize the output parameters (responses), which are influential to the input process parameters.
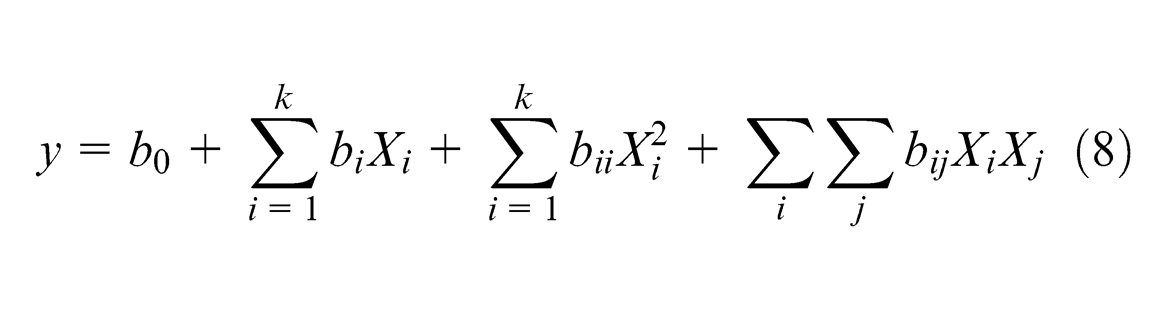
where all bs are regression coefficients as determined by the least squares method. In order to estimate the regression coefficients in this model, each variable Xi must be taken at least three different levels. This requires 3p number of experiments in the factorial design, where “p” represents for the number of factors used, but it is a tedious work where large number of factors is considered. To fit a second-order model, a new design known as central composite design (CCD) is mostly used. The CCRD is used so that developed second-order model gives optimum prediction for the process behavior within the considered range of input process parameters. The total number of experimental runs required in CCRD is 31, which consists of 16 factorial runs (2p) + 08 axial runs (2×p) + 07 central runs as in the present case the number of input process parameters (factors) are 04.
In CCRD, value of “α” is calculated as follows

and therefore, total of five levels are used between +2 and −2, that is, −2, −1, 0, +1 and +2. These coded values are assigned with the numerical values of different input process parameters.
Methodologies used for optimization
GRA
In the cases, where there is an existence of complicate relationship among the multiple quality characteristics, GRA is found to be very successful in solving it. In this analysis, preprocessing of data is done so as to transfer the existing data sequence to a comparable sequence and this is achieved by normalizing the data between 0 and 1. Thereafter, a grey relational coefficient followed by grey relation grade is computed and subsequently ordering of grey relational grade. Finally, determination of optimal setting of the data is done.
Normalizing of data
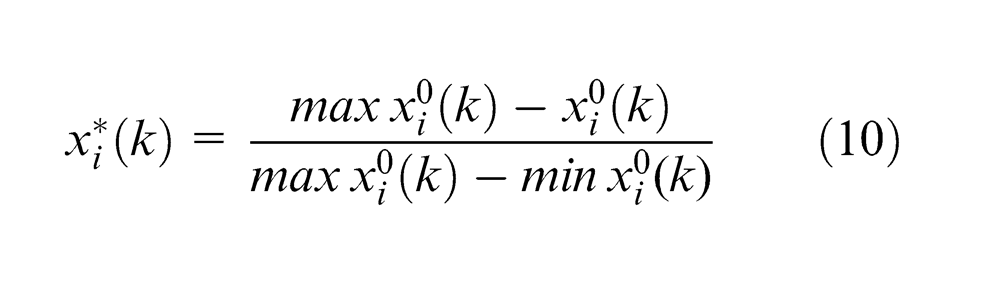
where
Calculation of grey relational coefficients
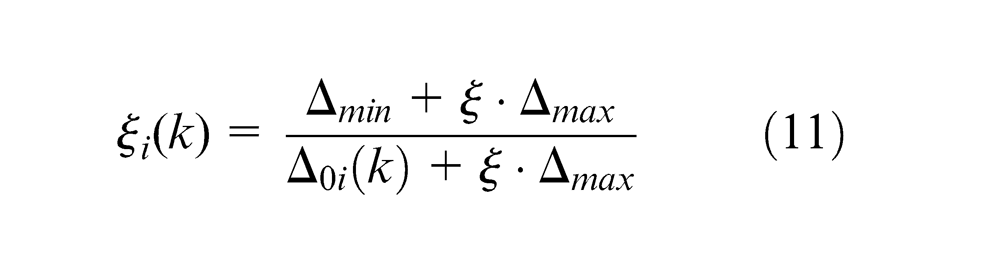
where
Calculation of grey relational grade
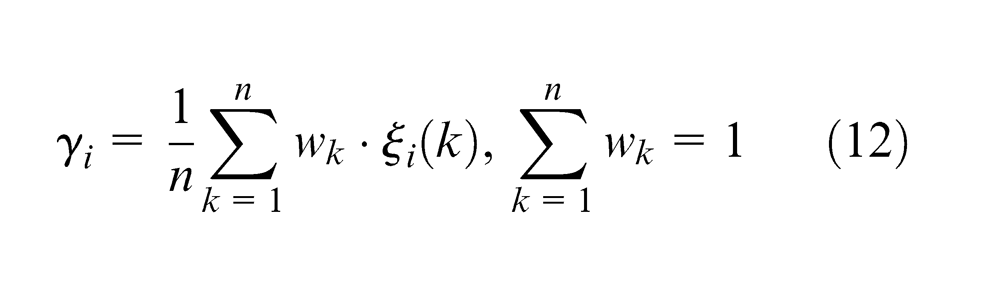
where
Principal component analysis (PCA)
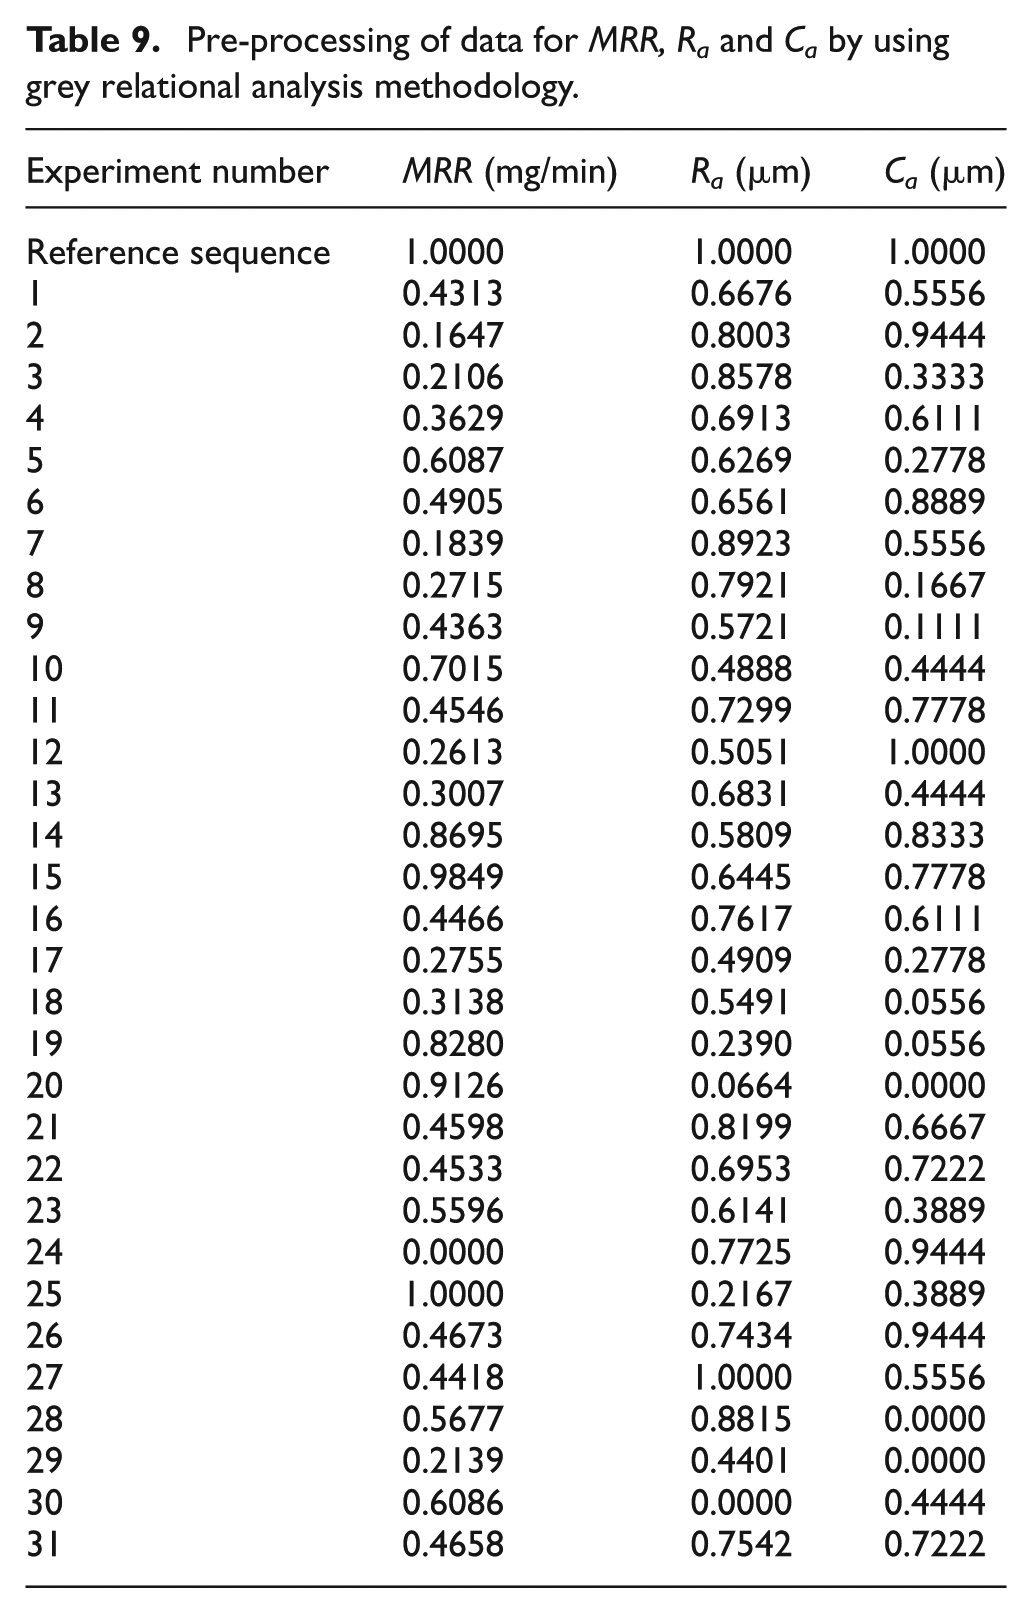
PCA is a multivariate statistical tool, which is used for solving the multicollinearity problem among the original data. This approach explains the structure of variance–covariance by the way of the linear combinations of each quality characteristic. The PCA procedure is adapted for the present work to calculate the weight by converting the contents of second-to-fourth column of 31 × 3 matrix form, as given in Table 9. This matrix is used to find the correlation coefficient. The array of correlation coefficient is calculated as
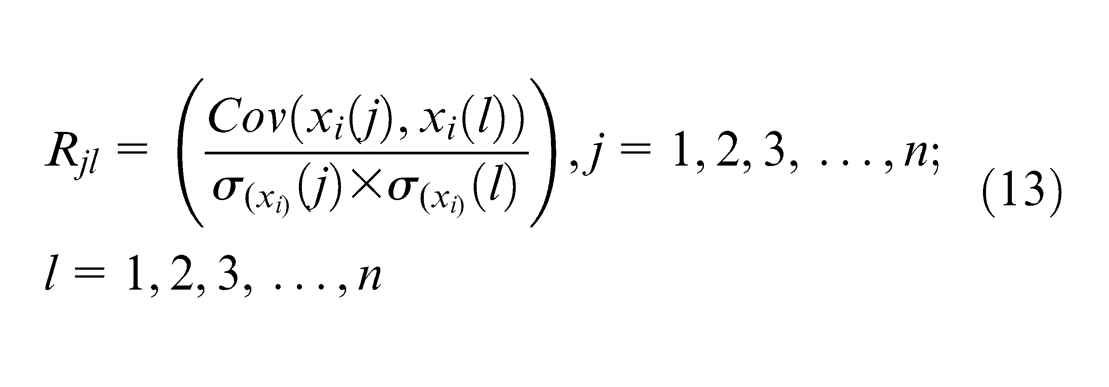
Here,
Here,
Here,
Details of experiments
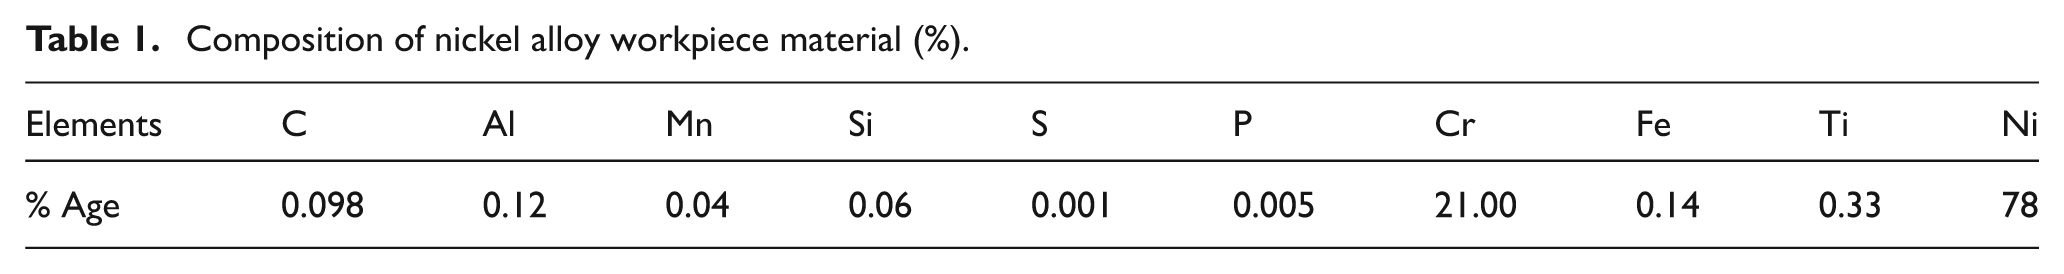
All the required experiments were conducted on ZNC 320 sinking EDM machine supplied by Ecoline Auto Systems Private Limited New Delhi, India. To facilitate the rotation of the tool electrode in EDM machine, a self-developed setup was installed on the ram by removing the actual tool holder of the EDM machine. The actual photograph of the EDM machine along with the installed setup is shown in Figure 1. A variable speed controller was used to control the revolutions per minute (rpm) of tool electrode. A portable digital tachometer (model: DT 200 1B) supplied by an Electronic Automation Private Ltd (EAPL), India, is used to measure and calibrate the tool electrode rpm of the present EDD setup. The tool electrode was used of pure electrolytic copper (containing 99.9% Cu) with 10 ± 0.005 mm diameter for making the holes in work specimen. The dielectric used during EDM machining is supplied by original equipment manufacturer (OEM) of Ecoline EDM machine. The chemical composition of nimonic alloy (Grade AE 435 HOT ROLLED ANNEALED, MIDHANI, India) work specimen is given in Table 1. The weighing of initial and final work specimens were done by a digital micro balance having accuracy of 10 µg, made in Philippines and supplied by CAS India Private Limited, India. A Perthometer Type M2 (Mahr) (GmbH, Gottingen, Germany) a surface roughness tester having stylus of 2 µm tip radius with the accuracy of 0.001µm and cut off value of 0.8 mm with five steps was used to measure Ra. A three co-ordinate measuring machine (3CMM) MATRIS model with Renishaw (CSP25M) probe having accuracy of 0.0025 mm (2.5 µm) was used to measure Ca.
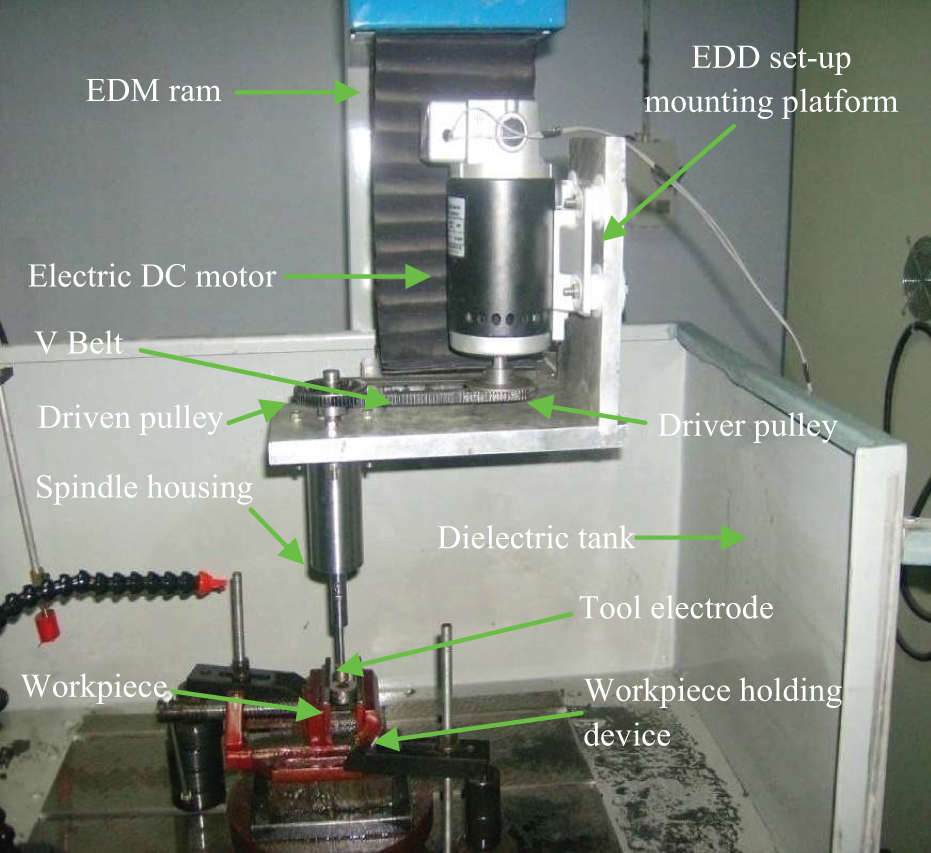
EDD setup assembled on ZNC EDM machine.
Composition of nickel alloy workpiece material (%).
The input process parameters of EDM machining are broadly classified into two categories, that is, electrical and non-electrical. The main electrical parameters are gap voltage, gap current, pulse on time, duty factor and polarity, and non-electrical parameters are IEG, tool and workpiece materials, types of dielectric fluid used, rate of flow and flushing pressure of dielectric fluid and rotation of tool electrode or workpiece. Before selecting the input parameters, the authors surveyed the available literatures related to present experimental study and selected the tool rotation, gap current, pulse on time and duty factor as input process parameters for this study. The other parameters were left over because of either having less significant effects on output parameters as confirmed in pilot experiments or automatically controlled by EDM machine.
With varying combinations of selected input parameters of gap current, pulse on time, duty factor and tool rpm, exhaustive one-parameter-at-a-time (OPAT) pilot experiments were carried out and it was observed that at 300 r/min, the value of Ra found to be as close as to the value obtained at 400 r/min (around 2.0 µm), whereas the value of Ca found to be around 26–28 µm. However, at increased tool rotation to 800 r/min, with most of the probable combination of input parameters, Ra and Ca, both are found to be closer to the obtained value of 700 r/min. Based on these observations, range of input parameters for conducting the present experimental study was decided as follows: gap current between 4–8 A, duty factor of 54%−62% and tool rotation of 400–700 r/min with varying pulse on time from 60–80 µs.
Execution of the study
The present study has been completed by coupling of two-stage study; that is, in the first stage, modeling has been done by coupling of TM with RSM terming it as TMRSM, and in the second stage, MOO has been done by coupling of RSM with PCA-based GRA terming it as RSMGRA.
Development of TMRSM model
Initially, the selection and their range of input process parameters are determined by conducting the pilot experiments.
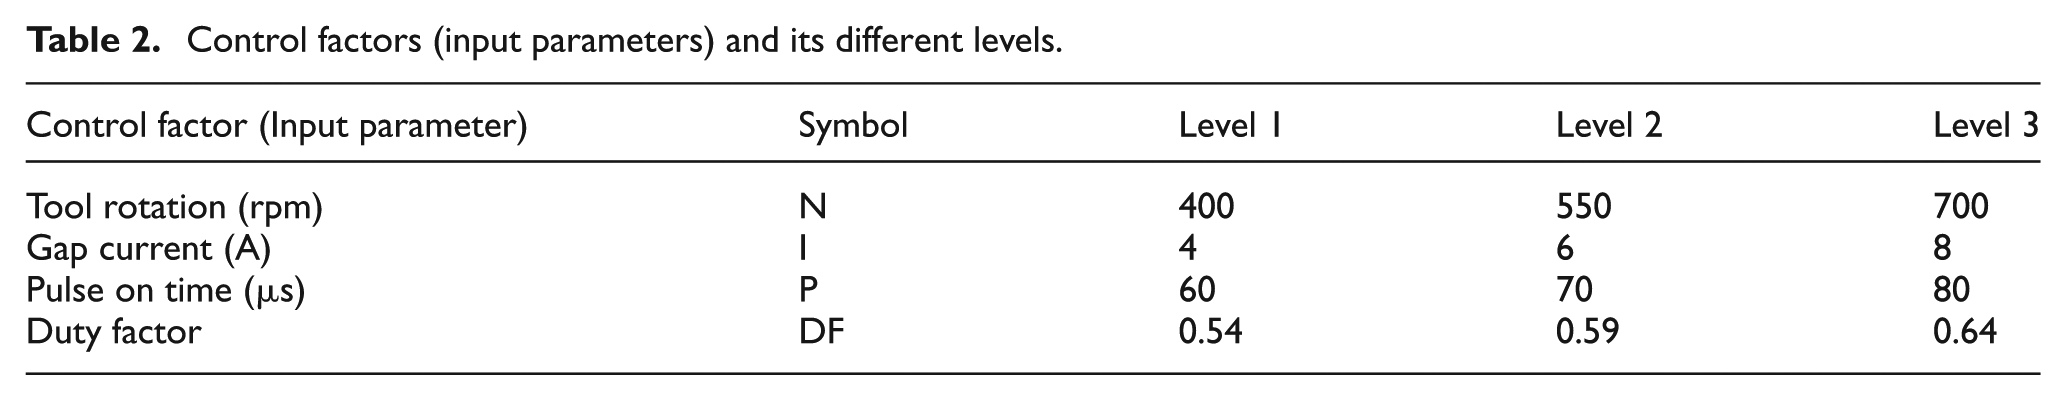
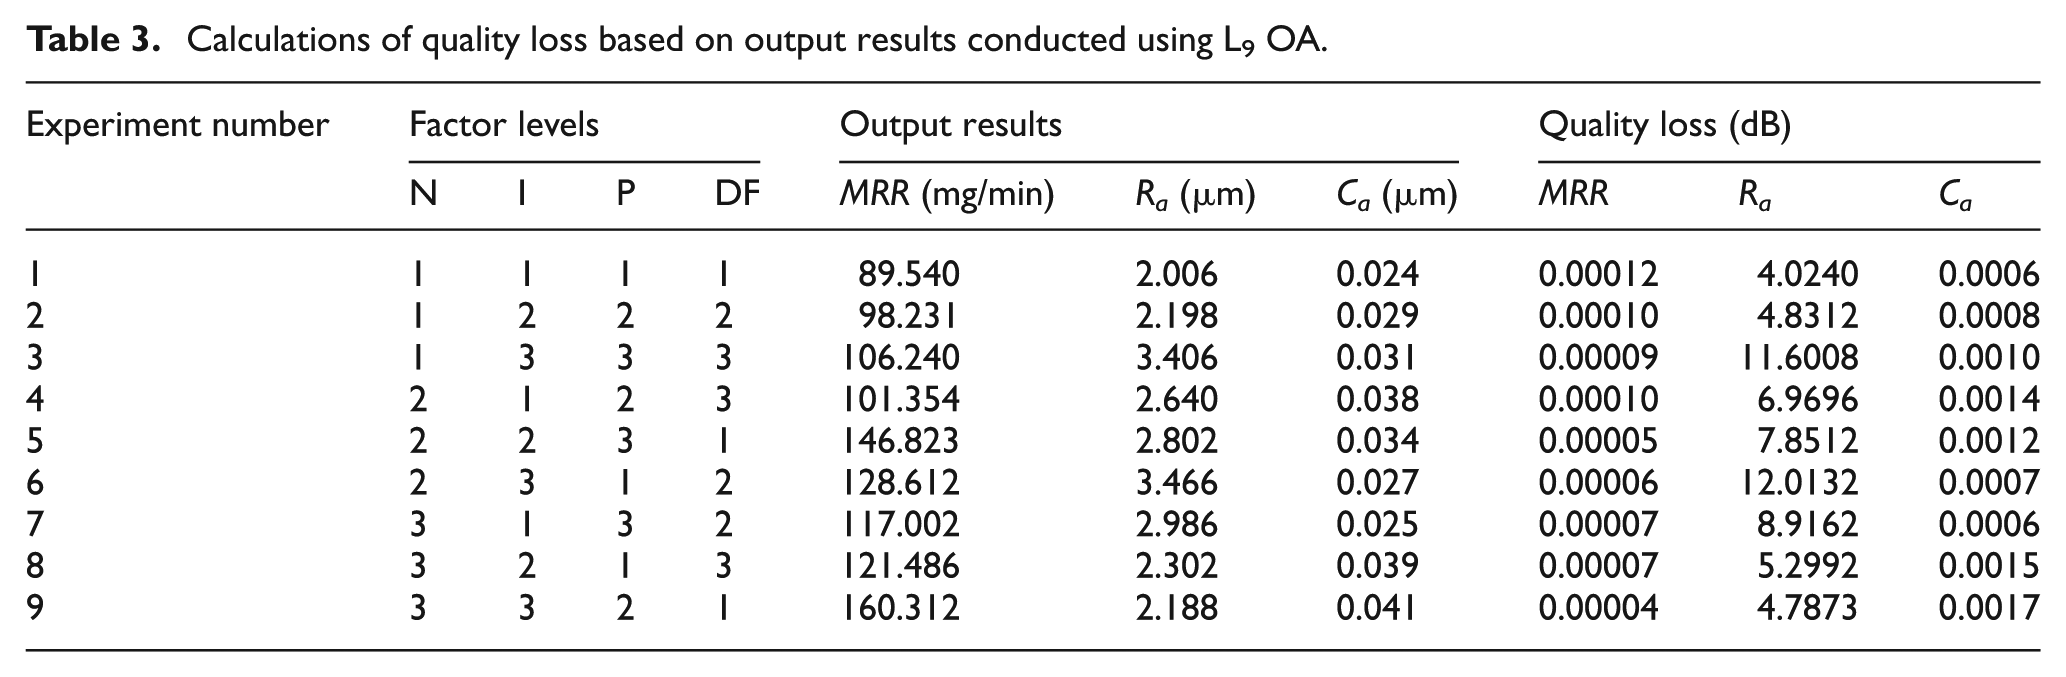
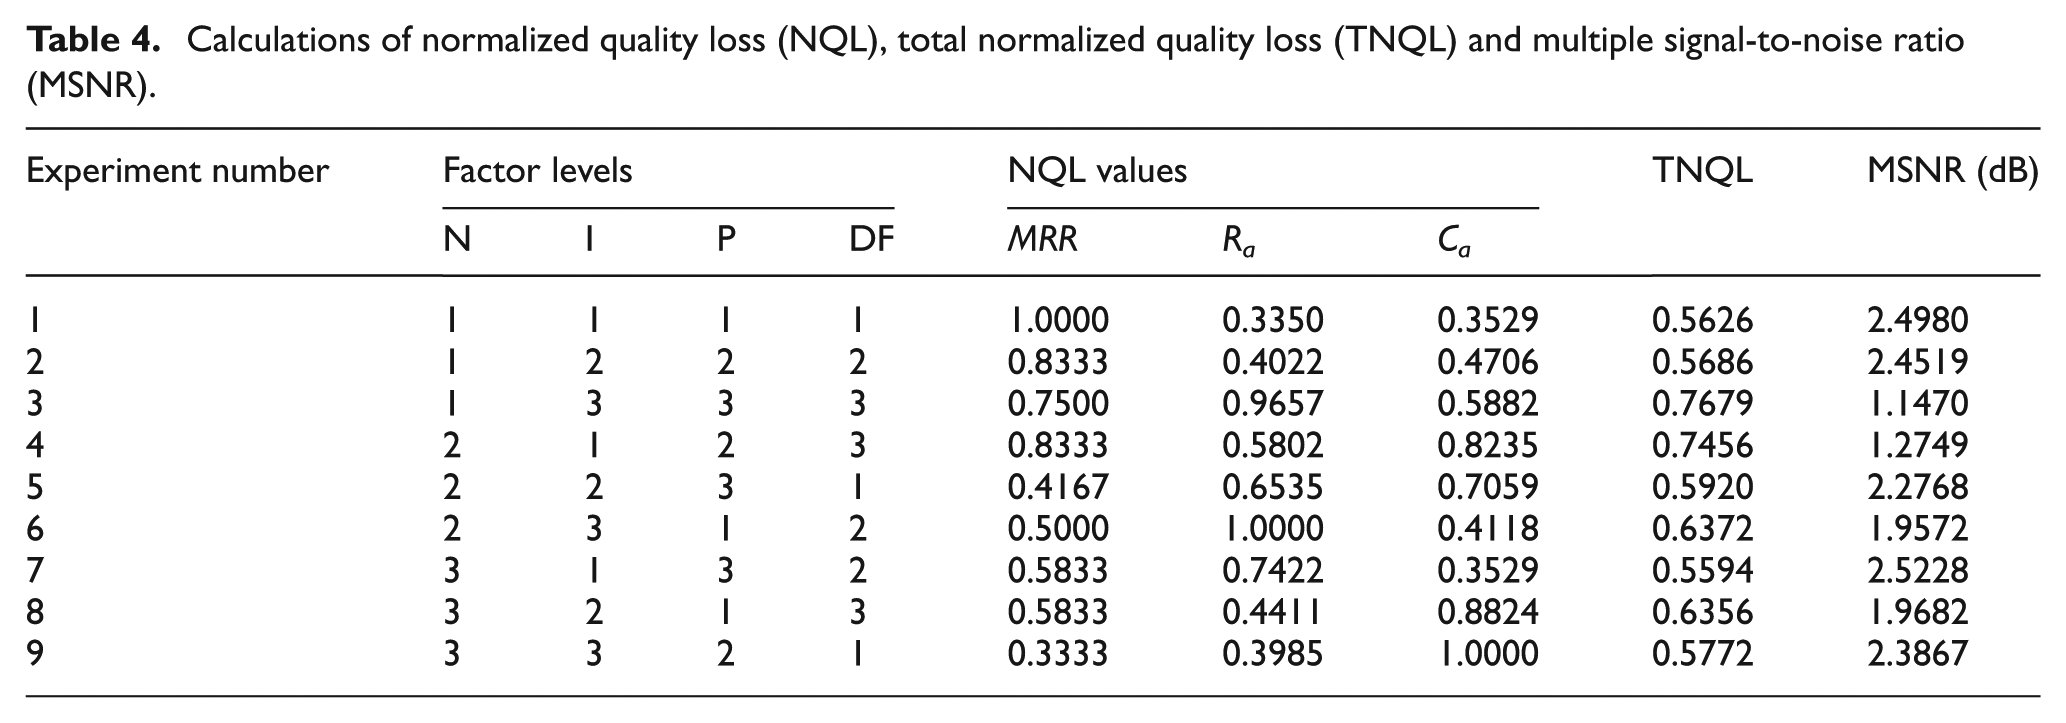
Taking into consideration four input parameters (decided in pilot experiments) at three levels along with noninteraction effects between parameters, the dof was calculated as 9 according to equation (1), and accordingly, L9 OA matrix was selected for conducting the experiments. Thereafter, experiments were conducted as per L9 matrix, followed by calculation of average MSNR by TM for each input parameter at each level (shown in Tables 2–5) with consideration of equal weight to each output parameters MRR, Ra and Ca. The maximum average MSNRs of each of the input parameters were taken as optimum values for input parameters (corresponding to N3I2P1DF1).
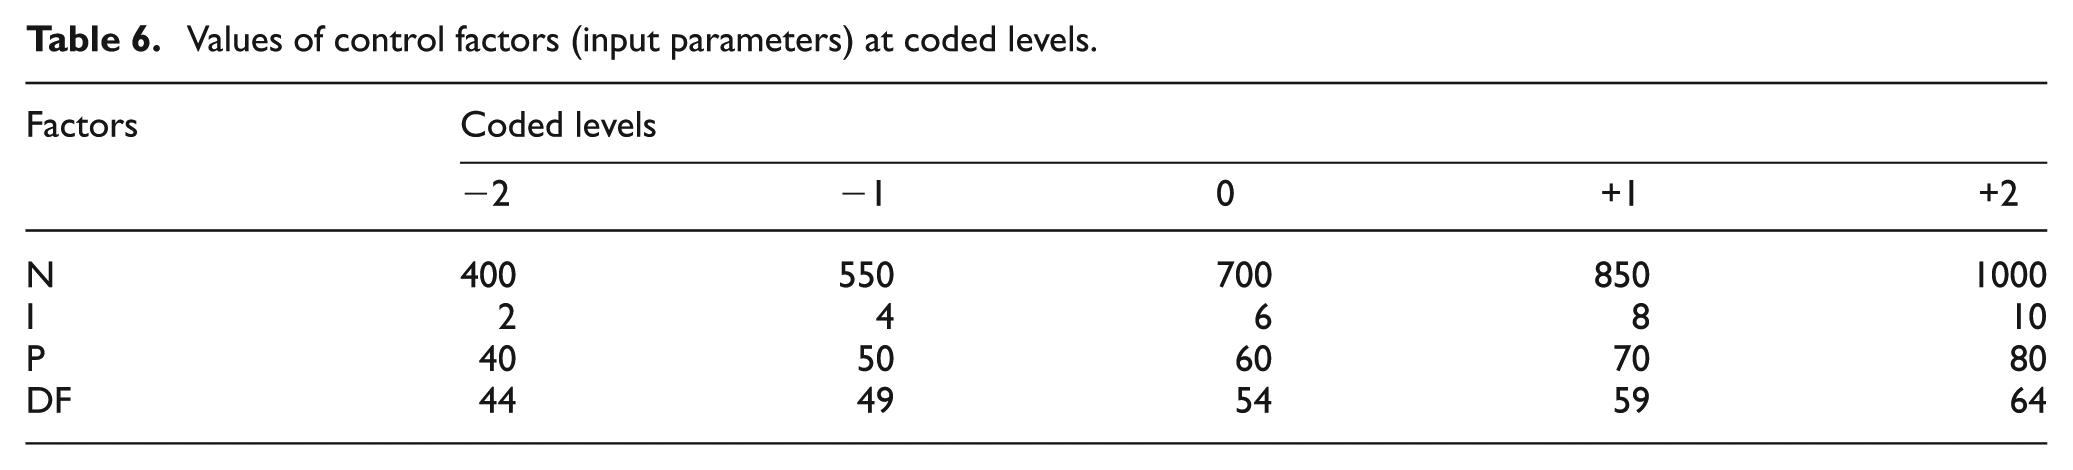
The obtained maximum value of MSNR of each parameter corresponding to N3I2P1DF1 (shown in Table 5) is further taken as central value for developing the levels of control factors as shown in Table 6. Furthermore, a CCRD matrix table was developed, and the experiments were conducted, whose obtained results for the output parameters MRR, Ra and Ca are shown in Table 7.
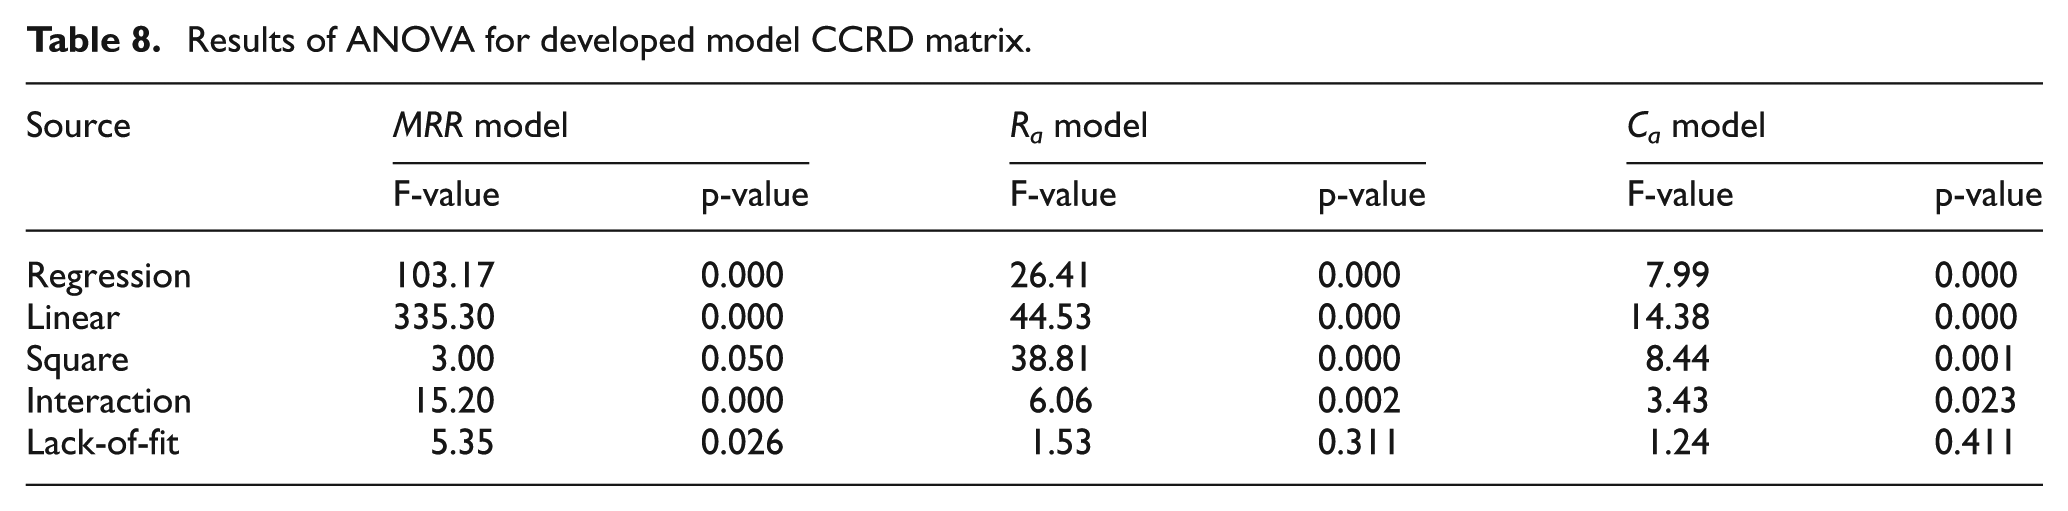
Finally, the second-order response surface models for obtained MRR, Ra and Ca (Table 7) were developed as shown by equations (16)–(18) with the help of MINITAB software. These developed models were validated by analysis of variance (ANOVA) and found with 99% confidence level as shown in Table 8.
Control factors (input parameters) and its different levels.
Calculations of quality loss based on output results conducted using L9 OA.
Calculations of normalized quality loss (NQL), total normalized quality loss (TNQL) and multiple signal-to-noise ratio (MSNR).
Calculations of average MSNR for each input parameter at each level.
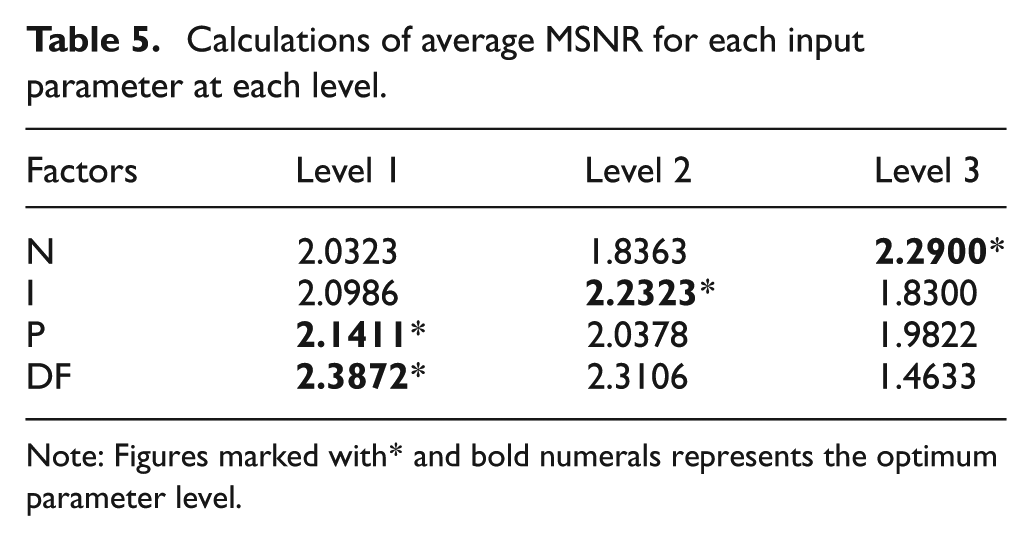
Note: Figures marked with* and bold numerals represents the optimum parameter level.
Values of control factors (input parameters) at coded levels.
Observations of output results conducted as per CCRD matrix.
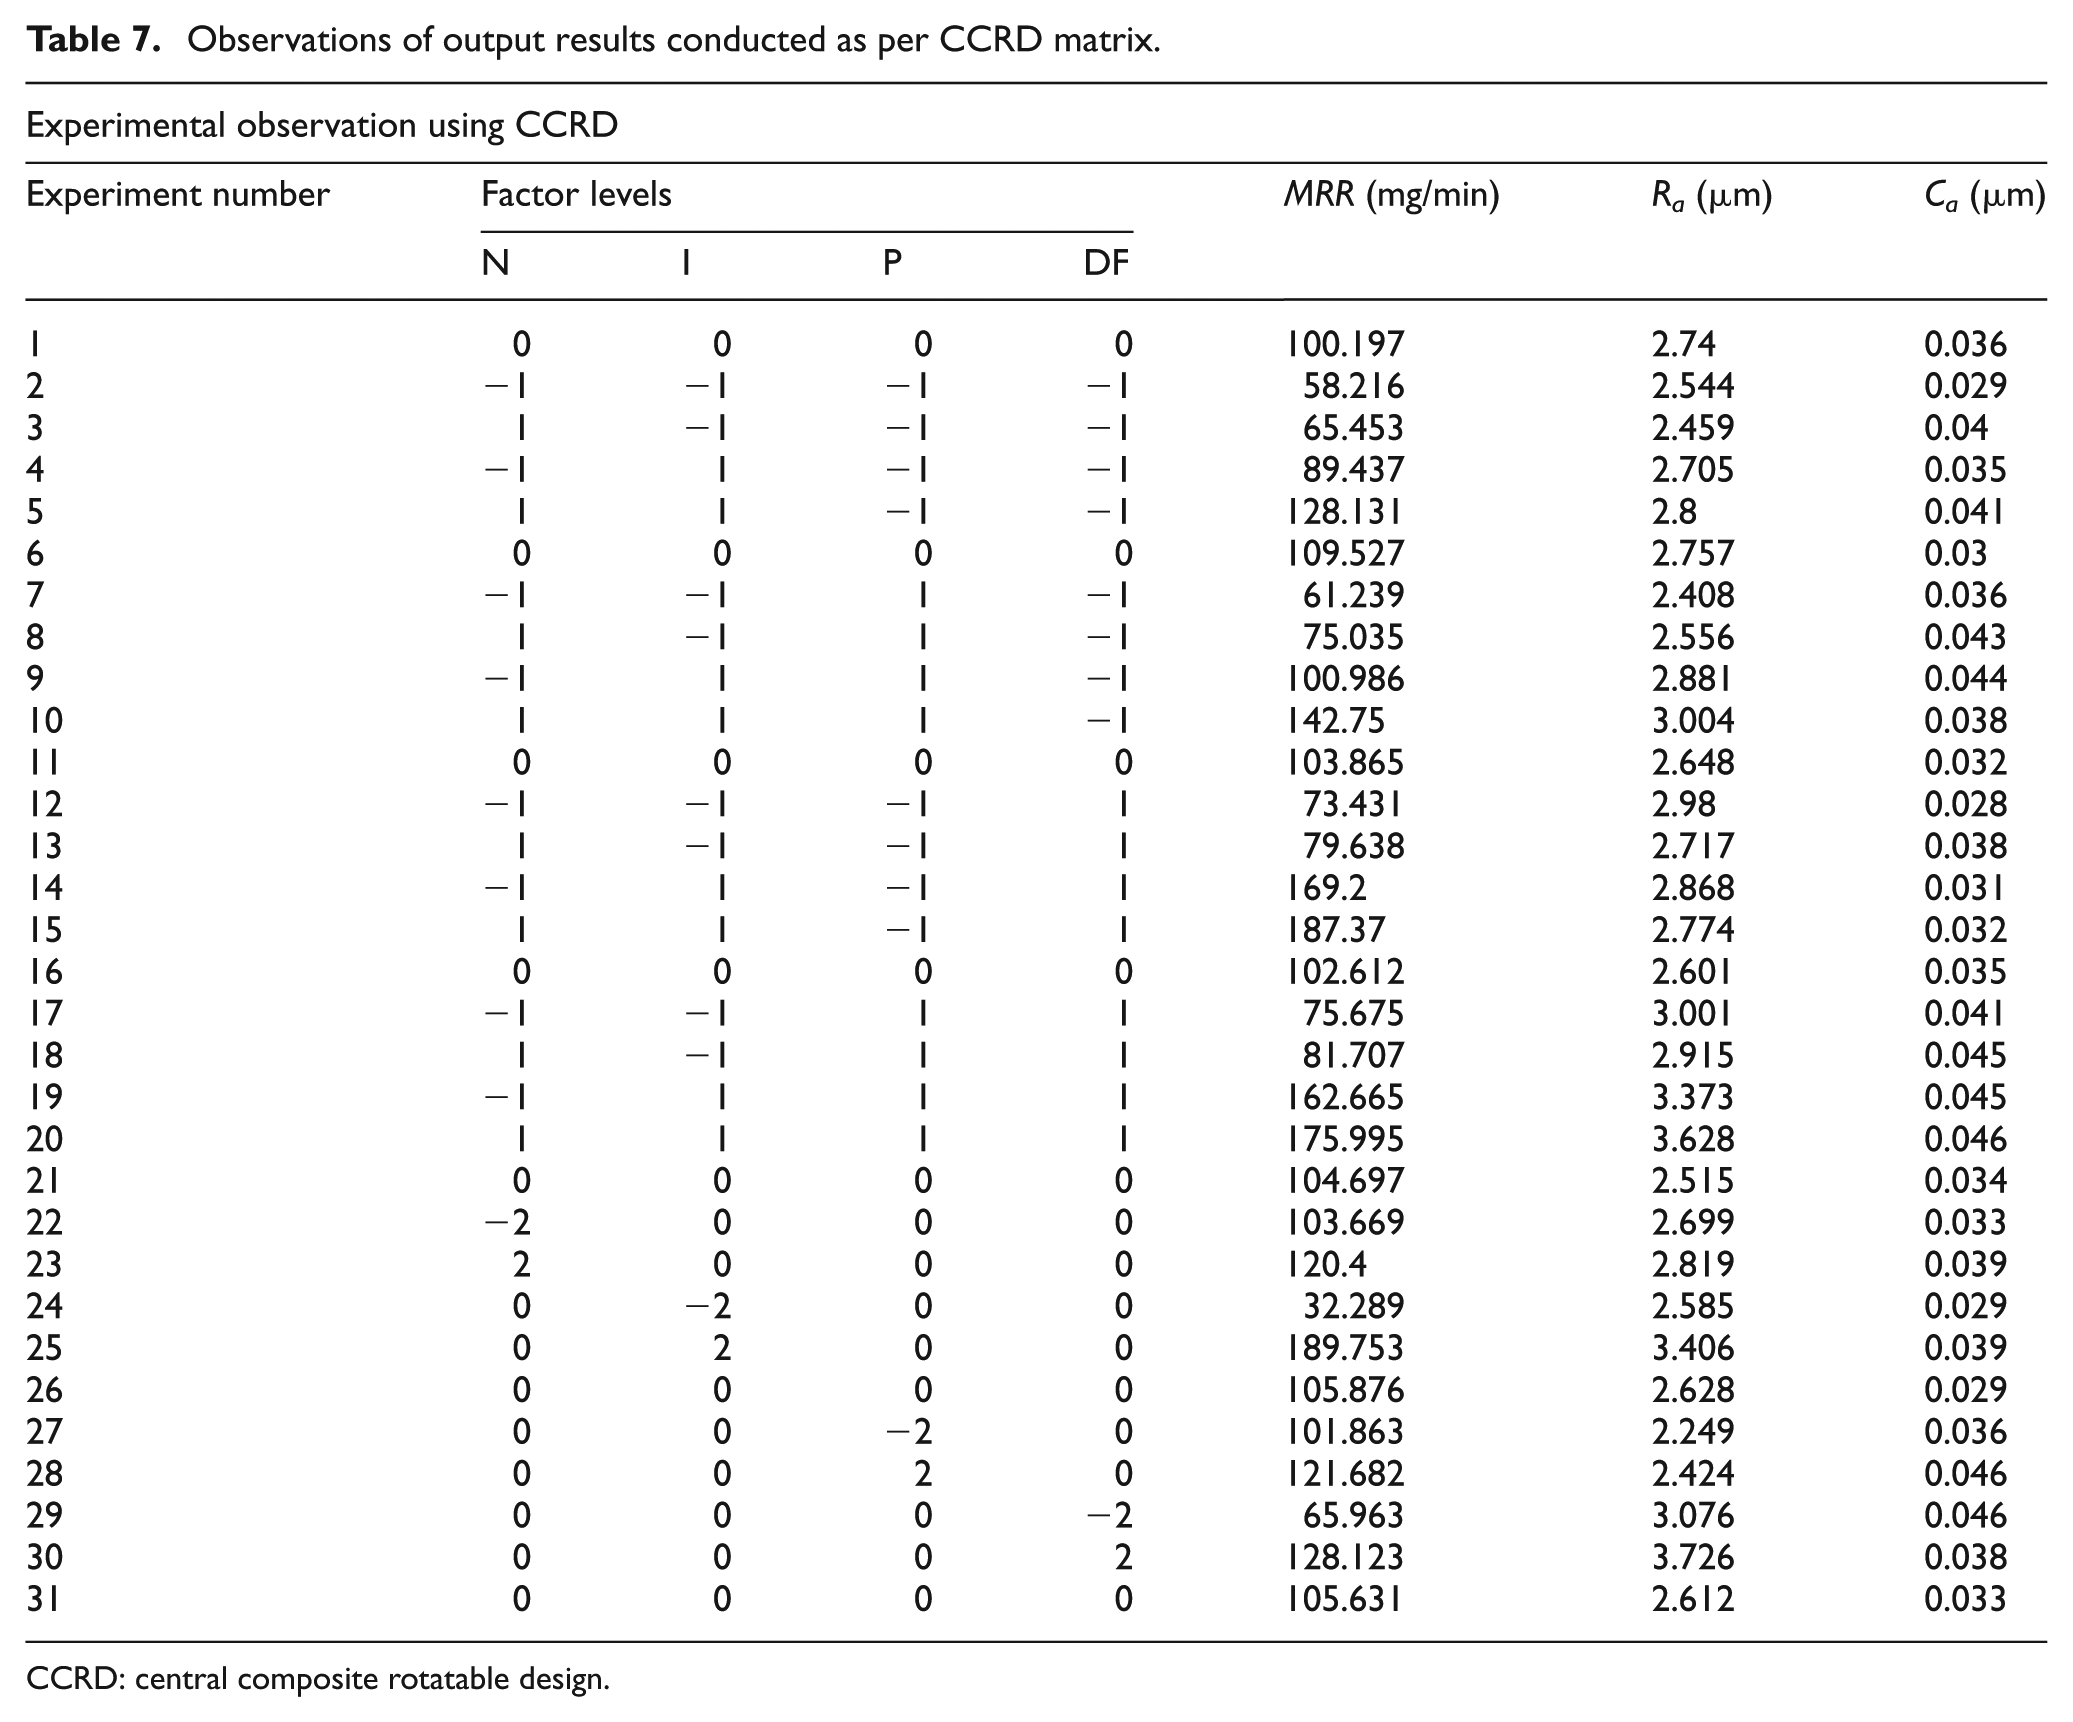
CCRD: central composite rotatable design.
Results of ANOVA for developed model CCRD matrix.
The developed second-order response surface models are given as
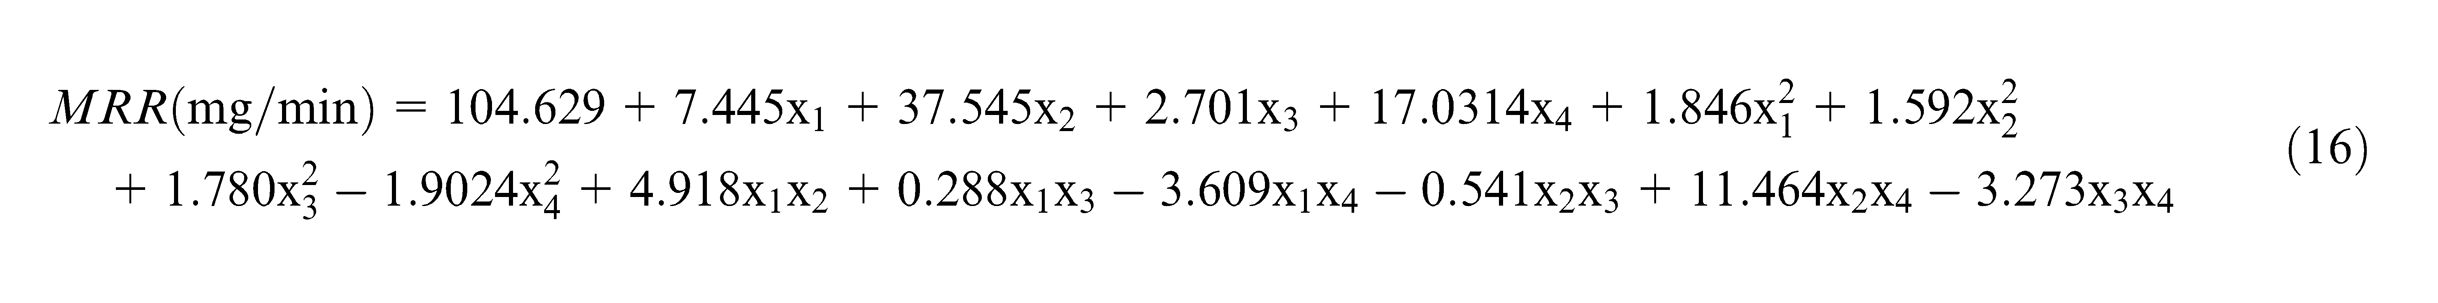
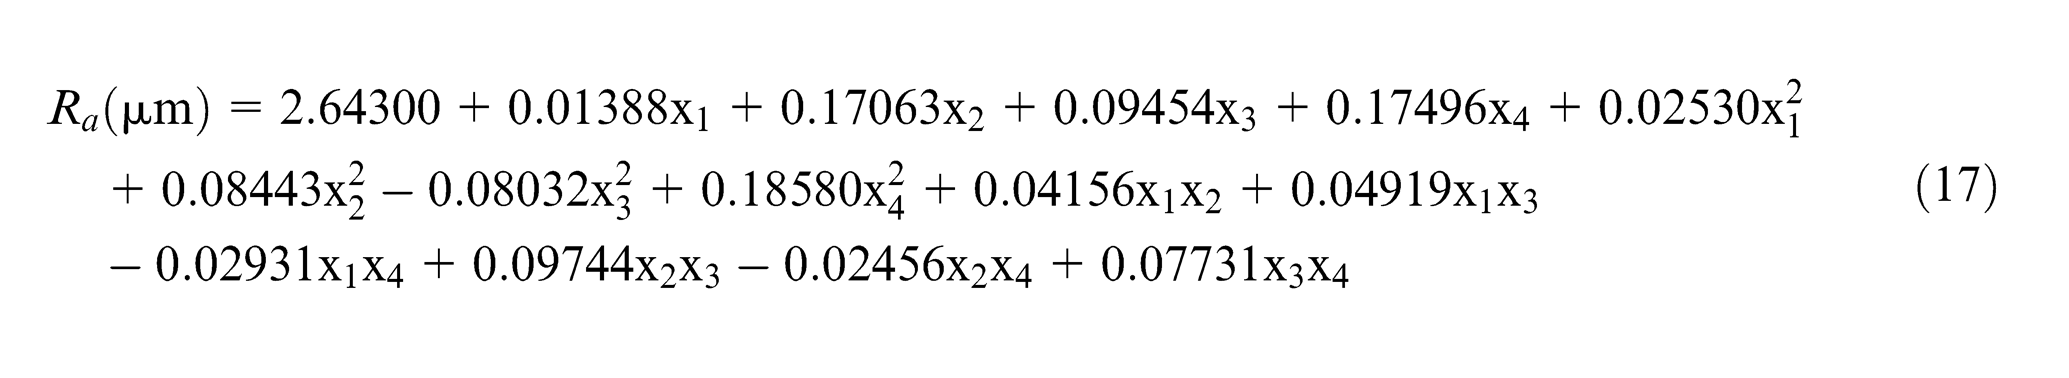
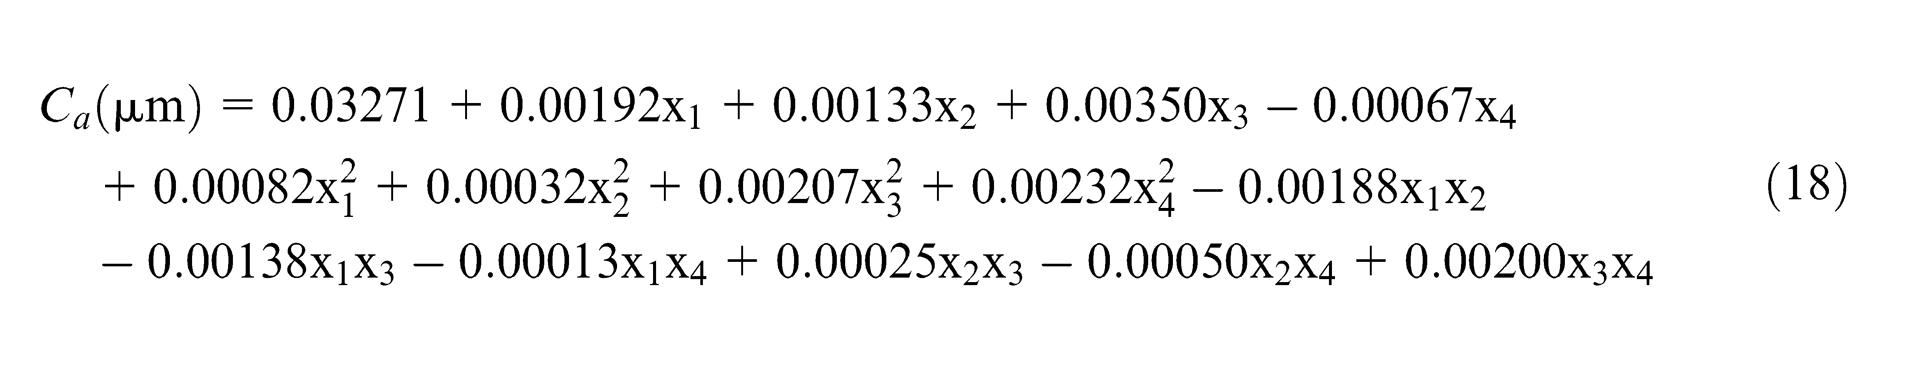
where x1, x2, x3 and x4 represent tool electrode rpm, gap current, pulse on time and duty factor, respectively. Now the data are tested for fitment in the developed model. The calculated values of S for MRR, Ra and Ca by regression analysis are 5.616, 0.09631 and 0.002752, respectively, which are smaller. The values of R2 for all the three responses MRR, Ra and Ca are 98.9%, 95.9% and 87.5%, respectively, whereas adjusted R2 values are 97.9%, 92.2% and 76.5%, respectively. These are moderately high (except adjusted R2 of Ca), which is moderate; therefore, model fits into the data. Hence, each response data are well fitted in the developed model.
To ascertain the adequacy of developed model, ANOVA and subsequently F-ratio test and p-value test have been carried out for MRR, Ra and Ca. Table 8 of ANOVA’s results shows that p-values of the source of regression model and linear effects are lower than 0.01 for all the three responses. Developed regression model as well as linear effect of parameters for all the three responses is significant. Calculated F-values of the lack-of-fit for MRR, Ra and Ca are 5.35, 1.53 and 1.24, respectively, and these values are lower than the critical value of the F-distributed on 7.87 as per standard table at 99% confidence level. So developed regression model of the second order for MRR, Ra and Ca is adequate at 99% confidence level. It is perceived from above developed RSM model that except the square effect of duty factor, interactive effects of tool rpm and duty factor, gap current and pulse on time, pulse on time and duty factor, all other factors have significant effects on MRR. Similarly, except square effects of pulse on time and interaction effect of gap current and duty factor, other factors are significant on Ra. Also, except the duty factor, interactive effects of tool rpm and gap current, tool rpm and pulse on time, tool rpm and duty factor, gap current and duty factor, all other factors have significant effects on Ca.
Analysis of the effects of input process parameters
Based on developed model, the effects of input process parameters on MRR, Ra and Ca are analyzed with observed RSM plot.
Effect on MRR
Figure 2 shows that at constant values of pulse on time (60 µs) and duty factor (54%), MRR increases with the increase of gap current along with tool electrode rotation from 400 to 1000 r/min. This is due to the reason that as the gap current increases from 2 to 10 A, the intensity of spark energy increases, which results in increase in higher heat energy and discharge power. This melts and vaporizes the materials from the surface of work specimen effectively and at the same time increasing of tool rpm increases the effective flushing of eroded debris (molten materials) from IEG along with dielectric fluid as a result there is an increase in MRR. Figure 3 depicts that at constant value of gap current and duty factor, with increase in pulse on time from 40 to 60 µs, and at lower tool rpm, the MRR seems to be constant (slightly decreasing). This is because increasing of pulse on time from 40 µs to 60 µs is not sufficient enough to adequately conduct into the work specimen and melts the materials which could be removed from IEG at low tool rpm. As the pulse on time increases from 60 to 80 µs, MRR increases along with increased tool rpm. This is because sufficient amount of heat energy is available in IEG, which melts and vaporizes the materials of work specimen, and removal thereafter at higher tool rpm due to effective flushing of eroded debris. Figure 4 shows that at constant value of gap current and pulse on time, MRR increases with increase of duty factor accompanied by increase in tool rpm. This is due to reason that increasing of duty factor, increases the heat energy which ensures effective conduction of heat energy into work specimen and thereby melting and vaporizing the materials at increased rate. And with the increase of tool rpm, the molten materials are also removed effectively due to effective flushing of dielectric from IEG.
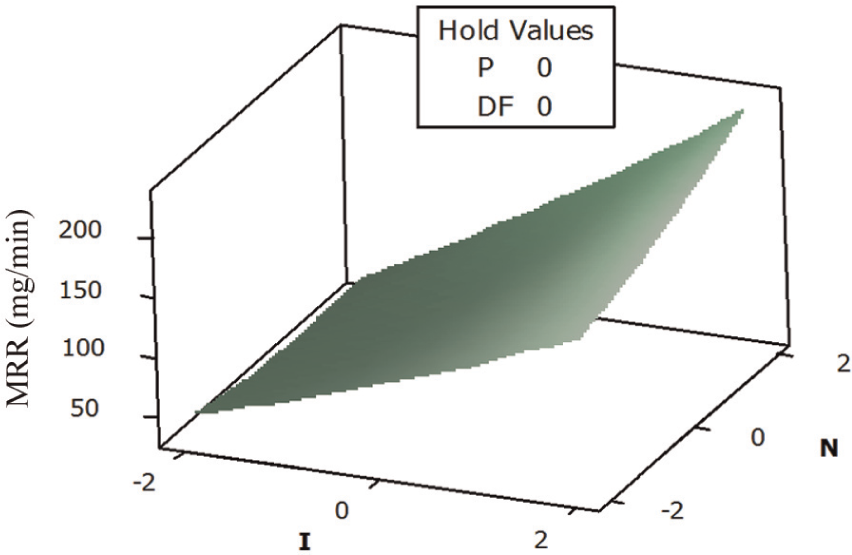
Response surface plot for MRR with gap current and tool rpm.
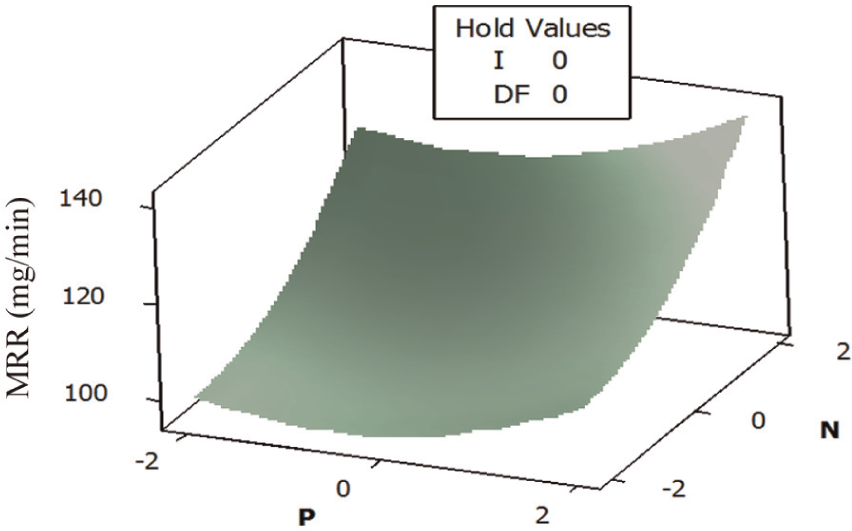
Response surface plot for MRR with pulse on time and tool rpm.
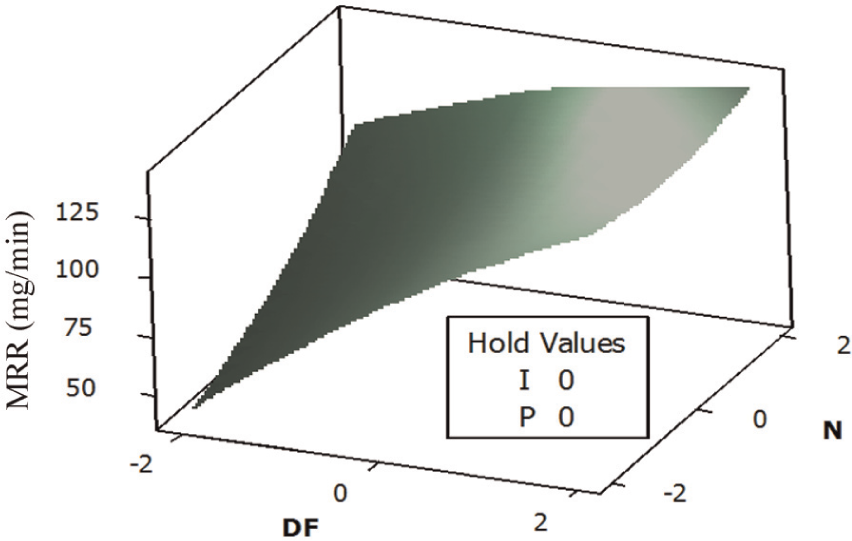
Response surface plot for MRR with duty factor and tool rpm.
Effect on Ra
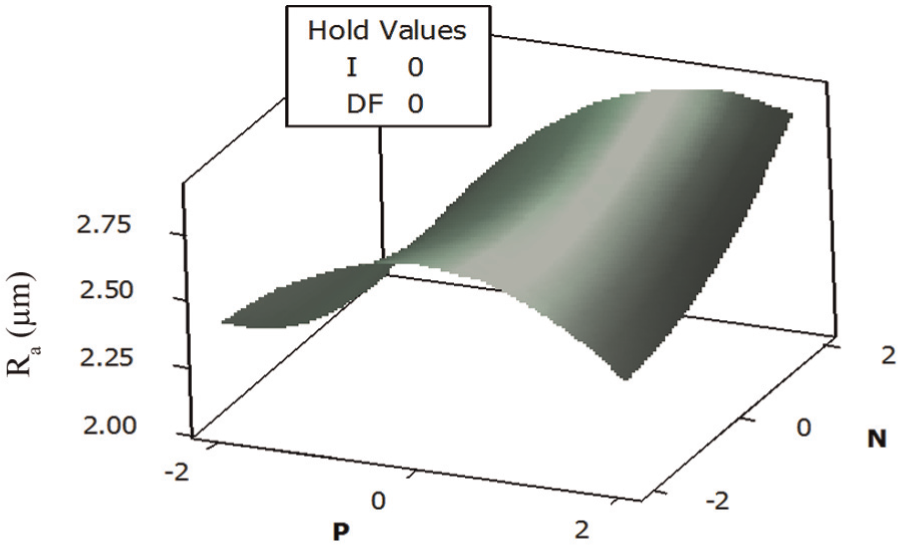
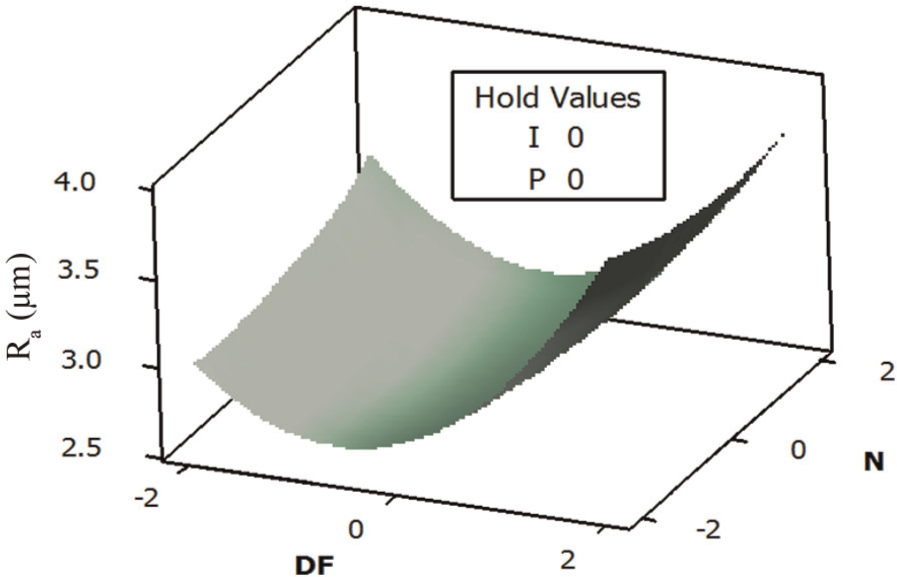
Figure 5 shows that at constant values of pulse on time (60 µs) and duty factor (54%), with increase of gap current from 2 to 6 A, Ra improves along with increased tool rotation from 400 to 1000 r/min. This is because increased gap current increases the intensity of spark energy, which melts the materials from the work specimen effectively and removes the eroded materials uniformly due to effective flushing. As the gap current increased from 6 to 10 A, the value of Ra increased. This is because the intensity of the spark increases further resulting in deep penetration of heat energy into work specimen. But due to high precipitation temperature characteristics of work specimen, materials are not melted uniformly and removed from IEG effectively resulting in increased surface roughness. This is further enhanced by increased tool rpm due to formation of larger craters on machined surface accompanied by uneven re-solidification. Figure 6 shows that at constant value of gap current (6 A) and duty factor (54%), initially at pulse on time of 40 µs with increase in tool rotation from 400 to 1000 r/min, the value of Ra improves. This is because of superficial melting of materials of work specimen and effective flushing of eroded debris coupled with high tool rpm. However, as the pulse on time increases to 60 µs, Ra increases at all tool rpm. This is due to the reason that increased pulse on time increases the spark duration and moderately melts the materials from work specimen but it is not sufficient enough to remove the molten materials from the work specimen resulting in the formation of craters in turn increasing the average surface roughness. However, with further increase of pulse on time to 80 µs, the generated high heat energy is sufficient enough to melt the materials and uniform removal of molten materials leads to improvement in Ra value. However, surface roughness decreases with increased tool rpm at increased pulse on time. This is because molten material re-solidifies layer by layer on the machined surface due to spattering of molten material globules with lesser time available to be flushed away. Figure 7 shows that at constant values of gap current (6 A) and pulse on time (60 µs), with increase of duty factor from 44% to 54%, the surface roughness improves at all tool rpm. This is because increasing of duty factor increases the heat energy, which ensures effective cum uniform melting of materials of the work specimen resulting into smooth removal of material thereby ensuring into the improvement of Ra. However, at increased duty factor to 64%, generated heat energy due to spark is too high and penetrates deep into the work specimen. And due to increased tool rpm, the upper layers of the molten materials are removed effectively leaving behind the lower part of partially molten materials, which re-solidifies on the surface as thermal infested layers resulting in higher Ra value.
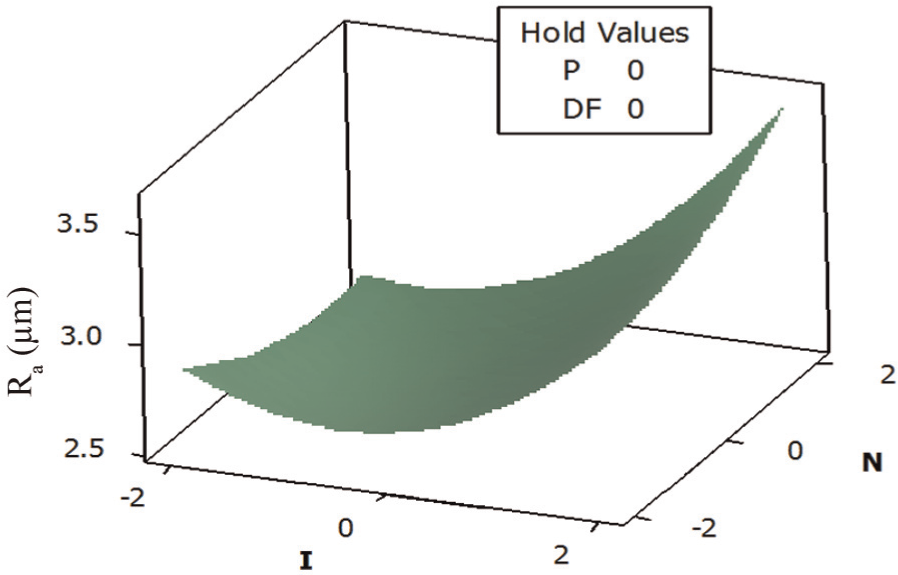
Response surface plot for Ra with gap current and tool rpm.
Response surface plot for Ra with pulse on time and tool rpm.
Response surface plot for Ra with duty factor and tool rpm.
Effect on Ca
Figure 8 shows that at constant values of pulse on time (60 µs) and duty factor (54%), Ca is low at gap current of 2 A with tool rotation at 400 r/min but it increases linearly with increase of tool rpm. It is because at initial value of 2 A gap current and 400 r/min, the intensity of spark energy is quite low, which results in lesser amount of material removal. However, due to low intensity of spark energy at 2 A, heat energy penetration is low into work specimen and melting of material from the surface of work specimen surface is also low. However, due to increased tool rotation to 1000 r/min, flushing of dielectric fluid is enhanced along with increased kinetic energy, which results in formation of craters of re-solidified thermal infested layers leading to increased value of average circularity. With increase of gap current to 10 A at 400 r/min, Ca increases but it improves simultaneously with increase of tool rotation to 1000 r/min. This is because at higher value of gap current, melting of materials from work specimen increases and smoothly flushed off at higher tool rotation leading to improved Ca. Figure 9 shows that with constant values of gap current (6 A) and duty factor (54%), Ca increases with increase in tool rotation from 400 to 1000 r/min at pulse on time of 40 µs. This is because at low value of pulse on time, the discharge energy is very low and not sufficient to melt and remove the material effectively from machined surface. However, as the tool rpm increases, due to kinetic energy of dielectric fluid coupled with high tool rpm, the materials are removed leaving behind uneven craters and resulting in increased value of Ca. However, as pulse on time increases, melting of materials is adequate due to longer duration of available spark energy but removal of debris (molten materials) is very poor at low rpm (400 r/min) due to ineffective flushing resulting in re-solidification of molten materials, which results in high value of Ca. As the rpm increases, Ca improves due to effective flushing of debris from IEG with uniform machined surface. Figure 10 shows the relation between Ca with duty factor and tool rpm at constant values of gap current and pulse on time. It shows that at 44% duty factor and with increasing tool rpm from 400 to 1000 r/min, Ca increases, and as the duty factor increased to 54%, the Ca improves for all tool rotations between 400 and 1000 r/min. This is because at increased duty factor, discharge energy is sufficient enough to melt the materials, and molten materials are removed effectively and uniformly, which ensures the improvement in Ca. However, at increased duty factor of 64%, the spark energy is too sufficient to melt the material and also penetrates deeper into work specimen but due to inefficient removal of molten material, it gets piled up on machined surface in the form of re-solidified layer over layers resulting in increase of Ca.
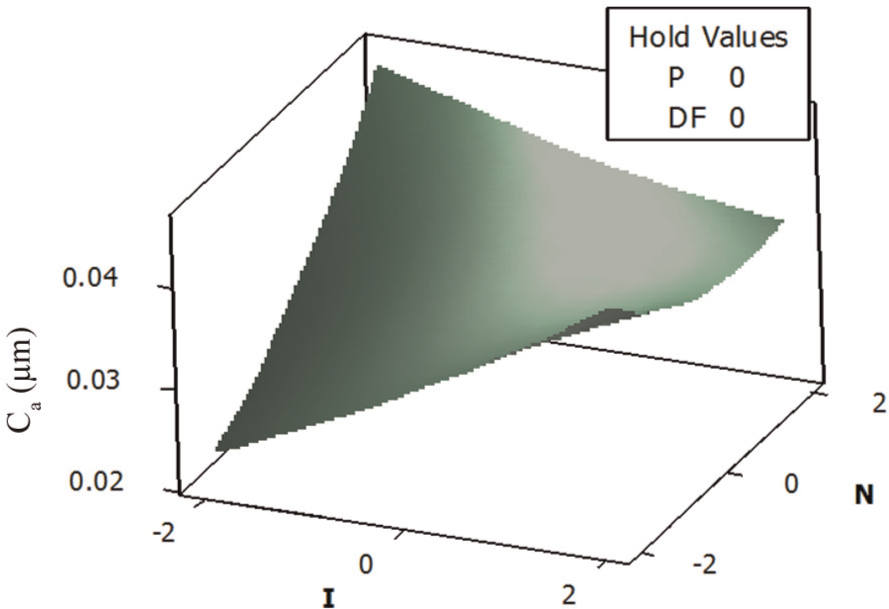
Response surface plot for Ca with gap current and tool rpm.
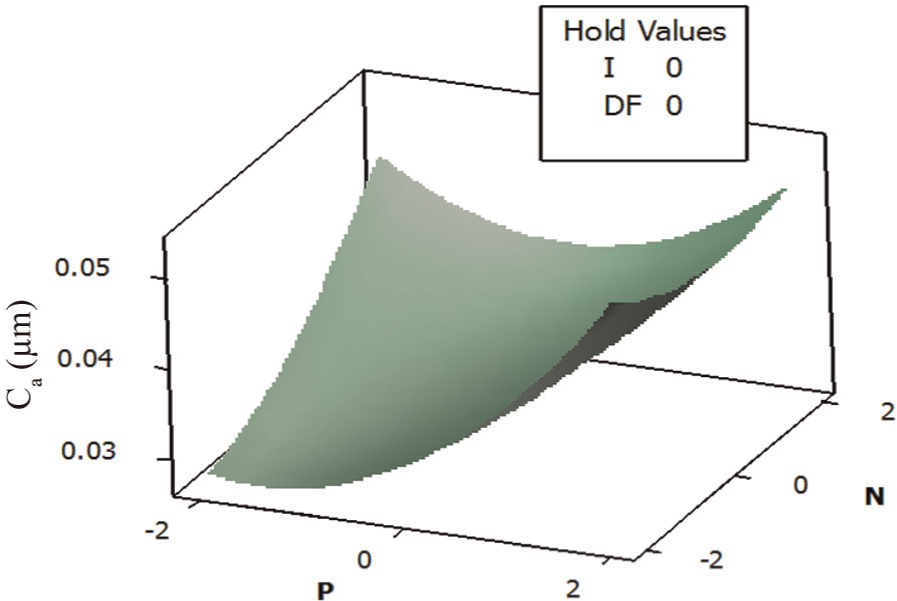
Response surface plot for Ca with pulse on time and tool rpm.
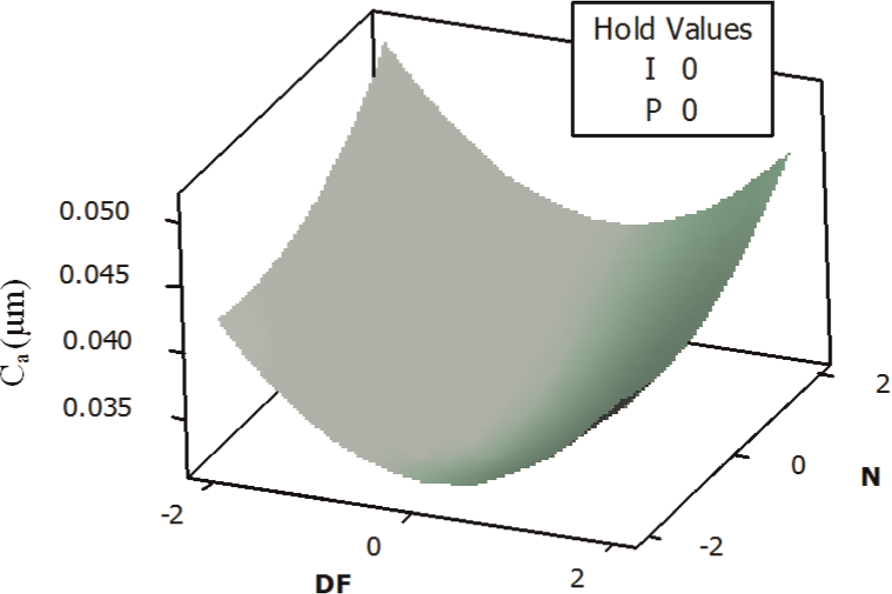
Response surface plot for Ca with duty factor and tool rpm.
Optimization by RSMGRA (RSM coupled with PCA-based GRA)
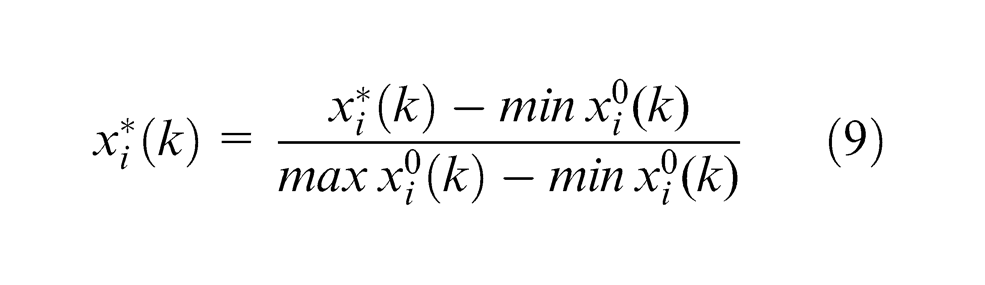
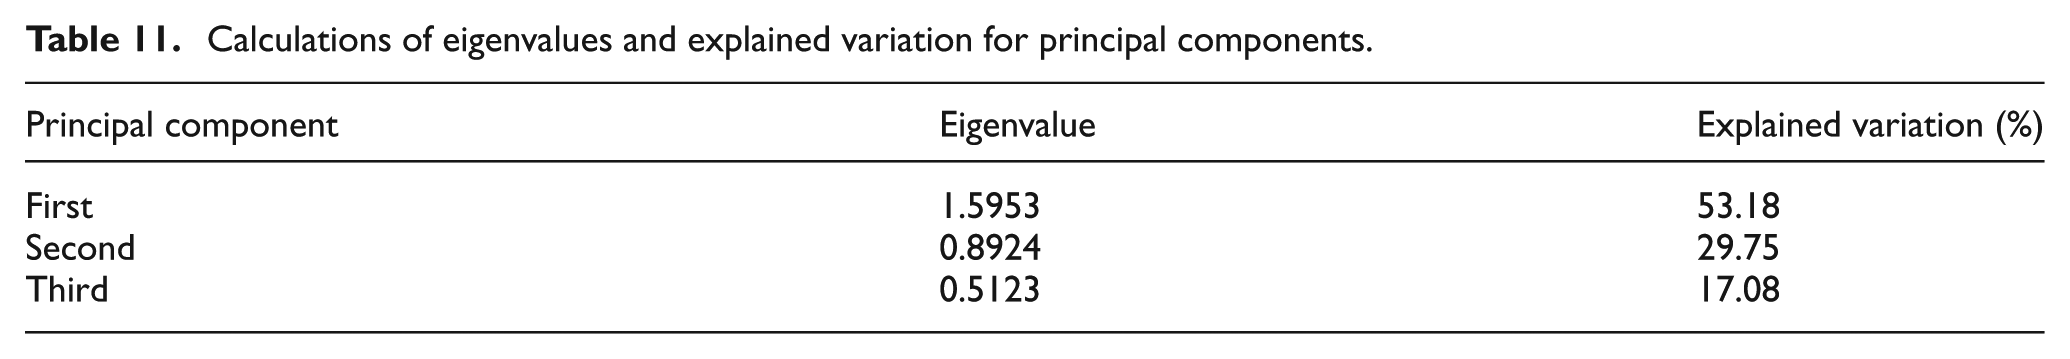
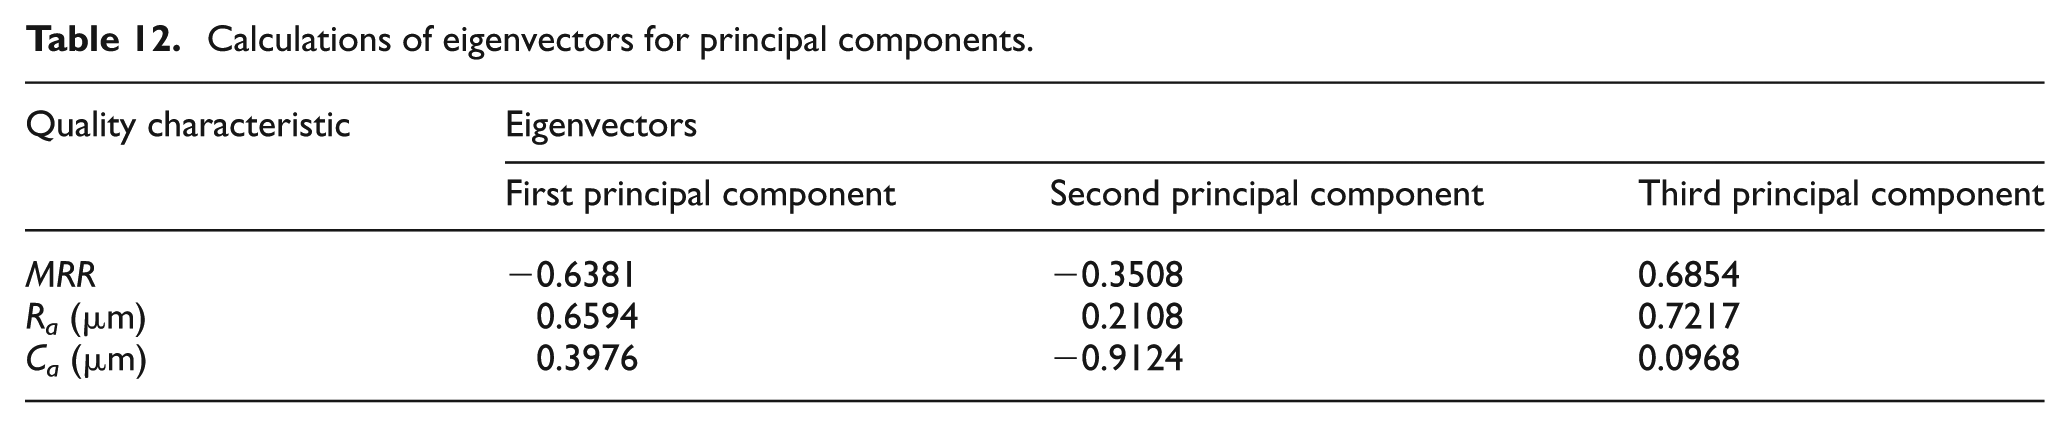
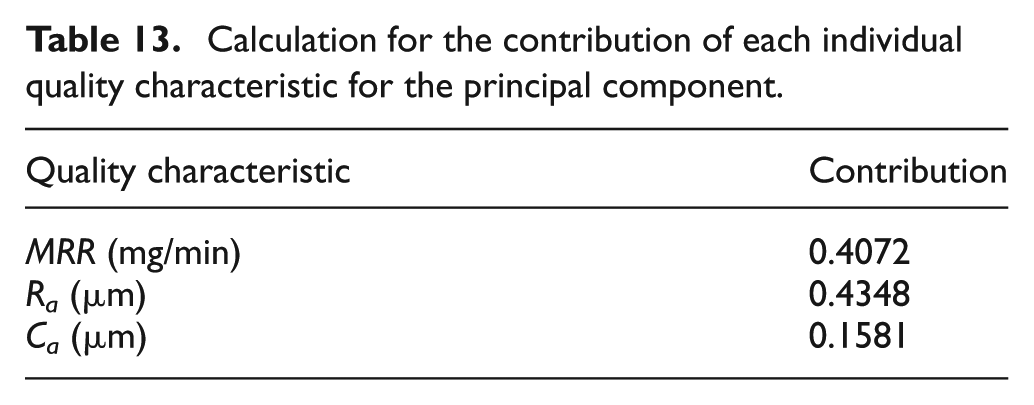
The observed experimental values of MRR, Ra and Ca, as shown in Table 7, of each experimental run have been used to optimize the process using RSMGRA hybrid methodology. This has been executed in two steps. In the first step, MRR, Ra and Ca values shown in Table 7 are pre-processed according to equation (9) and computed for obtaining the values of grey relational coefficient according to equation (11), which are shown in Tables 9 and 10, respectively. In the second step, the eigenvalues and eigenvectors are calculated from the pre-processed data for MRR, Ra and Ca, which are shown in Tables 11 and 12, respectively. From Table 11, it is observed that the variation in contribution to the first principal component is 53.18%, and therefore, weighing values (contributive) for MRR, Ra and Ca are taken as square of first principal values of eigenvectors of Table 12. These contributive values for MRR, Ra and Ca are 0.4072, 0.4348 and 0.1581, respectively, which is shown in Table 13.
Pre-processing of data for MRR, Ra and Ca by using grey relational analysis methodology.
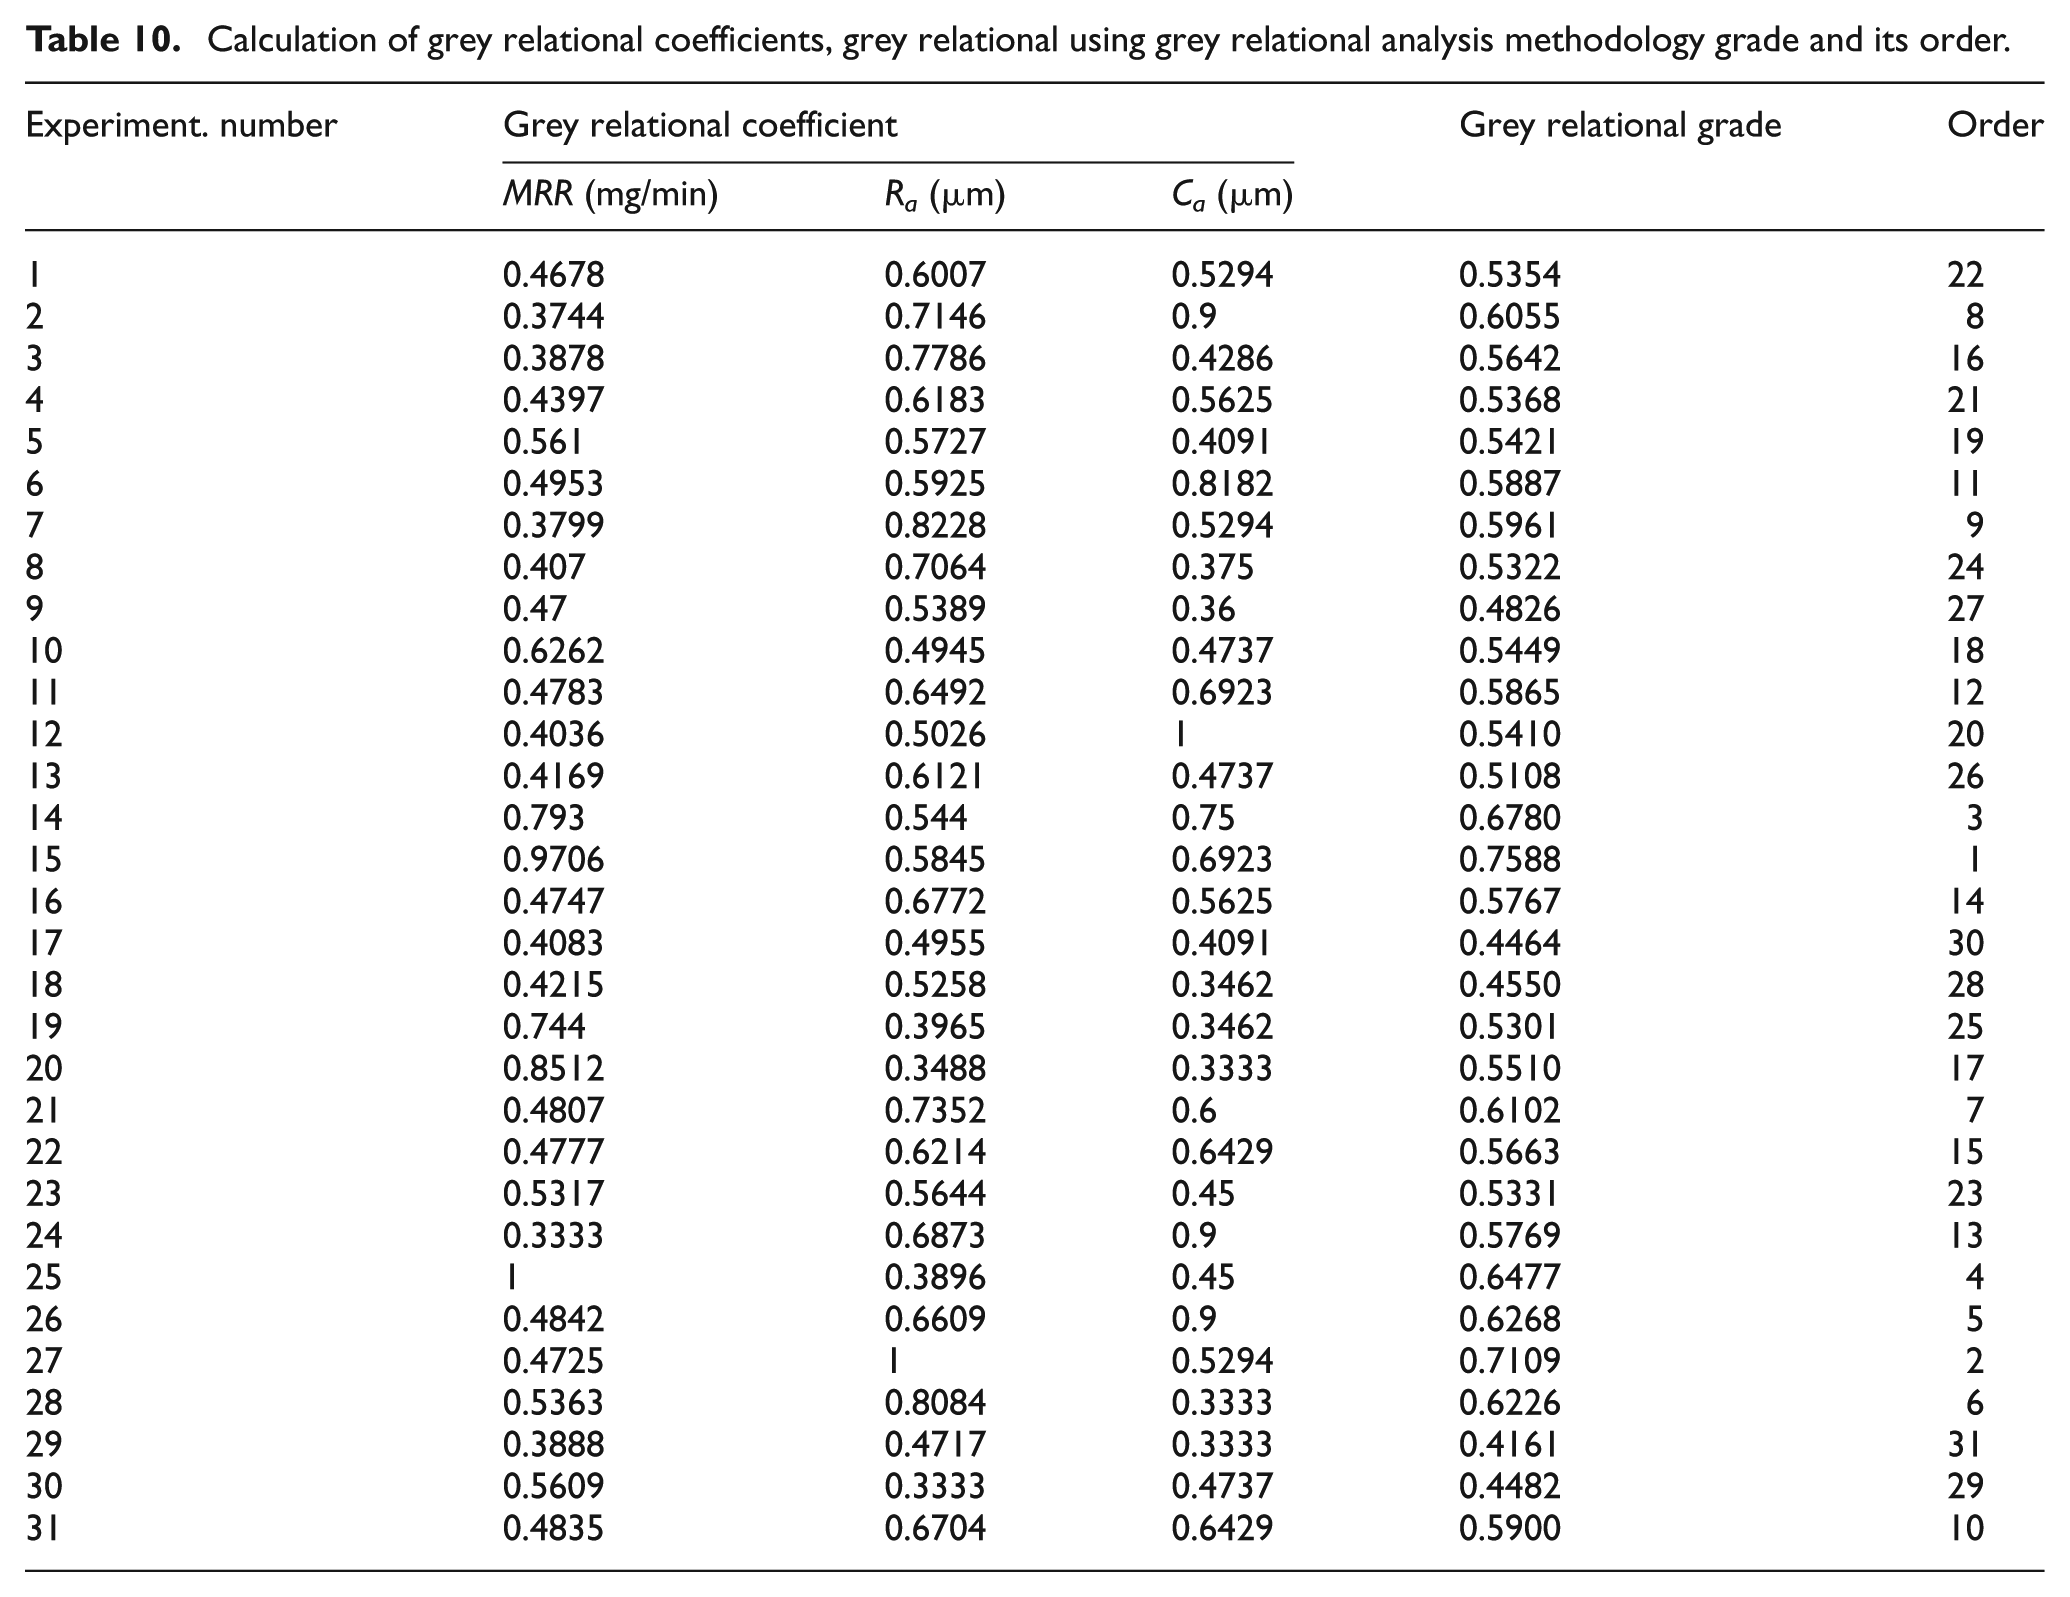
Calculation of grey relational coefficients, grey relational using grey relational analysis methodology grade and its order.
Calculations of eigenvalues and explained variation for principal components.
Calculations of eigenvectors for principal components.
Calculation for the contribution of each individual quality characteristic for the principal component.
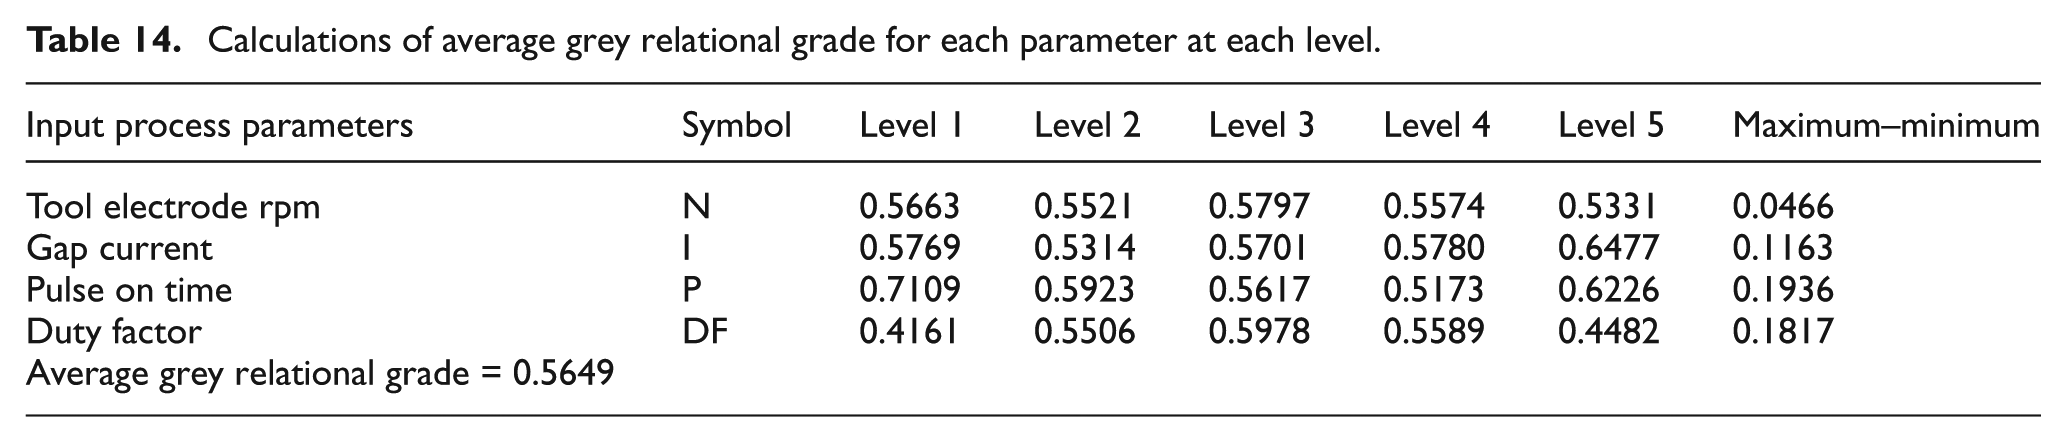
These calculated contributive values of MRR, Ra and Ca are multiplied to respective column of grey relational coefficient (Table 10) and added together to give grey relational grade as shown in column 5 of Table 10. Thereafter, grey relational grade of each input parameter for each level was calculated, and maximum value of grey relational grade was taken as optimized value of each input parameter, which was obtained as corresponding to N3I5P1DF3, as shown in Table 14. It is being concluded from the last column of Table 14 that highest significant contributing parameter is pulse on time with highest difference value of grey relational grade of 0.1936 followed by 0.1817 of duty factor, 0.1163 of gap current and 0.0466 of tool rpm.
Calculations of average grey relational grade for each parameter at each level.
Confirmation of the experiment
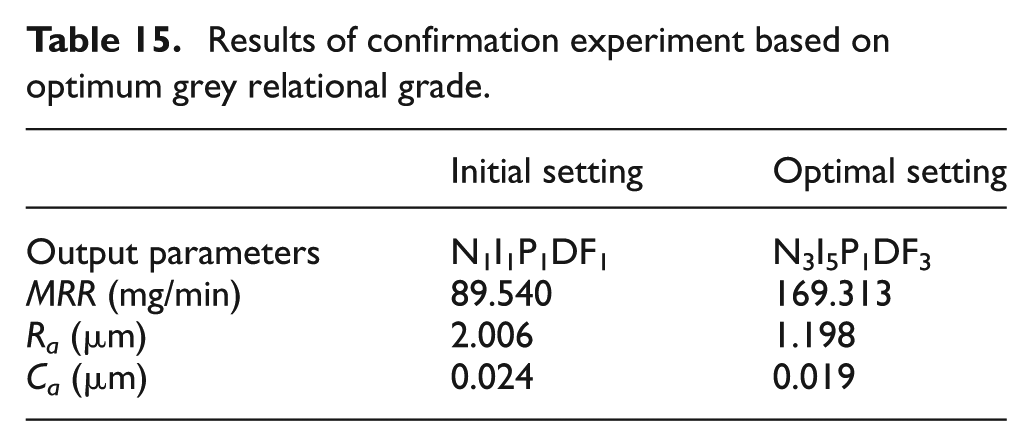
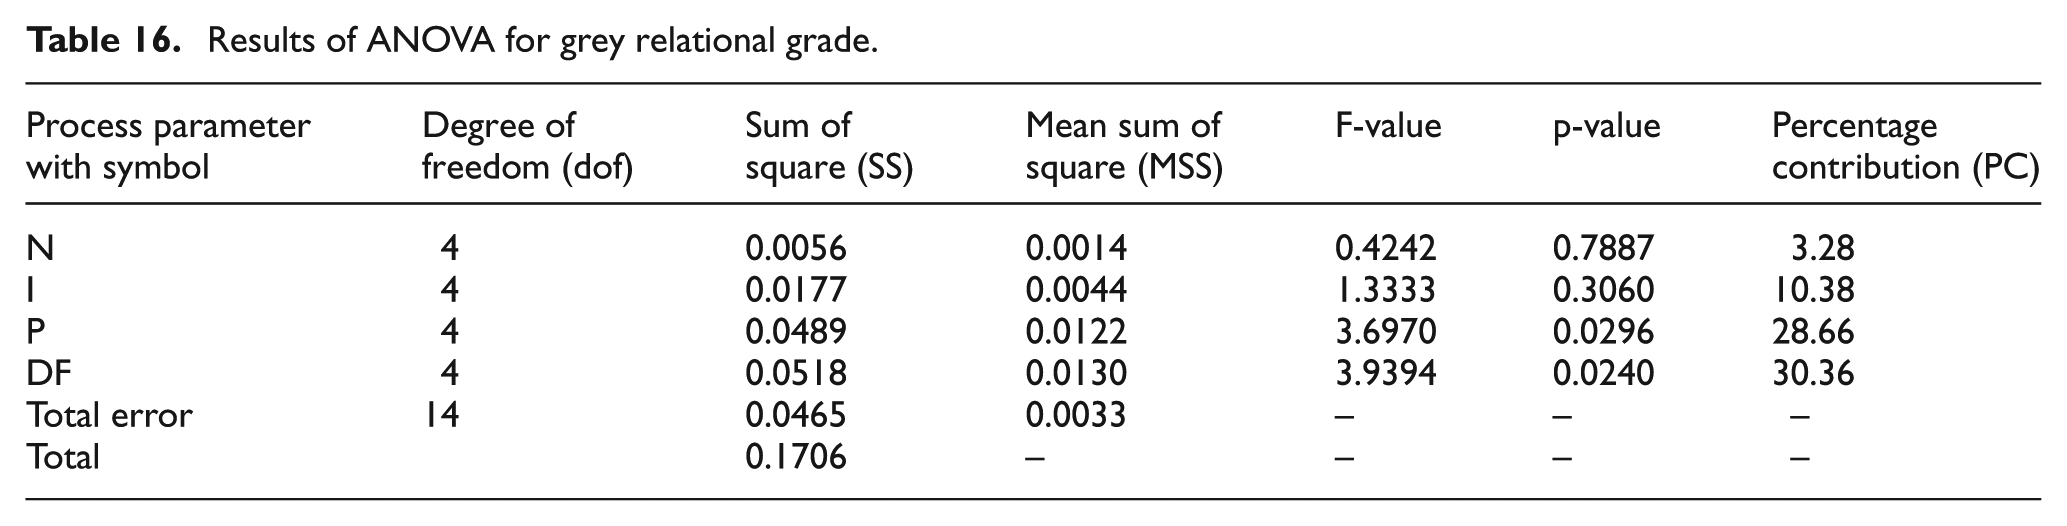
Experiments have been conducted to confirm the viability of MOO process by EDD with application of hybrid methodology RSMGRA and obtained value of output parameters is shown in Table 15. It is observed that MRR, Ra and Ca improved by 82.27%, 39.28% and 25.00%, respectively, against the values of initial setting, as shown in Table 15. Hence, the viability of using RSMGRA for MOO is proved for EDD process of considered aerospace material. Also the p-value of each process parameter is shown in Table 16. From this table, it is also observed that the percentage contribution (PC) on the process performance by tool rpm, gap current, pulse on time and duty factor are 3.28%, 10.38%, 28.66% and 30.36%, respectively
Results of confirmation experiment based on optimum grey relational grade.
Results of ANOVA for grey relational grade.
Micrographical analysis
Micrographical analysis of two work specimens (machined surface) pertaining to initial and optimal set values is done, the resulting micrographs of which are shown in Figures 11 and 12. It is observed from Figure 11 that the surface texture of specimen has regular bubble formations with deep shrinkage. This is because of poor thermal conductivity of material, which resulted in nonuniform distribution of heat energy into work specimen. However, at optimal values of input process parameters (obtained with hybrid approach), the formed bubbles seem to be flatten/collapsed with micro craters, as shown in Figure 12. This is because at high value of gap current (10 A), intensity of heat energy has increased which resulted in the enhanced melting and formation of vapour bubbles. However, as the rpm of the tool electrode increases, the formed vapour bubbles collapse. These facts are also substantiated with the obtained improved results of MRR, Ra and Ca.
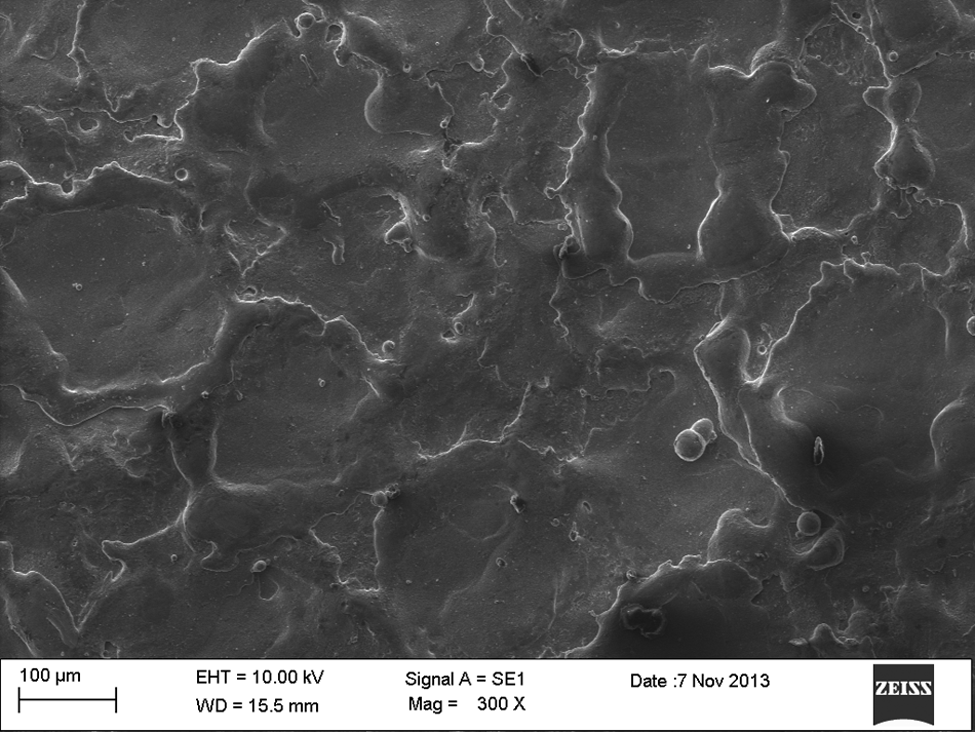
SEM micrograph at 300× of initial set values N = 400 r/min, I = 4 A, P = 60 µs, DF = 54%.
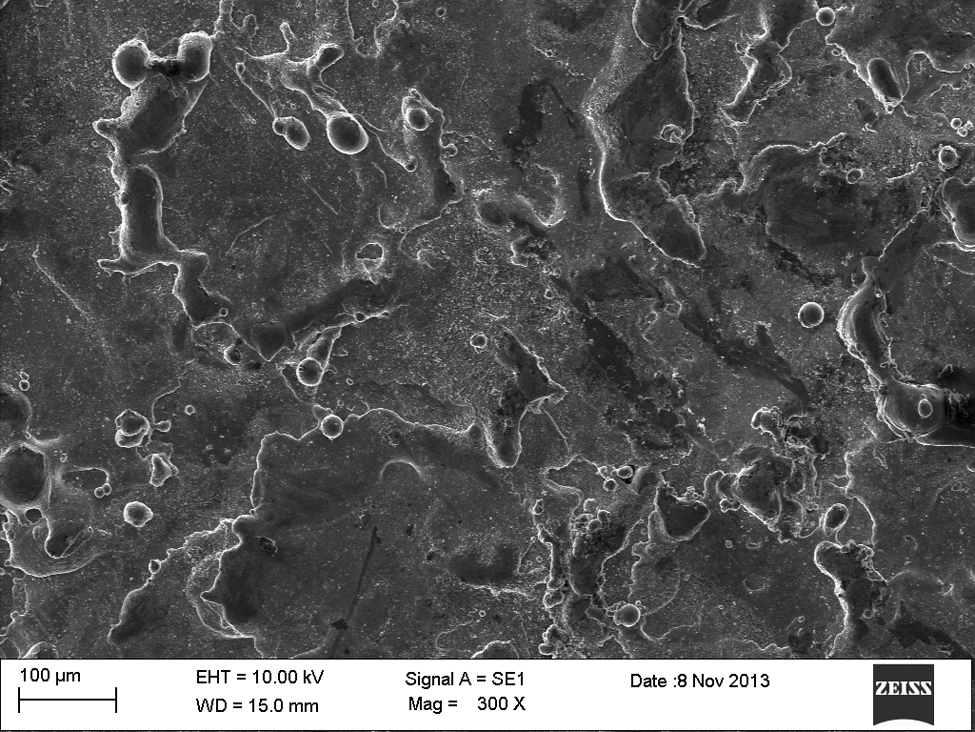
SEM micrograph at 300× of initial set values N = 700 r/min, I = 0 A, P = 40 µs, DF = 54%.
Conclusion
The present experimental work deals with a hybrid approach of study consisting of modeling with TMRSM and MOO with RSMGRA (RSM coupled with PCA-based GRA) in EDD. The authors have surveyed the available literatures on EDM as well as rotating EDM and they found that various methodologies have been used by the authors but could not find any single study pertaining to the presently used hybrid methodology. Therefore, the authors have attempted to examine the feasibility of using it, and found encouraging results. Based on surveyed literatures and obtained results, the following conclusions can be drawn:
The developed TMRSM-based second-order response surface model is found to be adequate for MRR, Ra and Ca with 99% confidence. It is also noted that linear effect of input parameters is found to be significant for all the three responses.
It is observed from the developed TMRSM model that all other factors have significant effects on MRR except the square effect of duty factor, interactive effects of tool rpm with duty factor, gap current with pulse on time and pulse on time with duty factor. Model also indicates that except square effects of pulse on time and interaction effect of gap current with duty factor, other factors do have the significant effect on Ra. It is also perceived from the model that all other factors have significant effects on Ca, except the duty factor, interactive effects of tool rpm with gap current, tool rpm with pulse on time, tool rpm with duty factor and gap current with duty factor.
It is observed that with the use of TMRSM for modeling and RSMGRA for MOO, the study has proved to be encouraging with the fact that in the study, MRR increased by 82.27%, Ra improved by 39.28% and Ca improved by 25.00%.
The obtained values of Ra and Ca (as per optimal setting of MOO) are very nominal with 1.198 and 0.019 µm, respectively. This surface roughness is due to re-casting of thermally infested layers and can be easily removed by light grade emery paper. Also the obtained value of Ca (0.019 µm) is comparatively better than twist drills.
With the present experiments, it is being substantiated with the facts that concept of introducing the tool rotation in sinking EDM may be further explored by future researchers for the benefit of manufacturing industries.
Footnotes
Appendix 1
Acknowledgements
The authors are thankful to Mr Ram Singar Yadav, Research Scholar, Mechanical Engineering Department, MNNIT Allahabad, Uttar Pradesh, India, who has helped during experimentation.
Declaration of Conflicting Interests
The author(s) declared no potential conflicts of interest with respect to the research, authorship, and/or publication of this article.
Funding
The author(s) received no financial support for the research, authorship, and/or publication of this article.