
Abstract
Optical K9 glass has been used in a variety of applications, including optics, electronics, thermodynamics, and fluidics. It has been regarded as a difficult-to-cut material because of its superior mechanical properties. Rotary ultrasonic machining using cutting fluid has been used successfully to machine many different types of brittle materials, such as ceramics, sapphire, and optical K9 glass. Dry machining has been successfully employed in the machining of some materials. However, there are no reported investigations on the rotary ultrasonic machining of optical K9 glass using compressed air as a coolant. This article, for the first time, investigates the rotary ultrasonic machining of optical K9 glass using compressed air as a coolant. The experimental investigations focus on the effects of the input variables (ultrasonic power, spindle speed, and feedrate) on the output variables (edge chipping size, cutting force, surface roughness, and ultrasonic power consumption).
Keywords
Introduction
Optical K9 glass is an outstanding functional material in many applications, including optics, electronics, thermodynamics, and fluidics. Because of its mechanical properties, such as high hardness, high strength, and low fracture toughness, it is regarded as a difficult-to-cut material. The machining of optical glass has attracted the attention of many researchers. 1 The current traditional machining methods used for optical glass include cutting, grinding, milling, and lapping. Fang and Chen 2 have conducted experimental investigations of ultra-precision cutting for optical glass and explored the removal mechanism of brittle materials. Belkhir et al. 3 investigated the surface behavior during abrasive grain action in the glass lapping process and reported that the glass material removal rate (MRR) during lapping depends on the cumulative actions of the individual grains. Gu et al. 4 presented a study on the horizontal surface grinding of optical glass BK7 using diamond grinding wheels and discussed the different material removal modes and the characteristics of the surface morphologies. Arif et al. 5 introduced the milling process into the ductile mode machining of optical glass and presented an analytical model to predict the critical feed per edge.
Some nontraditional machining processes have been applied to optical glass, such as abrasive water jet machining, electrolytic in-process dressing grinding, and so on. Park et al. 6 conducted an experiment on the micro-grooving of glass using micro-abrasive jet machining. They concluded that micro-abrasive jet machining could be effectively applied to the micro-machining of hard and brittle materials used for semiconductors, electronic devices, and so on. Matsumura et al. 7 applied abrasive water jet machining to micro-machining and the fluid polishing of glass. A crack-free surface was finished using stagnation generated under the jet nozzle. Cheema et al. 8 reviewed the developments in abrasive flow machining. They mainly discussed the research on experimental investigations using abrasive flow machining variants and media. Mulik and Pandey 9 reported experimental investigations and optimization of ultrasonic-assisted magnetic abrasive finishing process. In addition, a study on the electrolytic in-process dressing grinding of optical glass showed that the electrolytic in-process dressing grinding could be an effective ultra-precision grinding process for hard and brittle materials. 10
Rotary ultrasonic machining (RUM), a nontraditional machining process, is a hybrid process that combines the material removal mechanisms of diamond grinding and ultrasonic machining. 11 The cutting tool is ultrasonically vibrated in the axial direction during processing, and the motion of the diamond particles on the diamond tool is a combination of rotation, ultrasonic vibration, and feeding. The machining process becomes milling if the feeding direction of the tool is perpendicular to the spindle axis and drilling if the feeding direction of the tool is parallel to the spindle axis; an illustration of the RUM process is shown in Figure 1.
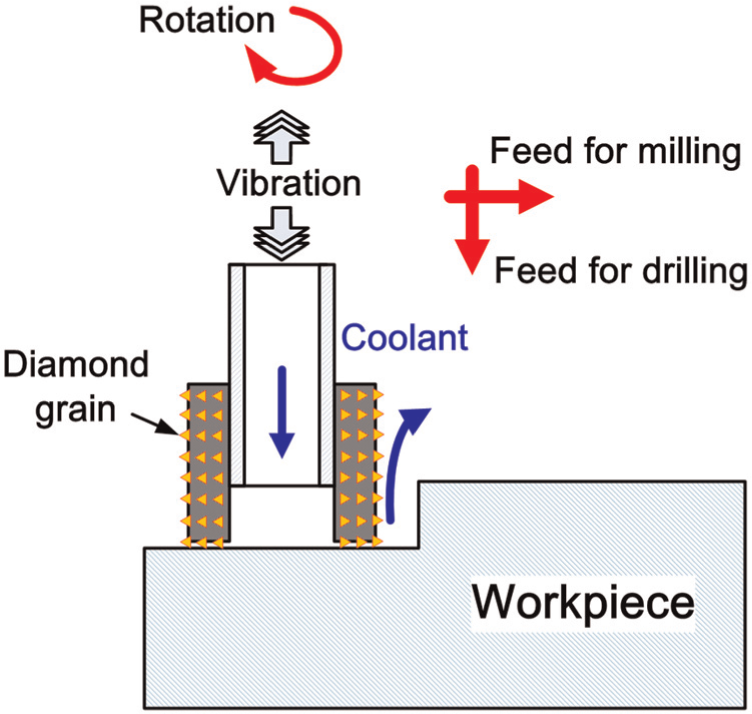
An illustration of the RUM process. 11
Since RUM was developed in the 1960s, it has been used to machine many different types of brittle materials, such as ceramics, silicon, and glass. Pei et al. 12 presented the modeling of the MRR in the RUM of ceramics, and Hu et al. 13 studied the relationships between the MRR and the controllable machining parameters based on the model. They also stated that the RUM process can result in higher MRRs than those obtained by diamond grinding. Li et al. 14 reported a feasibility study on the RUM of ceramic matrix composites, and Cong et al. 15 discussed edge chipping in the RUM of silicon. They showed that the RUM process can effectively reduce the edge chipping size. An investigation of the kinematic view of the tool life in the RUM of hard and brittle materials was conducted. 16 Furthermore, Zhang et al. studied the RUM of optical glass. The literature review shows that compared with traditional machining processes, RUM has many advantages, including a smaller cutting force, a smaller edge chipping size, less subsurface damage, and less tool wear. 17
Using cutting fluids as coolants can improve the machinability of materials and enhance machining performance, which has been acknowledged since early in the 20th century. 18 A review showed that using cutting fluids as coolants in machining can reduce the friction and heat generated during the machining process, improve the quality of the machined surface and the tool life, and promote the removal of chips. 19 However, using cutting fluids as coolants in machining has resulted in some problems. First, the costs of cutting fluids, consisting of the deployment and disposal costs, account for approximately 10%-20% of the manufacturing costs. 20 Second, cutting fluids containing chlorine, sulfur, and phosphorus have a great impact on the environment. 21 In addition, some cutting fluids are also hazardous to the operator’s health.
The dry machining process was developed to reduce the problems caused by using cutting fluids as coolants. Studies have shown that dry machining using compressed air as a coolant can achieve satisfactory performance under certain machining conditions. Su et al. investigated the effects of cutting using compressed cooling air on tool wear, surface roughness, and chip shape in the machining of difficult-to-cut materials. They showed that cooling air machining is not only environmentally friendly but also a great improvement in the machinability of difficult-to-cut materials. 22 A feasibility study on the dry machining of Ti–6Al–4V alloy and the effects of cooling air temperature on machining performance was presented. 23 Nguyen and Zhang assessed the application of cold air and oil mist in surface grinding. They showed that using compressed air as a coolant can reduce the grinding force in the surface grinding of carbon steel. 24 However, there are few reports on using compressed air as a coolant in the RUM process. Cong et al. 25 reported that the RUM of carbon fiber–reinforced plastic (CFRP) using compressed cold air as a coolant is feasible under certain processing parameters. A comparison between the RUM of CFRP using cutting fluid as a coolant and using compressed cold air as a coolant has been made. 26
There are many reported experimental investigations on the RUM of optical K9 glass using cutting fluids as coolants. Lv et al. presented surface observations and material removal mechanisms for the RUM of optical K9 glass. They also conducted a series of experimental studies on the RUM of optical K9 glass. 27 However, there is no report on the RUM of optical K9 glass without using cutting fluids as coolants. This article, for the first time, presents an experimental study on the RUM of optical K9 glass using compressed air as a coolant. It reports the effects of the input variables (ultrasonic power, spindle speed, and feedrate) on the output variables (edge chipping size, cutting force, surface roughness, and ultrasonic power consumption). There are four sections in this article. Following this introduction section is section “Experimental conditions and measurement procedures,” which describes the experimental conditions and measurement procedures. Section “Experimental results and discussion” shows and discusses the experimental results. Finally, the conclusions are summarized in section “Conclusion.”
Experimental conditions and measurement procedures
Experimental setup
The experiments were conducted on a rotary ultrasonic machine (Series 10; Sonic-Mill, Albuquerque, NM, USA). Figure 2 shows the experimental setup. It primarily consisted of an ultrasonic spindle system, cutting force and power consumption measurement systems, and a compressed air cooling system. The ultrasonic spindle system was composed of an ultrasonic spindle, a power supply, and a control panel. The power supply converted conventional line voltage to 20 kHz of electrical energy. This high-frequency electrical energy was supplied to a piezoelectric converter that changed the high-frequency electrical energy to mechanical vibration. The ultrasonic vibration from the converter was amplified and transmitted to the cutting tool. This caused the cutting tool to vibrate at a frequency of 20 kHz. The amplitude of the ultrasonic vibration could be adjusted by changing the setting of the output control of the power supply. The vibration direction of cutting tool is axial during processing (shown in Figure 2). A motor (SJ-PF; Mitsubishi Electric Corp., Tokyo, Japan) attached atop the ultrasonic spindle supplied the rotational motion of the tool, and different speeds could be obtained by adjusting the motor speed controller.
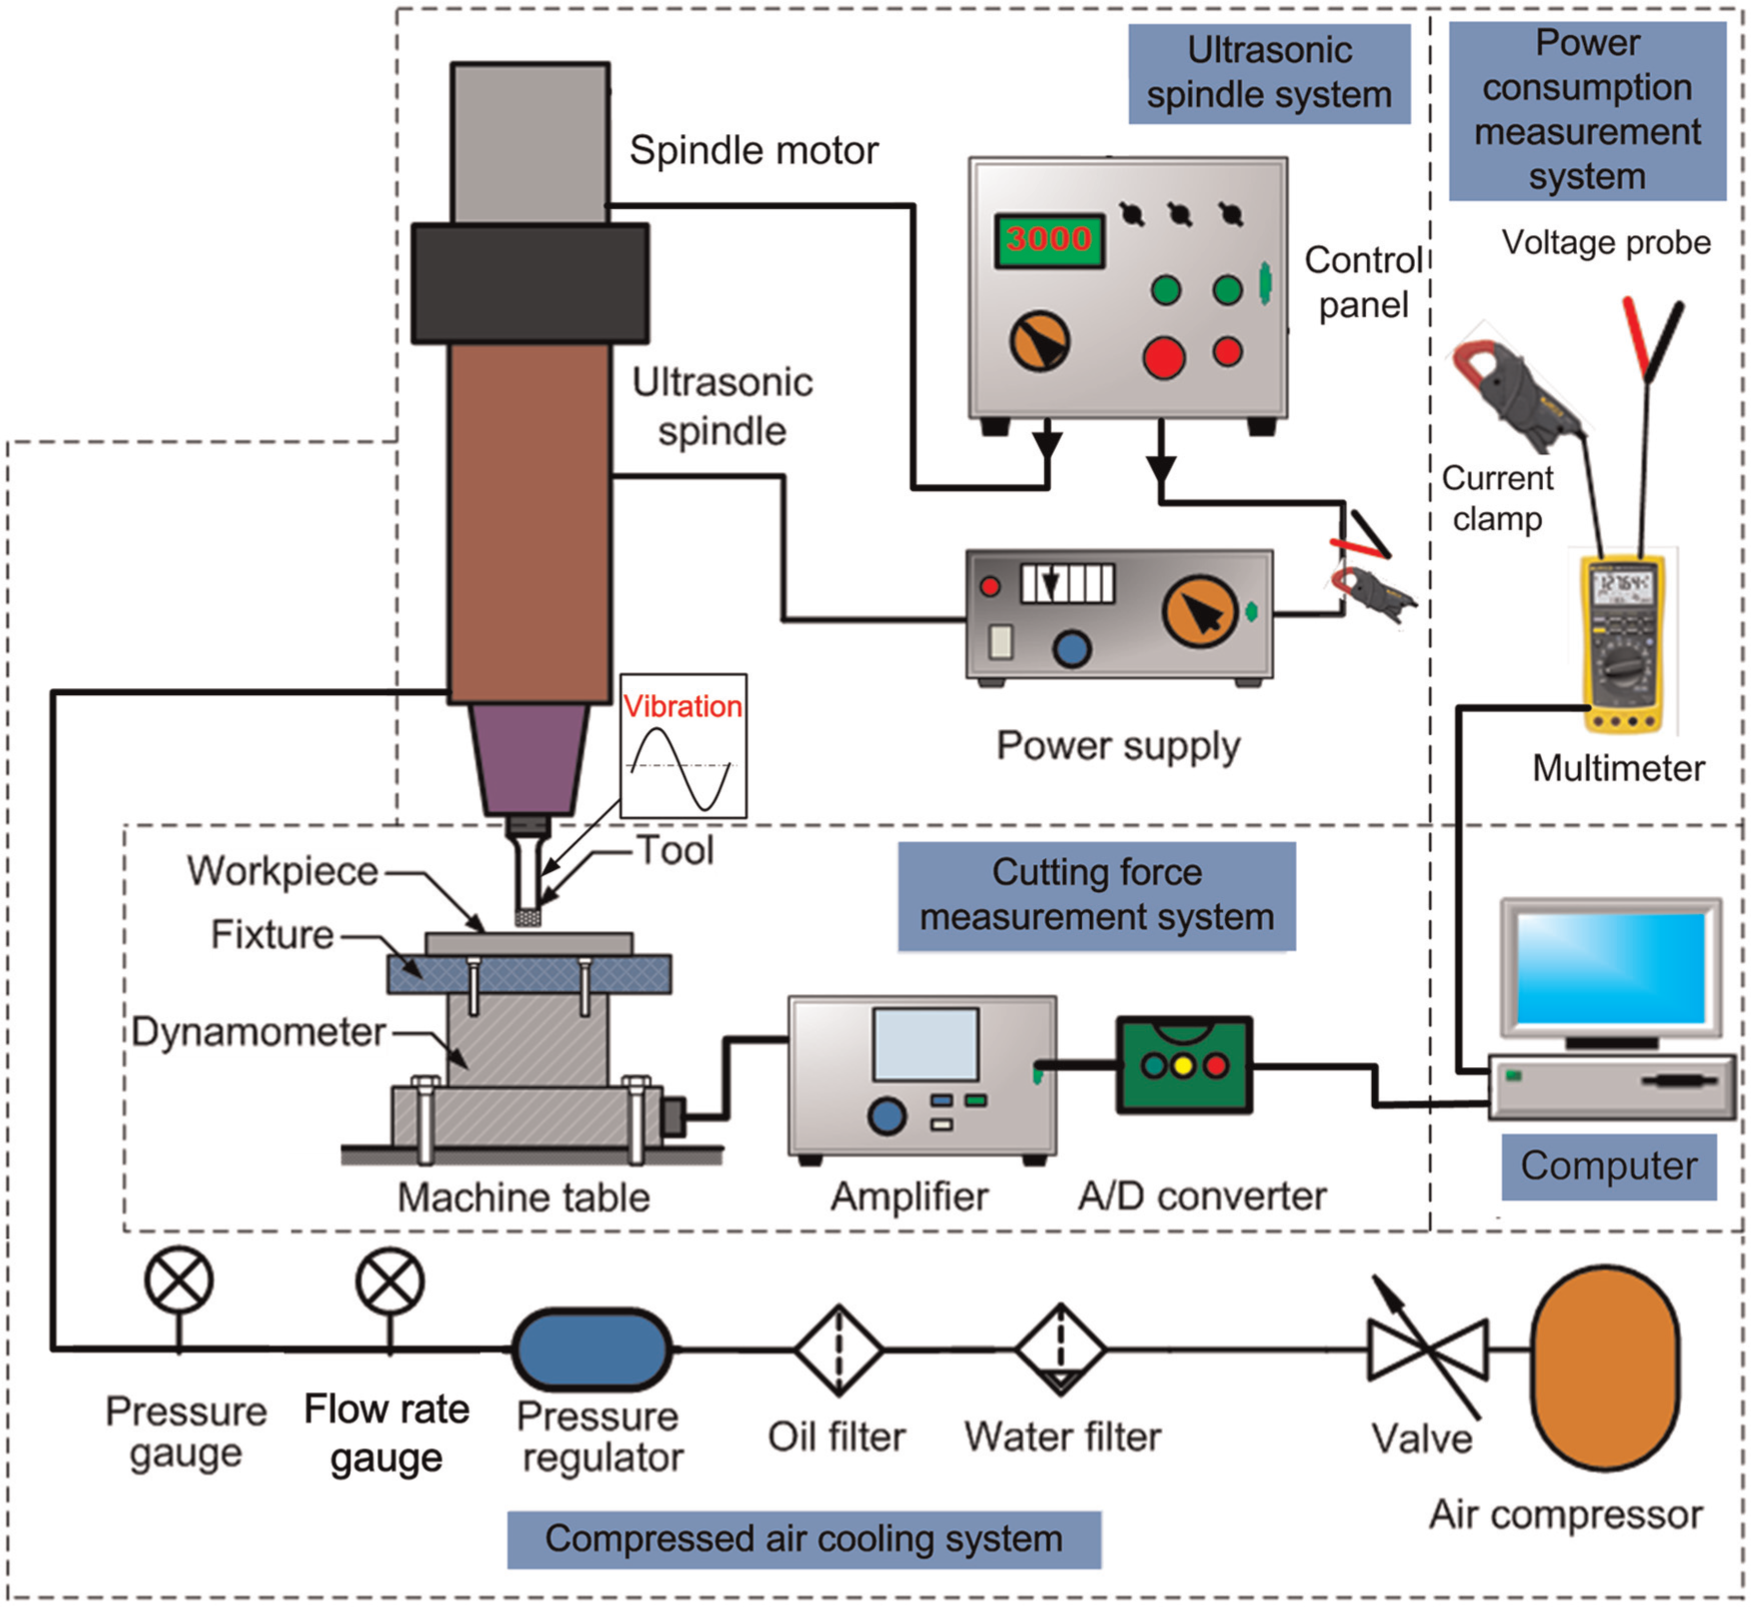
Experimental setup.
The compressed air cooling system included an air compressor, a pressure regulator and valve, and a pressure gauge. The cooling system provided compressed air to the spindle and the interface of the machining.
There are two measurement systems: the cutting force measurement system and the ultrasonic power consumption measurement system. The cutting force measurement system consisted of a dynamometer, a charge amplifier, an analog-to-digital (A/D) converter, and a computer with software. The ultrasonic power consumption measurement system consisted of a current clamp, a voltage probe, a multimeter (Model 189; Fluke Crop., Everett, WA, USA), and a computer with the software FlukeView Forms (Version 3.4; Fluke Crop.). The sampling rates of the current and the cutting force were set at 1 and 100 Hz, respectively. More details about these two systems will be presented in section “Measurement procedures for the output variables.”
The workpiece was optical K9 glass with dimensions of 40 mm × 30 mm × 5 mm. The cutting tool was a metal-bonded diamond core drill with two slots (NBR Diamond Tool Corp., LaGrangeville, NY, USA). The outer and inner diameters (OD and ID) of the cutting tool were 9.54 and 7.34 mm, respectively, and the tuning length was 45 mm. The diamond abrasives had a mesh size of 180 and a concentration of 100. The metal bond was of the B type.
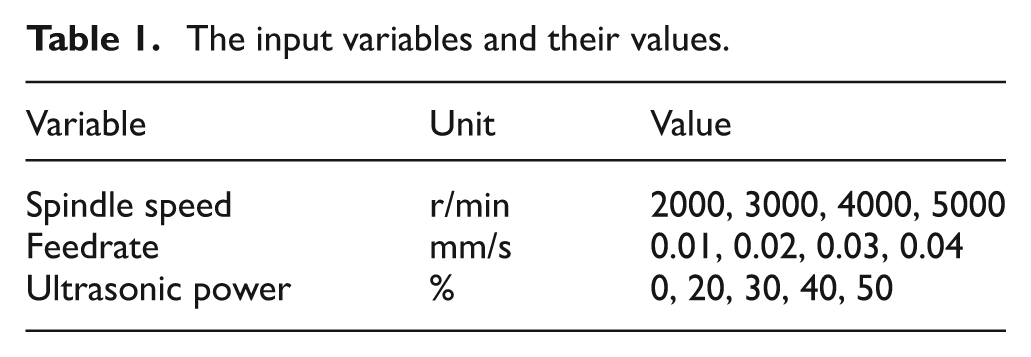
The experiments focused on studying the following input variables.
Spindle speed. The rotational speed of the cutting tool.
Feedrate. The feedrate of the cutting tool.
Ultrasonic power. The percentage of power from the ultrasonic power supply controlling the ultrasonic vibration amplitude. Figure 3 illustrates the relationship between the ultrasonic power and the vibration amplitude. The vibration amplitude measurement in RUM was reported by the research group. 28 There was almost a linear relationship between the ultrasonic power and the ultrasonic vibration amplitude, and higher ultrasonic power will produce higher ultrasonic vibration amplitude. 28
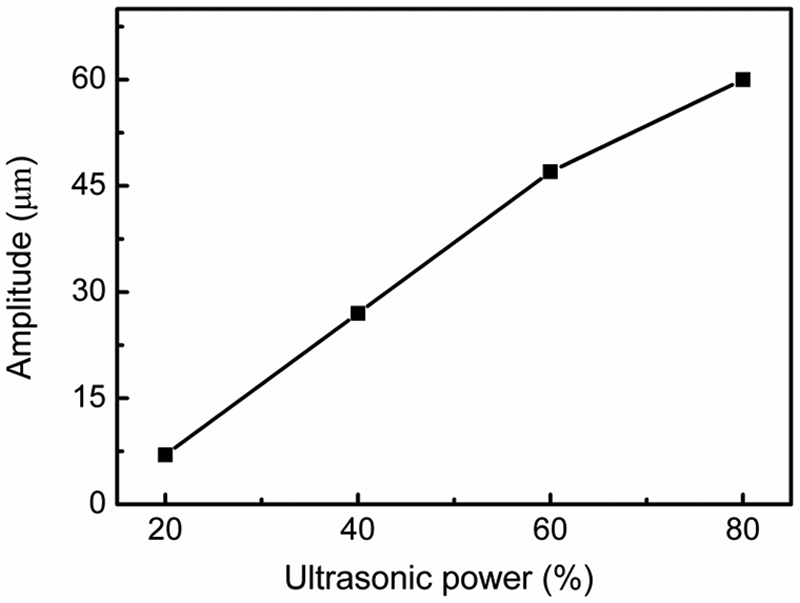
Relationship between the ultrasonic power and the vibration amplitude.
The input variables and their values are listed in Table 1. Only one variable was changed at a time. The pressure and the flow rate of the compressed air were maintained at 30 lbf/in2 and 1.5 L/min, respectively. Two holes were drilled under each machining condition.
The input variables and their values.
Measurement procedures for the output variables
A dynamometer (Model 9272; Kistler, Inc., Winterthur, Switzerland) was used to measure the cutting force, and it was set on the machine table and beneath the workpiece. The electrical signals from the dynamometer were amplified by a charge amplifier (Model 5070A; Kistler, Inc.) and transformed into digital signals by an A/D converter. After being processed by a signal conditioner, the digital signals were saved on a computer by a data acquisition card (PC-CARD-DAS16/16; Measurement Computing Corporation, Norton, MA, USA) with the help of the software DynoWare (Type 2815A; Kistler, Inc.). The cutting force reported in this article was the mean value of the cutting force in the axial direction of the tool during the RUM experiments.
The surface roughness was measured on the cylindrical surfaces of the machined holes. A surface profilometer (Surftest-402; Mitutoyo Corporation, Kanagawa, Japan) was used with the tested range set at 1.6 mm. The surface roughness in this study was characterized by the average surface roughness (Ra). The roughness was measured at two locations along the axial direction of the hole: the entrance and the exit. At each location, two measurements were performed. Each measurement was repeated twice. The mean value of the measured Ra was used.
An optical microscope (BX51; Olympus America, Inc., Melville, NY, USA) and a vernier caliper (Model IP-67; Mitutoyo Corporation) were used to inspect and evaluate the edge quality on the exit side of each machined hole. The edge chipping size was chosen to evaluate the edge quality. Figure 4 shows the process of determining the chipping size. More details can be found in the literature. 14
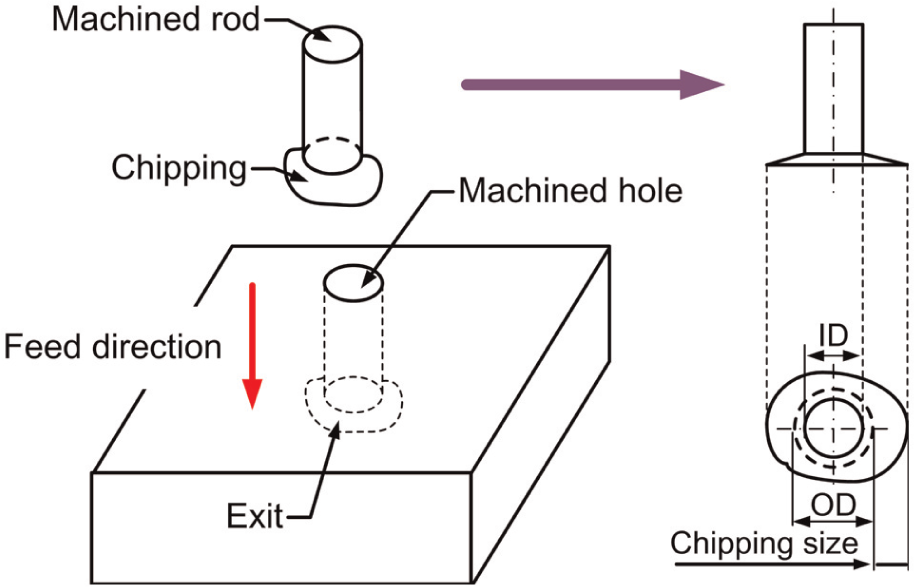
Illustration of the edge chipping size.
The power consumption was the electricity energy (W) consumed by drilling 1 mm into the workpiece. It was calculated using

where Wu is the power consumption of the ultrasonic power supply (W h/mm), Uu is the actual electrical voltage of the ultrasonic power supply (V), Iu is the measured current of the ultrasonic power supply during machining (A), and F is the feedrate (mm/s).
Experimental results and discussion
Edge quality
Figure 5 shows pictures of a machined hole and rod using RUM. Figure 6 presents the machining results of an optical K9 glass workpiece without ultrasonic vibration (called diamond drilling below), where Figure 6(a) is the picture of the machined hole and Figure 6(b) is the cutting force curve during the machining process. The hole cannot be drilled successfully using compressed air as coolant when the ultrasonic power is at 0%. Figure 5(a) and (b) shows that edge chipping at the entrance of the hole is better than that produced at the exit of the hole. Figure 5(c) shows the machined rod during the processing since the used diamond tool is a hollow drilling tool.
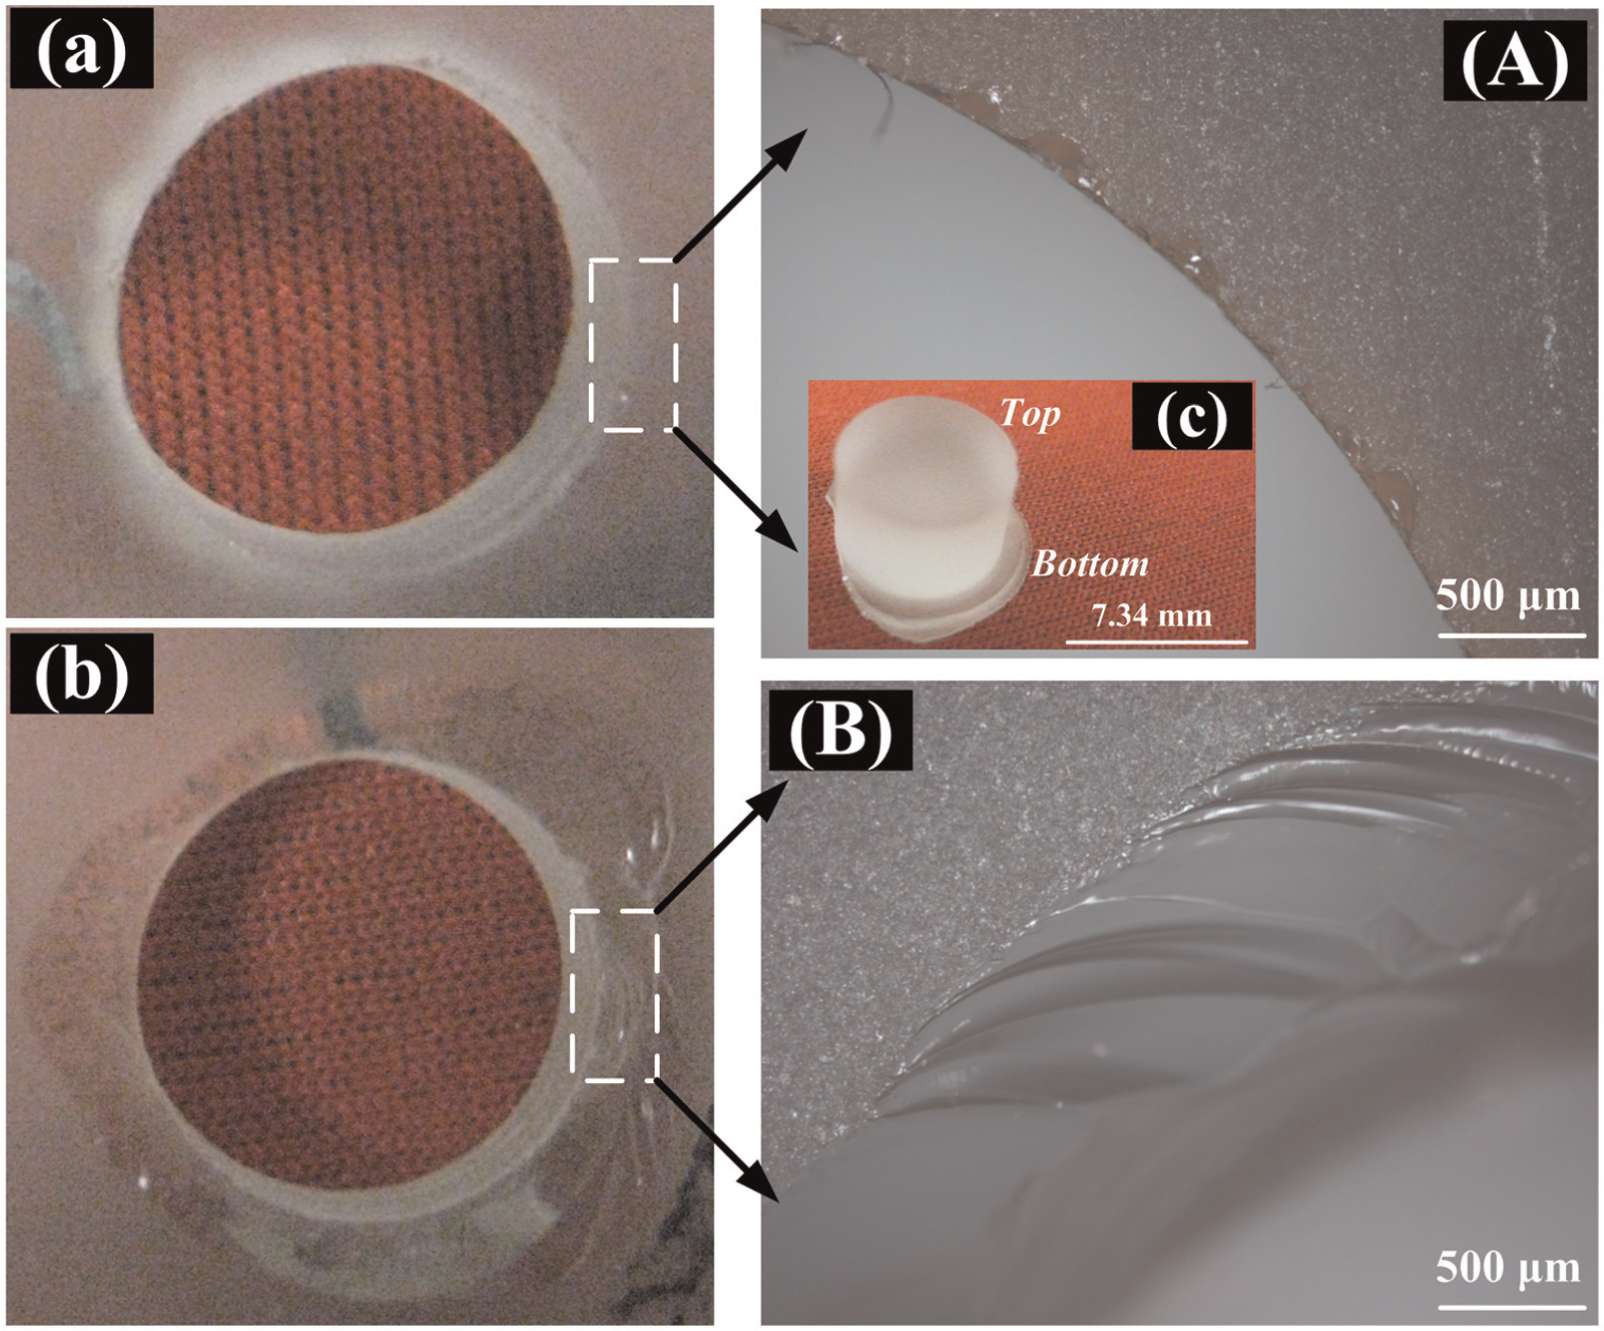
Pictures of the machined hole and rod: (a) entrance, (b) exit, (c) machined rod: (A) a magnified view of the entrance marked in (a) and (B) a magnified view of the exit marked in (b) (ultrasonic power = 30%, spindle speed = 3000 r/min, and feedrate = 0.02 mm/s).
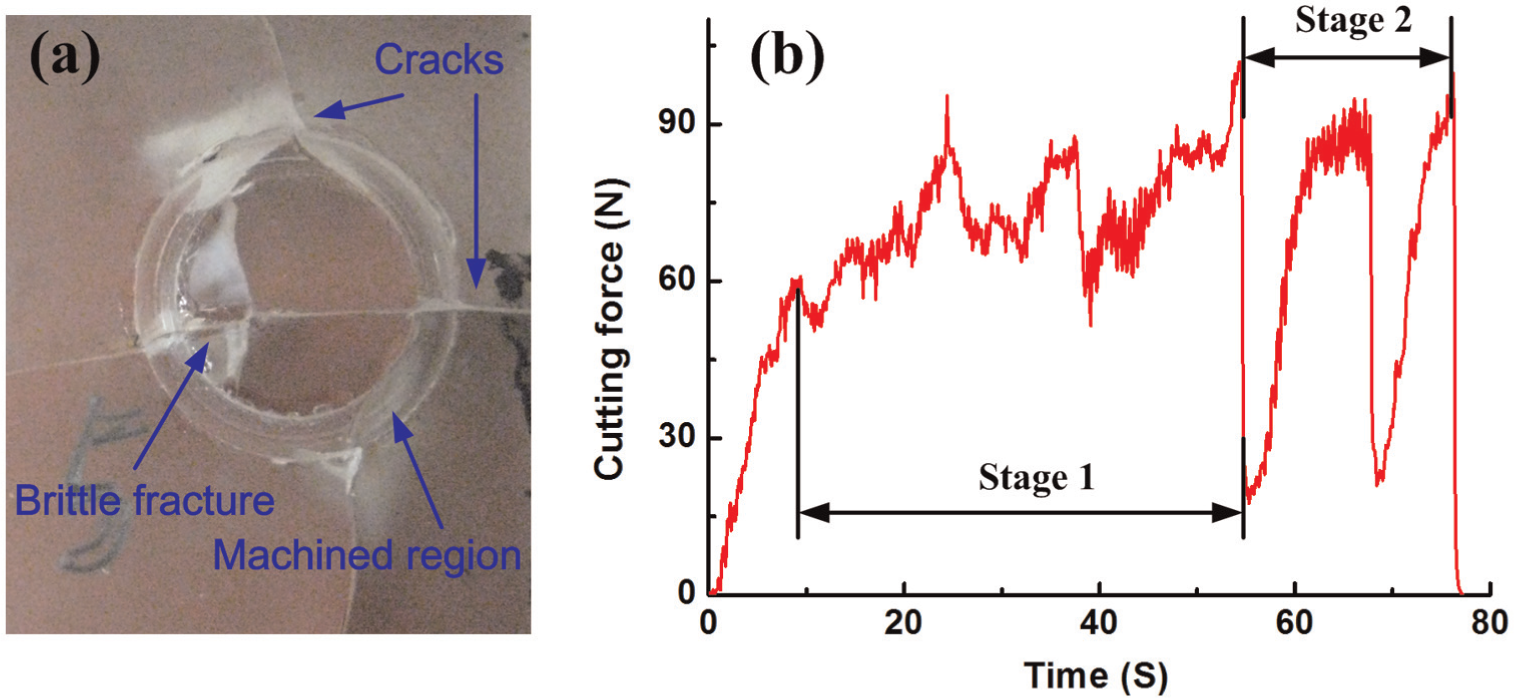
Machining results without ultrasonic vibration: (a) machined hole and (b) cutting force curve (ultrasonic power = 0%, spindle speed = 3000 r/min, and feedrate = 0.02 mm/s).
Two stages of the cutting force curve are induced in the diamond drilling, as shown in Figure 6(b). The cutting force of the first stage is relatively stable, which means that this stage is an effective machining process, and the stage at which the machined region is produced (see Figure 6(a)). The cutting force shows a strong fluctuation in the second stage, which means that serious cracks are induced, and the brittle fracture of the workpiece is generated during this stage (see Figure 6(a)), which results in damage to the workpiece and failure to produce a hole.
In drilling hard–brittle materials (such as ceramics and glass), edge chippings (chipping thickness and chipping size) are important criteria to evaluate the hole quality because they influence the component quality or the positioning accuracy during assembly. Figure 7 shows the effects of the ultrasonic power, spindle speed, and feedrate on the edge chipping size. This figure also shows that the change of the edge chipping size is not monotonic with an increase in the ultrasonic power. The chipping size decreases slightly when the ultrasonic power increases from 20% to 40%, but it significantly increases when the ultrasonic power increases from 40% to 50%. A hole cannot be drilled when the ultrasonic power is at 0%. As illustrated in Figure 7(b) and (c), the chipping size decreases with an increase in the spindle speed and a decrease in the feedrate. The feedrate has a more significant influence on the edge chipping size compared to the ultrasonic power and the spindle speed within the ranges tested.
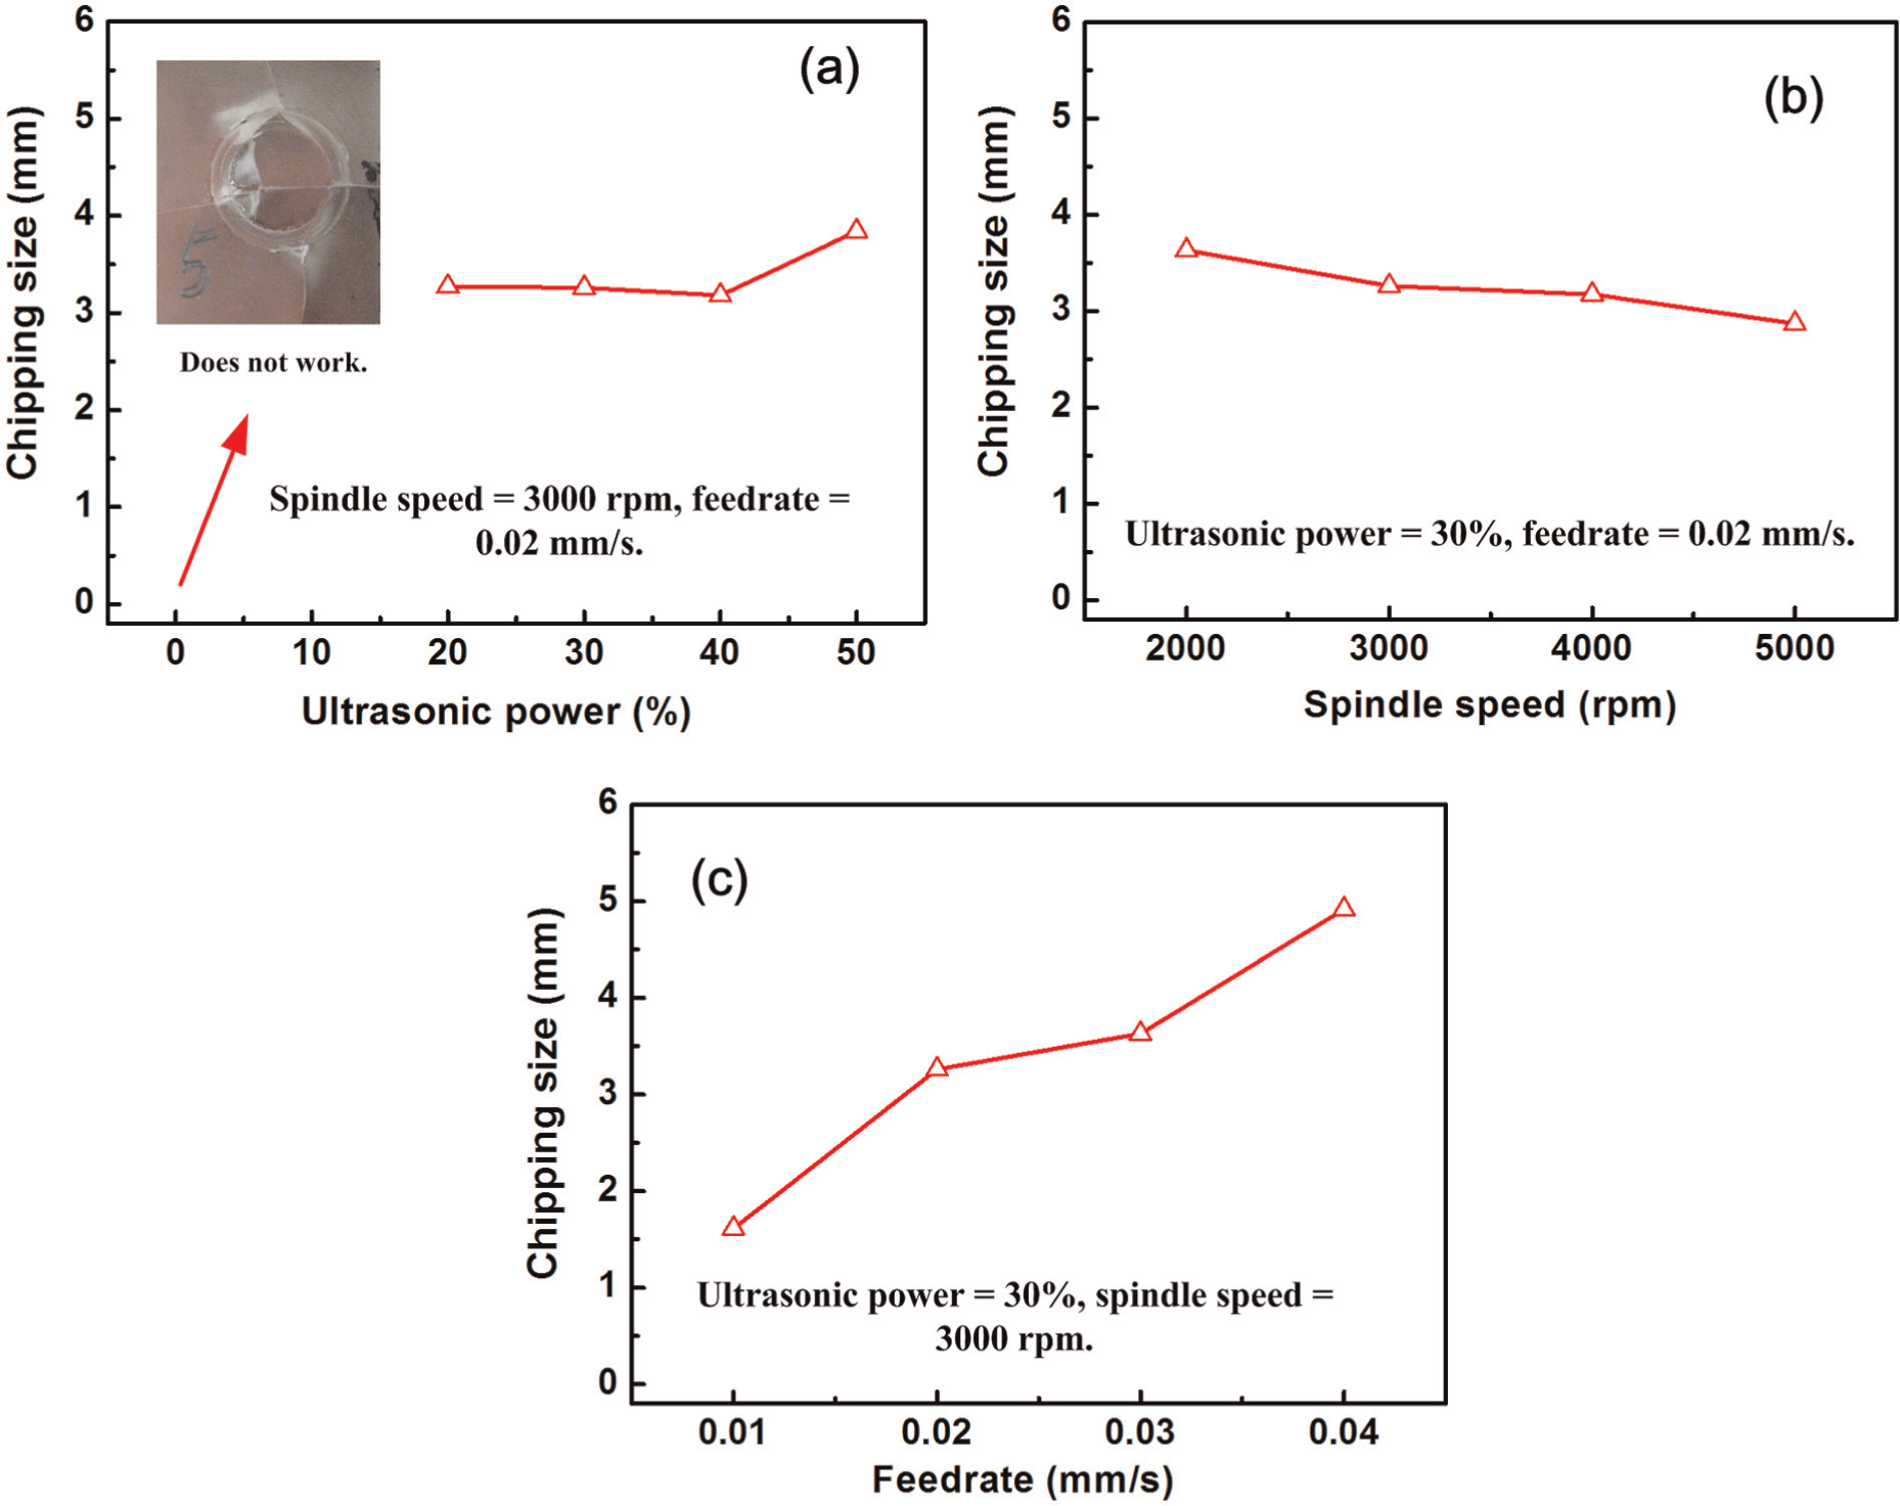
The effects of (a) the ultrasonic power, (b) the spindle speed, and (c) the feedrate on the chipping size.
Since the edge chipping during the drilling of brittle materials is induced by the fracture failure of machined workpiece, the generating mechanism of edge chipping can be explained by analyzing the stress distribution of the contact area between diamond tool and workpiece. The stress distribution (σ) can be calculated as follows

where F is the axial cutting force (N) and Do and Di are OD and ID, respectively, of the tool separately (mm).
Equation (2) shows that the cutting fore has significant influence on the generation of edge chipping. Jiao et al. 29 reported an investigation on edge chipping in RUM of ceramics, which presented that larger edge chipping is almost always accompanied by a higher cutting force. Therefore, the cutting force features can be used to explain the behaviors of edge chipping, which is shown in the following. The changing trends of edge chipping in Figure 7(b) and (c) are consistent with that of cutting force appeared in Figure 9(b) and (c). However, the trends appeared in Figure 7(a) and Figure 9(a) are inconsistent, which may be because of the change of ultrasonic power. This phenomenon will be researched in our future work.
Cutting force
Figure 8 shows a comparison of the cutting force between the RUM process and diamond drilling (RUM without ultrasonic vibration). The machining conditions of Figure 8 for RUM and diamond drilling are as follows: the ultrasonic power is 0% and 30%, respectively; the spindle speed = 3000 r/min; the feedrate = 0.02 mm/s; the compressed air cooling has a pressure of 40 lbf/in2; and the flow rate is 1.5 L/min. Figure 8 shows that the RUM process of optical K9 glass using compressed air as a coolant can significantly reduce the cutting force compared to that induced in diamond drilling.
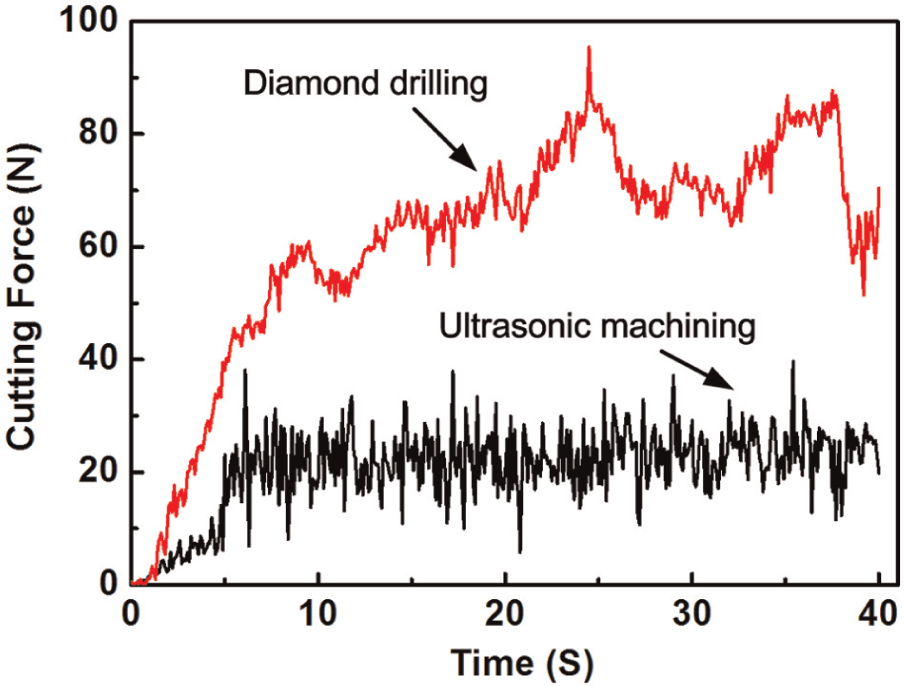
Comparison of the cutting force between RUM and diamond drilling.
The effects of the ultrasonic power, spindle speed, and feedrate on the cutting force are shown in Figure 9. Figure 9(a) presents the effects of the ultrasonic power on the cutting force. The cutting force decreases when the ultrasonic power increases from 0% to 50%. When the ultrasonic power increases from 0% to 20%, the cutting force decreases from 139.59 to 49.55 N. With a further increase in the ultrasonic power, the rate of decrease in the cutting force becomes small. The trend of the cutting force versus the increase in the ultrasonic power is consistent with that reported in the paper 26 for the RUM of CFRP using compressed air as a coolant. Figure 9 also shows that, compared to diamond drilling, the RUM of optical K9 glass using compressed air as a coolant can significantly reduce the cutting force.
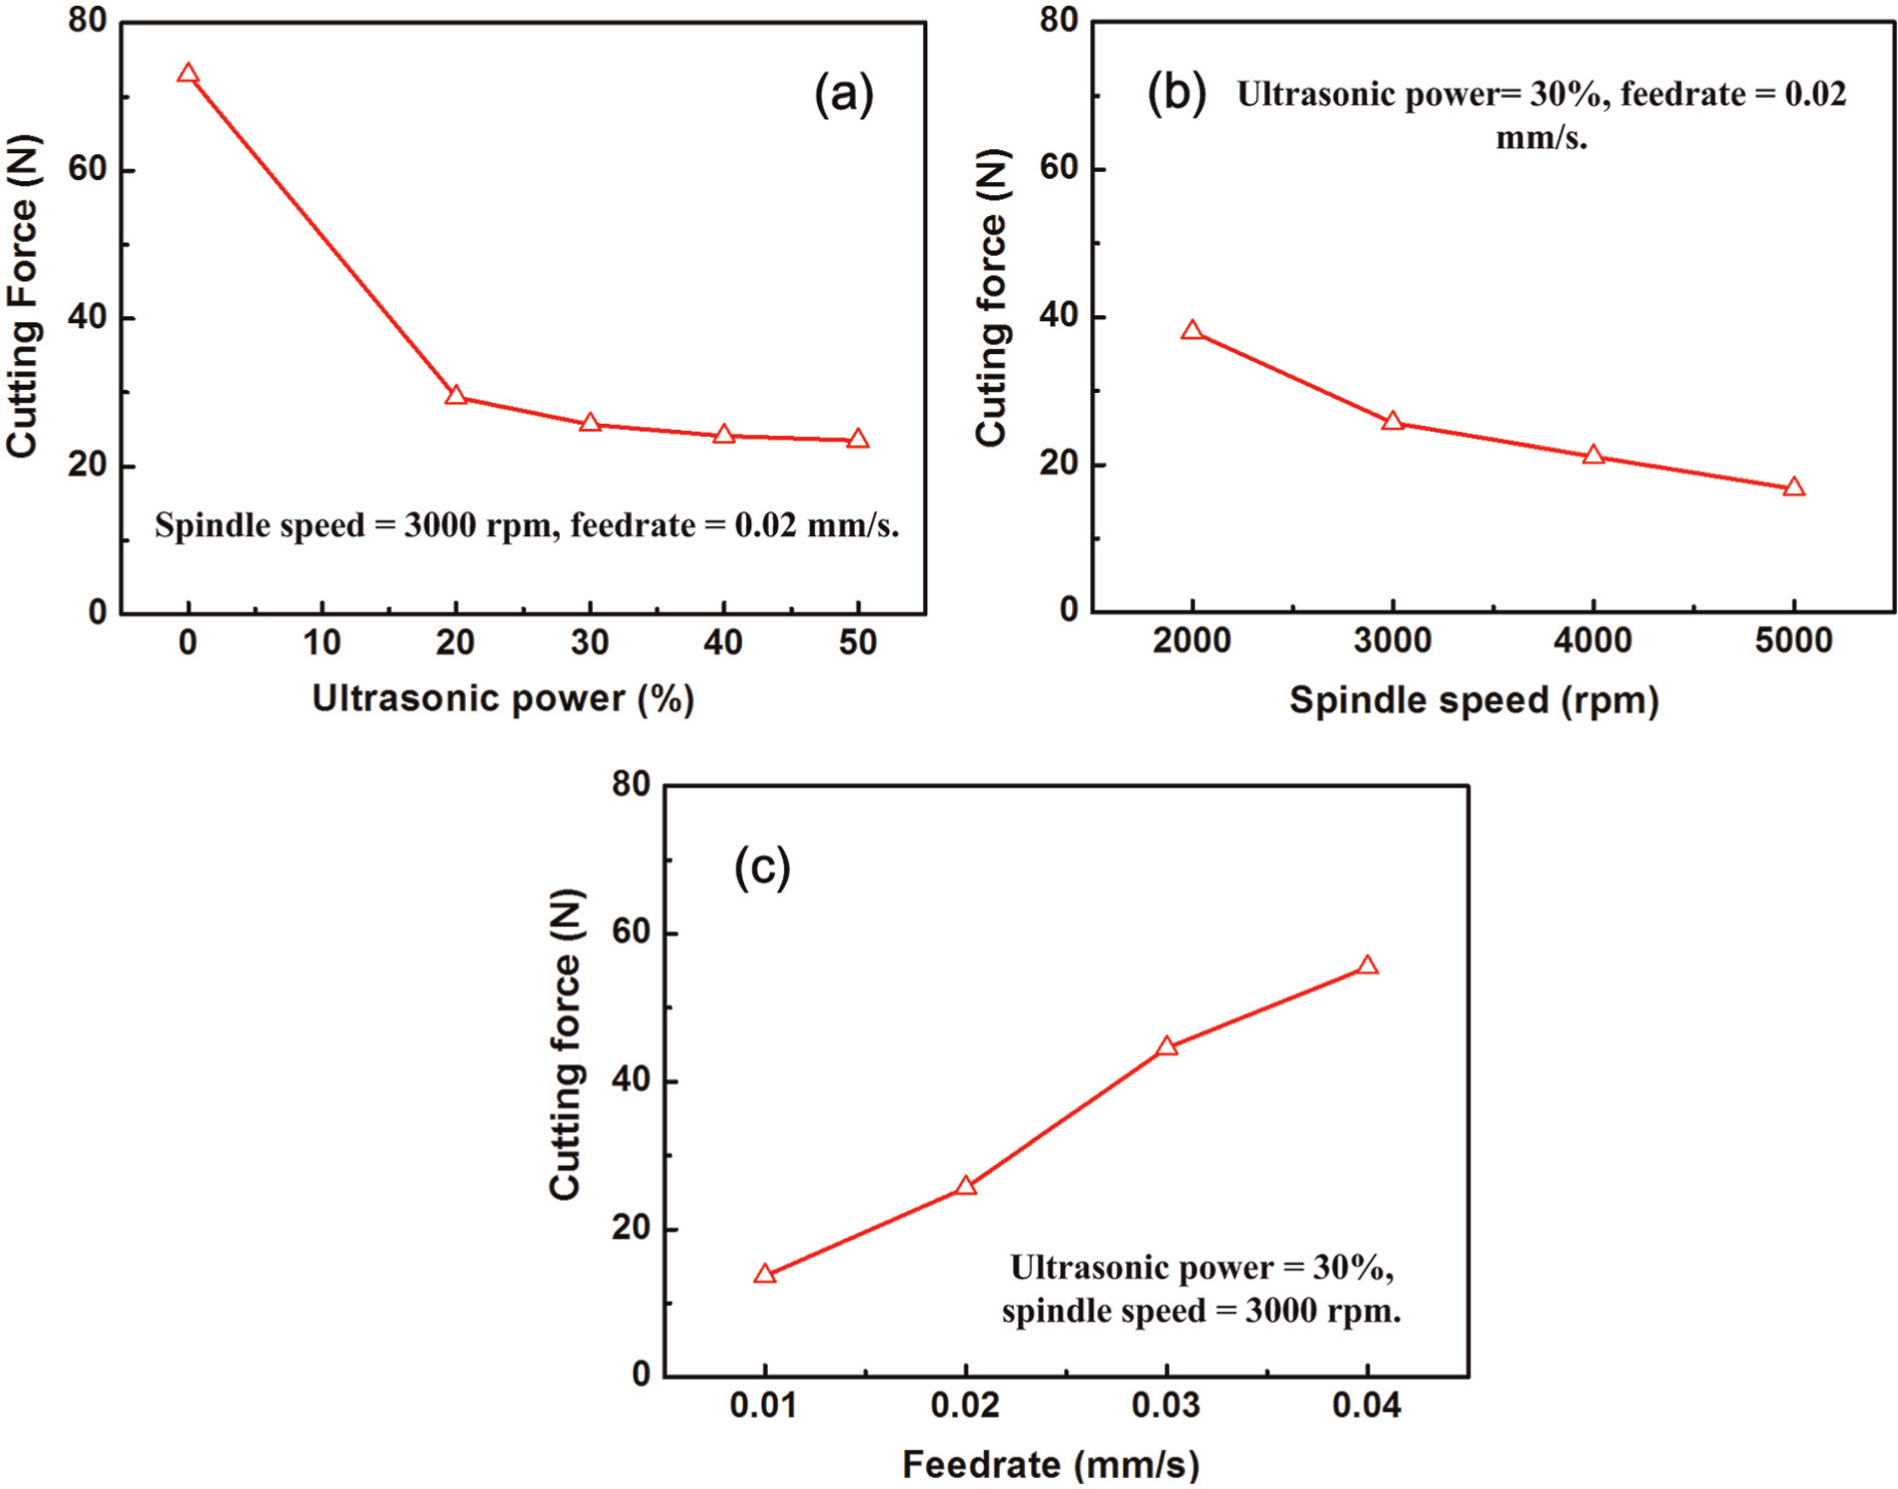
The effects of (a) the ultrasonic power, (b) the spindle speed, and (c) the feedrate on the cutting force.
Figure 9(b) shows the effects of the spindle speed on the cutting force. An increase in the spindle speed reduces the cutting force. The relationship of the feedrate and the cutting force is shown in Figure 9(c). The cutting force increases with an increase in the feedrate. The results of the effects of the spindle speed and feedrate on the cutting force are consistent with those for the RUM of CFRP using cold air as a coolant 26 and the RUM of optical K9 glass using cutting fluid as a coolant. 17
A previous study reported that the cutting force increased with cutting volume in the machining of brittle materials using a diamond tool at a cutting depth below 100 µm. 30 According to the cutting performance of rotary ultrasonic drilling, the motion trajectory of diamond grit can be expressed as
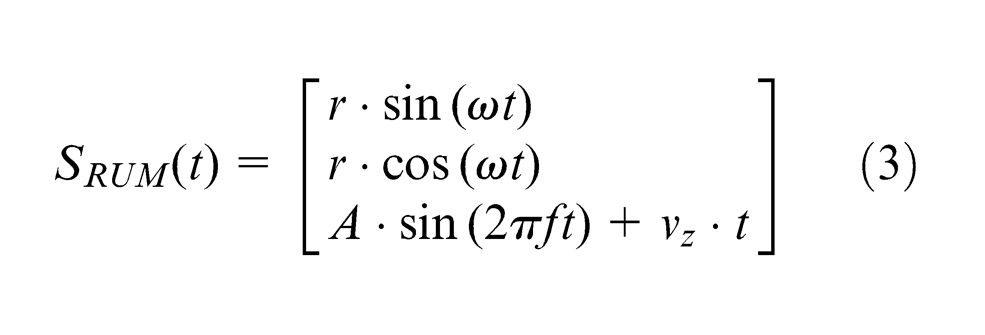
where r is the rotational radius of the diamond particle, A is the ultrasonic vibration amplitude, f is the ultrasonic vibration frequency, ω is the angular velocity of the diamond particle, vz is the feedrates in the z-axis direction, and t is processing time.
Therefore, the velocity of the diamond particle in RUM process can be described as
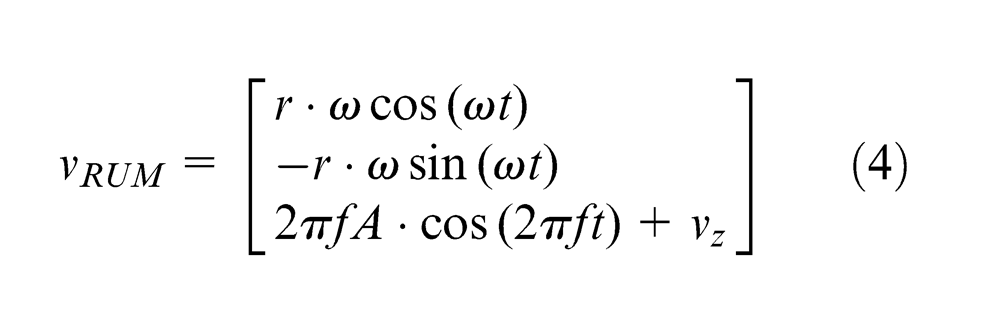
Equation (4) shows that the velocity of the diamond particle on the cutter increases with the increase in the ultrasonic vibration amplitude or the angular velocity of the diamond particle. In other words, a lower simultaneous cutting volume for the same MRR will be induced with the increase in ultrasonic power or spindle speed because of the higher velocity of diamond particle. Therefore, cutting force will decrease with the increase in ultrasonic power or spindle speed.
In addition, a mathematical model for cutting force in rotary ultrasonic drilling of brittle materials has been developed by the group, which was reported in the literature. 31 The developed model shows that the cutting force decreases as the spindle speed and ultrasonic vibration amplitude increase and increases with an increase in the feedrate, which is also consistent with the experimental results.
Surface roughness
Figure 10 shows the effects of the input variables on the surface roughness. The relationship between the ultrasonic power and surface roughness is shown in Figure 10(a). The surface roughness on the machined hole surface increases with an increase in the ultrasonic power. The effects of the spindle speed on the surface roughness, as shown in Figure 10(b), indicate that increasing the spindle speed can effectively reduce the surface roughness. Figure 10(c) illustrates the relationship between the feedrate and surface roughness. The surface roughness increases as the feedrate increases.
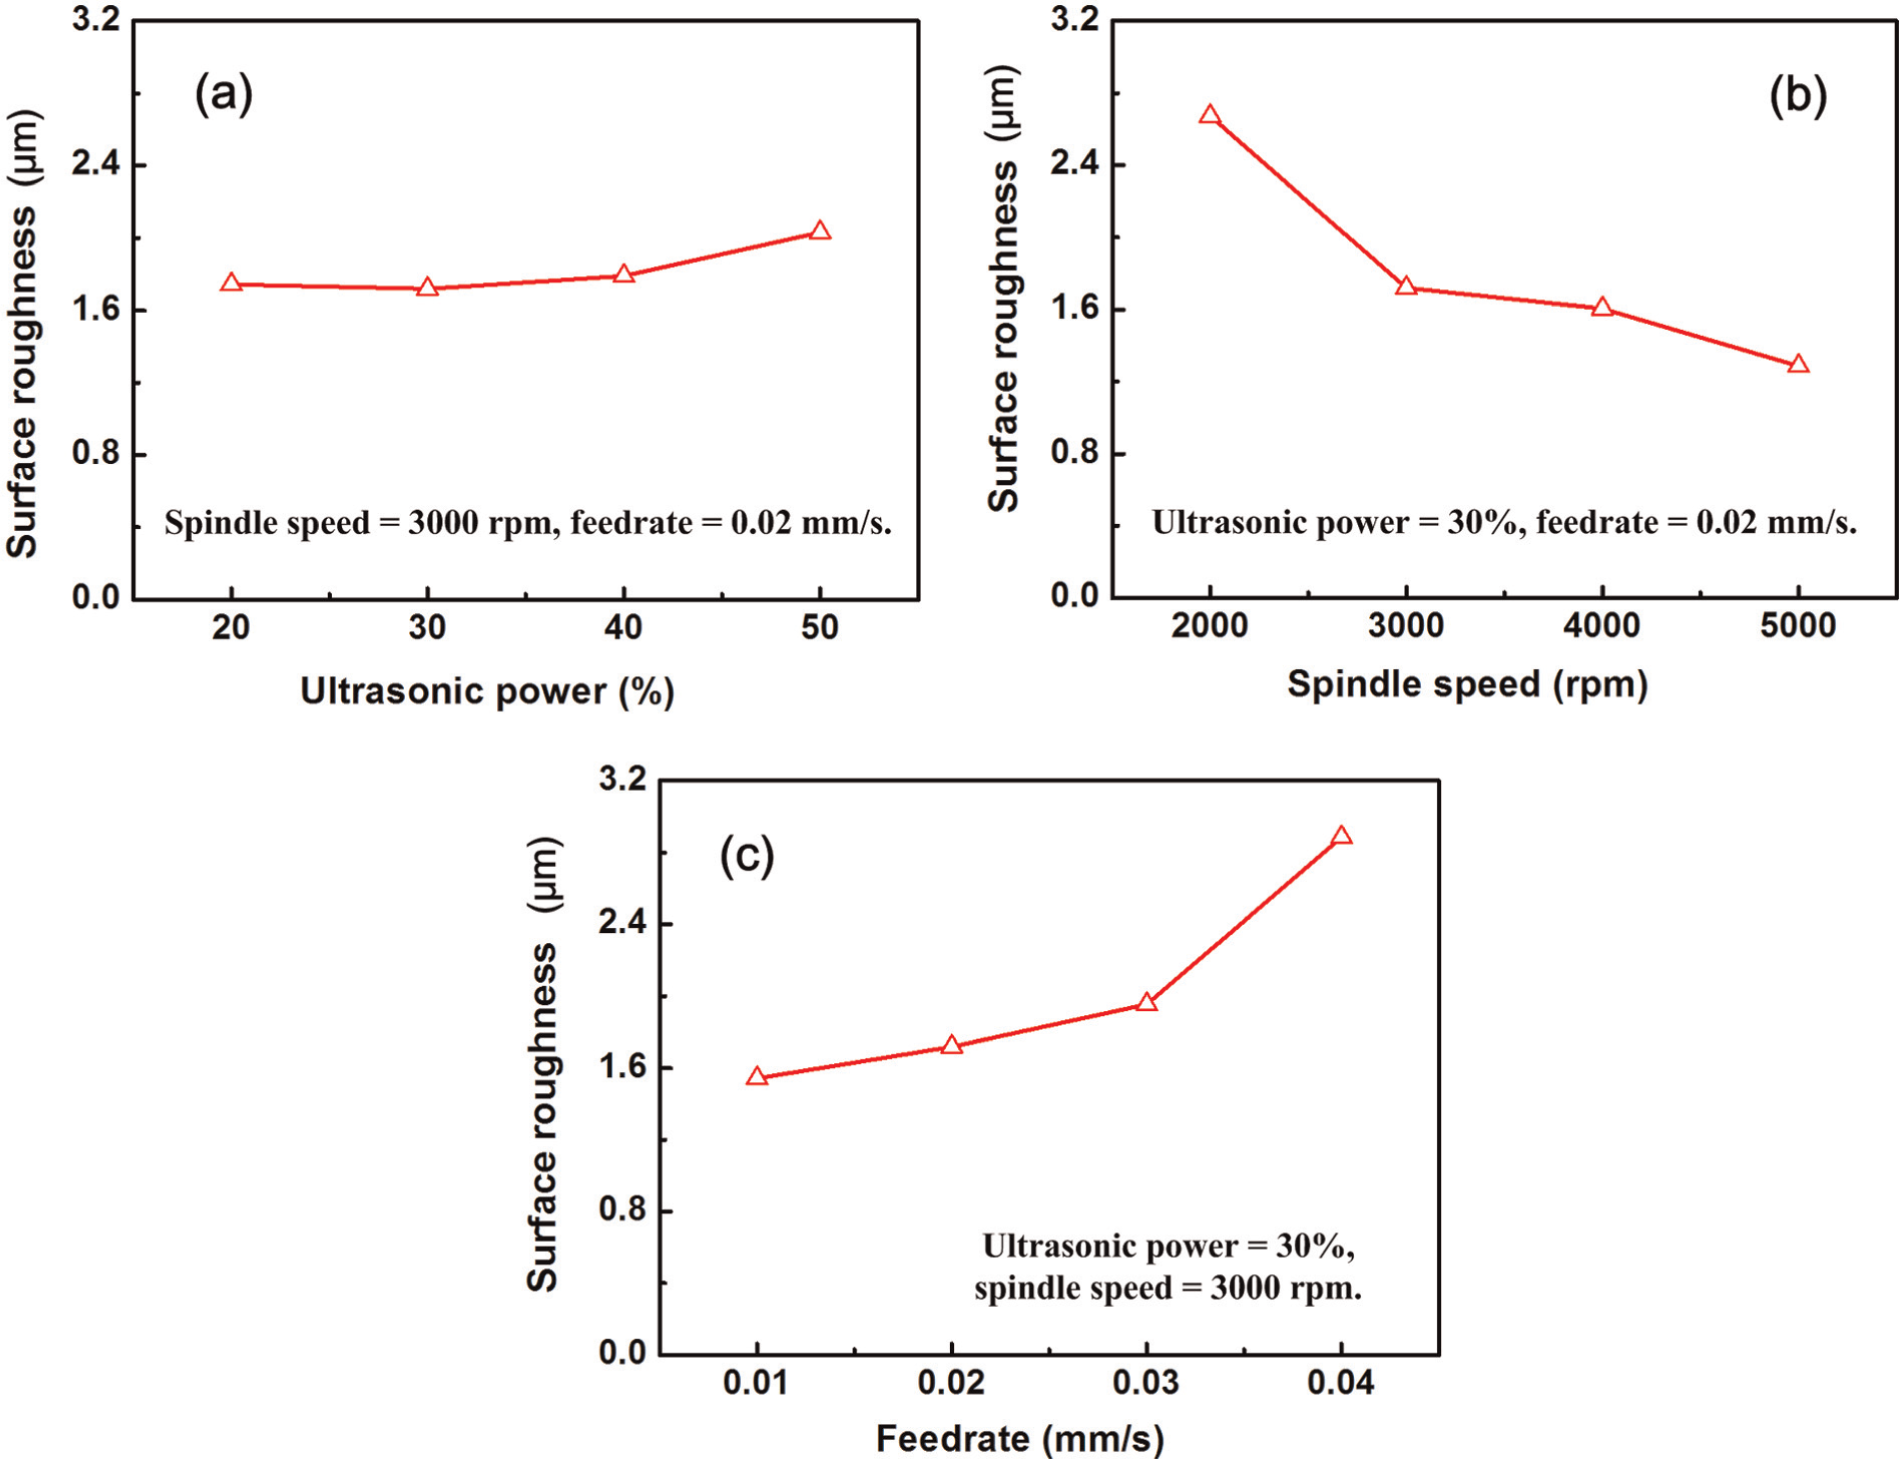
The effects of (a) the ultrasonic power, (b) the spindle speed, and (c) the feedrate on the surface roughness.
Ultrasonic power consumption
There is only one article on the power consumption in the RUM of CFRP using a fluid coolant. 32 This article reported the results of the effects of the input variables (ultrasonic power, spindle speed, feedrate, and material type) on the power consumption of the entire RUM system and each component (ultrasonic power supply, spindle motor, coolant system, and the air compressor used for feeding the spindle).
The effects of the input variables (ultrasonic power, spindle speed, and feedrate) on the ultrasonic power consumption in the RUM of optical K9 glass using compressed air as a coolant are shown in Figure 11. Figure 11(a) presents the relationship between ultrasonic power and ultrasonic power consumption. The consumption of ultrasonic power significantly increases when the ultrasonic power increases from 0% to 50%. It is interesting to note that the change in the ultrasonic power consumption with the increase in the ultrasonic power is nonlinear, while the relationship between the ultrasonic power and the ultrasonic vibration amplitude is almost linear (as shown in Figure 3).
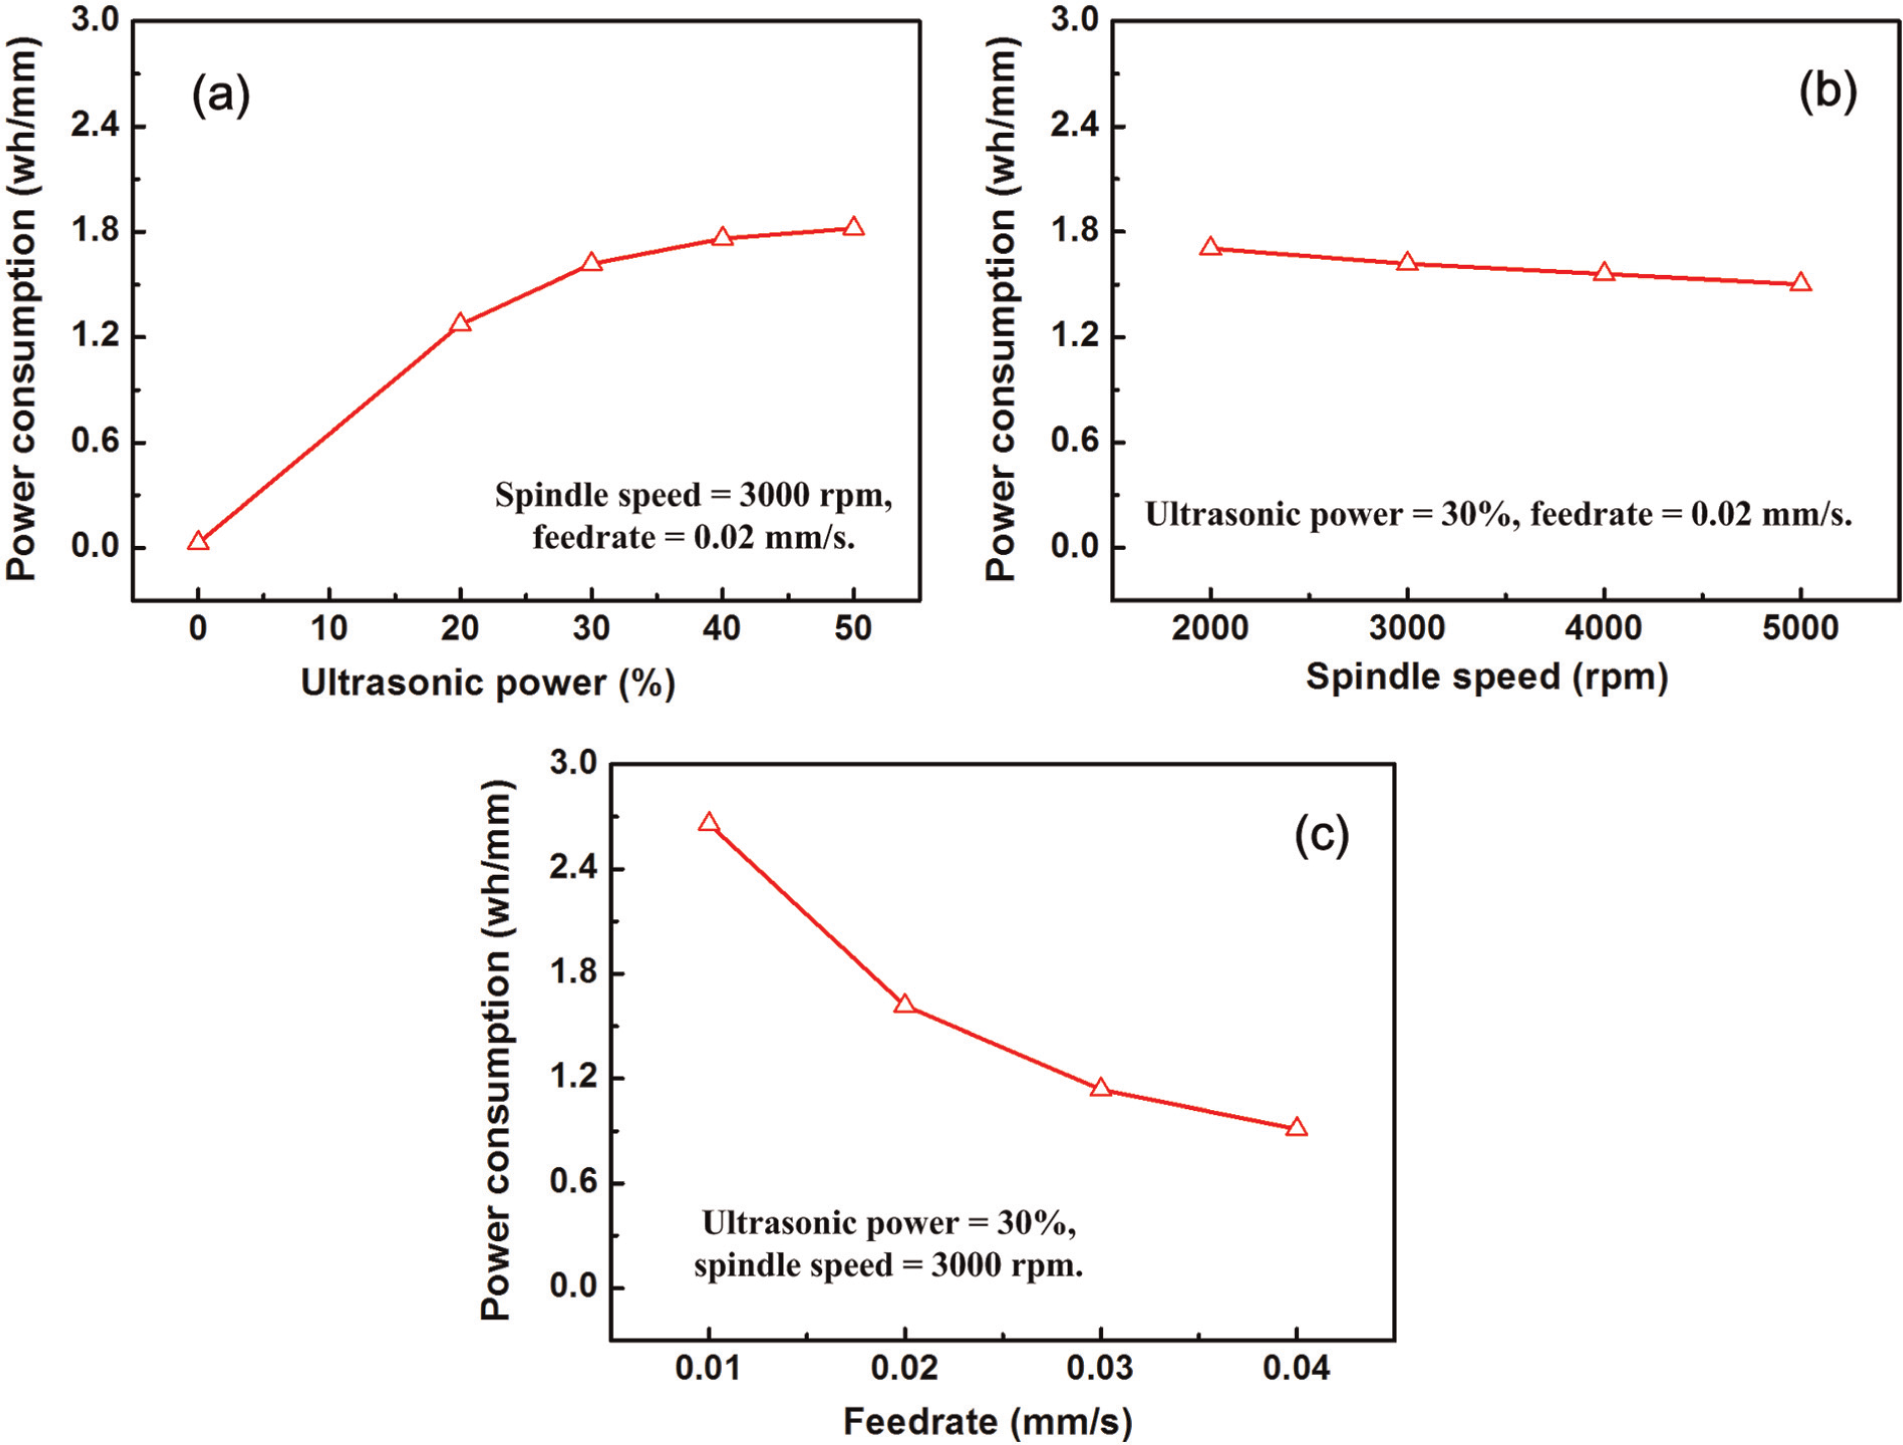
The effects of (a) the ultrasonic power, (b) the spindle speed, and (c) the feedrate on the ultrasonic power consumption.
The effects of the spindle speed on the ultrasonic power consumption are shown in Figure 11(b). The ultrasonic power consumption decreases almost linearly as the spindle speed increases. Figure 11(c) presents the effects of the feedrate on the ultrasonic power consumption. It shows that the ultrasonic power consumption decreases as the feedrate increases.
As mentioned in section “Measurement procedures for the output variables,” the power consumption was the electricity energy consumed by drilling 1 mm into the workpiece. Therefore, electrical voltage, current, and feedrate are the key factors affecting the power consumption of the ultrasonic power supply. The values of ultrasonic power, spindle speed, and feedrate directly affect the cutting performance. Higher spindle speed means the machine tool supplies higher processing power leading to lower ultrasonic power consumption. Higher feedrate not only means higher power consumption but also higher drilling depth. The ultrasonic power consumption is obtained by the calculation results using equation (1), as shown in Figure 11.
Conclusion
This article, for the first time, reports an experimental study on the RUM of optical K9 glass using compressed air as a coolant. The effects of the process parameters (ultrasonic power, spindle speed, and feedrate) on the output variables (edge chipping size, cutting force, surface roughness, and power consumption) have been studied. The following conclusions can be drawn from this study.
When compressed air is used as coolant, the machining of a hole in an optical K9 glass workpiece can be drilled by RUM but cannot be produced by diamond drilling. Moreover, compared with diamond drilling, RUM has a much lower cutting force.
The chipping size decreases as the spindle speed increases and increases as the feedrate increases.
As the ultrasonic power or the spindle speed increases, the cutting force decreases. The cutting force increases with an increase in the feedrate.
The surface roughness on the machined hole surface increases as the ultrasonic power or the feedrate increases and decreases as the spindle speed increases.
The ultrasonic power consumption increases as the ultrasonic power increases and decreases as the spindle speed or the feedrate increases.
Footnotes
Declaration of conflicting interests
The authors declare that there is no conflict of interest.
Funding
This research was financially supported by the National Natural Science Foundation of China (grant no. 50975153), the State Key Laboratory of Tribology Foundation of China (grant no. SKLT11C7), and National Science Foundation of the USA through award CMMI-0900462.