
Abstract
Vibration during end milling causes a destructive effect: it produces poor surface finish, accelerates tool wear and reduces tool life. This article presents the use of Taguchi method–based gray relational analysis to optimize the machining parameters such as helix angle of cutting tool, cutting speed, feed rate, axial depth of cut and radial depth of cut for reduced vibration amplitude in end milling operation. L25 Taguchi orthogonal design was employed for conducting the experiments. The experiments were conducted on aluminum Al 6063 by high-speed steel end mill cutter, and acceleration amplitude was measured using fast Fourier transform analyzer. The online signals recorded for vibration amplitude picked by accelerometer at two positions: one fixed in the spindle (channel I) and another fixed in the workpiece fixture (channel II). Signal-to-noise ratio and analysis of variance were employed to determine the optimum levels. Gray relational grade was used to optimize machining parameters by considering both responses at a time.
Keywords
Introduction
Milling is a basic metal cutting process in which the required shapes in metal components are obtained by removing unwanted materials. End milling operation is a type of peripheral milling process and is quite complex. Many variables are involved, such as tool geometry, tool materials, workpiece materials and cutting conditions, and these variables make the tool to react in a different way. The angle of entry and effective geometry of the tools may change during the machining as cutter tooth constantly changes its position in relation to the workpiece. The purpose of this article is to investigate the effects of various variables to have better understanding of the end milling operation. Two major problems encountered with the end mill cutters related to rigidity are spring back and chatter. Spring back is caused by insufficient stiffness, and excessive spring back of the cutter will result in a scratch mark during tool retraction. Chatter occurs during the feeding and retracting motions. The relative motion between cutting tool and workpiece results in a vibration. The frequency of the vibration depends on the natural frequency of the machine tool. Chatter is a resonant vibration when the force acting on the tool–workpiece system happens to vibrate same as of natural frequency of machine tool. 1 Cutting is also not continuous in end milling; rather, it is periodically interrupted as cutting edges enter and leave the workpiece. This leads to cyclic thermal and mechanical load which leads to fatigue failure.
Several investigations have been carried out to reveal the effect of various parameters on machining performance by vibration analysis. Weinert et al. 2 proposed a simulation concept to predict regenerative workpiece vibrations, which combines a finite element model for analyzing the dynamic behavior of the workpiece. The author concluded that the dynamic behavior of workpiece–tool system influences the quality of workpiece surface. Orhan et al. 3 investigated the relationship between tool wear and vibration during end milling, which reveals that the tool wear increases when the acceleration amplitude during machining increases. Lacerda and Lima 4 studied the cause of chatter vibrations between the cutter and the workpiece and also suggested optimal selection of depth of cut and spindle rotation that results in maximum ship removal rate in milling. Amini et al. 5 explained the influence of vibration amplitude on surface roughness in ultrasonic vibration–assisted turning. Julie and Joseph 6 demonstrated a tool condition–monitoring approach in an end milling operation based on the vibration signal microcontroller-based data acquisition inbuilt with signal transducer. Fang et al. 7 analyzed the effect of tool edge wear on the vibrations in high-speed turning using fast Fourier transform (FFT) and discrete wavelet transform technique. It is concluded that vibration amplitude increases with the increase in tool edge radius. Devillez and Dudzinski 8 studied the problem of vibrations occurring during a machining operation and revealed that the vibrations may cause failures and defects to the process, like workpiece surface alteration and rapid tool wear. Mann et al. 9 implemented finite element analysis and semi-discretization methods to study the stability in milling process. The samples were collected experimentally to access the stability of the system. Engin and Altintas 10 presented a generalized mathematical model of most helical end mills to predict the cutting forces, vibrations, dimensional surface finish and chatter stability lobes for an arbitrary end mill. Jeyakumar et al. 11 employed central composite experimental design and developed a predictive model for determining cutting forces.
The dynamics of the spindle and cutter system determines the quality of the work parts. 12 Paris and Peigne 13 showed the influence of cutting edge defects on the stability of the machining and the raising of chatter phenomenon. Arizmendi 14 presented a model for predicting surface topography that includes the effects of tool vibration. Catania and Mancinelli 15 proposed an analytical–experimental model to predict chatter vibration phenomenon. Statistical prediction models for various performances (surface roughness, tool wear and cutting forces) to find the best levels of process parameters have been explored by many researchers. Oktem et al. 16 employed Taguchi optimization method for low surface roughness in terms of process parameters such as feed, cutting speed, machining tolerance, axial depth of cut and radial depth of cut. Bagci and Aykut 17 applied Taguchi optimization method for low surface roughness in terms of feed, cutting speed and depth of cut. Ghani et al. 18 presented Taguchi optimization method, which is applied to optimize the cutting parameters such as speed, feed and depth of cut for low resultant cutting forces and good surface finish. They concluded that Taguchi method is suitable in determining optimum combination of process parameters to ensure the surface quality in machined surface. Gray relational analysis was introduced by Deng 19 and was used to measure the degree of relationship between various performance characteristics. This method can be used to solve interrelationship among different responses. 20 Tosun 21 employed gray relational analysis to determine optimum parameters for multiple performance characteristics in drilling operation. The generalized statistical predictive model by employing response surface methodology to determine acceleration amplitude has been devised in earlier work. 22
End mill geometry is very complex, and there is very little research pertaining to the influence of geometrical parameters on stability of milling process. The changes in axial rake angle (helix angle) resulting in changes in machining performance, particularly with regard to the vibration amplitude, have not been explored much. In this article, the aim is to analyze the influence of helix angle of end mill cutter on acceleration amplitude of vibration. Taguchi-based gray relational analysis techniques have been employed to determine the optimum levels of process parameter such as helix angle of cutting tool, cutting speed, feed rate, axial depth of cut and radial depth of cut for reduced vibration amplitude in end milling operation.
Vibration amplitude and measurement
In end milling, the tool and work parts move relative to each other with a frequency determined by the natural frequency of the machine tool. The constant pounding of frequency on the machine parts will result in increased tool wear and poor surface finish. There are several components; almost all the parts of the machine tool are responsible for the generation of vibration. The process parameters involved in the machining condition also contribute to vibration generation in major magnitudes. Altering machine tool is not possible, but predicting the right cutting condition to reduce the vibration is possible by controlling the process parameter of the end milling. Change in helix angle of the cutting tool will influence the performance of metal cutting processes, especially respond much with vibration. Hence, determining proper helix angle helps to obtain a machined surface with required finish and with reduced tool wear. The vibration amplitude is measured by using twin-channel FFT analyzer (COCO 80), and the acceleration amplitudes are picked at two locations: one in the feed direction on the workpiece holder and another in the axial cutting direction in the spindle. The resulting vibration measurement in terms of displacement, velocity and acceleration amplitude is collected in the form of time waveforms and frequency spectrum. The vibration signals are collected in a time domain graph known as waveform graph. The time waveform is a time domain analysis which uses the history of the signal. The signal is stored in the analyzer, and any nonsteady or transient impulses are noted. Discrete damages due to built-up edge formation and resonance condition can be identified from the waveform. The acceleration waveform indicates that pulse occurs periodically with a period of 2 s. The frequency spectrum is a plot of the amplitude of the vibration response versus frequency and can be derived by using digital fast Fourier analysis of the waveform. The peak level is the indication of maximum vibration generated in the milling, and the maximum acceleration amplitude of the milling is noted for our study. In milling, the dominant frequency components in the spectrum graph are around tooth passing frequency (ft) and their harmonics. 23 The vibration result the interaction of the tool and workpiece has characteristic frequency with the multiples of tooth passing frequency at 1×, 2×, 3×, etc. The tooth passing frequency (ft) can be calculated from the following equation
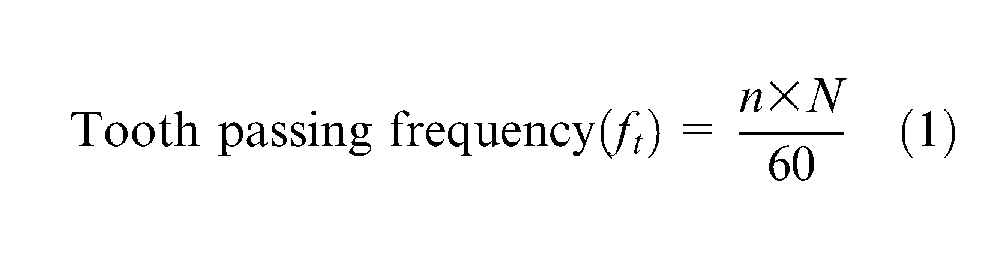
where N is the spindle speed (r/min) and n is the number of teeth of end mill cutter.
Gray-based Taguchi method for optimization
Taguchi method is an experimental design technique used for engineering analyses to optimize the levels of process parameters for the required performance characteristic.24,25 A large number of experiments have to be carried out to study the characteristics influenced by number of parameters. This method reduces the magnitude of experiments by introducing a special design of orthogonal arrays to study the entire parameter space with minimum number of experiments. Thus, it reduces time and cost of the experiment. Taguchi uses loss function to determine the performance characteristic deviating from the desired value. The loss function value is transformed into signal-to-noise (S/N) ratio. The term “signal” represents the desirable (mean) values, and the term “noise” represents the undesirable (standard deviation (SD)) values for the output characteristic. Three types of S/N ratio are available based on the output characteristic: lower is better, nominal is best (NB) or higher is better. In the present work, the objective is to minimize vibration amplitude, hence the lower is better is adapted. The lower is better characteristic S/N ratio can be formulated as
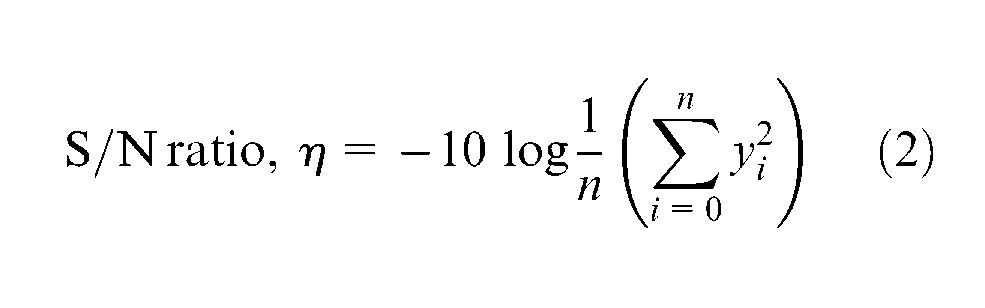
where n is the number of trial of the experiment and yi is the ith measured value in the trial. In addition to S/N ratio, a statistical technique, analysis of variance (ANOVA) can be employed to determine the influence of the process parameters on the performance characteristic. Thus, the optimum levels of process parameters can be estimated.
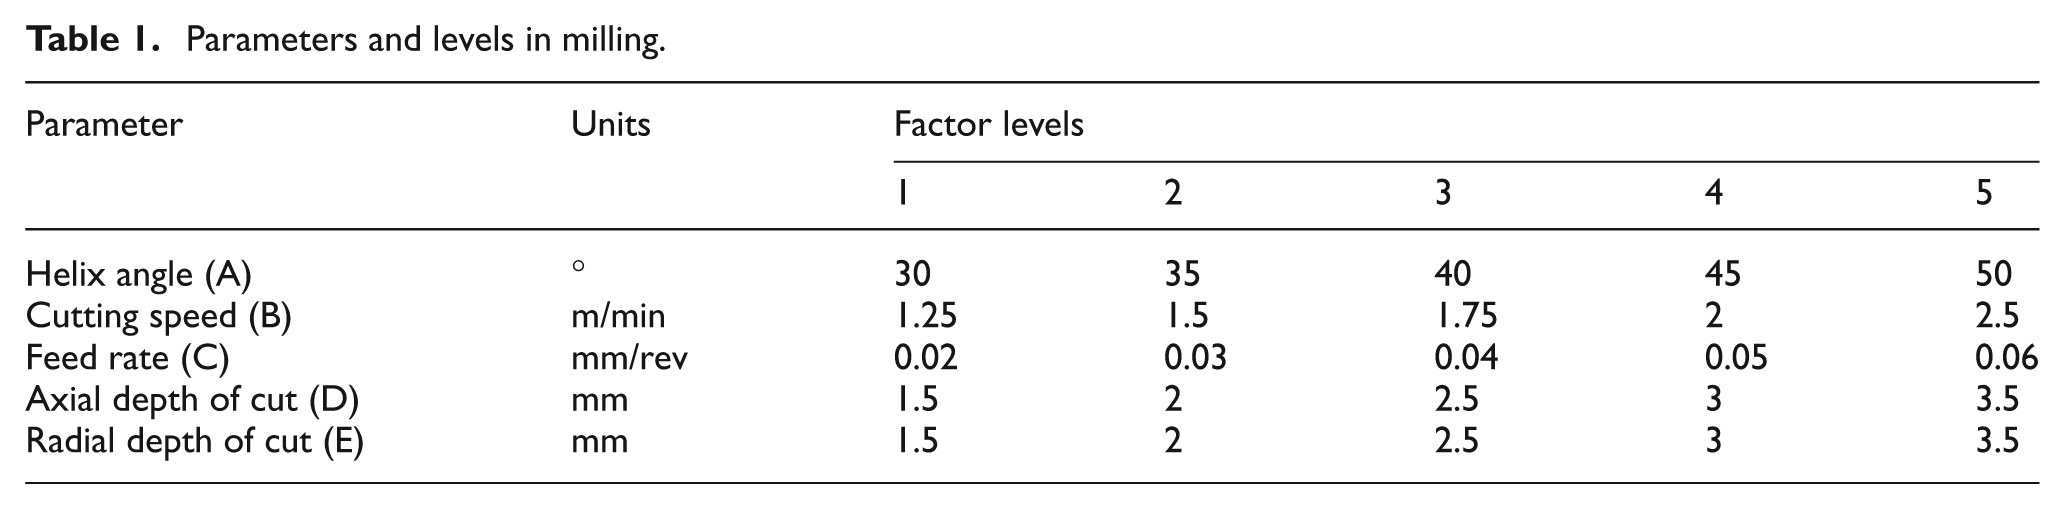
The controllable parameters in end milling operation such as geometrical nomenclature of the tool and cutting conditions are found to influence vibration amplitude, which has a significant contribution in determining surface quality and tool life. In this study, the influence of machining parameters such as helix angle of cutting tool, cutting speed, feed rate, axial depth of cut and radial depth of cut (five levels for each parameter) in milling was considered, and L25 (5 × 5) orthogonal array was employed for conducting the experiments. The machining parameters and their level are shown in Table 1. The range of the machining parameter is constrained by the limitations of the machine tools and by conducting trial runs.
Parameters and levels in milling.
Gray relational analysis is employed to optimize control parameters having multiresponse through gray relational grade. 19 In gray relational analysis, the first step is to normalize the S/N ratio calculated from the Taguchi method. This data preprocessing converts the original sequence to a set of comparable sequence. Depending upon performance characteristic, different methods are adapted to normalize the raw data and linear normalization of the S/N ratio is performed. The normalized S/N ratio xij for the ith performance characteristic in the jth experiment can be expressed as
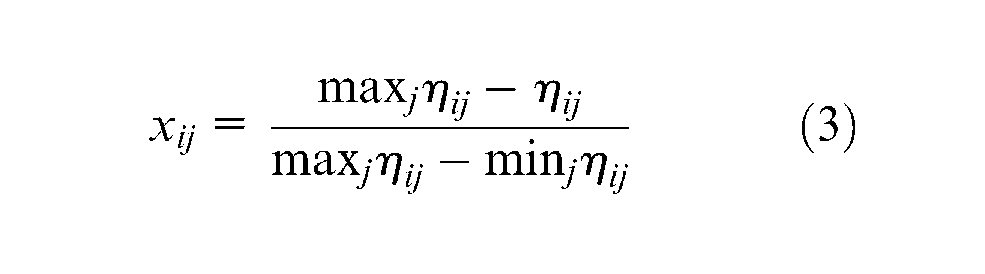
where ηij is the jth experiment result in the ith trial and max j ηij and min j ηij are the maximum and minimum values of ηij, respectively. Then, the deviation sequence is calculated from the reference sequence of preprocess data and the comparability sequence. The gray relation coefficient is calculated to express the relation between the ideal and the normalized S/N ratio. Thus, the gray relational coefficient γij for the ith performance characteristic in the jth experiment is calculated using the following equation
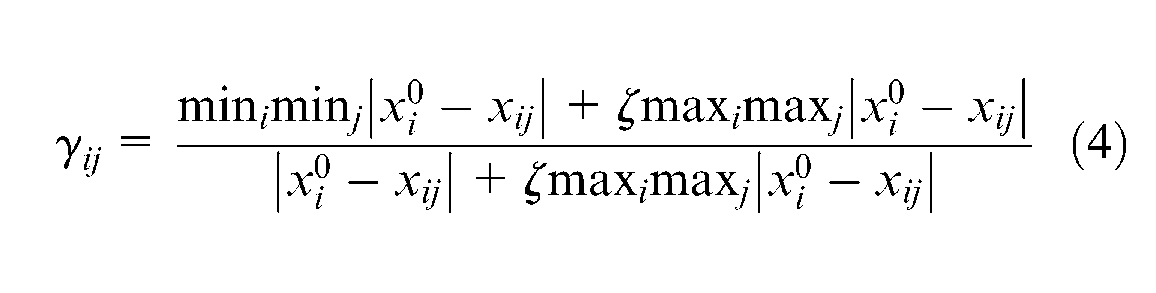
where
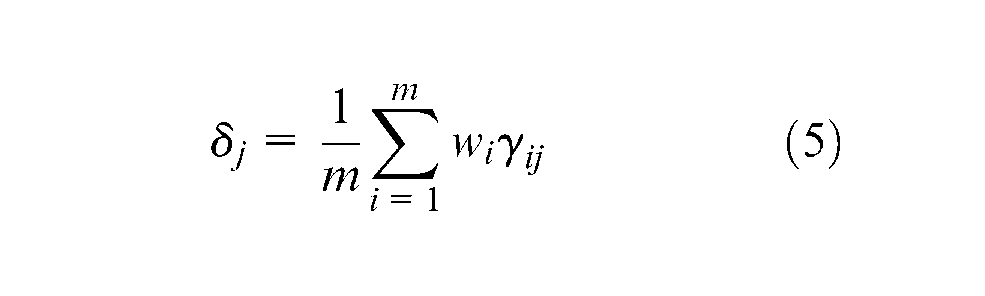
where wi is the weighting factor for the ith performance characteristic, m is the number of performance characteristic and δj is the gray relational grade for the jth experiment. The gray relational grade determines the relation between the reference sequence and comparability sequence.
The procedure of gray-based Taguchi optimization method is outlined as
Identifying the performance characteristics (acceleration amplitude) and machining parameters (range and levels of the parameters).
Conducting experiments by setting appropriate orthogonal array (L25), and noting response of the performance characteristic.
Evaluating the mean value of vibration amplitude and S/N ratio for the lower is better characteristic and determining the optimum levels of parameter.
Applying ANOVA technique to determine the significant parameter that influences performance characteristics.
Normalizing the experiment value of the vibration amplitude picked by two channels, and performing the gray relational analysis and calculating the gray relational coefficient.
Calculating gray relational grade by considering both acceleration amplitudes picked at two positions.
Analyzing the experimental result and selecting the optimum levels of process parameter.
Verifying the optimal cutting parameters through confirmation experiment.
Experimental setup
Machining vibration occurs due to relative movement between the tool and workpiece in the machine tool. The resonant vibration occurs when the force acting on the cutter leads to vibration at a natural frequency of the machine tool. The minimum excitation may cause maximum amplitude, which at constant pounding will increase tool wear and result in poor surface finish. The vibration amplitude is measured using twin-channel FFT analyzer (COCO 80), and the magnitude of vibration is measured as acceleration amplitude and picked in two locations of machine tool: one in the work holder in the feed direction and another in the spindle in the cutting direction as shown in Figure 1. The accelerometer employed senses the acceleration of 10 m/s2 as 100 mV and outputs analog signals. The FFT digitizes the input signals by processing the discrete data points, and the output is obtained in the form of waveform and spectrum. Analog-to-digital (A/D) and digital-to-analog (D/A) converters of 24 bits were used. The sampling rate per channel is up to 102.4 kHz, and the dynamic range is 130 dB. The experiments were conducted on a HAAS vertical machining center with high-speed end mill cutter and workpiece as aluminum alloy (Al 6063) under dry condition. The dimension of the workpiece specimen used was 32 mm × 32 mm in cross section and 40 mm in length. L25 orthogonal array was employed for conducting the experiments. The orthogonal array contains 25 rows and 5 columns. The experiments are conducted in a completely random manner in order to reduce experimental error. The vibration resulted by the interaction of the tool and workpiece is measured as an acceleration amplitude in the feed direction on the workpiece holder (channel I) and in the axial cutting direction in the spindle (channel II). The data are acquired in the FFT analyzers and are tabulated in Tables 2 and 3.
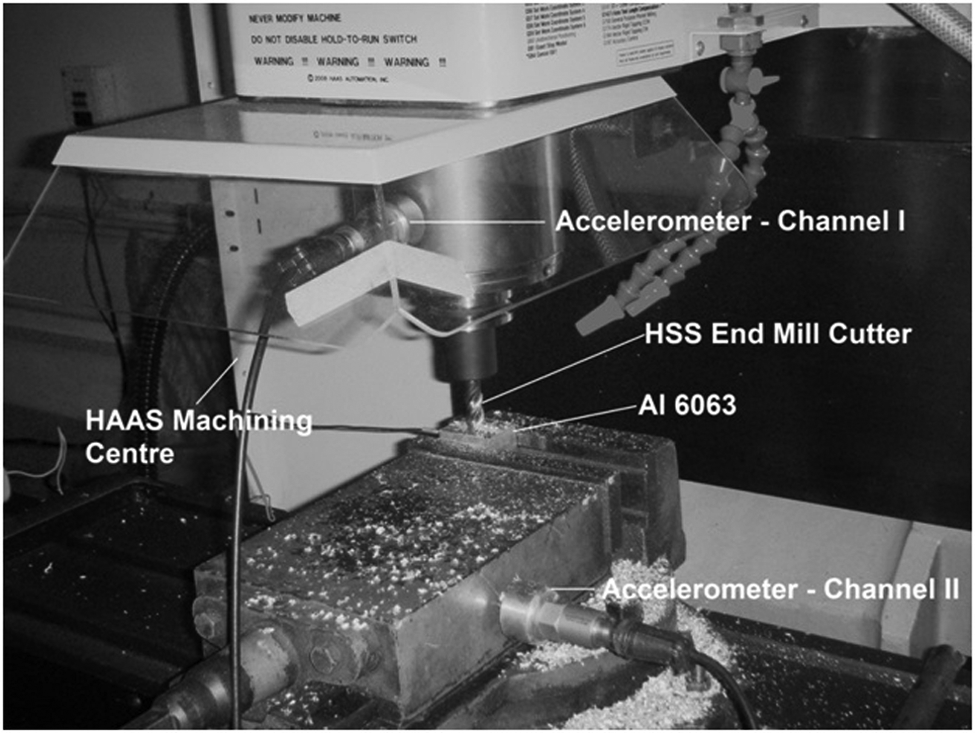
Experimental setup for vibration amplitude measurement.
Experimental result for acceleration amplitude for channel I.
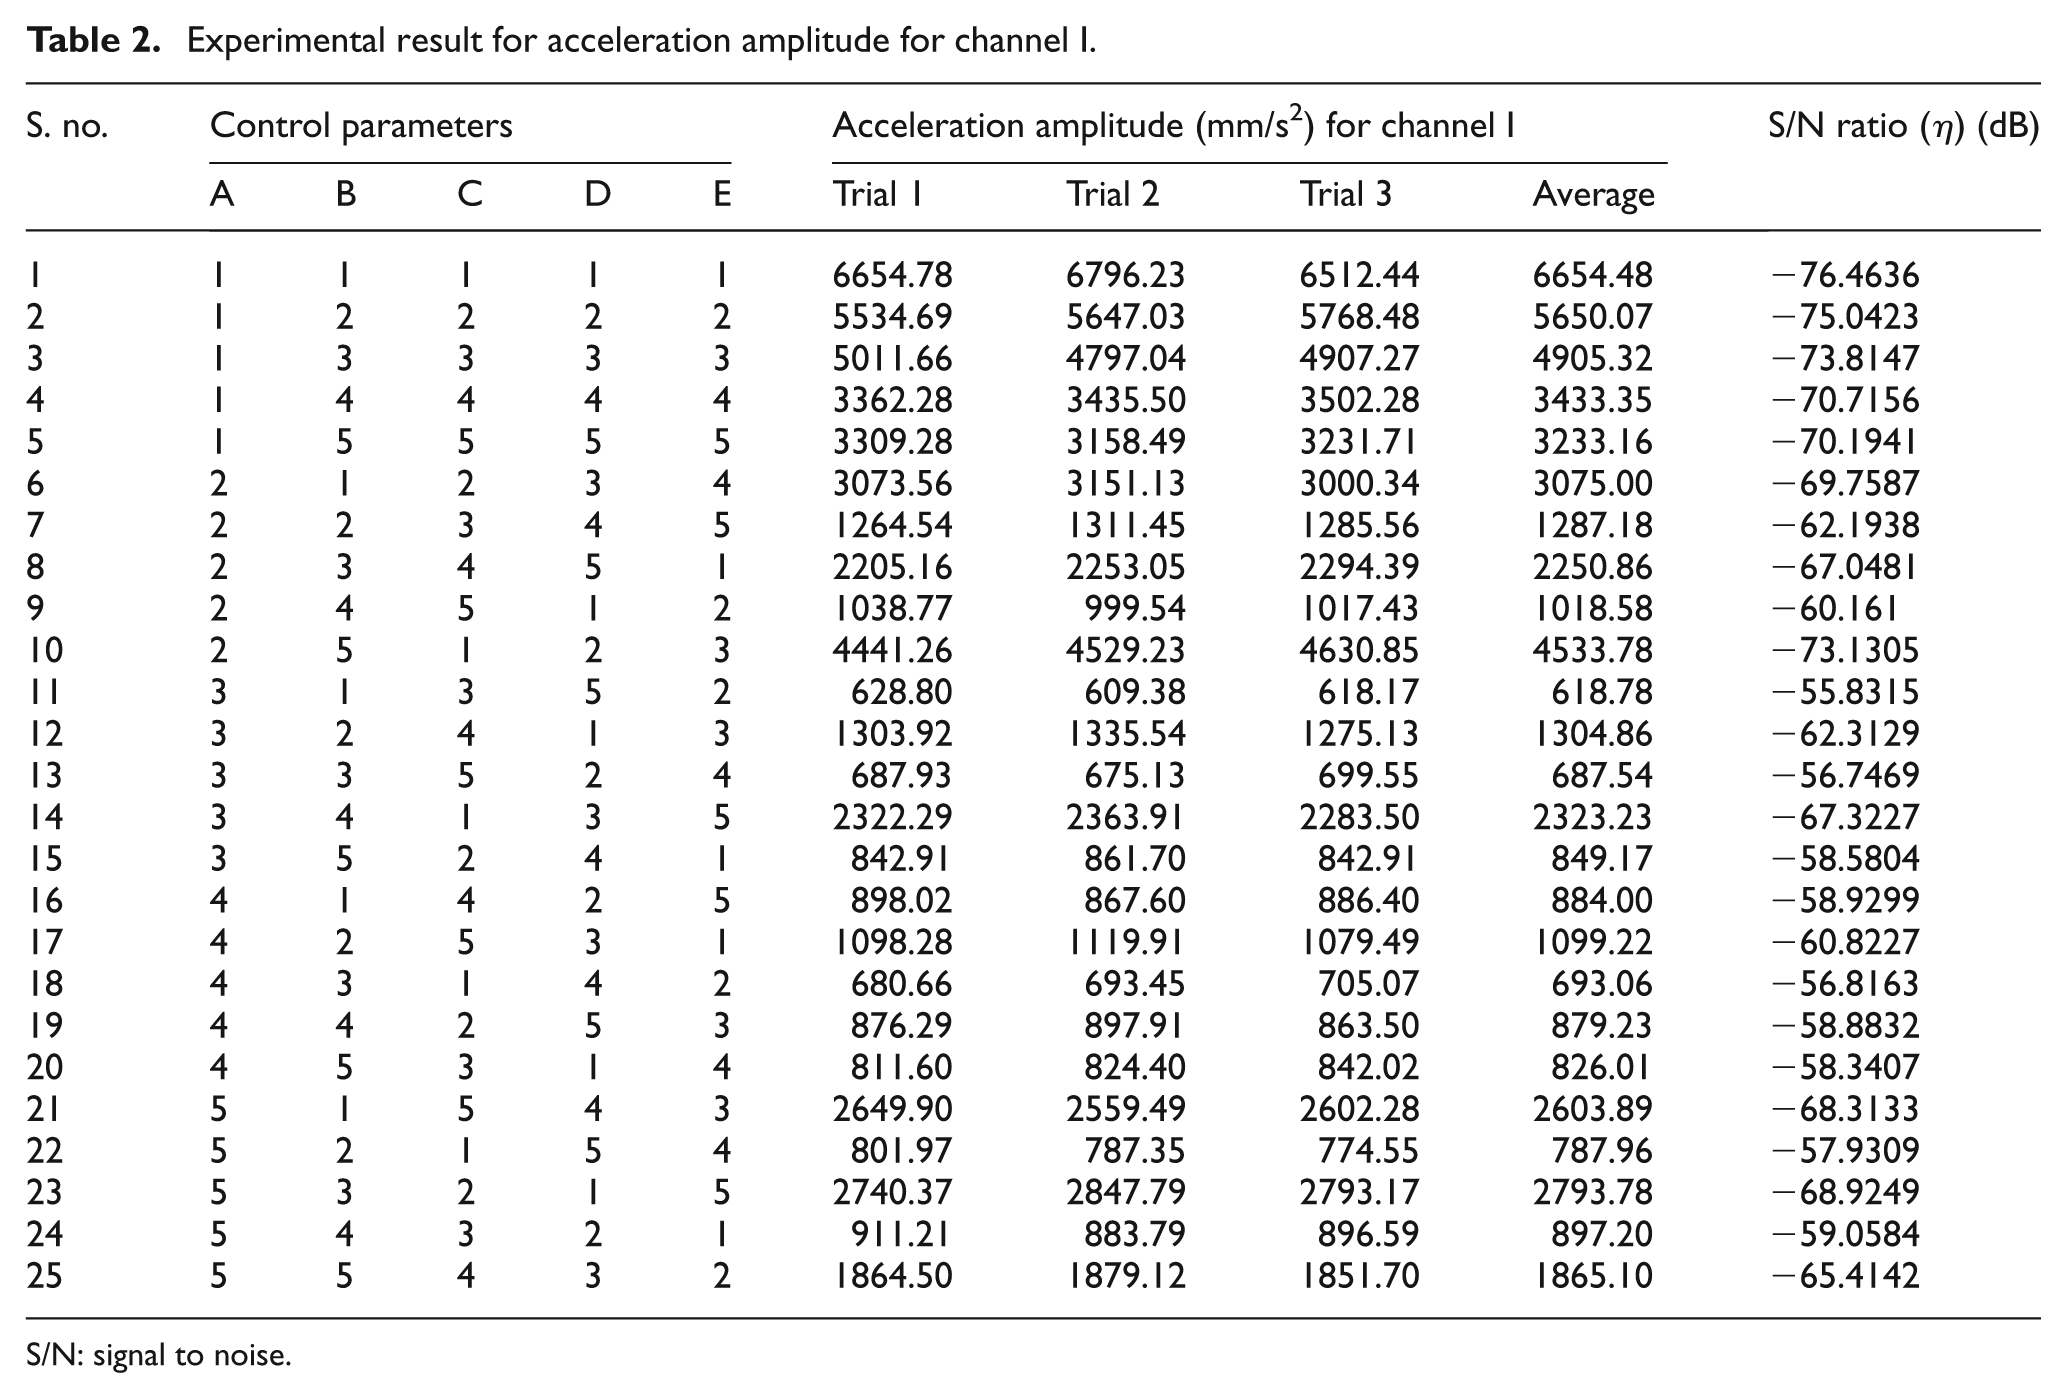
S/N: signal to noise.
Experimental result for acceleration amplitude for channel II.
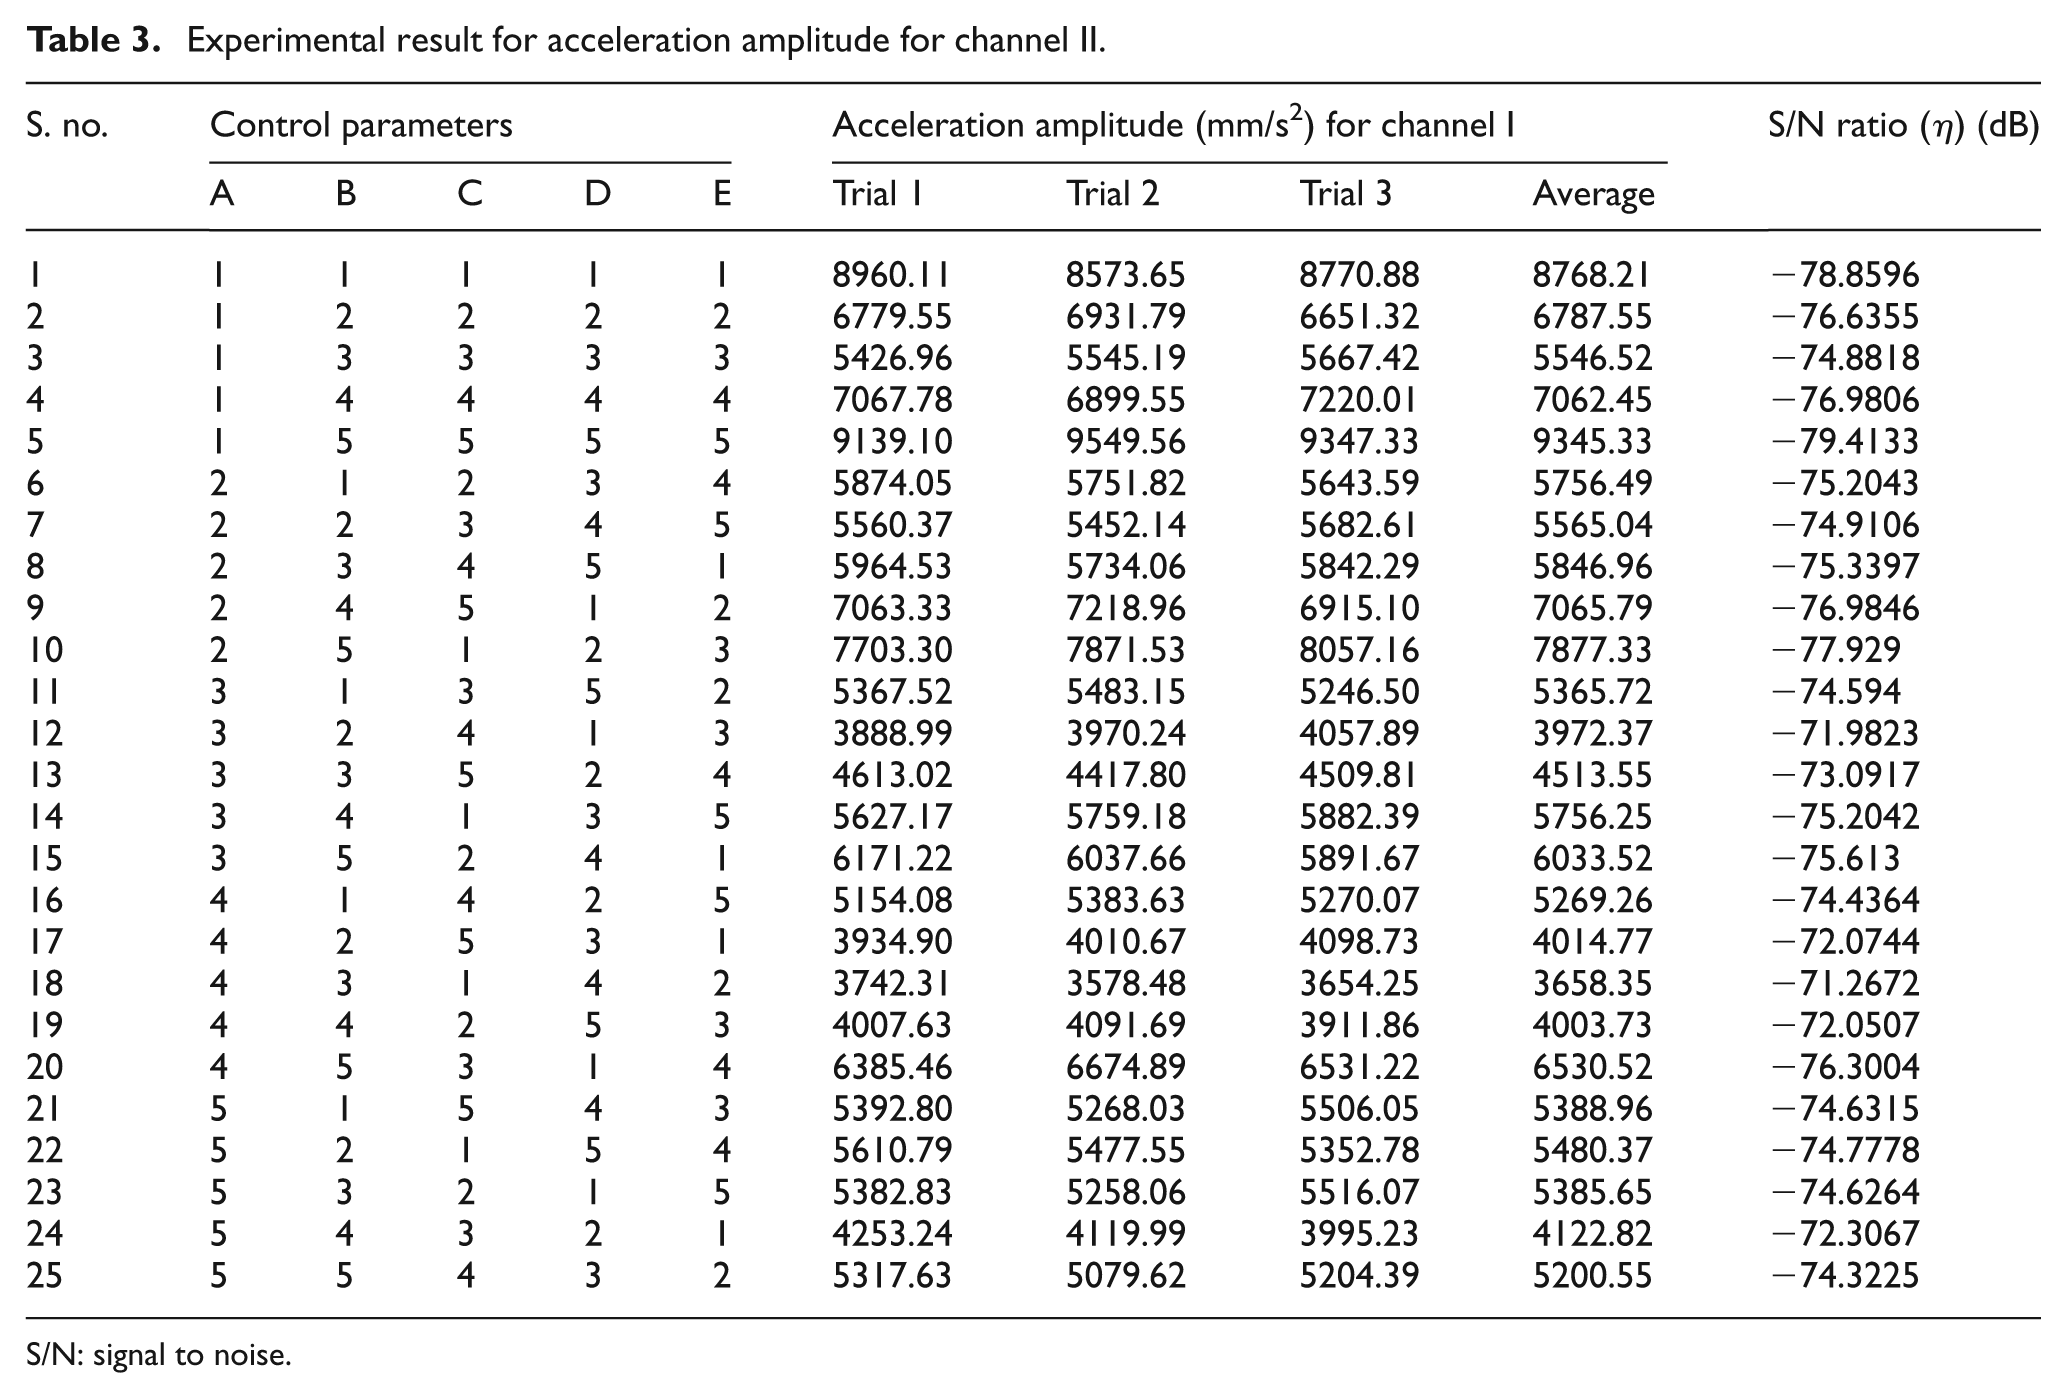
S/N: signal to noise.
Results and discussion
Analysis of S/N ratio
Tables 2 and 3 show the data observed for three trials during experimentation. The average value of the acceleration amplitude picked at channels I and II is evaluated and noted. The S/N ratios are evaluated using equation (2) by taking into consideration the lower is better characteristic of acceleration amplitude and are noted in Tables 2 and 3. The vibration amplitude picked at the two channels for each parameter level is calculated by averaging the observed values when the parameter is maintained at that level. The mean acceleration amplitude (channels I and II) response table for each level of process parameters was created in the integrated manner. The average value of acceleration amplitude for each parameter at each level was calculated. The acceleration amplitude (channels I and II) is given in Tables 4 and 5. Tables 4 and 5 indicate the mean of the response variable (acceleration amplitudes) for each level of each control factor. The same procedure is applied for S/N ratio response for each level of process parameter, and S/N ratio response for acceleration amplitude (channels I and II) is given in Tables 6 and 7. Tables 6 and 7 indicate the mean of the S/N ratio for each level of control parameters.
Mean response table for acceleration amplitude for channel I.
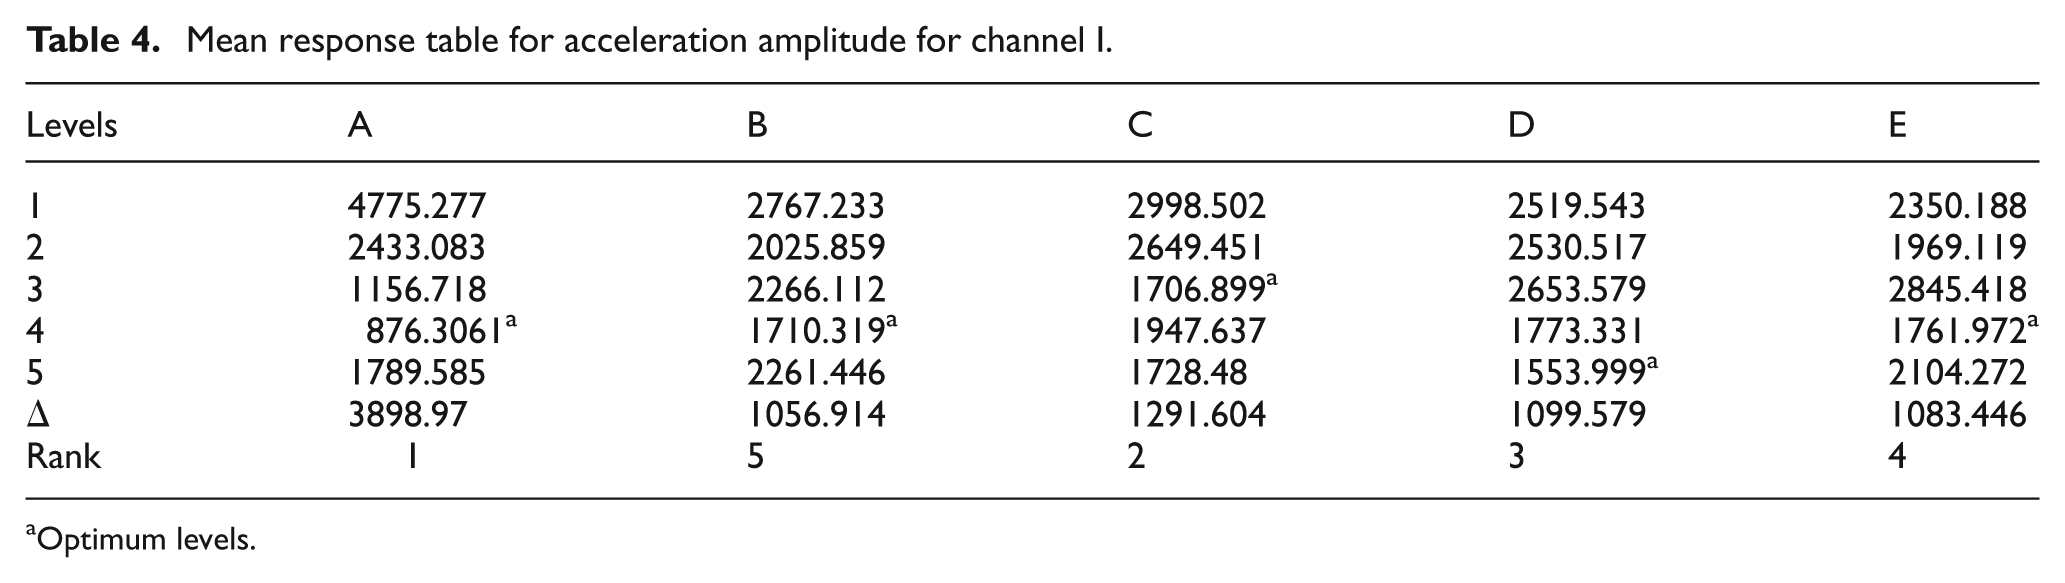
Optimum levels.
Mean response table for acceleration amplitude for channel II.
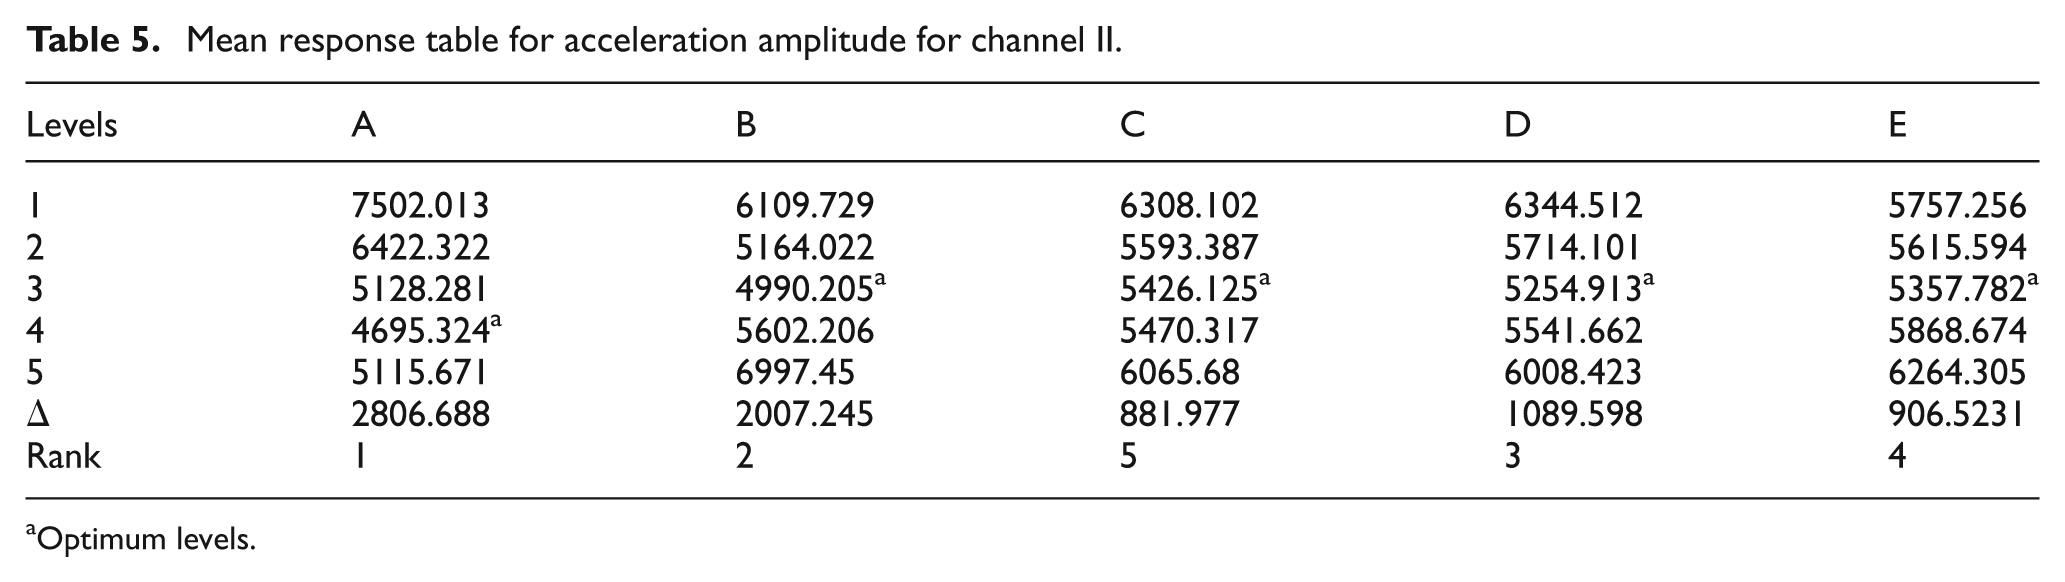
Optimum levels.
S/N ratio response table for acceleration amplitude for channel I.
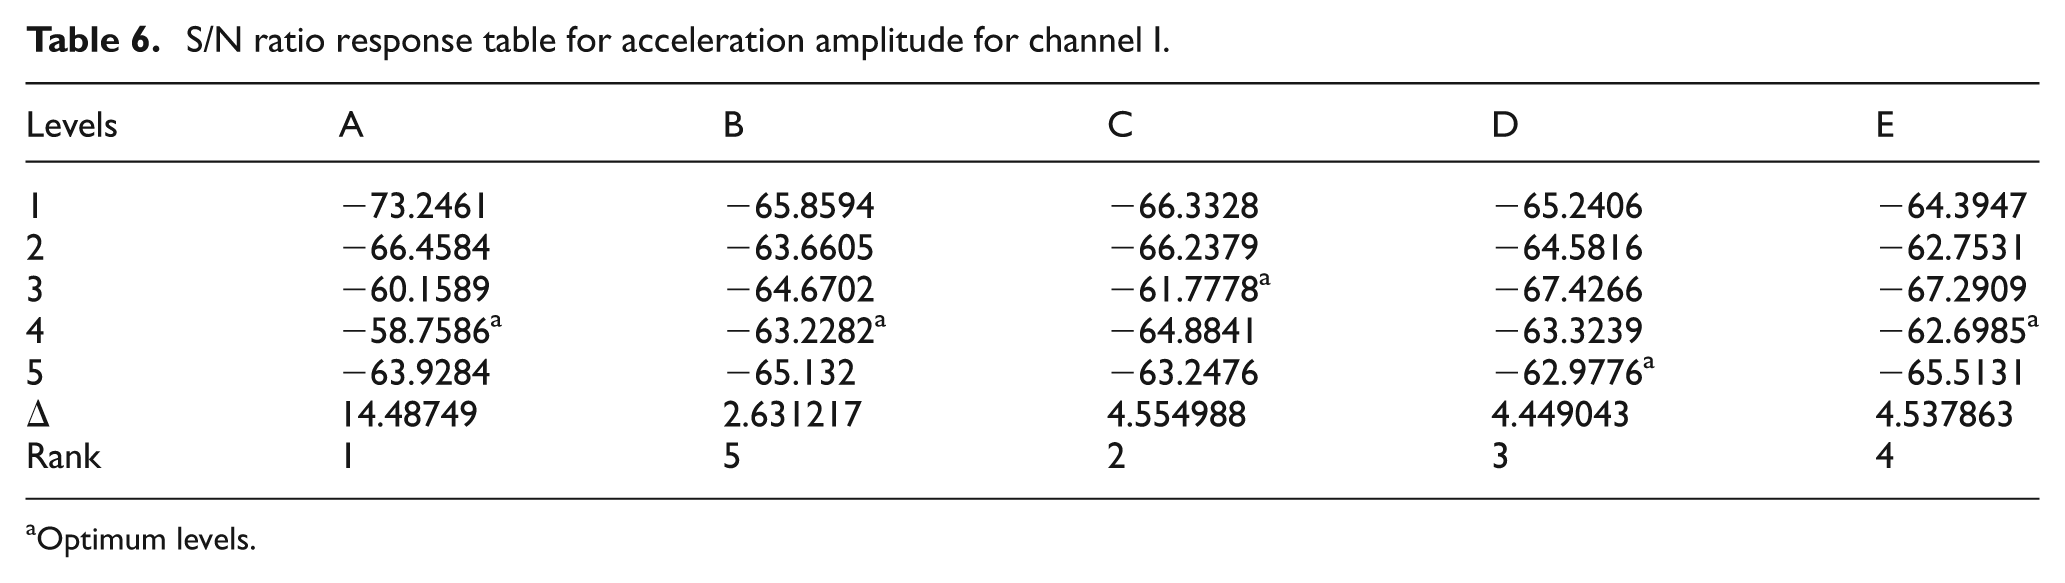
Optimum levels
S/N ratio response table for acceleration amplitude for channel II.
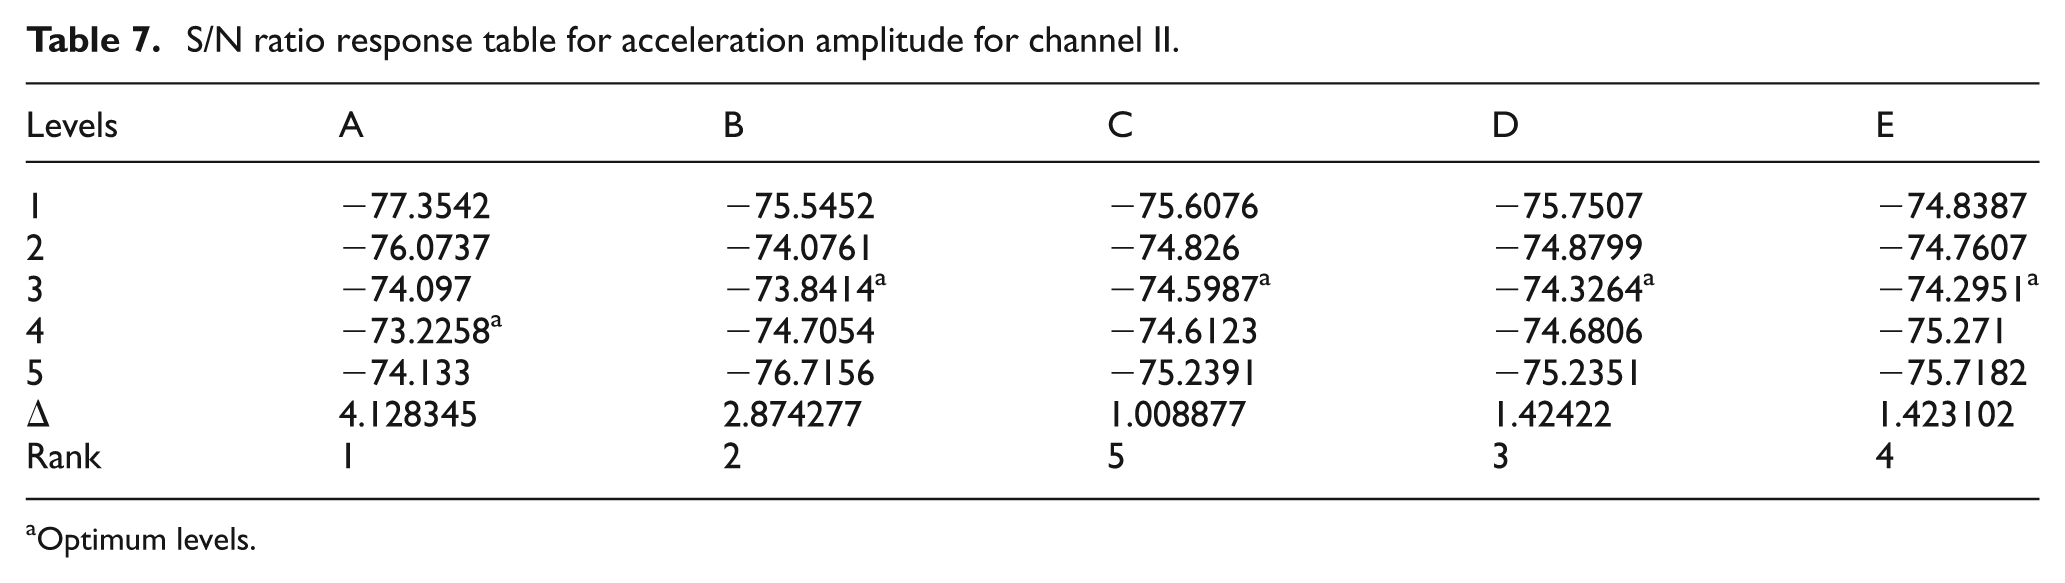
Optimum levels.
From Table 4, based on the mean value of the acceleration amplitude (channel I) for each level, the difference between the maximum and minimum values was calculated. The maximum difference will give the most significant parameters, and rank for the significant parameters is depicted. From Table 4, it is inferred that the optimal combination that yielded reduced vibration amplitude which had been picked at the workpiece holder (channel I) is A4 B4 C3 D5 E4. The ranks of the significant parameters are rated as helix angle (rank 1), feed rate (rank 2), axial depth of cut (rank 3), radial depth of cut (rank 4) and spindle speed (rank 5). From Table 5, based on the mean value of the acceleration amplitude (channel II) for each level, the difference between the maximum and minimum values was calculated. The maximum difference will give the most significant parameters, and rank for the significant parameters is depicted. From Table 5, it is inferred that the optimal combination that yielded reduced vibration amplitude which had been picked at the spindle (channel II) is A4 B3 C3 D3 E3. The ranks of the significant parameters are rated as helix angle (rank 1), spindle speed (rank 2), axial depth of cut (rank 3), radial depth of cut (rank 4) and feed rate (rank 5). The effect of process parameters resulting from the optimization process is plotted in Figures 2 and 3.
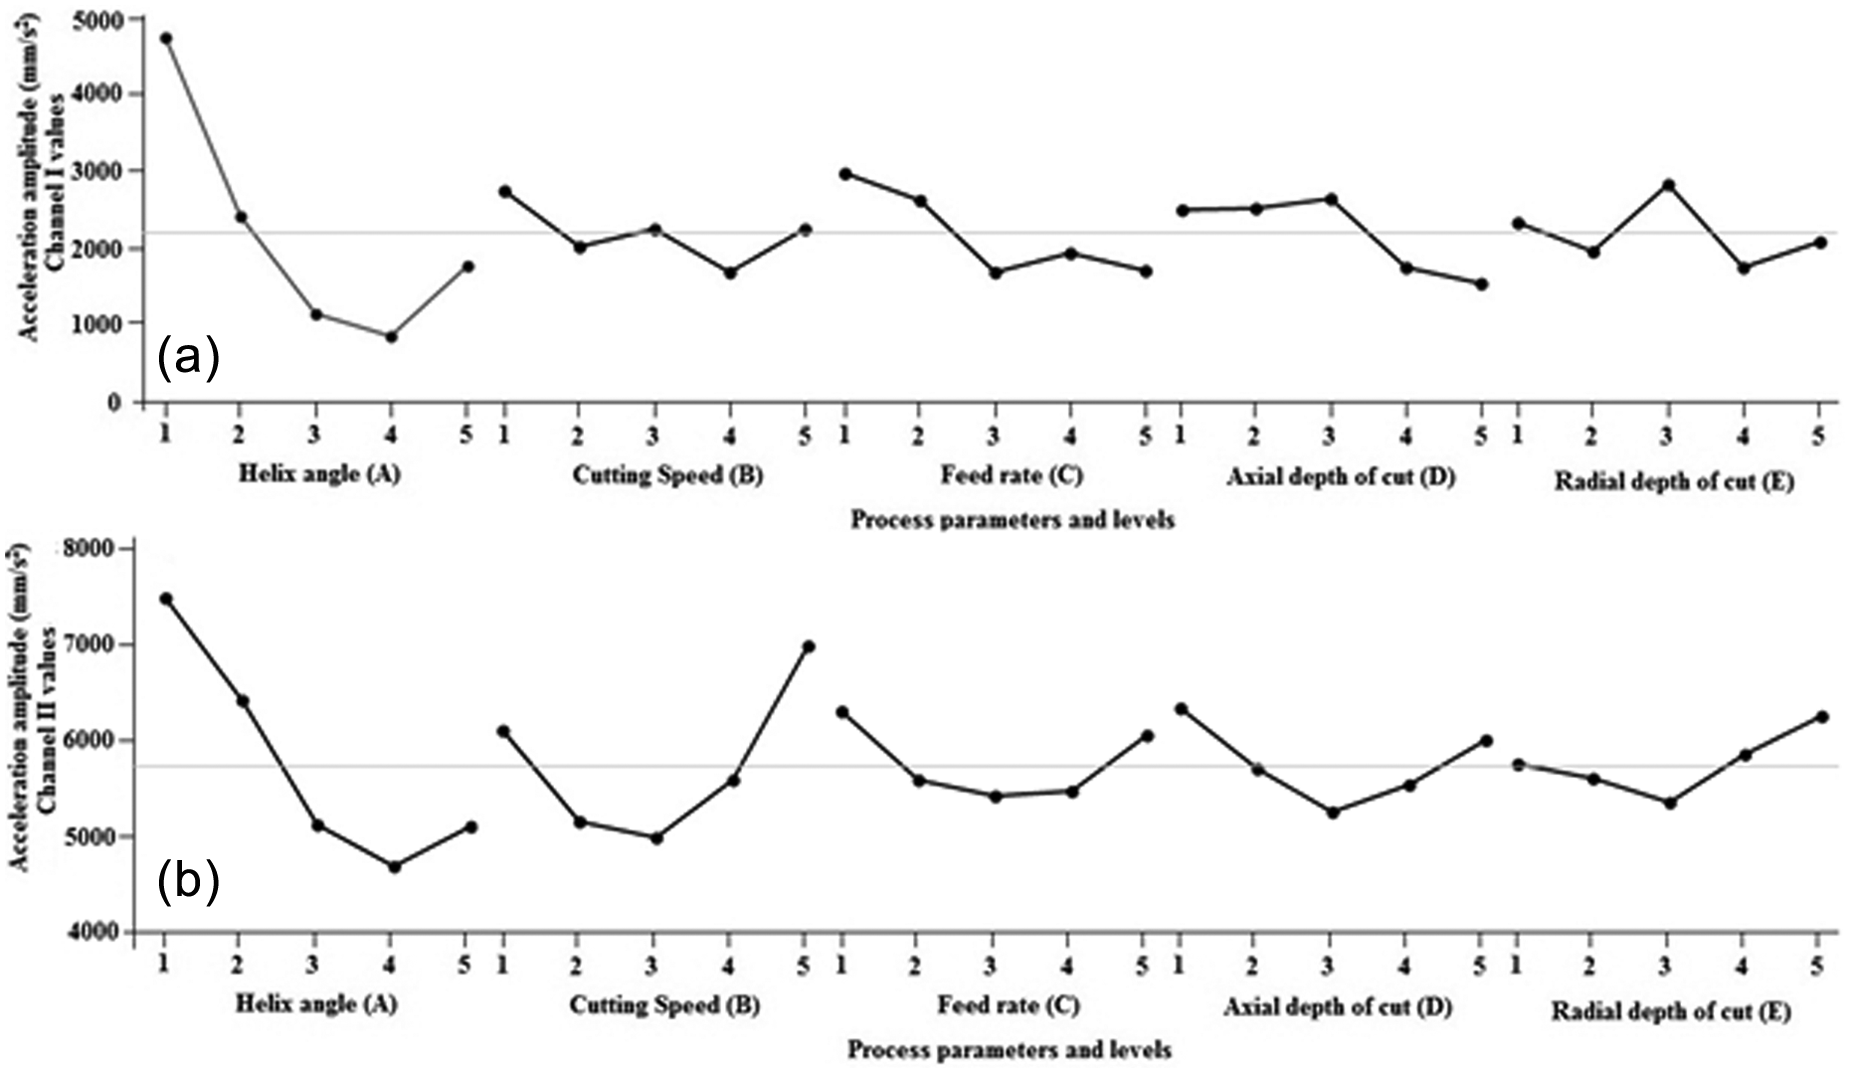
Effect of process parameters on acceleration amplitude of (a) channel I and (b) channel II.
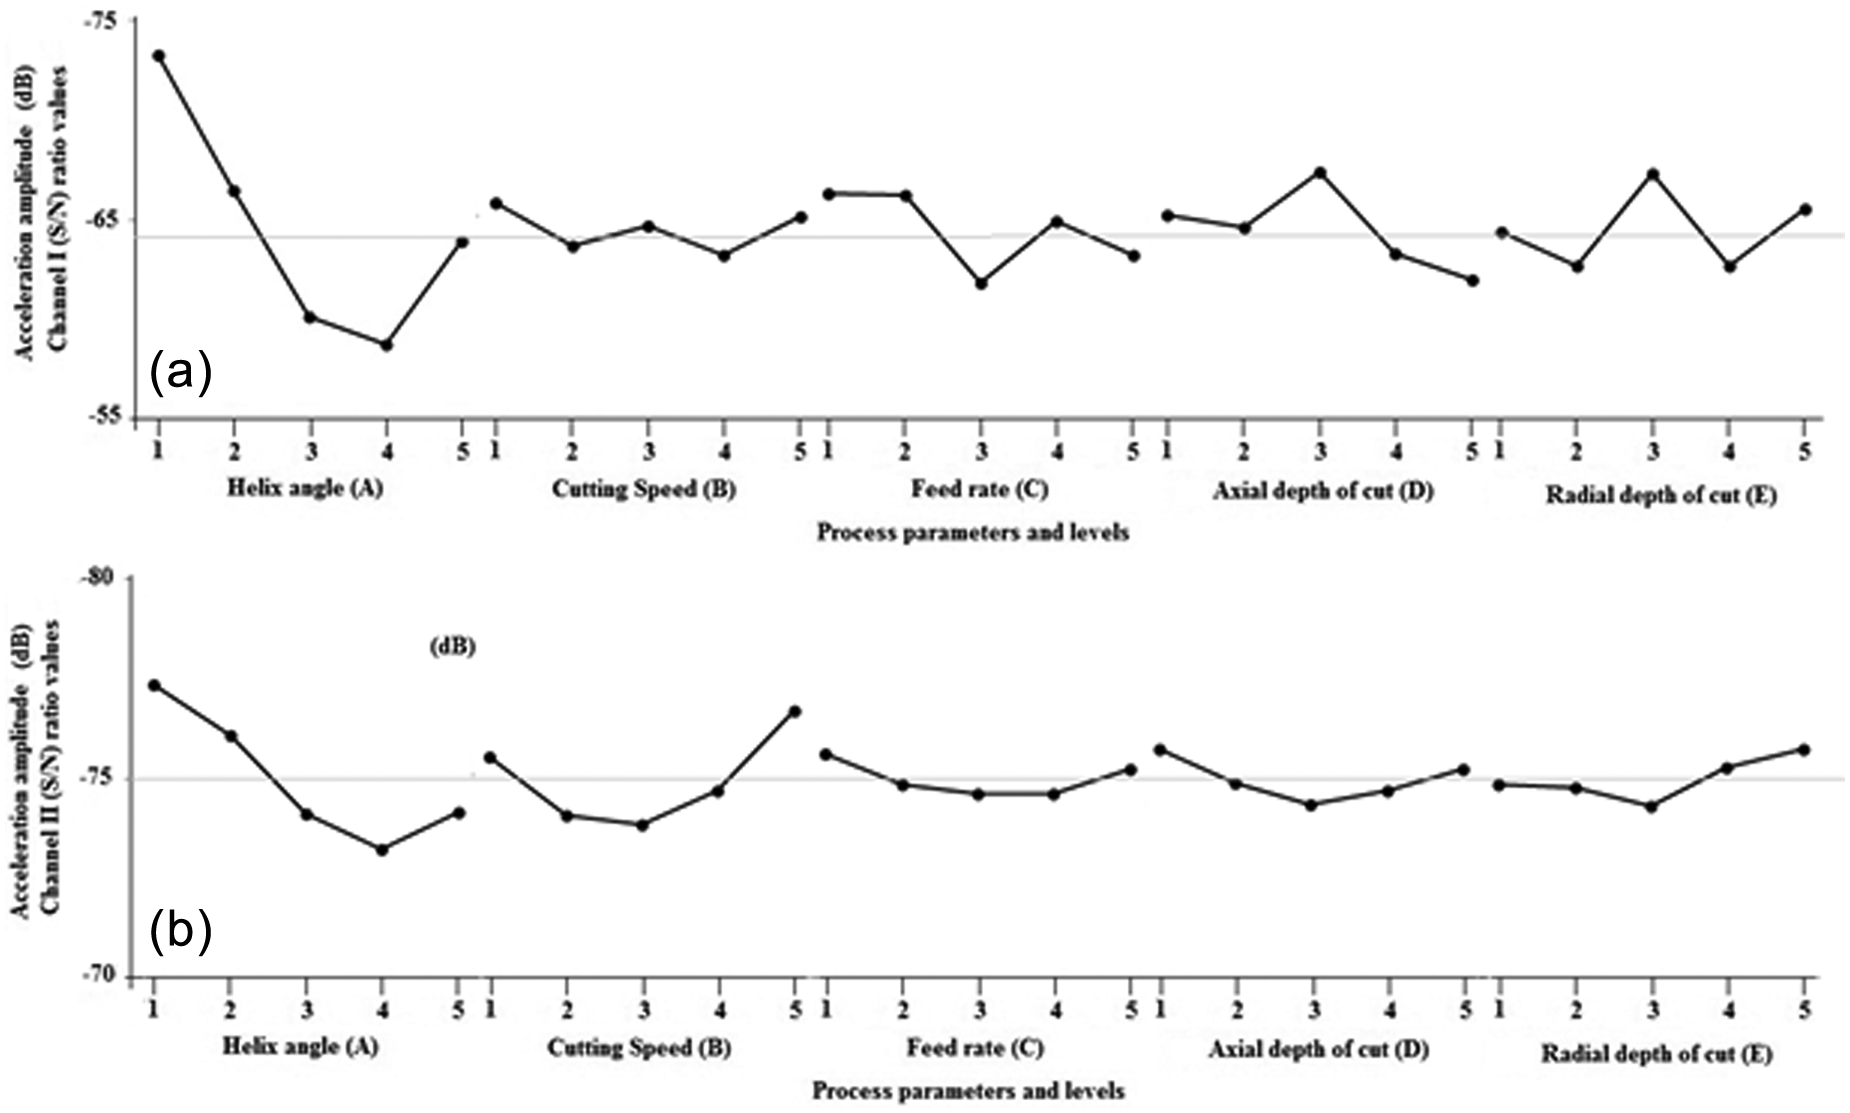
Effect of process parameters on S/N ratio of acceleration amplitude of (a) channel I and (b) channel II.
ANOVA
ANOVA is a statistically based objective decision-making tool that was employed to examine the influence of process parameters on quality characteristics. It helps in testing the significance of all process parameters by comparing the mean square against an estimate of the experimental error at specific confidence levels. This is done by calculating the variability of the S/N ratios (sum of the squared deviations from the total mean S/N ratio) into contributions by each process parameter and error. The percentage contributions of variance are estimated by the following equations.
The total sum of the squared deviations (SST) from the total mean S/N ratio can be expressed as
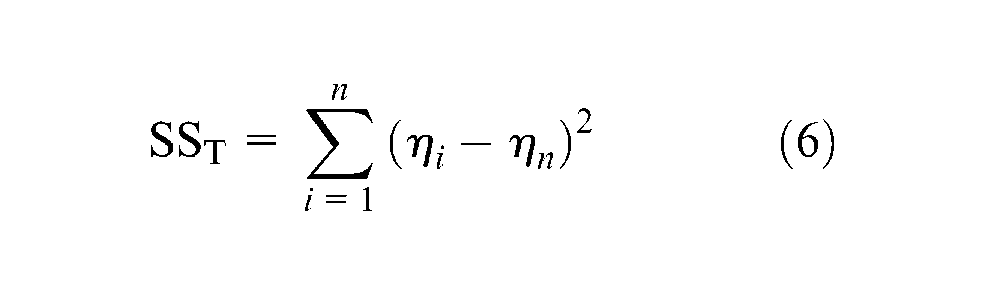
where n is the number of experiment in the orthogonal array, ηi is the S/N ratio of the ith experiment and ηn is the total mean S/N ratio.
The percentage contribution of variance (ρ) can be calculated as follows
where SSD is the sum of the squares of deviation.
F-test is a statistical tool (the mean square error to residual) in ANOVA used to determine the most significant process parameters that influence the quality characteristic. A high F-value will be most influential on the response quality characteristic. p-value demonstrates the significance level (significant or nonsignificant) of the process parameter. Tables 8 and 9 give the results of ANOVA for acceleration amplitude (channels I and II), respectively.
ANOVA results for acceleration amplitude (channel I).
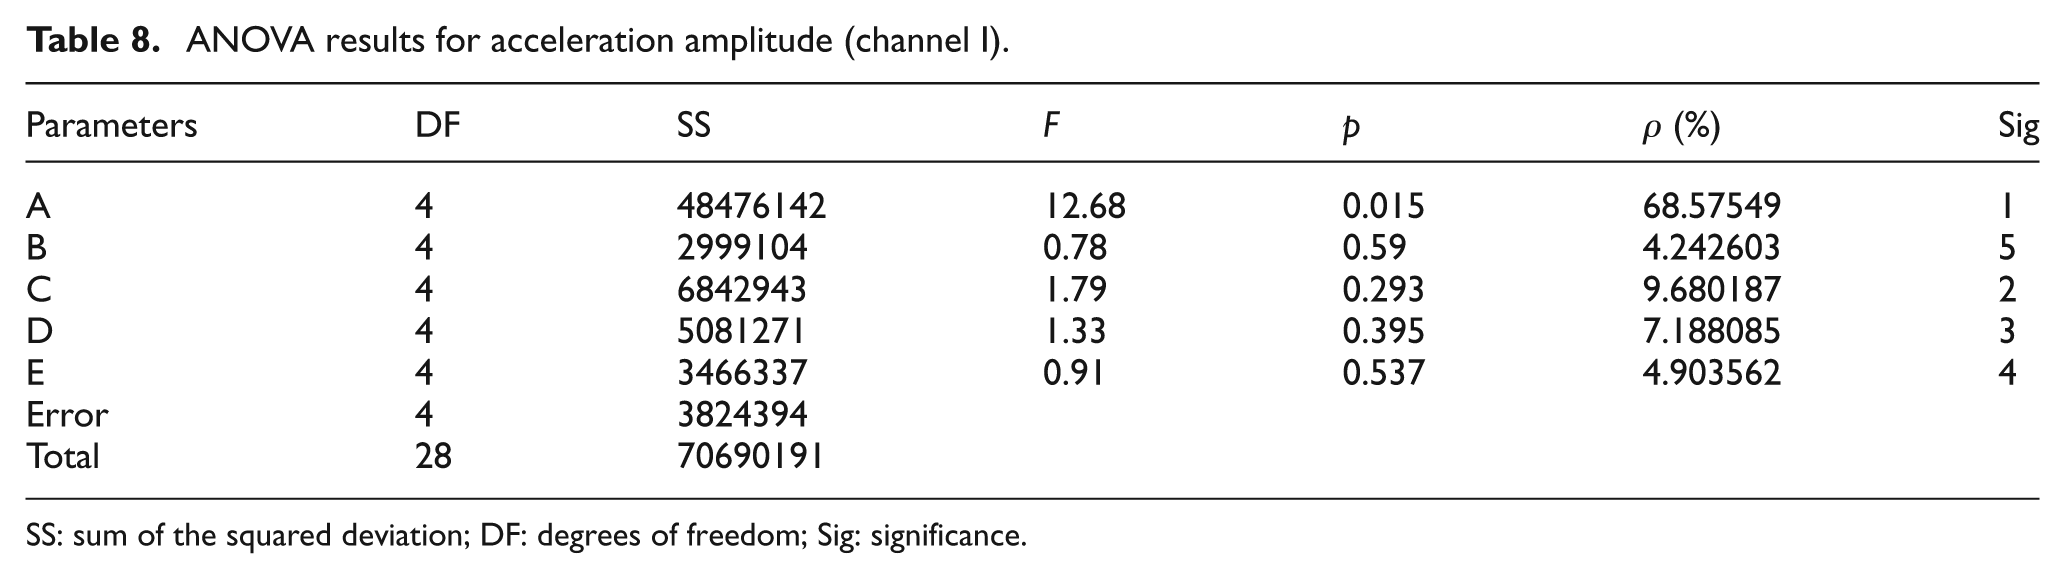
SS: sum of the squared deviation; DF: degrees of freedom; Sig: significance.
ANOVA results for acceleration amplitude (channel II).
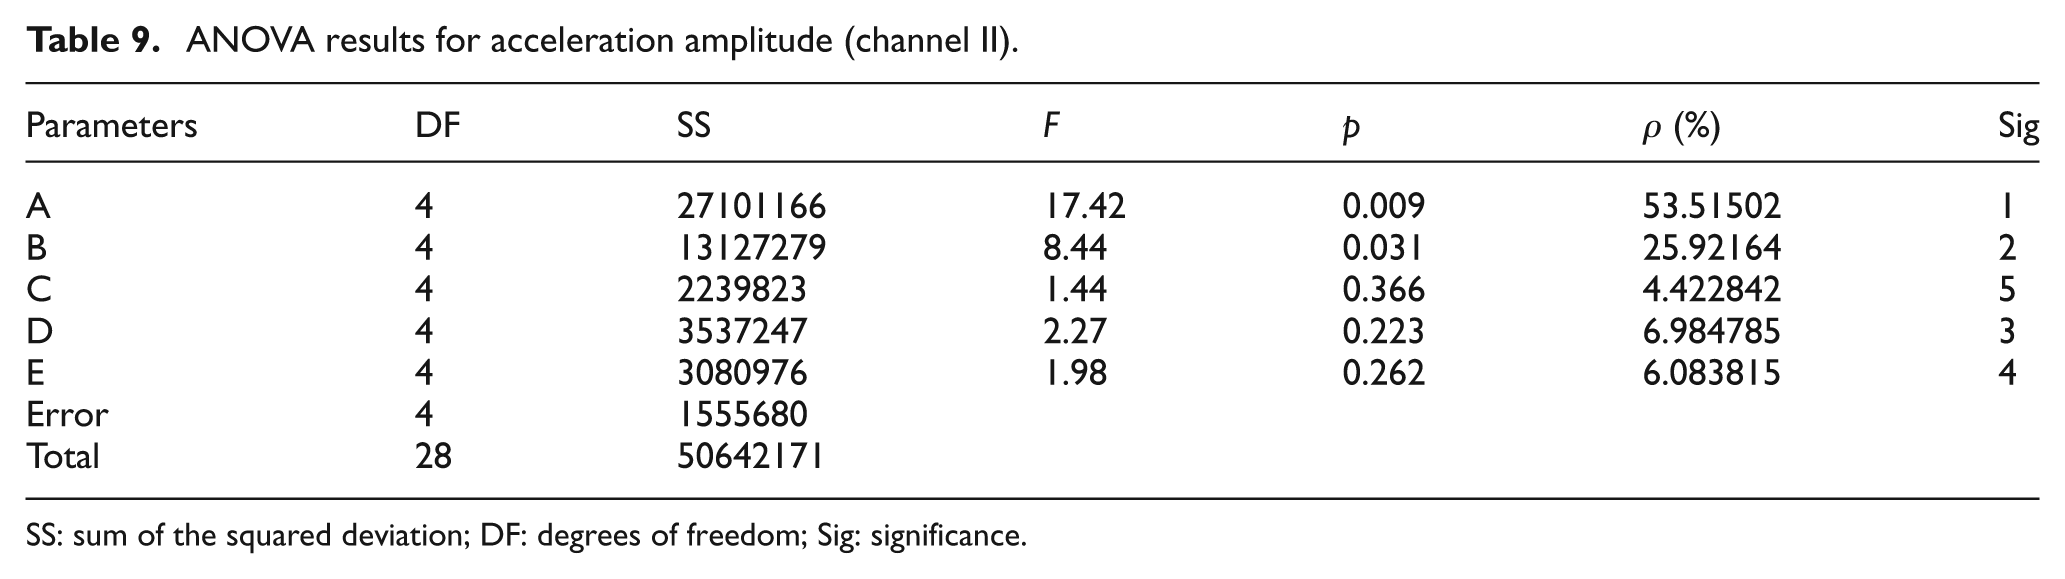
SS: sum of the squared deviation; DF: degrees of freedom; Sig: significance.
From Table 8, it is observed that the most significant parameters that influence acceleration amplitude measured at the workpiece (channel I) are order of helix angle, A (68.58%); feed rate, C (9.68%); axial depth of cut, D (7.19%); radial depth of cut, E (4.9%) and spindle speed, B (4.24%).
From Table 9, it is observed that the most significant parameters that influence acceleration amplitude that picked at the spindle (channel II) are order of helix angle, A (53.52%); spindle speed, B (25.92%); axial depth of cut, D (6.98%); radial depth of cut, E (6.08%) and feed rate, C (4.42%).
Gray relational analysis
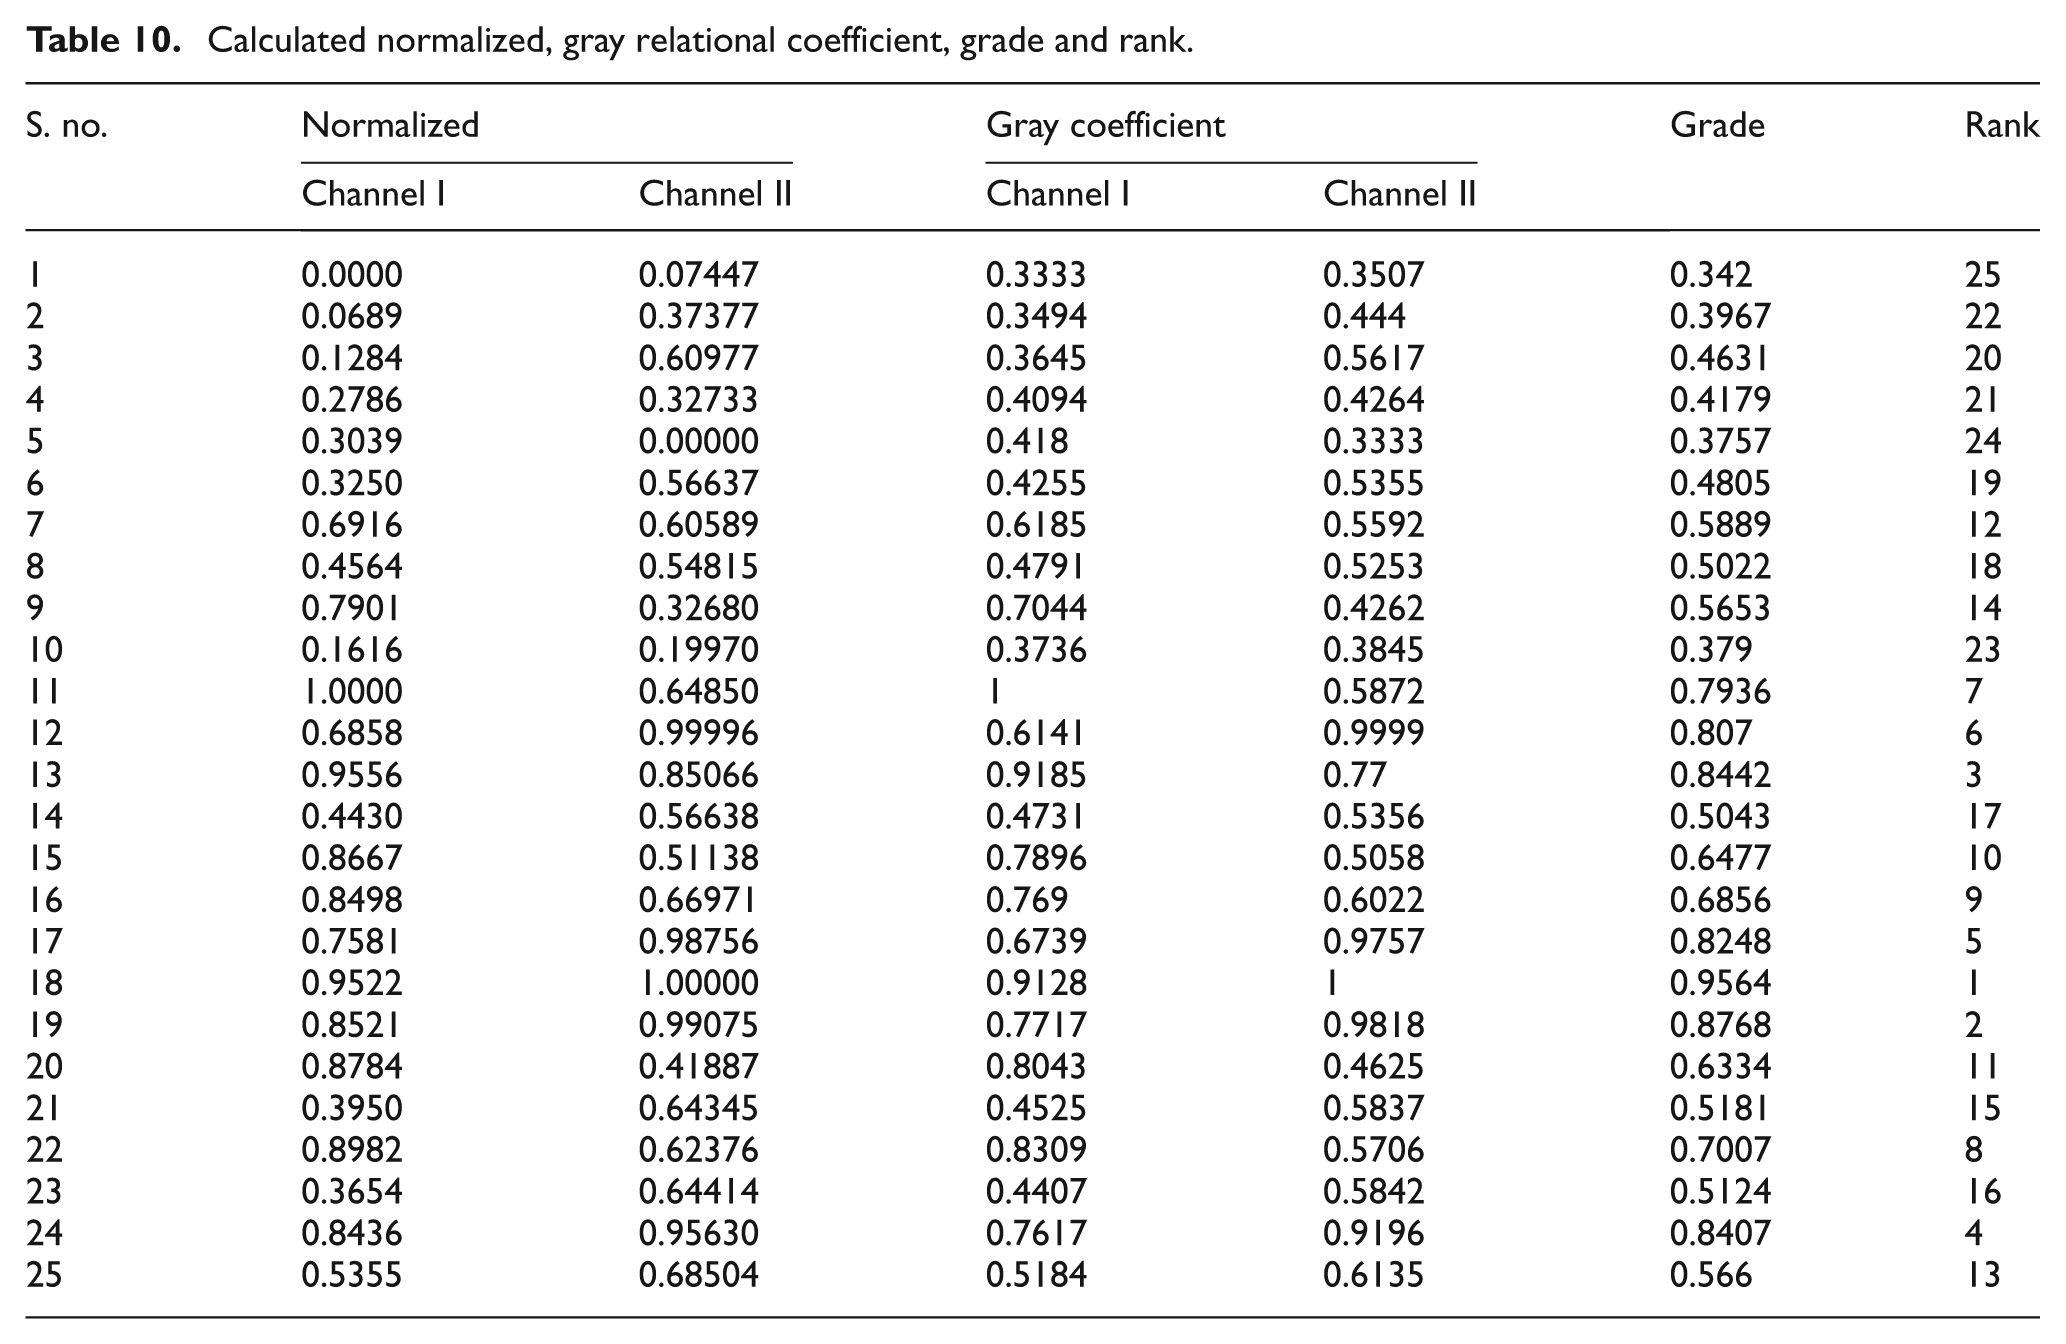
The optimized results of acceleration amplitude picked at two different positions using Taguchi method give two different combinations. In order to investigate the optimization of machining parameters that take the accountability of both acceleration amplitudes (channels I and II), the analysis of multiple performance characteristics is required. Gray relational analysis is employed to determine the optimal machining parameters by considering acceleration amplitude picked at both positions. The S/N ratio calculated from Taguchi method was normalized by using equation (3) that converts the original sequence to a set of comparable sequence and is listed in Table 10. The gray relational coefficient is calculated using equation (4), and corresponding combination grade and rank were manipulated and listed in Table 10. From Table 10, it is inferred that out of the experimental run, experiment number 18 is the optimized combination which will result in lesser acceleration amplitude. Their combination is A4 B3 C1 D4 E2.
Calculated normalized, gray relational coefficient, grade and rank.
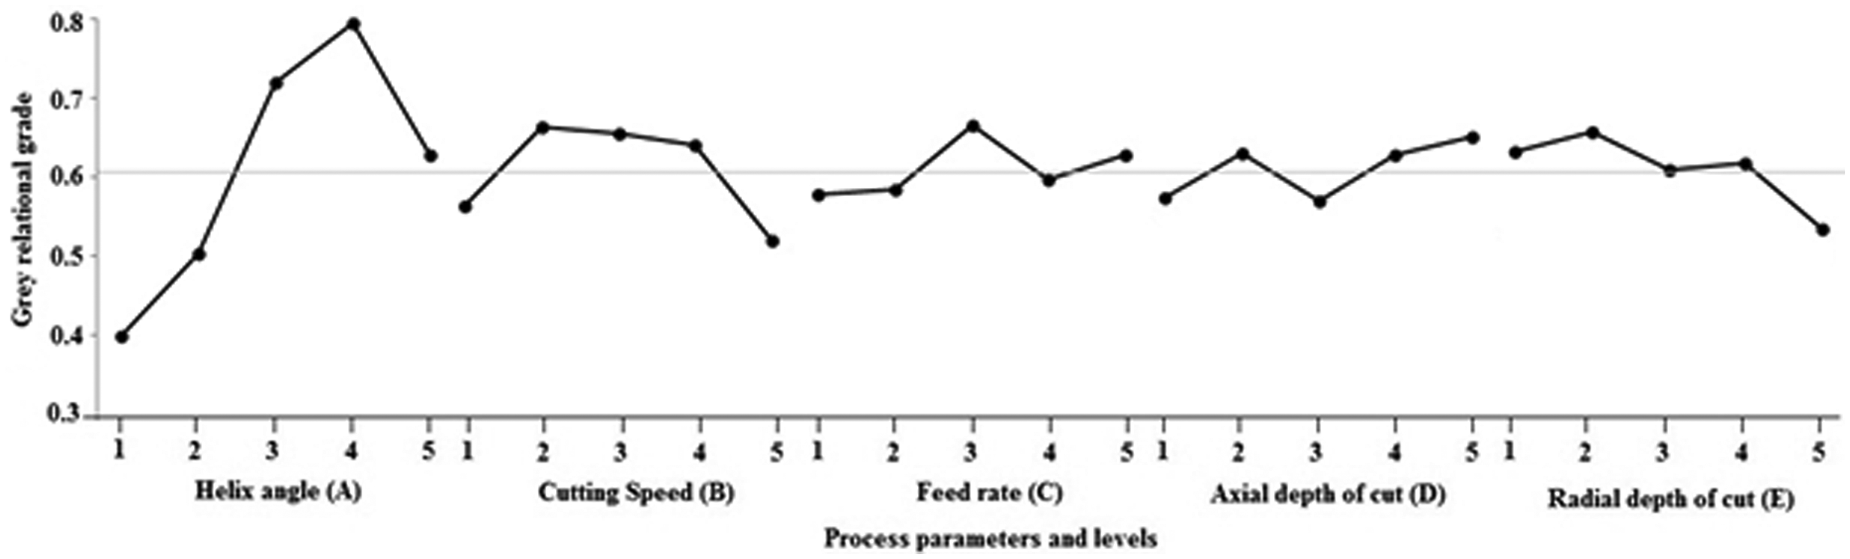
The effect of each machining parameters on the gray relational grade at different levels can be independent because the experimental design is orthogonal. From Table 11, based on the mean value of the gray relational grade for each level, the difference between the maximum and minimum values was calculated. The maximum difference will give the most significant parameters, and rank for the significant parameters is depicted. From Table 11, it is inferred that the optimal combination that yields reduced vibration amplitude for multiple performances (both acceleration amplitudes picked at both channels) is A4 B2 C3 D5 E2. The ranks of the significant parameters are rated as helix angle (rank 1), spindle speed (rank 2), radial depth of cut (rank 3), feed rate (rank 4) and axial depth of cut (rank 5). The effect of process parameters resulting from the optimization process is plotted in Figure 4.
Response table for gray relational grade.
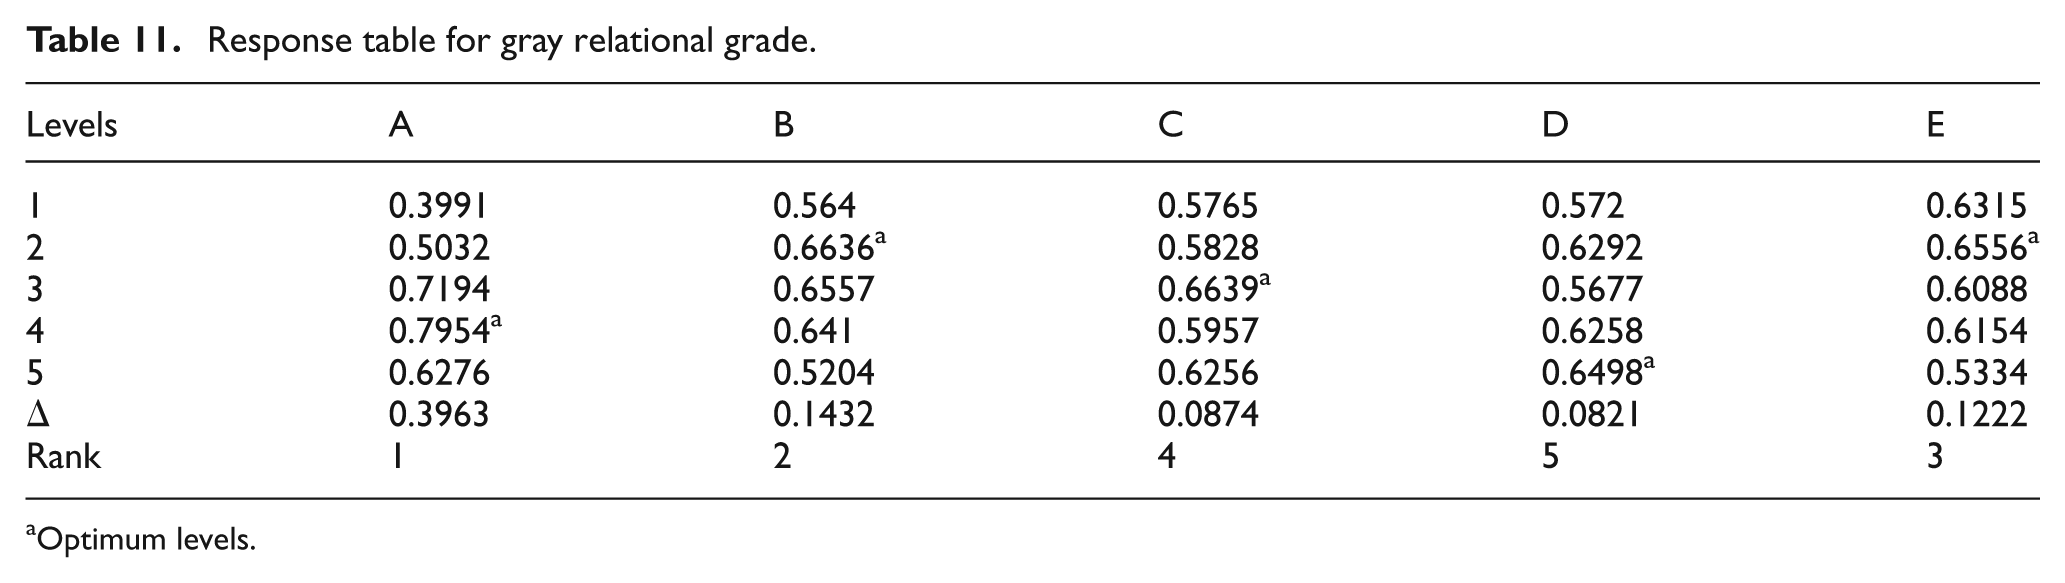
Optimum levels.
Effect of process parameters on gray relational grade.
Table 12 gives the results of ANOVA for gray relational grade. From Table 12, it is observed that the most significant parameters that influence acceleration amplitude are order of helix angle, A (65.75%); spindle speed, B (10.3%); radial depth of cut, E (5.41%); feed rate, C (3.47%); and axial depth of cut, D (3.34%).
ANOVA results for gray relational grade.
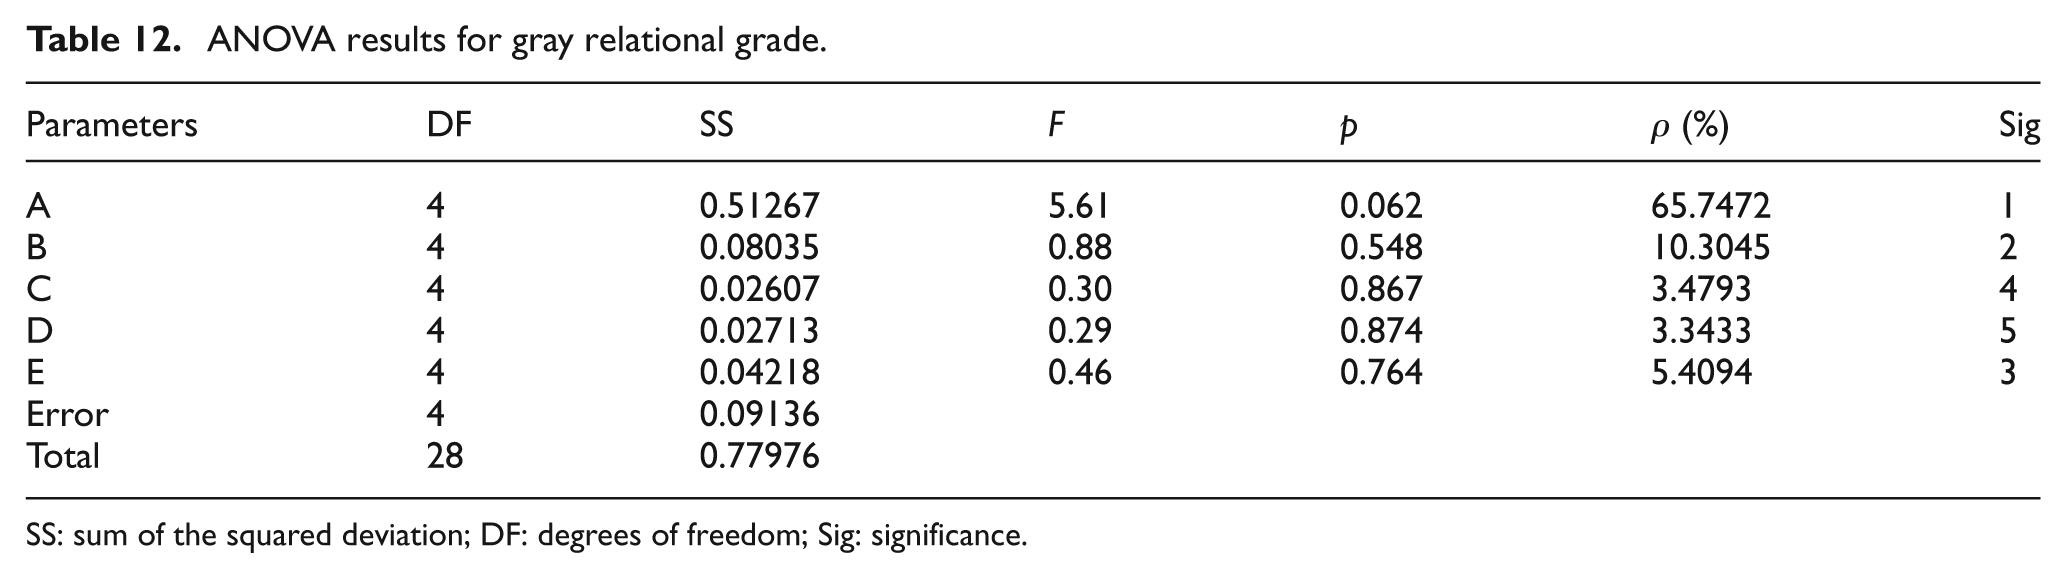
SS: sum of the squared deviation; DF: degrees of freedom; Sig: significance.
Confirmation test
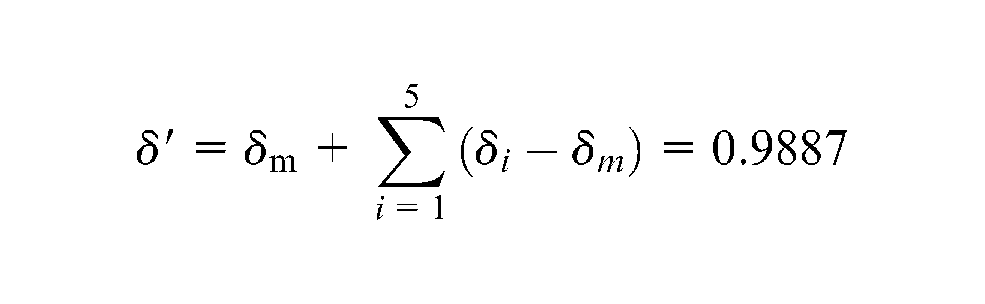
After evaluating the optimal parameter setting, the next step is to evaluate and verify the enhancement of quality characteristics using the optimal parametric combination. From the experiments through Taguchi orthogonal array applying gray relational analysis, the optimal combination is identified as A4 B2 C3 D5 E2. An outcome of ANOVA indicates that all the machining parameters are significantly contributing to the response. Hence, all the parameters are included in predicting estimated gray relational grade. The estimated gray relational grade using the optimal level of the design parameters can be calculated as
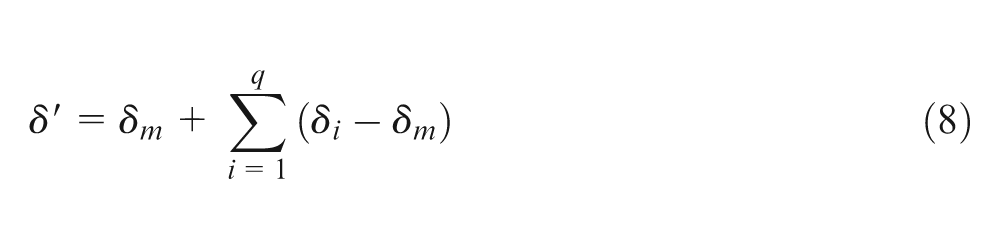
where δ′ is gray relational grade for predicting the optimal machining parameters, δi is the average gray relational grade of the optimal level of machining parameters, δm is the average gray relational grade and q is the number of machining parameters.
Gray relational grade for predicting optimal machining parameters can be computed as follows
The confirmation is conducted by taking optimal combination of machining parameters A4 B2 C3 D5 E2. Comparison of the acceleration amplitude for the channels I and II between the initial parameters and optimal parameter combination is shown in Table 13. It is found that the optimal parameter combination reduces the acceleration amplitude in the gray relation grade for about 40.1%.
Comparison between the initial and optimal parameters.
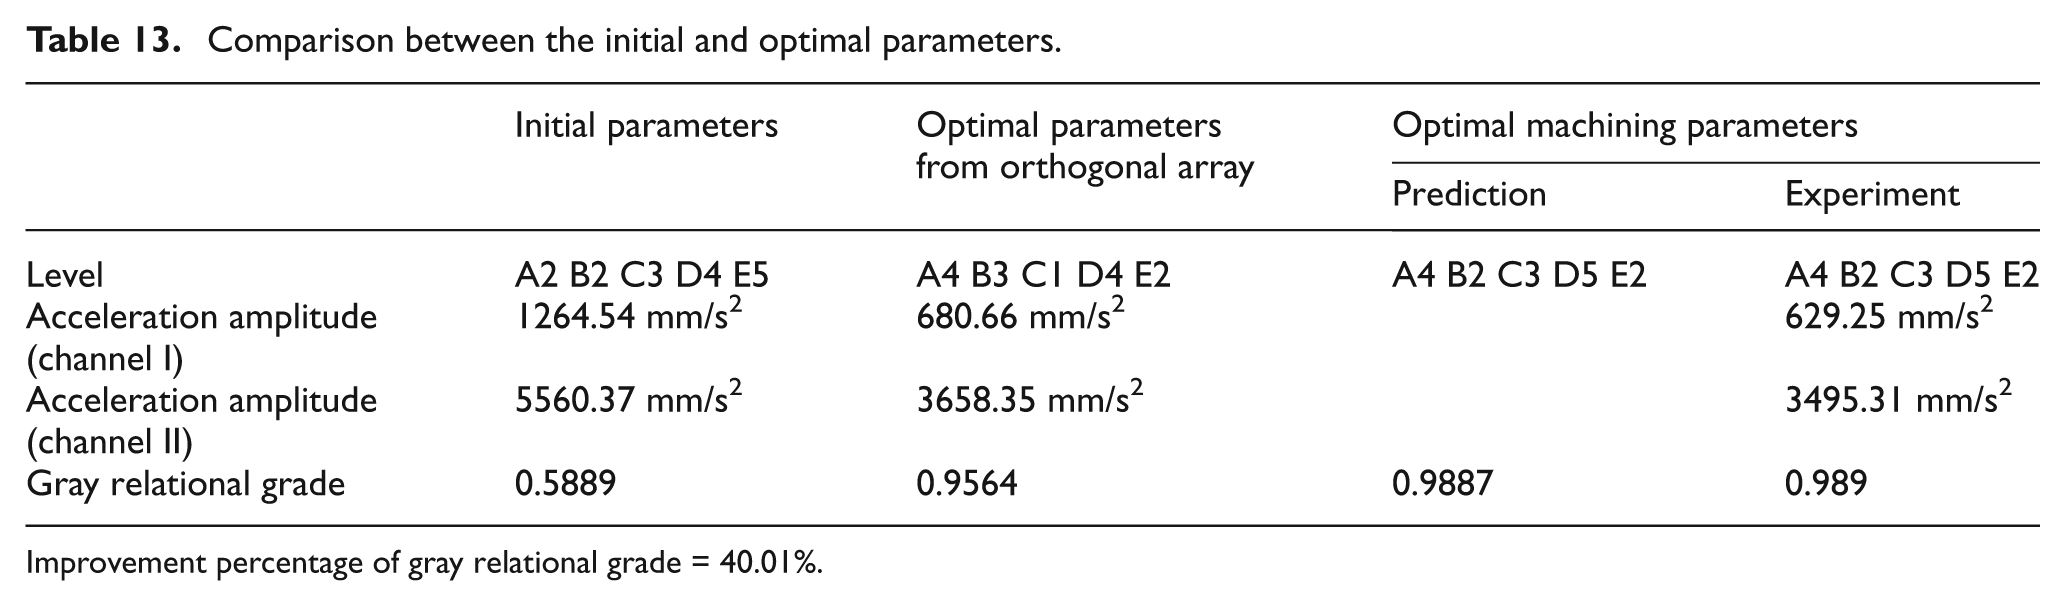
Improvement percentage of gray relational grade = 40.01%.
Conclusion
The vibration amplitude was measured as a performance measure in this study, which when increases indirectly produces poor surface finish and causes rapid tool wear. This study deals with the application of gray-based Taguchi approach to determine the optimal combination of machining parameters for reduced acceleration amplitude. By the experimental and analytical results, the conclusions that were drawn can be summarized into following points:
The effect of machining parameters on the acceleration picked at two prominent positions, that is, at workpiece holder (channel I) and at spindle (channel II), was evaluated using Taguchi method. The helix angle was found to be the most significant parameter that influences acceleration amplitude measured at channels I and II. The optimal combinations of machining parameter for reduced amplitude were determined.
The gray relation analysis was done to determine optimal combination of machining parameters for multiple performance characteristics (i.e. considering both responses at a time). Using gray-based Taguchi technique revealed that the helix angle was the most significant parameter. The optimal combinations of machining parameter for reduced amplitude were determined, and it was found to be A4 B2 C3 D5 E2.
Confirmation experiments were done to evaluate the enhancement in the performance measure by using gray relation technique. The optimal combination parameter is compared with the initial parameter. Utilization of the optimal combination of machining parameter enhances a significant improvement of gray relation.
Footnotes
Acknowledgements
Some portions of this text are used with kind permission from Springer Science+Business Media: The International Journal of Advanced Manufacturing Technology, Prediction of vibration amplitude from machining parameters by response surface methodology in end milling, 53(5), 2011, pp. 453–461, P. S. Sivasakthivel, V. Velmurugan and R. Sudhakaran.
Declaration of conflicting interests
The authors declare that there is no conflict of interest.
Funding
This research received no specific grant from any funding agency in the public, commercial or not-for-profit sectors.