
Abstract
Micro features are generated on SS-304 stainless steel by electrochemical micromachining. This research aims at the development of best method of micro profile generation for micro components based on electrochemical micromachining in terms of reduced taper angle, overcut, edge deviation and time of machining using cylindrical micro tool. Sinking and milling method is a new approach to microchannel generation, where a micro tool moves vertically to final depth or required depth of machined feature followed by milling along the path of the micro features. The experimental study of process parameters such as pulse frequency of applied voltage, electrolyte concentration, pulse width, micro tool feed rate, machining time and depth of sinking by micro tool is conducted for the investigation and comparative analysis of their effects on material dissolution during micro profile generation utilizing scanning layer-by-layer method as well as sinking and milling method. Machining zone has been simulated in two positions of micro tool, and it has been established that taper less through microchannels can be generated by the scanning method and the sinking and milling method. Complex taper less micro features such as channel net, “U” shape and “S” shape were machined. Micro profile of narrow entry width of 32 µm was machined on 50-µm-thick SS-304 sheet. Very narrow micro profile of 23 µm was also machined on 35-µm-thick SS-304 sheet by the fabricated micro tool of ϕ = 8 µm utilizing the new approach of sinking and milling in electrochemical micromachining.
Keywords
Introduction
Micromachining techniques find wider application in industries such as semiconductor, avionics, automotive, biomedical devices, optics, microfluidic systems, micro-moulds and ultra-precision machinery. Micro profiles are essential parts of micro-sensors, chemical micro-reactors, microfluidic systems, heat exchangers of computer chips and so on. For the generation of micro features, new technologies such as micro mechanical milling, micro electrodischarge machining (EDM), micro laser machining and micro electrochemical machining (ECM) are utilized.1,2 Electrochemical micromachining (EMM) is gaining importance day by day as a micromachining technology due to specific advantages such as no tool wear, absence of stress, no heat affected zone, high material removal rate (MRR), bright surface finish and ability to machine complex shapes regardless of hardness. EMM is ECM which removes material in submicron range. In this process, workpiece is connected to anode and micro tool is connected to cathode and both are dipped in electrolyte separated by very small inter-electrode gap (IEG). Two techniques are adopted for the generation of micro features. In scanning method, the micro tool moves with high scanning speed maintaining IEG while micromachining continues along the path of micro tool movement. Sinking and milling method is another new approach of microchannel generation, where a micro tool moves vertically to a certain depth for sinking followed by milling with slow speed along the path of micro feature generation.
Lee et al. 3 generated microgrooves with variation of depth identified by machining current and IEG size, on the air-lubricated hydrodynamic bearing. Malapati and Bhattacharyya 4 generated through as well as blind microchannels on copper foil by scanning machining layer-by-layer method. Yong et al. 5 fabricated two-dimensional (2D) and 3D complex structures by micro electrochemical milling process, which involved movement of micro tool along the scheduled path several times. Kim et al. 6 machined microgroove and 3D microstructures on stainless steel by micro electrochemical milling where electrode was scanned layer by layer along the tool path. Forster et al. 7 introduced oscillating tool with 50 Hz frequency and 200 µm amplitude for die sinking in stainless steel by ECM for the improvement of shaping accuracy. Kirchner et al. 8 made three-dimensional microelements on stainless steel applying nanosecond voltage pulses using a mixed electrolyte of HF and HCl. Kim et al. 9 explained taper reduction technique with disk-type electrode on stainless steel machining. Ryu 10 used environmentally friendly citric acid as an electrolyte, for the generation of micro square cavity and micro circular cavity on stainless steel. Schuster et al. 11 used ultra-short pulse voltage experimentally to fabricate an ultra-size copper structure and copper tongue based on the finite time constant for double-layer charging. Ahn et al. 12 drilled micro holes on stainless steel plate using nanosecond pulses in H2SO4 electrolyte with fabricated tungsten carbide tools. The scanning method of microchannel generation has some drawbacks such as higher overcut, higher machining time and higher widths at both the ends of microchannel. Though micro profiles have wide applications, not so much research on this area, particularly for stainless steel, has been reported. Adequate research in EMM is still required for the generation of micro profiles with less taper, less overcut and less deviation at the point of turning of micro tool.
The present research highlights the experimental study of various process parameters such as pulse frequency of applied voltage, electrolyte concentration, pulse width, micro tool feed rate, machining time and depth of sinking by micro tool while micro features were being generated by the novel method of sinking and milling. After proper analysis of the effects of process parameters on material dissolution, micro features have been generated on stainless steel with the aim of reducing taper angle, overcut and edge deviation.
Fundamentals of EMM
Anode and cathode separated by a very narrow gap and having appropriate electrolyte between the electrodes results in the dissolution of anode, and the shape generated is generally negative impression of cathode tool. Mathematically, according to Faraday’s two laws of electrolysis, amount of material dissolved per unit time is given by

where m = mass dissolved, t = time in seconds, i = current in Amperes, M = molecular mass, z = valency of anodic metal and F = Faraday constant. The current efficiency, η, is defined as the ratio of the actual amount of metal dissolved to the theoretical amount as predicted by Faraday’s laws. In addition to electrolyte resistance, two important surface phenomena such as charge transfer resistance and resistance due to double-layer capacitance govern the actual amount of dissolution. When an electrode is dipped in electrolyte, charge transfer occurs both in forward and backward directions creating a reversible condition. For actual metal dissolution, reaction must be irreversible and the resistance involved is charge transfer resistance, which can be calculated from Butler–Volmer equation.
At a particular location near the dissolution area, let the small elemental area be dA and mass dissolved be dm = dAxρ, where x is the recession in perpendicular direction of dA and ρ is the density of metal dissolved. Now in two-dimensional case, rate of recession is
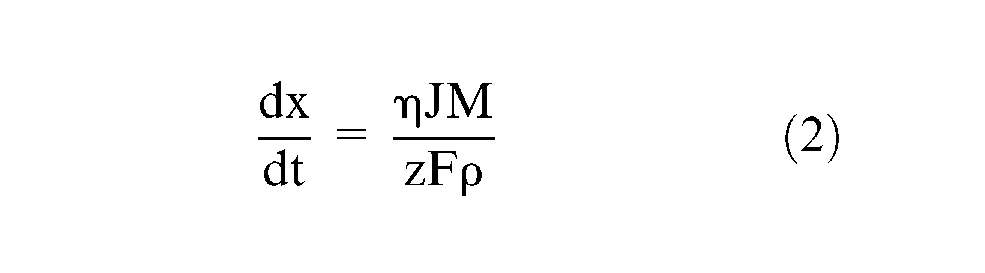
where J is the current density and most important parameter in determining the shape of anode and MRR. Current density depends on three phenomena such as migration, convection and diffusion of ions in addition to electrode reaction kinetics. Given the applied pulse voltage and an electrolyte of definite concentration, migration of ions at a point depends on electric field intensity, which is equal to the potential gradient at that point and is given by

Convection is the bodily movement of electrolyte, and the H2 gas evolution from cathode micro tool leads to convection at lower scale due to no external flow of electrolytes. Diffusion is the movement of ions through the concentration gradient. In EMM, pulsed power is applied, and excess metal ions diffuse away during off time of the cycle. Moreover, range of machining voltage is very low, and hence, concentration gradient will be bare minimum. Therefore, current density due to diffusion of ions can be neglected. It can be assumed that the current density is proportional to E. This equation is utilized for simulation of the machining zone in EMM.
The charging time constant at high frequency of pulsed voltage is well known and given by

where ρ e is specific resistance or resistivity of electrolyte, Cd is the double-layer capacitance and h is the IEG. In case of very high frequency (MHz range) of pulsed power supply for EMM, the path along the long distance between anode and cathode tool does not get enough time to be charged as the pulse cycle time is less than charging time. Thus, dissolution is localized where IEG is lowest. Due to this, not only current density but also pulse frequency plays a major role in MRR and generation of shape of micro features during EMM.
Novel approach of micro profile generation by sinking and milling
In the scanning method of microchannel generation, to and fro motion of the tool is given while machining continues on layer-by-layer basis between the front face of the micro tool and anodic workpiece as shown in Figure 1(a). Thus, the micro tool moves speedily and repeatedly over the same area of workpiece with micro feed downward before each scan movement. So far, this method has been reported in use for the microchannel generation in EMM, but this method has some disadvantages such as higher overcut, higher machining time and end deviation on both ends, that is, larger widths at both ends of generated micro profile. Moreover, chances of tool damage are always there due to high scan speed during EMM.
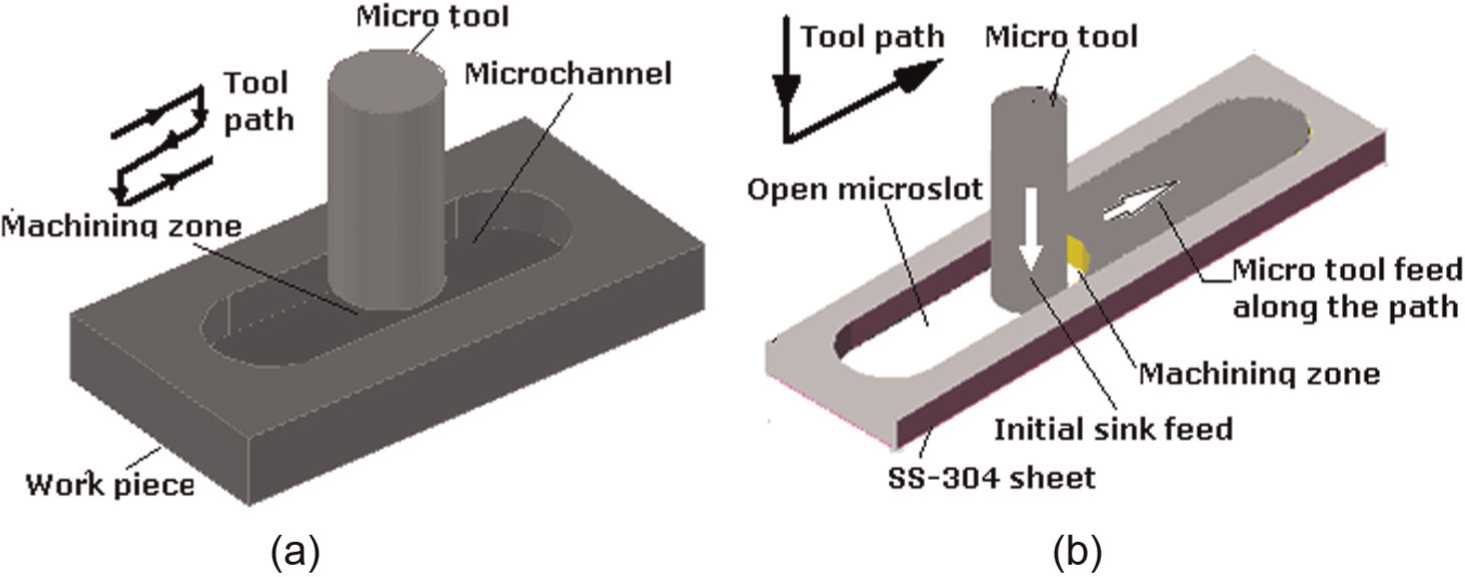
(a) Scanning method and (b) sinking and milling method.
Sinking and milling method of microchannel generation is a new approach, where micro drilling is performed to final depth or required depth of machined feature followed by milling along the path of the micro profile. Thus, the micro tool moves slowly and once over the path of micro profile during EMM. In case of through microchannel, front lateral surface of the micro tool is the active area taking part in micromachining as shown in Figure 1(b). This new method has advantages over the earlier one such as smaller overcut, smaller machining time and end deviation on the sink point only, that is, larger width at the pilot hole. Moreover, chances of micro tool damage are not there due to low tool feed during milling along the path of micro profile generation.
Simulation model for sinking and milling method
For the taper less through microchannel generation, the machining zone of cross-sectional area of a microchannel is simulated with the following assumptions:
The electric parameters are stable;
The conductivity of the electrolyte remains constant;
The concentration gradient in the bulk electrolyte is negligible;
The model is for through microchannel.
The electrical potential, V, in the IEG obeys Laplace’s equation

Boundary conditions are as follows
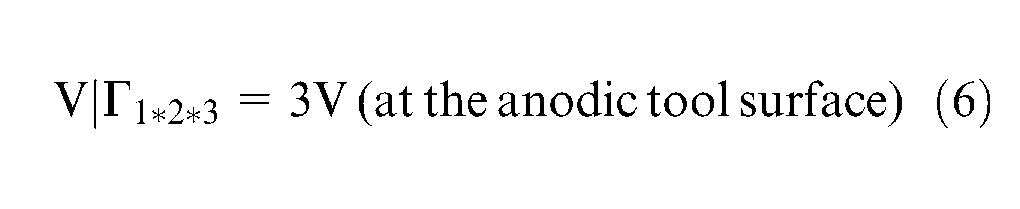
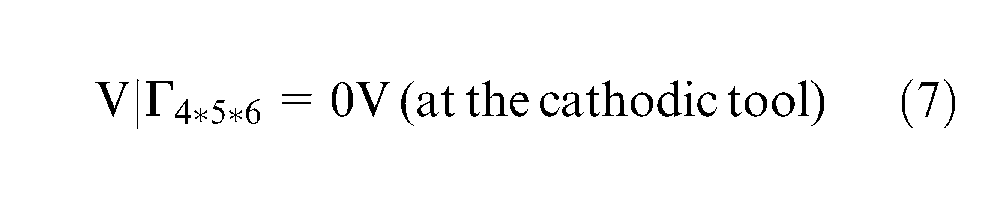
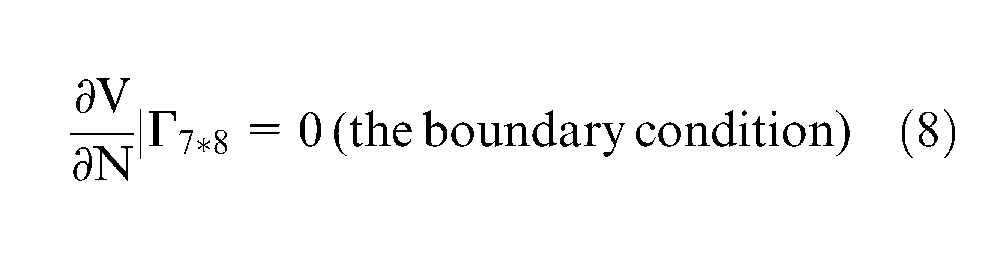
where V = 3 V applied between anode workpiece and micro tool and N is the surface normal. Laplace’s equation is solved subjected to given boundary conditions in MATLAB. Figure 2 exhibits equipotential curves distribution in the cross-sectional gap of micro tool and workpiece when the depth of micro tool is 35 µm measured from the top surface of the workpiece, that is, the front face of micro tool is at the same level of bottom surface of the workpiece. Workpiece thickness is 35 µm, and IEG is 10 µm.
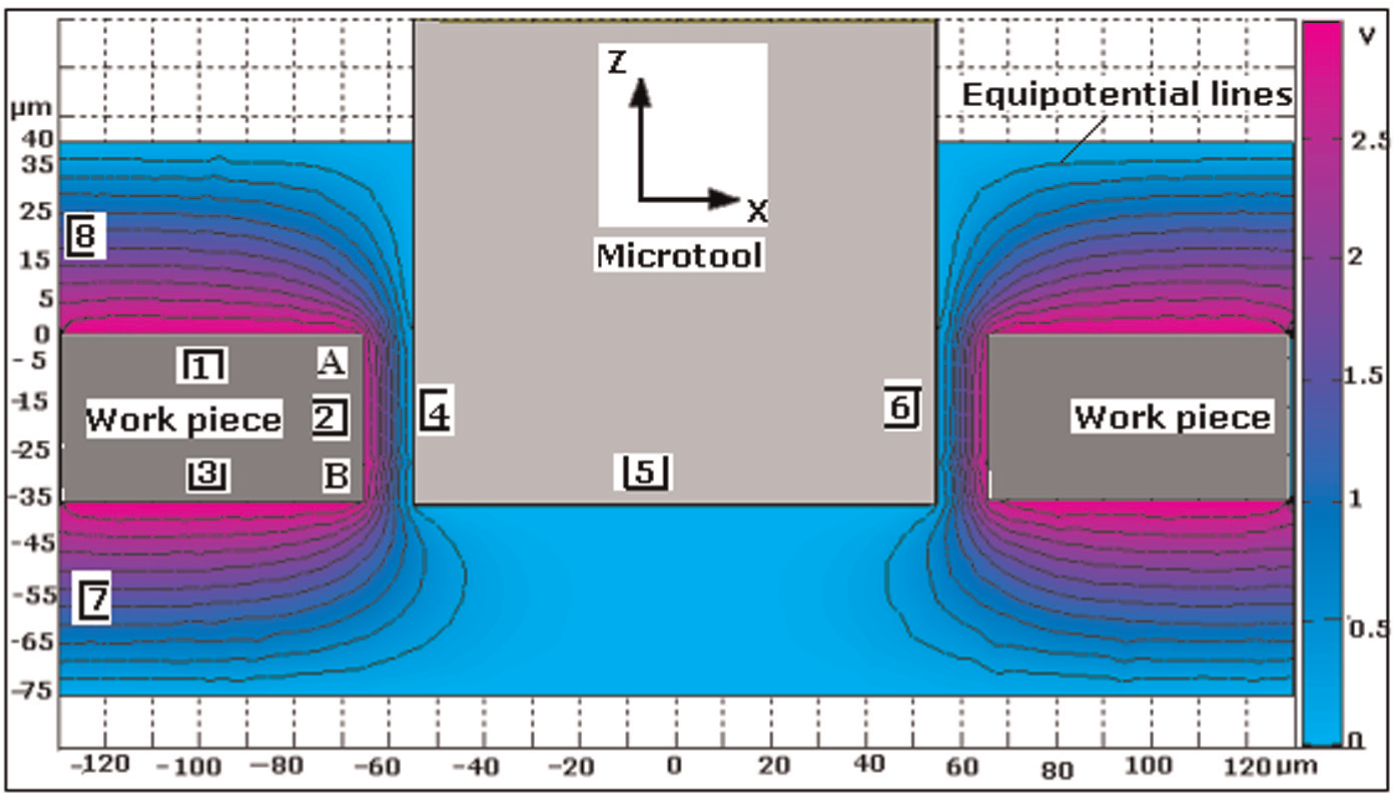
Equipotential curves in the gap of micro tool and workpiece at lower depth of micro tool.
Figure 3 exhibits equipotential curve distribution in the cross-sectional gap of micro tool and workpiece when the depth of micro tool is 75 µm measured from the top surface of the workpiece, that is, the position of front face of micro tool is 40 µm from the bottom surface of the workpiece. Equipotential curve distribution on the top surface of the workpiece is the mirror image of the equipotential curve distribution on the bottom surface, that is, −dV/dx is same on the top and bottom surfaces on the corresponding points and also on the vertical wall of the workpiece.
Equipotential curves in the gap of micro tool and workpiece at higher depth of micro tool.
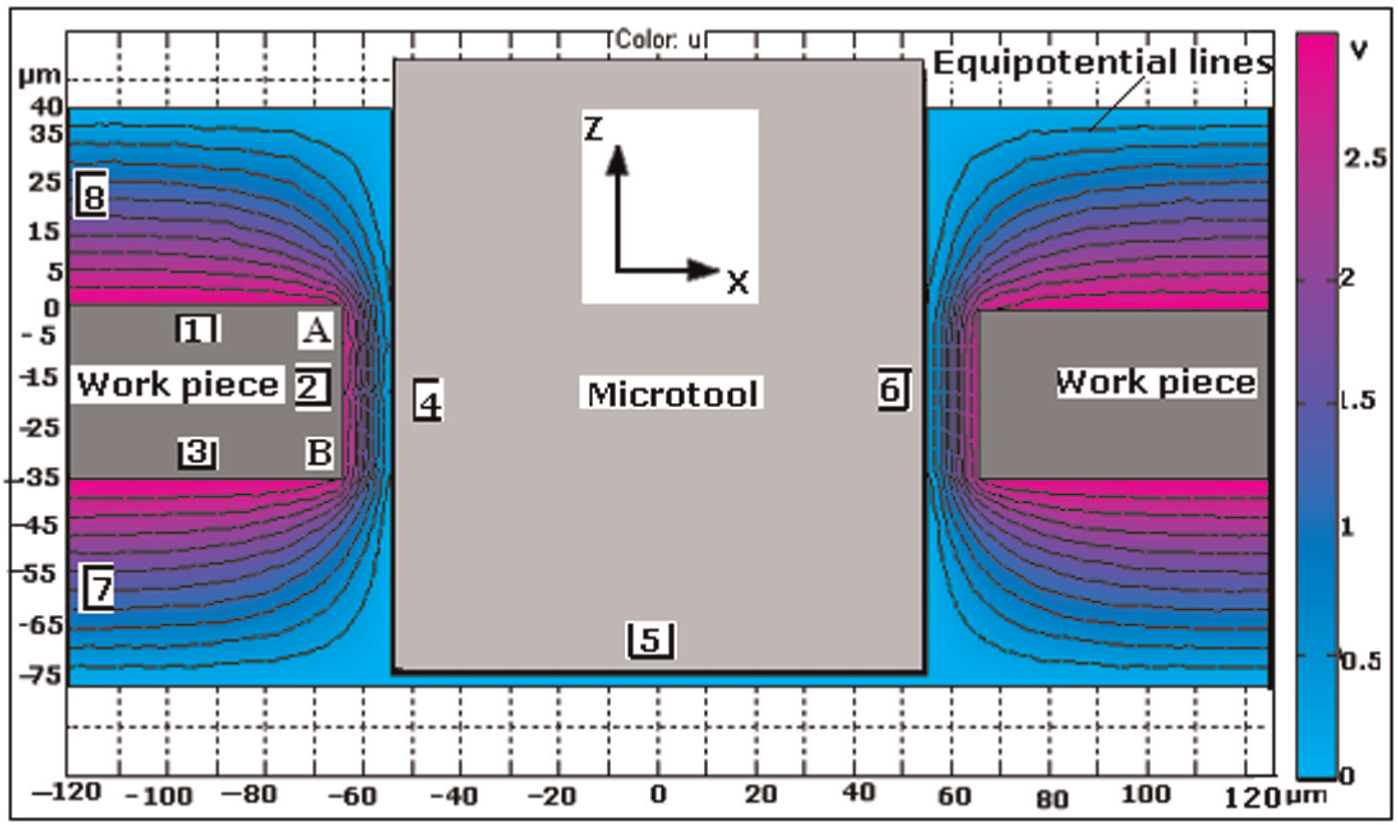
Figure 4 shows normalized current density (J/Jmax) distribution along the vertical wall at the vicinity of workpiece. Current density at the zone A (see Figure 2) of anodic workpiece is maximum, and normalized value is 1. Hence, the maximum rate of dissolution will be at this zone as can be explained from equation (2). Current density remains 0.78 along the vertical wall for rest of thickness of the workpiece. Taper formation is a must if milling continued after sinking up to the depth of 35 µm, that is, thickness of workpiece. When the tool depth is increased to 75 µm, the current density becomes uniform, and the normalized value is 0.81 along A to B. Thus, taper less micro profile generation is possible if micro tool sinking is extended to 40 µm below the bottom surface of the workpiece, and then, milling is continued along the path of micro profile generation.
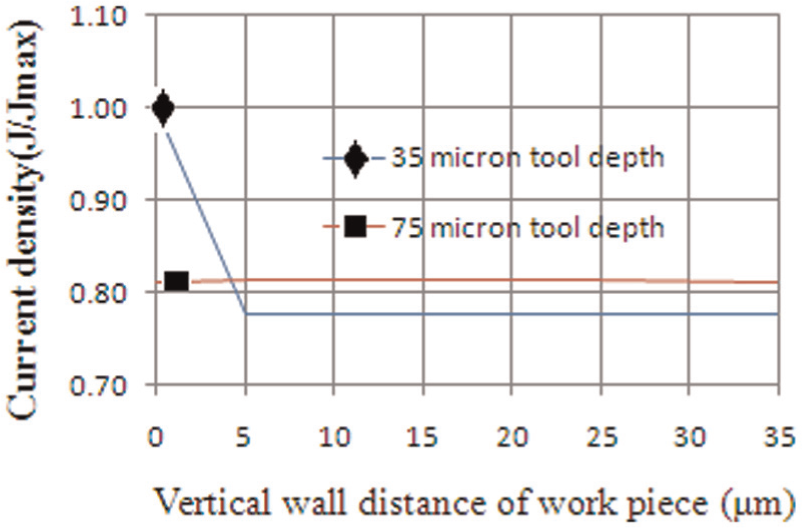
Normalized current density distributions.
Planning of experiments
The experimental setup designed and developed as shown in Figure 5 was used for EMM. Stainless steel sheets (SS 304) of size 1 cm × 4 cm of different thicknesses, for example, 35, 50 and 100 µm, were used as anode. Tungsten micro tool of φ = 115 µm was used to investigate the shape formation during microchannel generation. Tungsten micro tool of φ = 8 µm was also fabricated 13 for the generation of micro profiles of very narrow width. Detailed experimentations were done to study the influence of various predominant machining parameters such as pulsed frequency, pulse width, micro tool feed rate, electrolyte concentration and depth of sinking on the overcut and shape generation of micro profile. Applied voltage is pulsed alternating current (AC) (slightly negative during off time of cycle) from an Agilent-made function generator. Continuous monitoring of the EMM processes was done by a digital storage oscilloscope, DL 1500 (Yokogawa, Japan). Measurements of microchannels were performed by the microscope (Olympus, Japan) with a least count of 0.5 µm through the lenses of 3×–50× and also by measuring scanning electron microscopy (SEM) micrograph with image analysis software. EMM operations were carried out using H2SO4 electrolyte of 0.1, 0.2 and 0.3 M concentrations. H2SO4 was chosen as the electrolyte due to the fact that sludge is dissolved fully in it. An average voltage of 3 V was applied based on the ultra-short pulse of 2–9 MHz pulse frequency. Lower volt was chosen for reducing the side gap during micromachining and voltage less than this creates a passive layer, which does not allow metal dissolution during EMM. Duty ratios were varied from 35% to 55% to observe the effect of pulse width on the shape of micro profile.
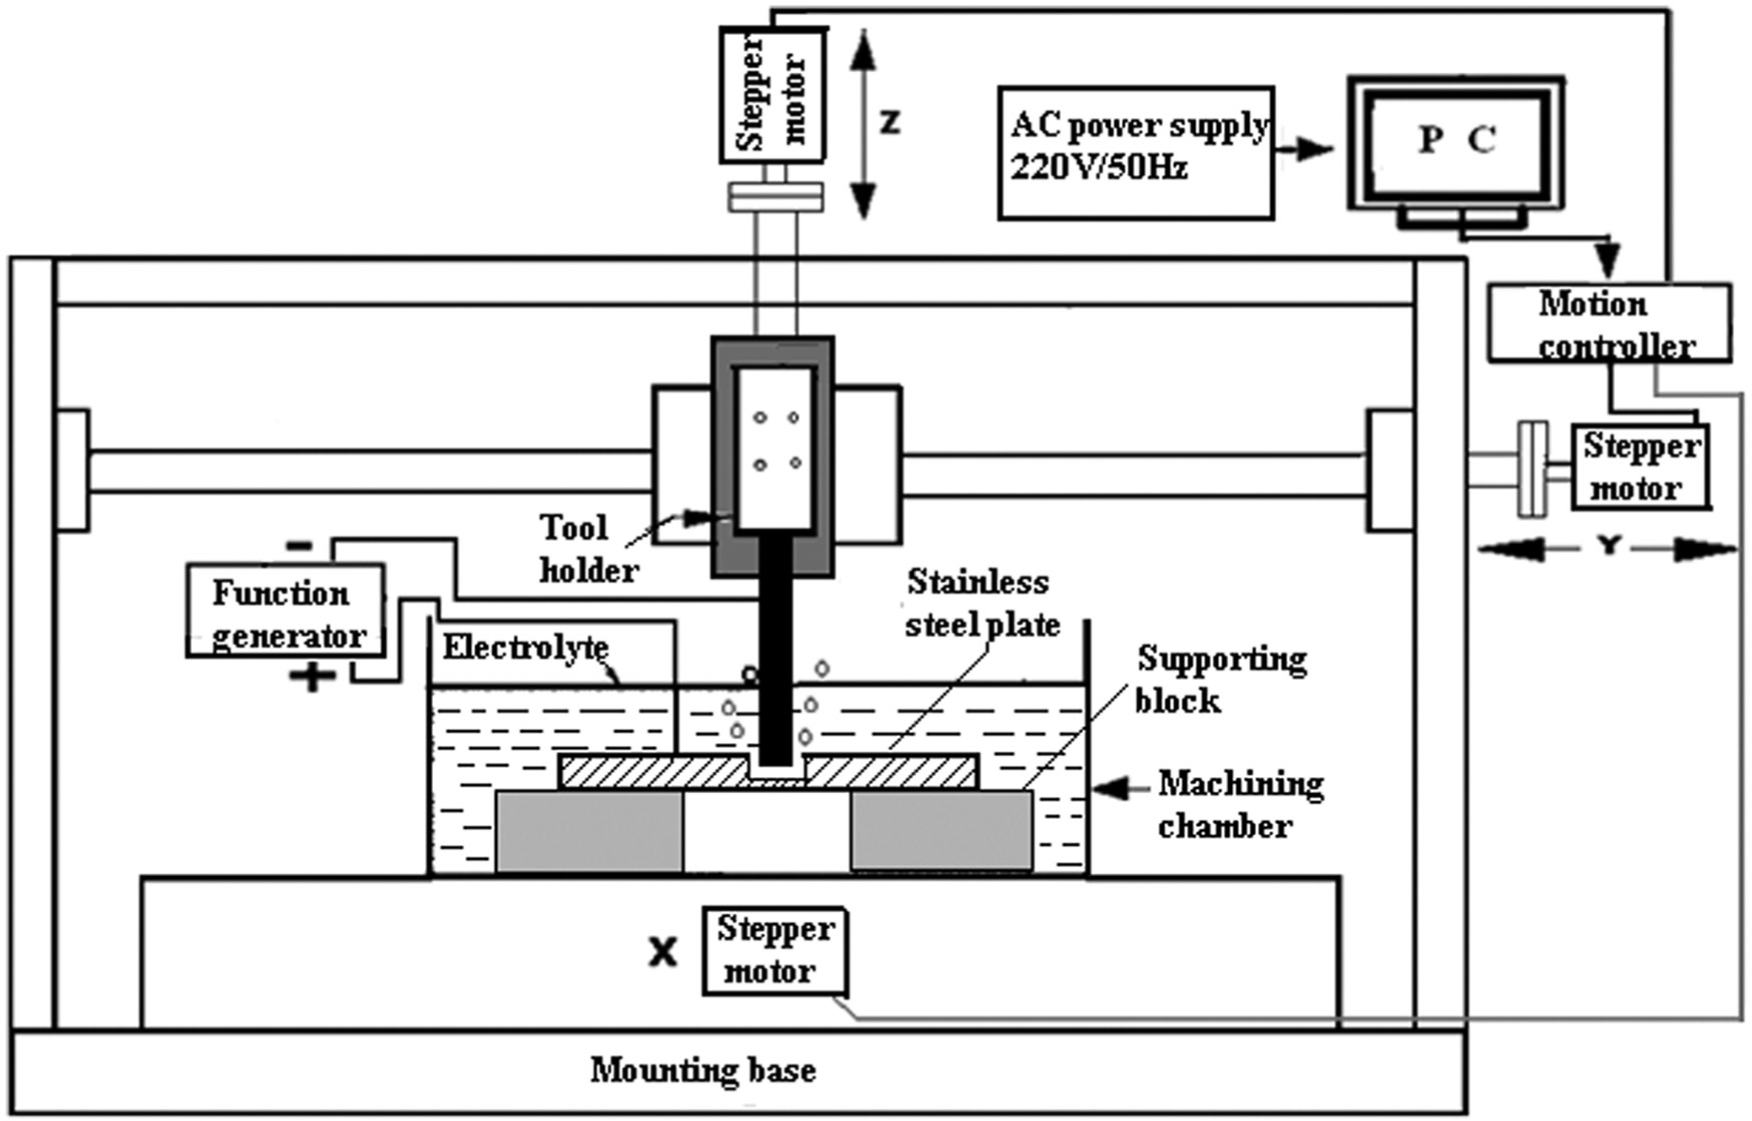
EMM setup.
Through microchannels and micro profiles were generated by scanning method and new approach of sinking and milling method. The variations of widths of microchannel are expressed in terms of standard deviation. Higher the standard deviation, lower is the accuracy along the length of microchannel. To find the standard deviation, measurements of widths of microchannels generated by the new approach are taken at an interval of 166 µm along the length of the microchannel generated by 500 µm travel of micro tool except the pilot hole diameter, that is, W1, W2, W3 and W4 as shown in Figure 6. Then average width, Wavg is calculated. To evaluate the deviation from the regular width, standard deviation (σ) is calculated as follows
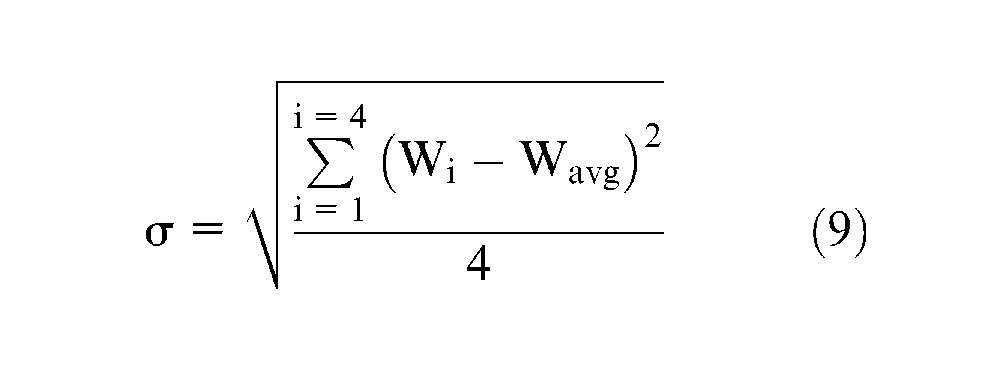
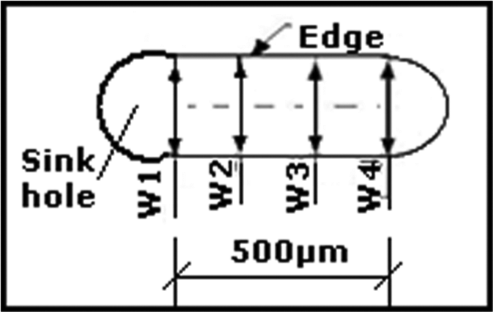
Measurement positions along the length of channel.
More than three experiments were conducted at a single setting of parameters, and average value of a particular attribute was considered for analysis.
Experimental results and discussions
The quality of a microchannel is defined by the width of microchannel, overcut, taper angle and surface quality. Overcut or side gap is defined as half of (width of microchannel − micro tool diameter).
Taper angle is defined as
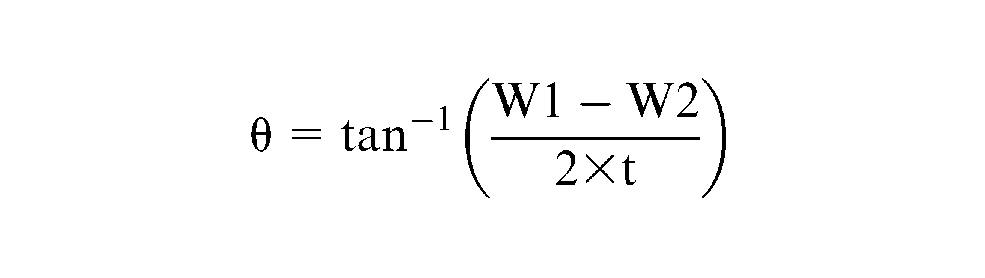
where W1 is the entry width, W2 is the exit width and t is the thickness of the workpiece sheet as shown in Figure 7. Results were plotted through various graphs and analyzed keeping in mind the objective of shape control with less overcut and less time of machining.
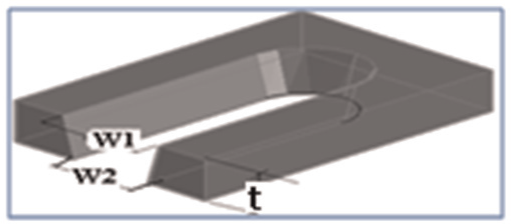
Entry and exit width.
Control of side gap
Reduction of overcut is the major challenge in EMM. The dissolution of metal from workpiece takes place in the direction of higher current density as is evident from equation (2).
Variation of overcut with 0.1 M concentration and pulsed frequency
Taper less through microchannels were generated by the scanning, sinking and milling methods at 0.1 M concentration of electrolyte and 35% duty ratio on 35-µm-thick SS-304 stainless steel and micro tool feed up to vertical depth of 75 µm for making taper less features. Figure 8 represents the variation of overcut with pulsed frequency by both the methods of microchannel generation. It was found that overcut by the new method was much lower than the scanning method. At 5 MHz of pulse power, the overcuts were 15 and 20 µm for sinking and milling method and scanning method of microchannel generation, respectively. Increase in overcuts was observed for both the methods, and peak overcuts were 34 and 45 µm for the sinking and milling method and the scanning method of microchannel generation at 7 MHz of pulse power, respectively. The overcuts decreased to 20 and 29 µm for the sinking and milling method and the scanning method of microchannel generation, respectively, at 9 MHz of pulse power. This exceptional behavior can be explained from the fact that micro sparks may occur during micromachining with the weak electrolyte of 0.1 M concentration. The material removal takes place by micro-EDM along with EMM. Times of machining for 500 µm length of microchannel were 51 min (46 µm/s) and 36 min (0.28 µm/s) in the scanning and the sinking and milling methods, respectively, at 5 MHz frequency. Times of machining for 500 µm length of microchannel were 98 min (23.13 µm/s) and 53 min (0.21 µm/s) in the scanning and the sinking and milling methods, respectively, at 9 MHz pulse frequency. Thus, the new approach of sinking and milling method is much better for the generation of microchannel from the point of view of lesser overcut and lesser time of machining.
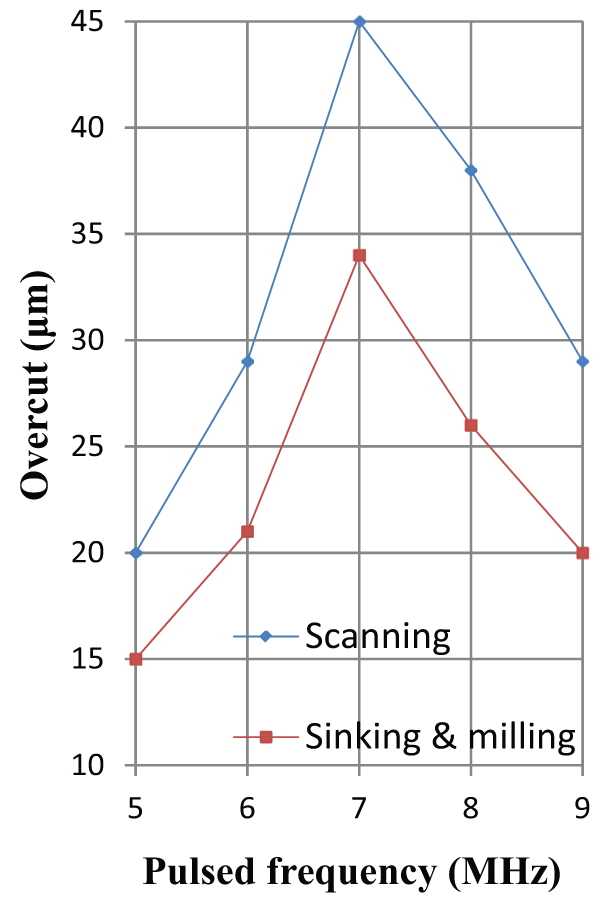
Overcut versus pulsed frequency at 0.1 M.
Variation of overcut with 0.2 M concentration and pulse frequency
Wide ranges of pulse frequencies were applied for the EMM during micro hole and microchannel generation by the two methods as explained in the “Planning of experiments” section. Concentration of 0.2 M, 35% duty ratio and optimum feed rate for each pulsed frequency were considered. Optimum feed rate means maximum feed rate without short circuit. All the micro features, such as micro holes and microchannels, were generated on a 35-µm-thick SS-304 stainless steel sheet and with a micro tool feed up to vertical depth of 75 µm for making taper less features. Figure 9 exhibits that the overcut of all the micro features gradually decreases with the increase in pulse frequency up to 5 MHz of pulse frequency. Then, the rates of decrease of overcut of micro features are very less. Around the range of 6–7 MHz, overcut increased slightly for the microchannels generated by both the methods. Then, the overcut decreased, and lowest overcut was observed at 9 MHz pulse frequency. The overcut of microchannel generated by scanning method was slightly greater than the overcut of drilled micro hole over the whole range of pulse frequency. Times of machining for 500 µm length of taper less microchannel generated by the sinking and milling method were 36 min (0.3125 µm/s) and 23 min (0.47 µm/s) at 9 and 5 MHz pulse frequency, respectively. The overcuts of microchannel generated by the sinking and milling method were 8 and 10 µm at 9 and 5 MHz pulse frequency, respectively. Overcut of microchannel generated by the scanning method was 19 µm at 5 MHz pulse frequency. Times of machining for 500 µm length of taper less microchannel were 38 min (60 µm/s) and 23 min (0.47 µm/s) in the scanning and the sinking and milling methods, respectively, at 5 MHz frequency. Generation of microchannel by the sinking and milling method is much better than the scanning method of microchannel generation from the point of view of lesser overcut and lesser time of machining.
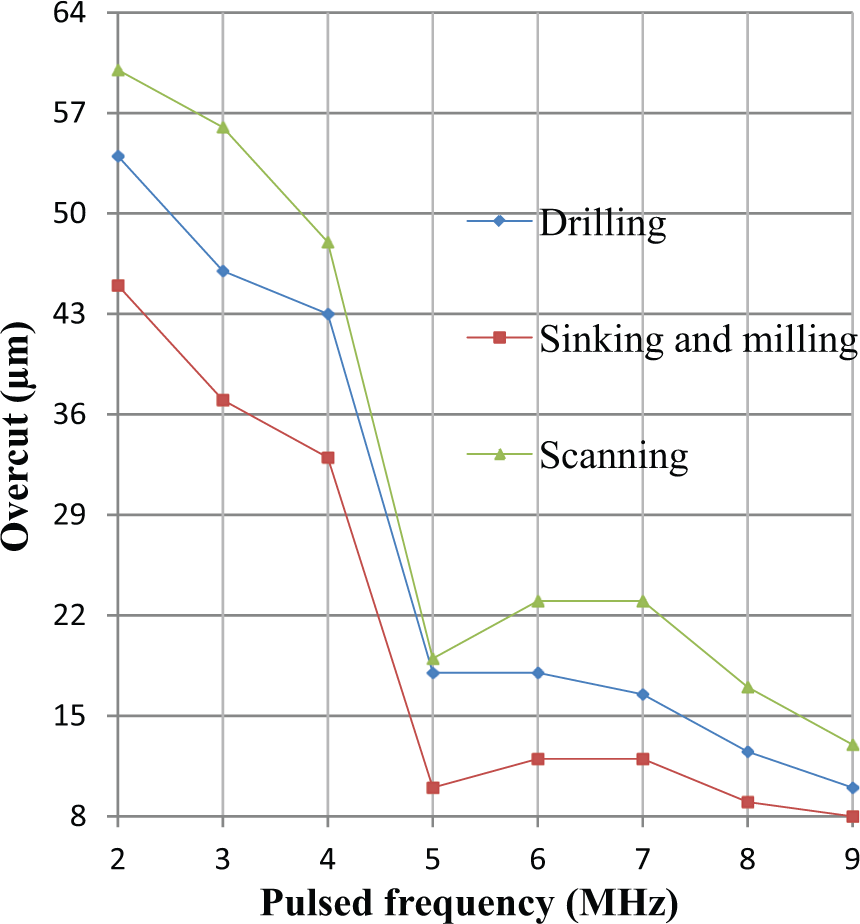
Overcut versus pulsed frequency at 0.2 M.
Figure 10 exhibits the taper less drilled holes of ϕ = 148 µm, ϕ = 140 µm and ϕ = 135 µm at 7, 8 and 9 MHz, respectively, during drilling operations which are the initial sinking operations to be performed before milling operation to generate micro profiles utilizing new approach. The times of sinking at optimum feed rate were 5 min 41 s, 7 min 15 s and 10 min at 7, 8 and 9 MHz, respectively. The sinking diameters and also the time of sinking are important for the generation of microchannel by the sinking and milling method.
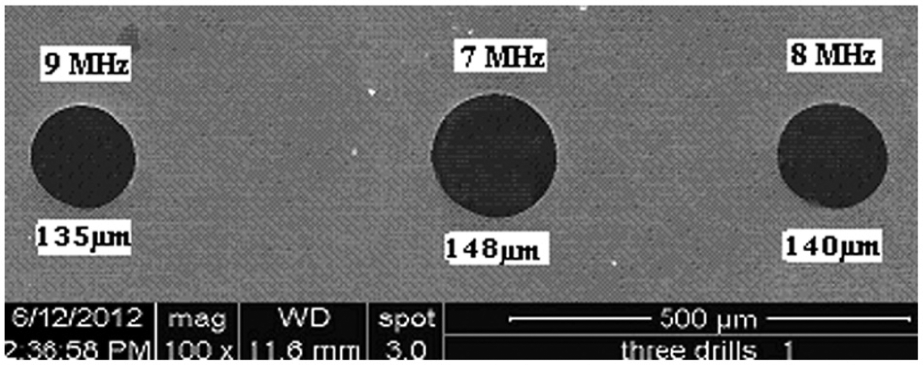
Variation of diameter of drilled holes at ultra-short pulses.
Variation of overcut with 0.3 M concentration and pulse frequency
Taper less through microchannels were generated by scanning method and sinking and milling method on 35-µm-thick SS-304 stainless steel sheets and micro tool feed up to vertical depth of 75 µm for the generation of taper less features. Machining parameters were 0.3 M concentration of electrolyte and 35% duty ratio. Figure 11 exhibits the variation of overcut with pulse frequency by both the methods of microchannel generation. It was found that overcut by the sinking and milling method was lower than the overcut by the scanning method. At 5 MHz of pulsed power, the overcuts were 15 and 35 µm for the sinking and milling method and the scanning method of microchannel generation, respectively. Overcut decreased linearly for the scanning method, and an overcut of 19 µm was observed at 9 MHz of pulsed power. Overcut increased for the sinking and milling method to a peak value of 27 µm at 7 MHz and then, decreased to 13 µm at 9 MHz of pulsed power. The times of machining were 25 min (90 µm/s) and 18 min (0.625 µm/s) for 500 µm length of microchannel generated by the scanning and the sinking and milling methods, respectively, at 5 MHz frequency. The times of machining were 58 min (39 µm/s) and 30 min (0.40 µm/s) for 500 µm length of microchannel generated by the scanning and the sinking and milling methods, respectively, at 9 MHz frequency. Thus, sinking and milling method is much better for the generation of microchannel.
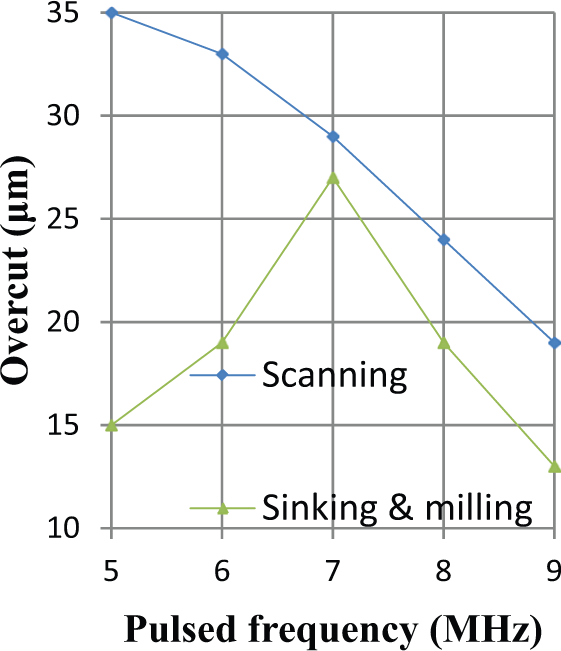
Overcut versus pulsed frequency at 0.3 M.
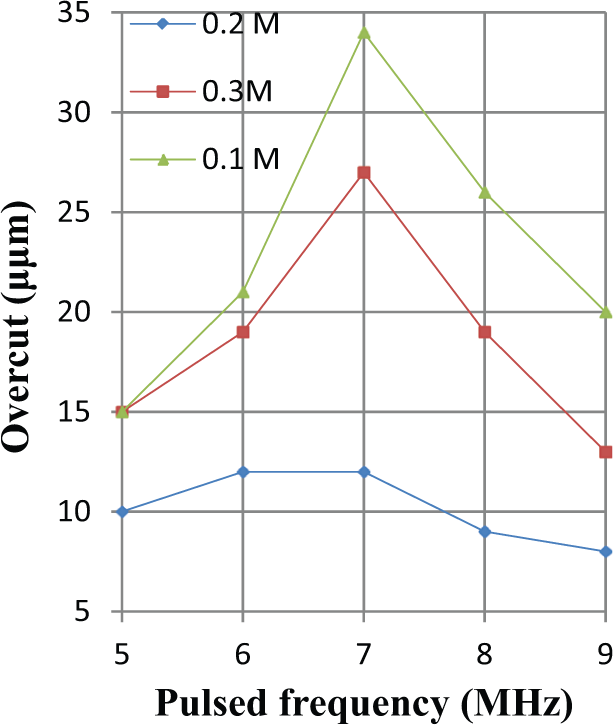
Overcut with different concentrations and pulse frequency in the sinking and milling method
Taper less through microchannels generated at 35% duty ratio on 35-µm-thick SS-304 stainless steel sheets by the sinking and milling method at different concentrations of electrolyte are compared. Figure 12 exhibits the variation of overcut with pulse frequency. Least overcut at 0.1 M concentration was 15 µm at 5 MHz pulse frequency. Least overcut at 0.2 M concentration was 8 µm at 9 MHz pulse frequency. Least overcut at 0.3 M concentration was 13 µm at 9 MHz pulse frequency. Least overcut of all the concentrations was 8 µm as observed at 9 MHz pulse frequency and 0.2 M concentration of electrolyte. Overcuts for all the concentrations converge at an ultra high pulse frequency of 9 MHz due to the fact that resolution of machining is controlled by charging time constant of double layer that occurs at the electrode surface such as a capacitance between the tool and the workpiece. Equation (4) explains that the charging time constant for a pulse period decreases with increase in concentration of electrolyte due to decrease in specific resistivity, but it remains constant for a particular concentration of electrolyte. At 9 MHz pulse frequency, the cycle time is very small, and out of this small cycle time, charging time is also included during pulse on time. Thus, very less time is available for EMM. Out of the three concentrations at 5 MHz pulse frequency, the lowest overcut was 10 µm at 0.2 M concentration of electrolyte. Machining times for the generation of 500-µm-long microchannels were 36 min (0.28 µm/s), 23 min (0.47 µm/s) and 18 min (0.625 µm/s) with 0.1, 0.2 and 0.3 M concentration of electrolyte, respectively, at 5 MHz pulse frequency. Machining times for the generation of same length of microchannels were 53 min (0.21 µm/s), 36 min (0.3125 µm/s) and 30 min (0.40 µm/s) with 0.1, 0.2 and 0.3 M concentration of electrolyte, respectively, at 9 MHz pulse frequency. Thus, 36 min of EMM is required for achieving least overcut of 8 µm. The next lowest overcut of 10 µm can be achieved at 5 MHz and 0.2 M concentration of electrolyte with only 23 min of EMM. Hence, 5 MHz and 0.2 M concentration of electrolyte are chosen as optimum pulse frequency and optimum concentration considering appreciable MRR and lesser overcut.
Overcut versus pulsed frequency in sinking and milling method.
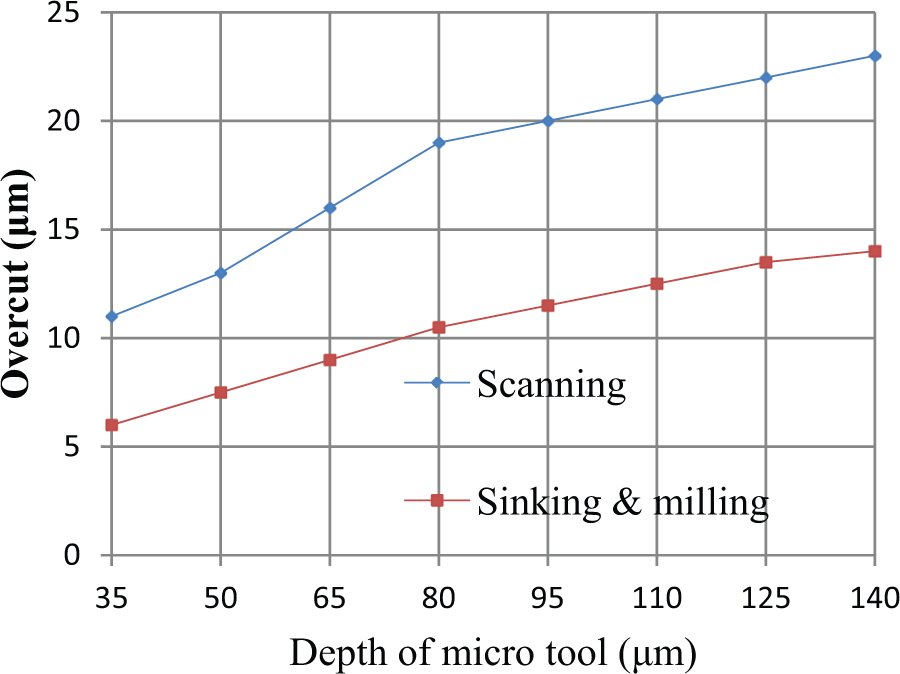
Variation of overcut with depth of machining
Entry overcut increases with the increase in depth of machining in microchannel generation by the sinking and milling method and the scanning method as shown in Figure 13. Machining parameters considered were 0.2 M H2SO4, 35% duty ratio and 5 MHz pulse frequency. Microchannels of 500 µm length were machined with ϕ = 115 µm micro tool on 100-µm-thick SS 304 stainless steel sheets. The depths of vertical feed of the micro tool varied from 35 to 140 µm from the top surface of stainless steel sheets and entry overcuts were measured. Increase in entry overcut occurs with the increase in depth, but the rate of increase in overcut decreases with the increase in depth of micro tool. The overcuts were 6 and 11 µm for the sinking and milling and the scanning methods, respectively, at 35 µm depth of micro tool. Overcut increases to 14 and 23 µm for the sinking and milling method and the scanning method, respectively, at 140 µm depth of micro tool. Therefore, the overcut is always less in the sinking and milling method than the scanning method. This can be explained from the fact that in the scanning method, repeated tool movement over the same path takes place, whereas in the sinking and milling method, the micro tool moves once through the path after the sinking or drilling.
Variation of overcut with depth of channel.
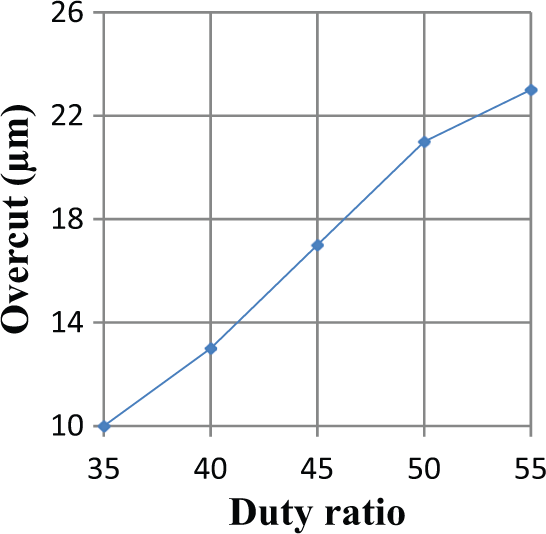
Variation of overcut with pulse width for the sinking and milling method
Figure 14 exhibits that the overcut increases linearly with the increase in duty ratio in 0.2 M concentration. Overcuts were 10 and 19 µm at 35% and 55% duty ratio, respectively. The duty ratio is defined as the ratio of “on time” to “cycle time” in a pulse power supply. Dissolution of metal occurs only after the proper charging of double layer. No dissolution of metal takes place without proper charging of double layer, and the corresponding time is called nonfaradaic time.14,15 Charging time per cycle remains constant for a particular concentration of electrolyte as per equation (4), and hence, with the increase in “on time” (pulse width), the faradaic current (dissolution current) flow increases for the constant applied voltage. Rapid evolution of H2 bubbles takes place between the front side of micro tool and workpiece. This phenomenon increases the electrolyte resistance between the front side of tool and workpiece. Thus, current flow starts toward lateral surface of tool resulting in higher dissolution of metal side wise. Therefore, duty ratio is kept around 35% for maintaining lowest overcut.
Variation of overcut with duty ratio.
Time of micromachining at different concentrations
Figure 15(a) exhibits linear decrease in machining time with increase in concentration of electrolyte at 5 MHz pulse frequency. This indicates linear decrease in resistance of electrolyte and hence, linear increase in current. According to equation (1), MRR is proportional to current flow. Thus, machining time decreases with higher concentration of electrolyte. Figure 15(b) shows the variation of machining time with increase in concentration of electrolyte at 9 MHz pulse frequency. Machining time decreases with the increase in concentration of electrolyte due to increase in current density, but the rate of decrease is less after 0.2 M concentration. At very high frequency, not only current density but also pulse frequency plays a major role in MRR and generation of shape of micro profile. Machining is highly localized in the zone where IEG is lowest as can be explained by equation (4). At high pulse frequency of 9 MHz, cycle time is very small, and during each cycle, charging of double layer is must before dissolution of metal starts. Thus, dissolution time per cycle is shortened. Machining times for the microchannels generated by sinking and milling were 18 and 30 min at 5 and 9 MHz, respectively, with 0.3 M concentration. Machining times for the microchannels generated by the sinking and milling method were 23 and 36 min at 5 and 9 MHz, respectively, at 0.2 M concentration. The time of machining of micro profile generated by the sinking and milling method is always less than that by the scanning method. Hence, the sinking and milling method of micro profile generation is much better than the scanning method.
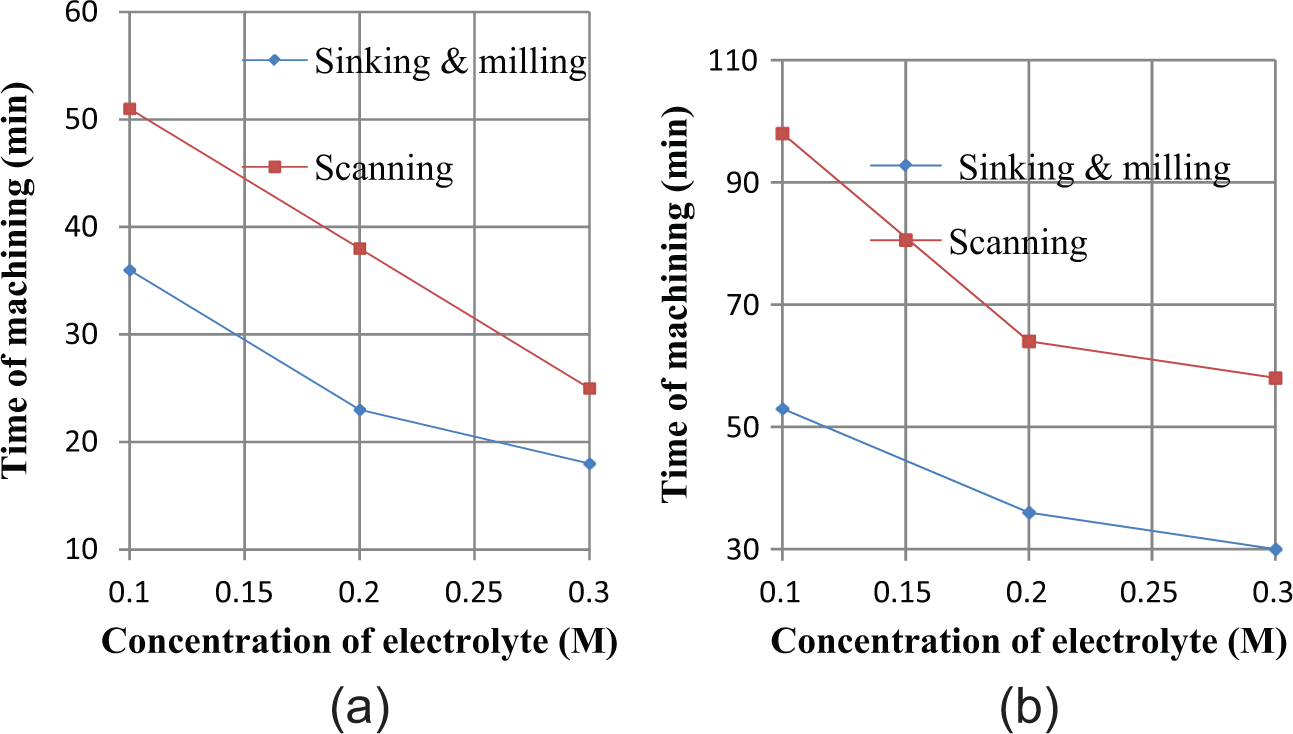
(a) Machining time at 5 MHz and (b) machining time at 9 MHz.
Reduction of taper angle of through microchannel
Taper means the side gap between tool and workpiece at the exit side is less than that at the entry side. Larger taper means the machined side walls are not vertical and generates poor-quality microchannel. For the slot making on a SS-304 sheet of 35 µm thickness, experiments were performed with the micro tool feed rate of 0.781 µm/s along the path in the new method of sinking and milling. Vertical depth or z-depth of micro tool is measured from top surface of workpiece. Microchannels were generated starting with 35 µm z-depth with an increase in z-depth of 15 µm at each step. Figure 16 exhibits that the taper angle decreases linearly with the increase in vertical depth of micro tool. The taper angle was 23° when the micro tool just pierced through the workpiece. At 75 µm of z-depth, when the micro tool extended up to 40 µm below the bottom side of the sheet, taper less microchannel was generated which validates the simulation result of uniform current density along the vertical wall as discussed in section “Simulation model for sinking and milling method.”
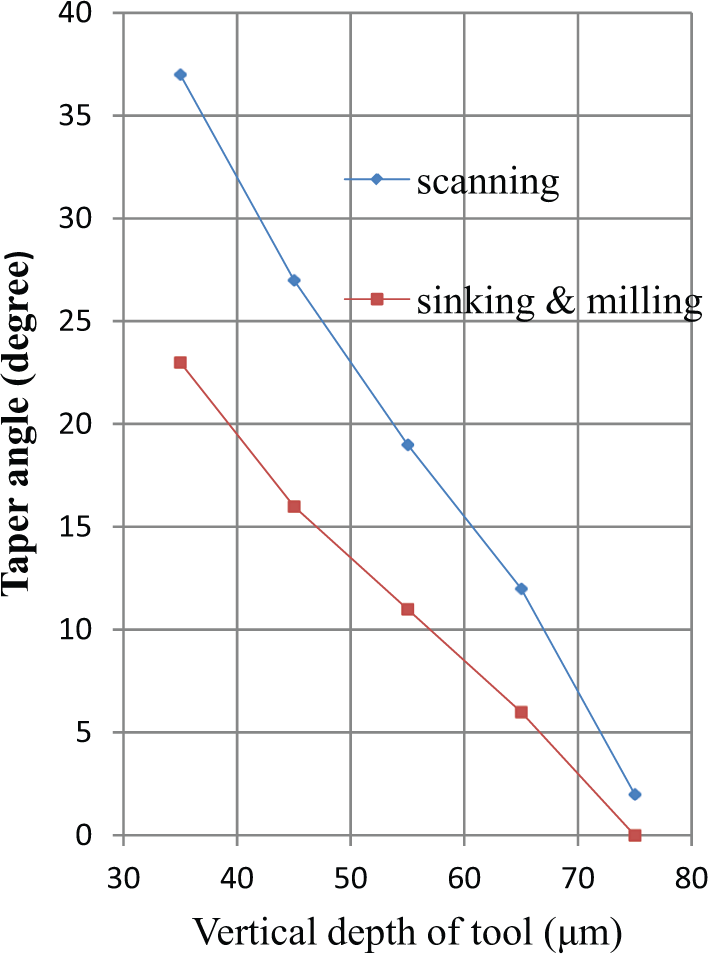
Variation of taper angle with depth of tool.
In the case of scanning method of microchannel generation, micromachining was continued with the feed rate of 90 µm/s along the path and 0.3125 µm depth of cut per scan. Taper angles were measured at an interval of 15 µm sinking depth. Figure 16 shows that the taper angle decreases linearly with the increase in z-depth up to 75 µm when the taper angle becomes 2°. The side gap between tool and workpiece at the exit side is less than that at the entry side when just through slot is completed, that is, 35 µm z-depth of tool. Hence, the electrolyte resistance at exit side is less than that at the entry side. Therefore, dissolution at the exit side continues with higher rate than at the entry side. Moreover, at high frequency of 5 MHz, the resolution of machining is very small which restricts further machining at the entry side. It can be concluded that the sinking and milling method of microchannel generation is better than the scanning method of microchannel generation in terms of reduction of taper angle.
Deviation of microchannel along the edge
The deviation of microchannel along the edge is a common phenomena, and standard deviation is found to vary with concentration. Figure 17 shows the variation of standard deviation with concentration of electrolyte. The standard deviation decreases with increase in concentration of electrolyte due to increase in current density. Standard deviations were 2, 0.5 and 0.2 µm at 0.1, 0.2 and 0.3 M concentrations, respectively. At low concentration, the number of active ions taking part in EMM is small and sometimes micro spark may occur resulting in higher deviation. High concentration improves the straightness of micro profile. A concentration of 0.2 M H2SO4 electrolyte was found suitable considering less machining time and low standard deviation along the edge.
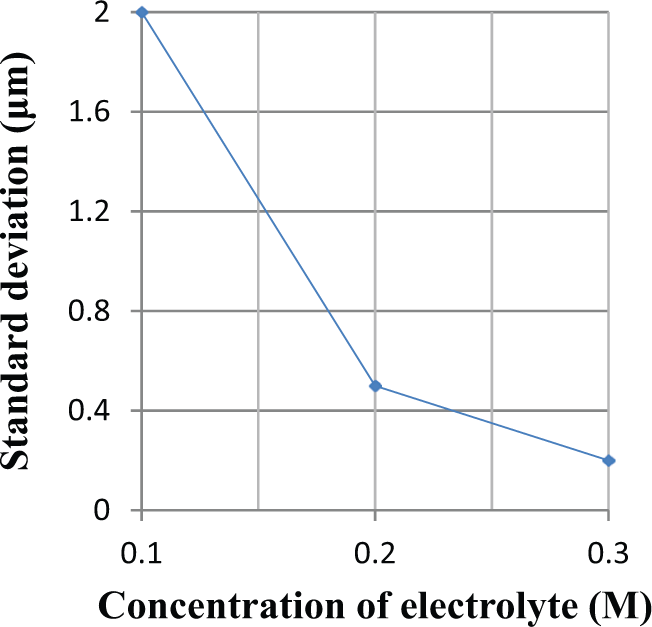
Variation of standard deviation with concentration.
Generation of complex microchannels utilizing sinking and milling method
Taper less channel net generated by the sinking and milling method is shown in Figure 18. Thickness of sheet was 35 µm. Machining parameters were 5 MHz pulse frequency, 75 µm drilling depth and 40% duty ratio. Duty ratio was increased to 40% from 35% to make the channel width uniform along with the width of drill point. Figure 18(a) and (b) exhibits the entry side and exit side of the profile, respectively. Initially, 740-µm-long microchannel of 140 µm width was machined with the micro tool movement of 600 µm. Then, cross wise movement of micro tool was continued at a gap of 250 µm starting from drill point where the width was 210 µm as shown in Figure 18. The total length of tool movement was 1400 µm, and total machining time was 50 min.
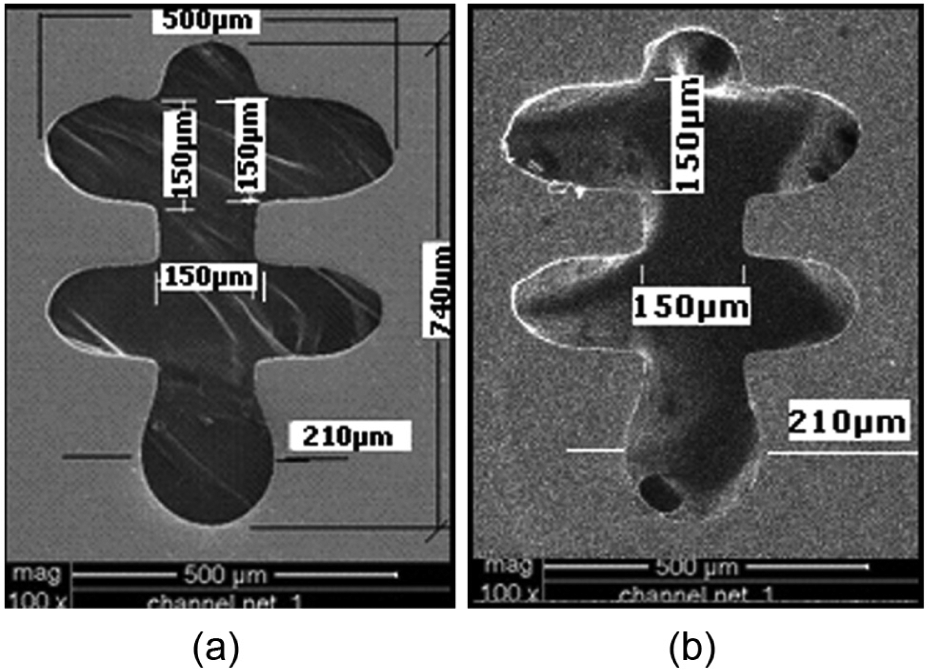
(a) Entry and (b) exit side of the profile.
U type, taper less micro profile generated on 35 µm SS-304 sheet is shown in Figure 19. Machining parameters were 5 MHz pulsed frequency, 75 µm drilling depth, 0.78 µm/s feed rate and 40% duty ratio. Figure 19(a) and (b) exhibits the entry side and exit side of the microchannel, respectively. When the movement of the tool was straight, the width of both entry and exit side were 140 µm. But at the turning point of the micro tool movement, the widths were larger and varying from 144 to 158 µm. The tool at the turning location dissolves more metals due to higher time of stay, and also, current density at the sharp corner is always high resulting in higher dissolution. Thus, corner points are curved having radius of 300 µm. The total length of the micro profile was 1200 µm, that is, the total length of tool movement. Total machining time was 42 min.
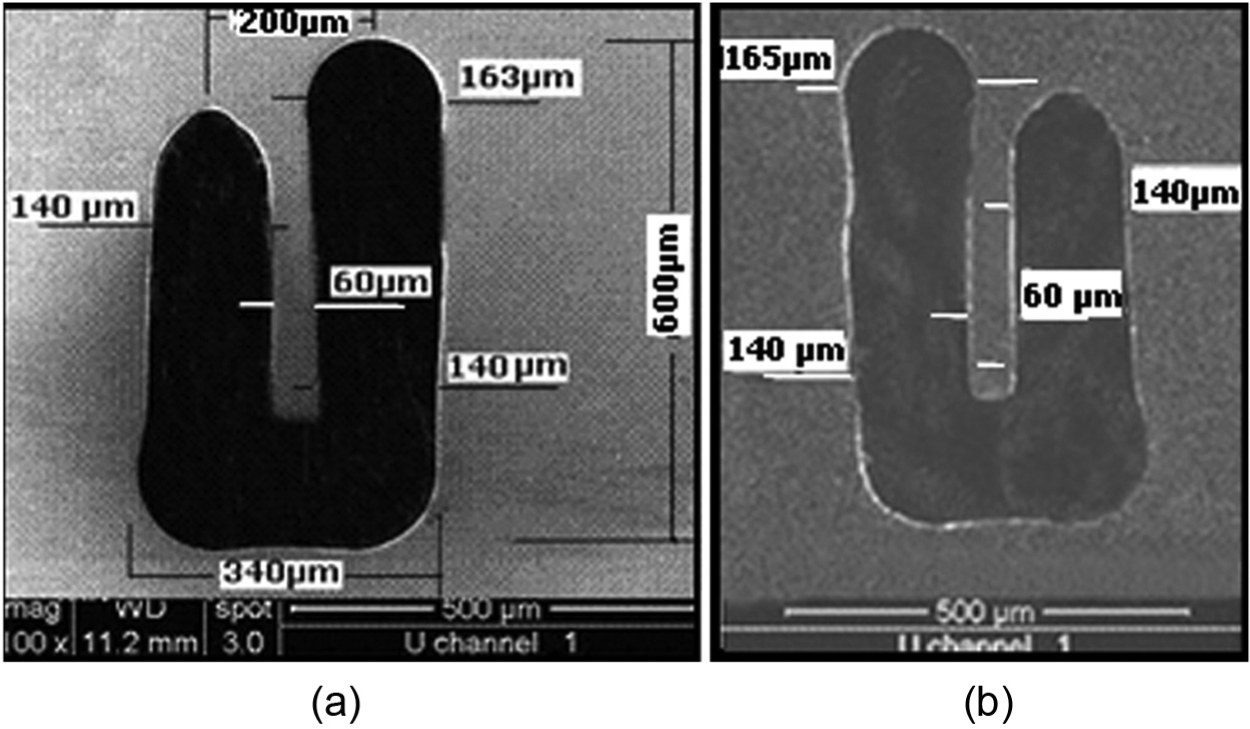
(a) Entry U channel and (b) exit U channel machining.
Taper less, through, band of micro profile generated on 35 µm sheet is shown in Figure 20. Machining parameters were 5 MHz pulsed frequency, 75 µm drilling depth, 0.78 µm/s feed rate and 40% duty ratio. Figure 20(a) exhibits the entry side of the band of microchannel, and Figure 20(b) shows the exit side of the band of microchannel. When the movement of the tool was straight, the widths of both entry and exit side are 140 µm. But at the turning point of the tool movement, the widths were larger and varying from 144 to 158 µm. Corner points were curved having radius of 300 µm. The total length of the band was 2000 µm, that is, the total length of tool movement. Total machining time of machining was 60 min.
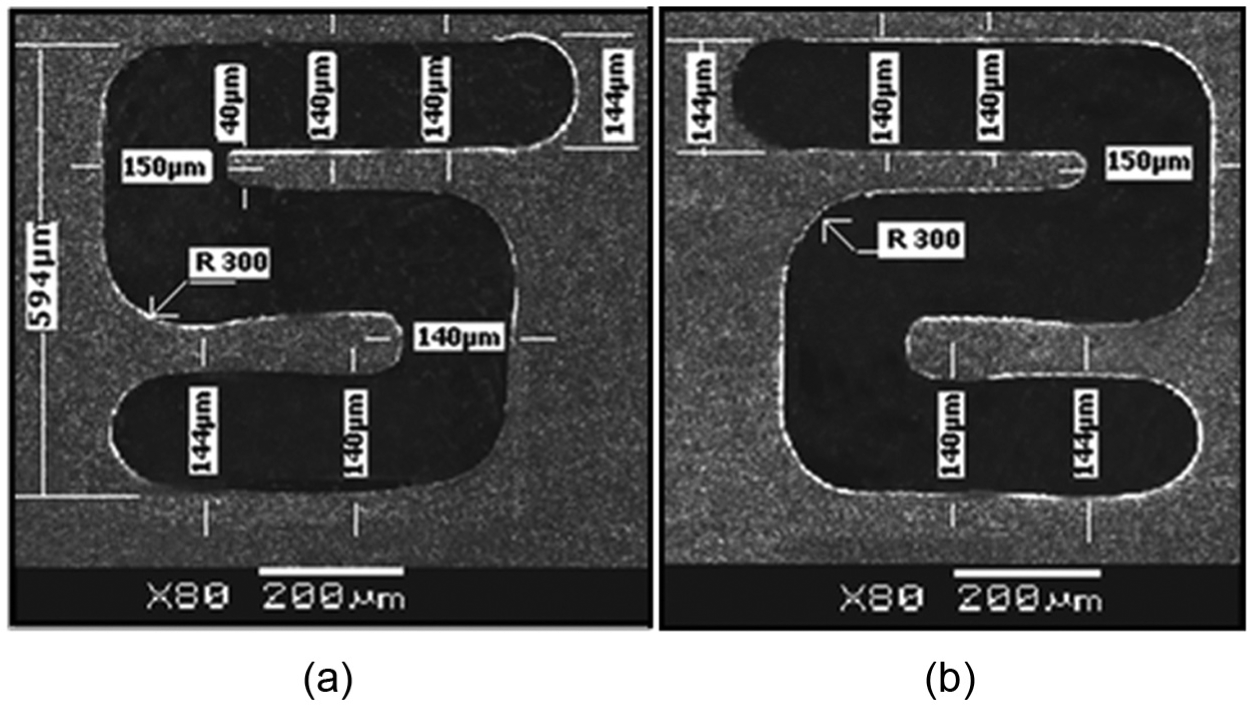
(a) Entry side and (b) exit side of the band of microchannel.
Micro profile of very small widths were generated by the sinking and milling method using a straight micro tool of ϕ = 8 µm as shown in Figure 21. Thickness of SS sheet was 50 µm and drilling depth 75 µm. Machining parameters were pulse frequency of 5 MHz, duty ratio of 35% and electrolyte concentration of 0.2 M. Figure 22(a) and (b) exhibits the entry side and exit side of the microchannel, respectively. The entry side was of higher width than exit side due to the fact that the depth of machining was 75 µm though the thickness of the sheet was 50 µm. The total length of tool movement was 250 µm, and total machining time was 15 min 40 s. Initial drill time was 7 min, and rest of machining was done in 8 min 40 s with the mentioned micro tool feed rate.
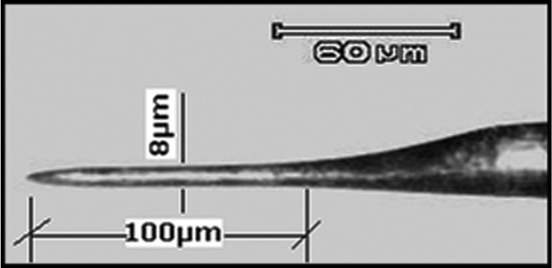
Micro tool of ϕ = 8 µm.
(a) Entry side and (b) exit side of the microchannel.
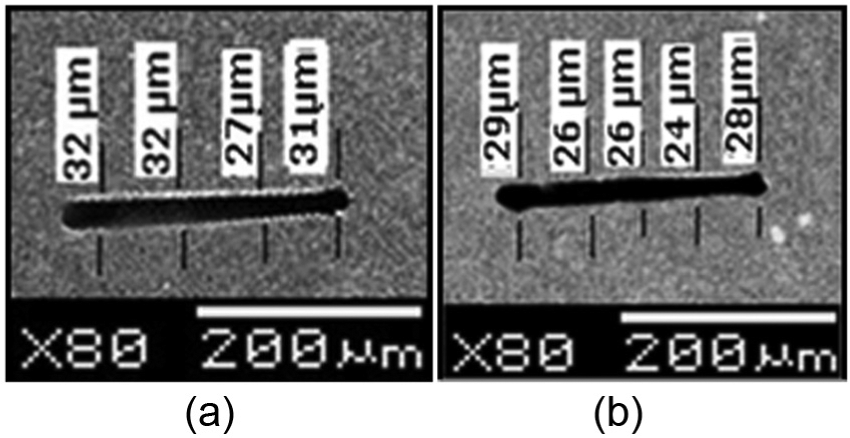
Complex micro profile of much lower entry width of 25 µm and exit width of 23 µm was generated by the sinking and milling method on 35-µm-thick SS 304 sheet by the straight micro tool of ϕ = 8 µm as shown in Figure 23. Machining parameters were pulse frequency 9 MHz, feed rate 0.125 µm/s, duty ratio 35% and electrolyte concentration 0.2 M. Figure 23(a) and (b) exhibits the entry side and exit side of the microchannel, respectively. The total length of microchannel was 300 µm and total machining time was 47 min 40 s. Initial drilling time was 11 min and rest of machining was done in 36 min 40 s with the above mentioned micro tool feed rate.
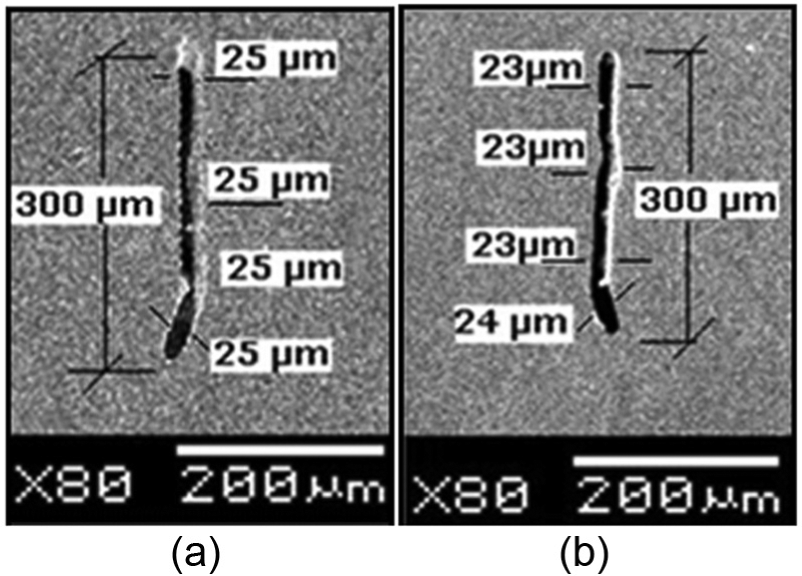
(a) Entry side and (b) exit side of complex micro profile.
Conclusion
Various micro features were generated by EMM to investigate the influence of various process parameters on the overcut, taper angle and time of machining. From the analysis of the results of experiments, the following conclusions can be drawn:
Taper less micro profiles can be generated by both the methods of scanning and the novel method of sinking and milling. The latter method of micro profile generation has some advantages over the earlier one such as smaller overcut, smaller machining time and presence of end deviation on the sink point only, that is, larger width at the pilot hole. Moreover, chances of tool damage are not there due to low tool feed rate during milling along the path of micro profile generation. Taper less through micro profiles can be generated in sinking and milling method by extending the depth of micro tool to 40 µm from the bottom surface during micro drilling, before horizontal feed is given. In the scanning method, machining is continued extending the depth of micro tool to 40 µm from bottom surface with the preset vertical feed and scan speed.
Least overcut was observed in the new approach of sinking and milling method. Optimum pulse frequency of 5 MHz and optimum concentration of electrolyte of 0.2 M were chosen, considering appreciable MRR and less overcut.
It was found that an average voltage of 3 V, 0.2 M H2SO4 electrolyte, 5 MHz frequency and 35% pulse width were the suitable parametric combination for the taper less through microchannel generation with the objective of less overcut as well as less time of machining.
Based on research analysis, complex taper less micro features consisting of profiles of 140 µm width and different shapes such as channel net, “U” shape and “S” shape were machined. Complex micro profile of narrow entry width of 32 µm was machined on 50-µm-thick SS-304 sheet. Very narrow micro profile of 23 µm was machined on 35-µm-thick SS-304 sheet by the fabricated micro tool of ϕ = 8 µm.
Various micro features and cantilever beam of different width can be machined utilizing this new approach for numerous microelectromechanical systems (MEMS) applications. Micro features are widely used for cooling-integrated circuits in microelectronics, microfluidic systems, conductive pathway of feedback sensors and so on. Further research is required to achieve micro features with sharp corners utilizing this new approach of sinking and milling in EMM. Minimization of overcut of micro features and taper less slot generation with higher productivity will go a long way toward high resolution micro products development.
Footnotes
Declaration of conflicting interests
The authors declare that there is no conflict of interest.
Funding
This research carried out under Centre of Advanced Study (CAS) program of Production Engineering Department, Jadavpur University, Kolkata, India, was funded by the University Grants Commission, New Delhi.