Abstract
While survey data has long been the focus of quantitative social science analyses, observational and content data, although long-established, are gaining renewed attention; especially when this type of data is obtained by and for observing digital content and behavior. Today, digital technologies allow social scientists to track “everyday behavior” and to extract opinions from public discussions on online platforms. These new types of digital traces of human behavior, together with computational methods for analyzing them, have opened new avenues for analyzing, understanding, and addressing social science research questions. However, even the most innovative and extensive amounts of data are hollow if they are not of high quality. But what does data quality mean for modern social science data? To investigate this rather abstract question the present study focuses on four objectives. First, we provide researchers with a decision tree to identify appropriate data quality frameworks for a given use case. Second, we determine which data types and quality dimensions are already addressed in the existing frameworks. Third, we identify gaps with respect to different data types and data quality dimensions within the existing frameworks which need to be filled. And fourth, we provide a detailed literature overview for the intrinsic and extrinsic perspectives on data quality. By conducting a systematic literature review based on text mining methods, we identified and reviewed 58 data quality frameworks. In our decision tree, the three categories, namely, data type, the perspective it takes, and its level of granularity, help researchers to find appropriate data quality frameworks. We, furthermore, discovered gaps in the available frameworks with respect to visual and especially linked data and point out in our review that even famous frameworks might miss important aspects. The article ends with a critical discussion of the current state of the literature and potential future research avenues.
Keywords
A New Era in the Social Sciences
In 1995, the Science journal asked researchers to make predictions about the future of their fields. While many physical and life scientists anticipated “breathtaking” developments, social scientists did not expect significant innovations or paradigm shifts within their field. This might have been because the innovation we see in today’s social science data collection and analysis is heavily connected to technologies that were hardly predictable 30 years ago: Few people anticipated the new role of computers and smartphones in our lives (King, 2011; Weintraub, 1995). But today these technologies have not only become essential parts of almost all areas of our lives, but they have also reshaped academic research. In the social sciences, networked communications, computational methods, and digital sensors allow us to simplify the collection and analysis of established types of data, such as survey data, while also providing many new opportunities to collect innovative data. This has led to the emergence of the new, interdisciplinary field of computational social science, first sketched out in a landmark paper by Lazer et al. (2009), and then reflected upon again after the field’s first decade (Lazer et al., 2020). At the same time, this “computational turn” (Berry, 2011) and the increased focus on data-driven, computational methods affect several long-established social science disciplines such as sociology, political science, psychology, and communication science. Two popular examples in this area are the study of opinions toward the economy (Conrad et al., 2021) or the analysis of social media location data to predict migration (Spyratos et al., 2019).
However, these new types of data also come with challenges for researchers, many of which can be summarized as challenges in ensuring the quality of the data. To assess data quality within this new era of digital social sciences, it is essential to link traditional data quality frameworks from the social sciences with emerging data quality frameworks from the information and computer sciences. Consequently, the present study aims to systematize the available data quality frameworks in light of classic and new social science research data.
Historically, data types relevant to the social sciences can be divided into three types: survey, observational, and content data (traditionally in textual form) (Purdam & Elliot, 2015; Schnell et al., 2009). Just a few decades ago, observational data was associated with data collected in the context of observational studies in daily non-digital life (e.g., observations in the field on purchasing behavior in market research), but today there is an increasing trend toward observing digital behavior (e.g., web browsing history or postings on social media). Content data was previously used analogously, for example, in the context of plenary speeches or book content, while increasingly content from websites or online platforms is now finding its way into research. While survey data has long been the focus of quantitative social science analyses, observational and content data, although long-established, are gaining more and more renewed attention, especially when these types of data are obtained by and for observing digital content and behavior (Japec et al., 2015; Jungherr et al., 2017).
However, even the most innovative and extensive amounts of data are insufficient if they are not of high quality. But what does data quality mean for modern social science data? Generally, data quality relates to the degree to which a set of inherent characteristics of data (ISO, 2020) fulfill the requirements of the intended operational decision-making and other potential uses (Herzog et al., 2007). In the social sciences, data quality is often discussed in so-called data quality or error frameworks (Amaya et al., 2020; Groves & Lyberg, 2010; Sen et al., 2021), treating it as a multifaceted concept with many relevant dimensions (Herzog et al., 2007). Herewith, the terms “error” and “data quality” are seen as two sides of the same concept and are used interchangeably (Amaya et al., 2020). Some of these frameworks assess data quality primarily from an extrinsic perspective, focusing on questions like whether the data is findable, accessible, interoperable, and reusable, the so-called FAIR framework (e.g., Wilkinson et al., 2016). Some frameworks, however, approach data quality mainly from an intrinsic perspective, examining whether data is accurate to lead to the best possible evidence (e.g., Sen et al., 2021; West et al., 2017), or mix both perspectives (e.g., Biemer et al., 2017; Herzog et al., 2007). The intrinsic perspective is part of the much broader extrinsic perspective in the so-called “total survey quality” framework (Juran et al., 1980; Biemer, 2010). Particularly from the intrinsic perspective, most of the published frameworks date back to times when survey data were particularly relevant and prevalent for social science research. Frameworks like the Total Survey Error (TSE) framework (Groves & Lyberg, 2010; Weisberg, 2018), therefore, address diverse aspects of representation and measurement.
Even though the relevance of data quality standards for empirical social research is generally acknowledged, researchers find it increasingly difficult to identify appropriate data quality frameworks in line with their (innovative) data sources and research questions (Japec et al., 2015; Olteanu et al., 2019). The search for an appropriate data quality framework to be applied in a specific study is further complicated by disciplinary differences across the various disciplines engaged in (computational) social science, which contributes to the use of different terminologies for the same concepts.
Motivation and Objectives: A Systematic Literature Review on Data Quality
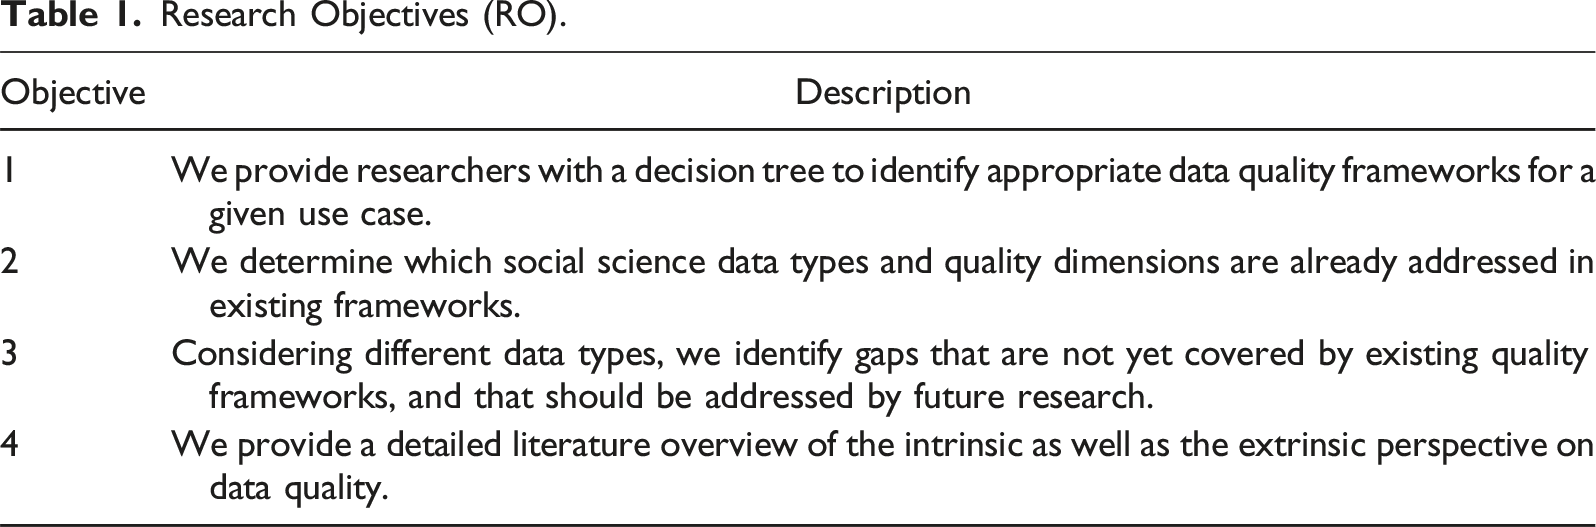
Research Objectives (RO).
Review Methodology
We develop and present our results with the help of a decision tree (Objective 1), an evidence gap map (Objectives 2 and 3), and a systematic review (Objective 4). As a basis for this research, we use the rigorous methodological approach for systematic reviews suggested by Hedges et al. (2019) and use the systematic approach described by Grant and Booth (2009) for our evidence gap map. Our decision tree, evidence gap map, and systematic review are part of a three-step coding procedure (all described in detail in the following subsections). First, we conducted a comprehensive and systematic literature search using specific search terms derived from a set of eligibility criteria for individual publications. In the second step, we screened the publications identified by the literature search and excluded those that did not meet our eligibility criteria. For these first two steps, we made use of text mining methods. In the third step, we coded the publications that matched our eligibility criteria to represent the current state of the research as it is manifested in the different data quality frameworks. The coding process was split between four coders, who are topic experts, and conducted the literature search, screening, and coding of the publications together. We will detail each of these steps in the next sections.
Eligibility Criteria and Search Strategy
One of the first steps in an evidence synthesis and literature review is defining the criteria publications must meet to be included. To be eligible, publications had to fulfill the following criteria: (1) the publication must present a data quality or error framework, (2) the publication must be written in English, (3) the publication (and thus the framework) must be published in a journal, as a book chapter, in conference proceedings, or as a report, (4) the framework must target data that is potentially relevant for quantitative social sciences research, such as survey, register, sensor, and web and (social) media data, and (5) the framework must focus on the study of humans and their behavior.
Our two-stage search strategy to identify relevant literature consisted of an initial database search and a subsequent snowball sampling, building up on the results from the first stage. The database search was conducted in September and October 2022 utilizing the Web of Science and EBSCO 1 databases, and the snowball sampling started in October 2022 and ran until November 2022.
We used the automated approach to identify search terms based on co-occurrence networks presented in Grames et al. (2019), implemented in their litsearchR package, to develop an appropriate search string. Following their example, we first conducted a naive search. Second, we used the titles, abstracts, and keywords of the publications identified via this naive first search to extract potential additional search terms. In the last step, we employed the query resulting from the previous steps to search the Web of Science and EBSCO databases (see Table A1 for the complete search string). Using this approach, we identified 8116 potentially relevant publications that we considered for the next step, that is, the literature screening (see the PRISMA chart in Figure 1). Systematic literature search and literature selection process, following the PRISMA approach (Moher et al., 2009).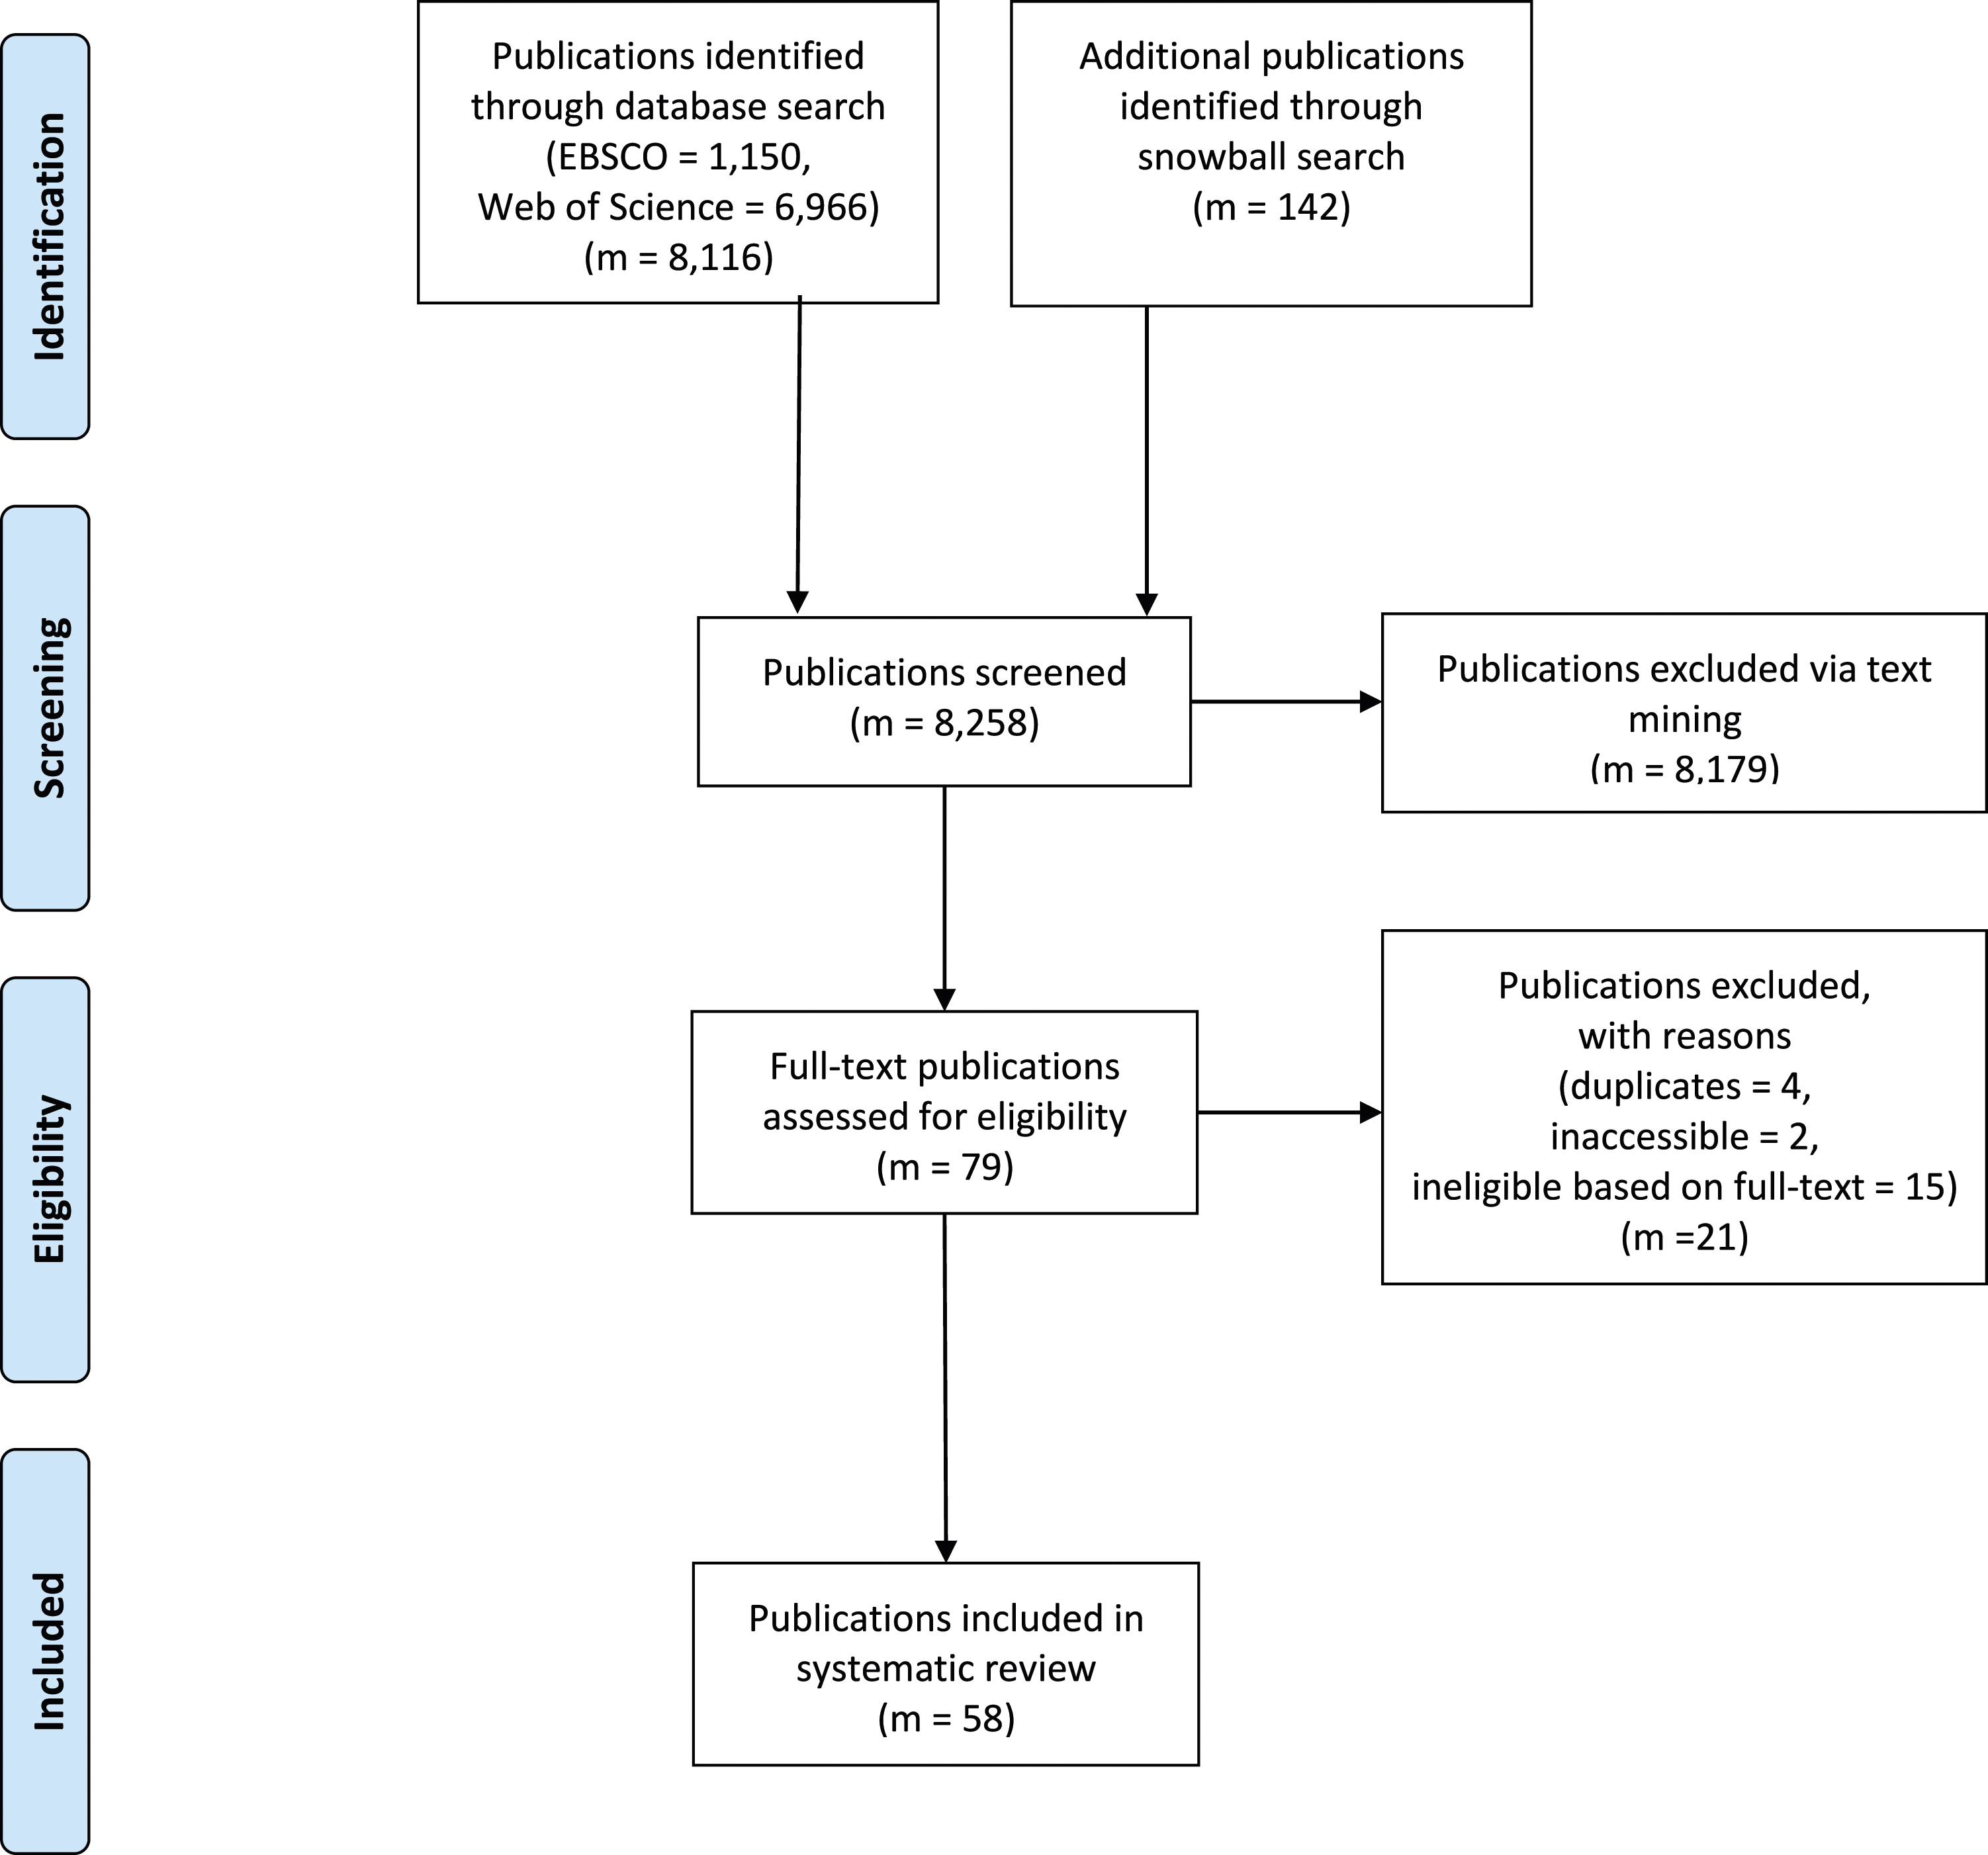
In addition to these publications identified via the database search, we collected an additional 142 publications later by checking the reference lists of the publications marked as eligible for the systematic review. This cited reference search (“snowballing”) was supported by the Citation Chaser package (Haddaway et al., 2022) and increased the number of publications considered for the literature screening to 8258.
We used the ASReview (van de Schoot et al., 2021) screening tool to screen all these publications for eligibility. After training the screening algorithm with a test sample of publications that were already coded for their eligibility, this Python tool presents the publication most likely eligible as the next suggestion to the coder. The underlying algorithm learns from all previous labeling decisions (both from the initial subsample and the decisions made during the actual reviewing process), and uses titles, abstracts, and keywords of the publications to select the most likely next candidate for inclusion. We stopped the classification process after 500 subsequent publications had been selected by the algorithm without any one of them having been labeled as eligible by the coder, a stopping criterion suggested by van de Schoot et al. (2021).
During this screening procedure, we marked 8179 publications as ineligible, leaving us with 79 publications that we considered for full-text screening and coding. However, even before the start of this next phase, we removed an additional four publications for being duplicates and another two publications for not having a full text available online (see also Figure 1). Duplicates could be identical publications listed in multiple databases or different publications that, however, reported identical results and were published with essentially the same content in different publications (e.g., a dissertation chapter also published as a journal article). After all of these searching and screening steps, 73 publications were selected to be coded in detail.
Full-Text Screening and Coding Procedure
The remaining 73 publications were then read in detail by four coders (four of the authors of this contribution with different disciplinary backgrounds), matched against the eligibility criteria, and coded according to our coding scheme (see Appendix Table A2). During this full-text screening, the coders identified 15 publications that did not match the eligibility criteria, leaving a final set of 58 publications that make up the basis of this literature review (see also Figure 1). A list of all the included publications is provided in Appendix Table A3.
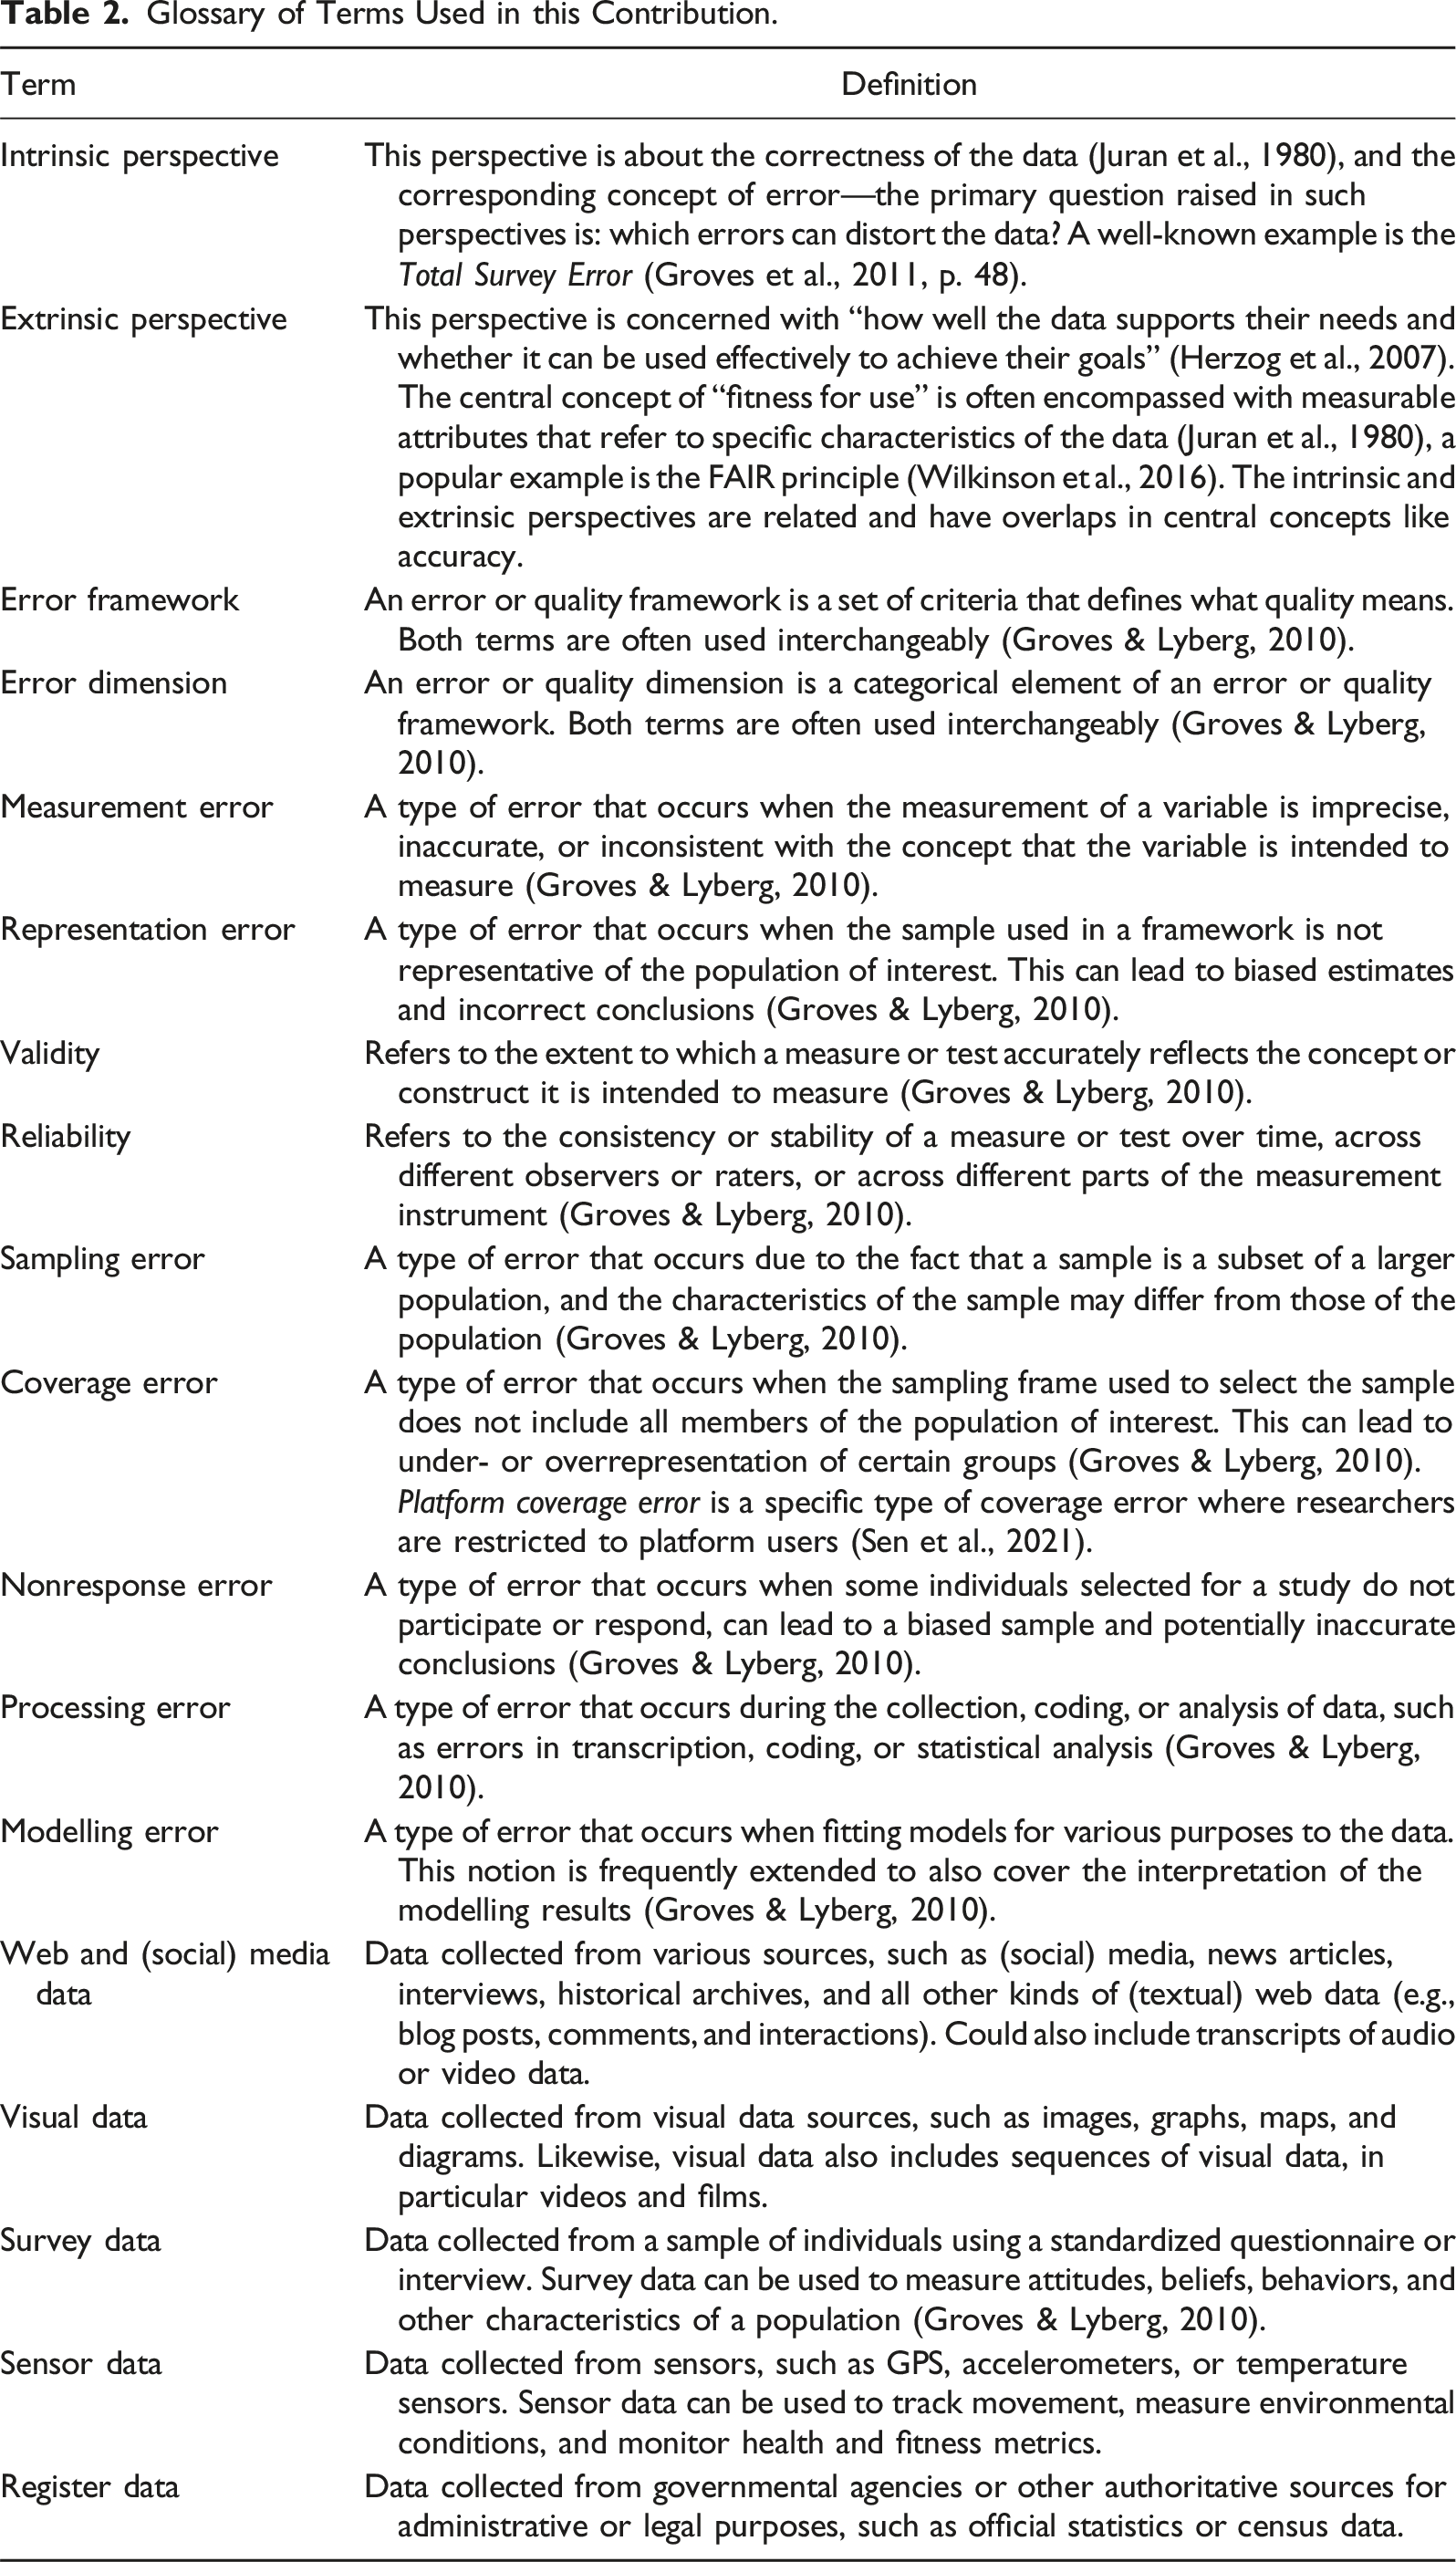
Glossary of Terms Used in this Contribution.
Characteristics of the Included Frameworks
Figure 2 gives an overview of the distribution of frameworks in some of the key categories included in our coding. As shown there, the majority of the frameworks included in our systematic literature review were designed for research with survey data (21), followed by frameworks for register data (15), and web and (social) media data (13). While eight data quality frameworks for sensor data were identified in the literature, there were none for visual data (image and video data) that fulfilled our inclusion criteria. A total of 16 frameworks were categorized as untargeted, representing the more general, data-type agnostic frameworks. Characteristics of the frameworks included in the systematic literature review.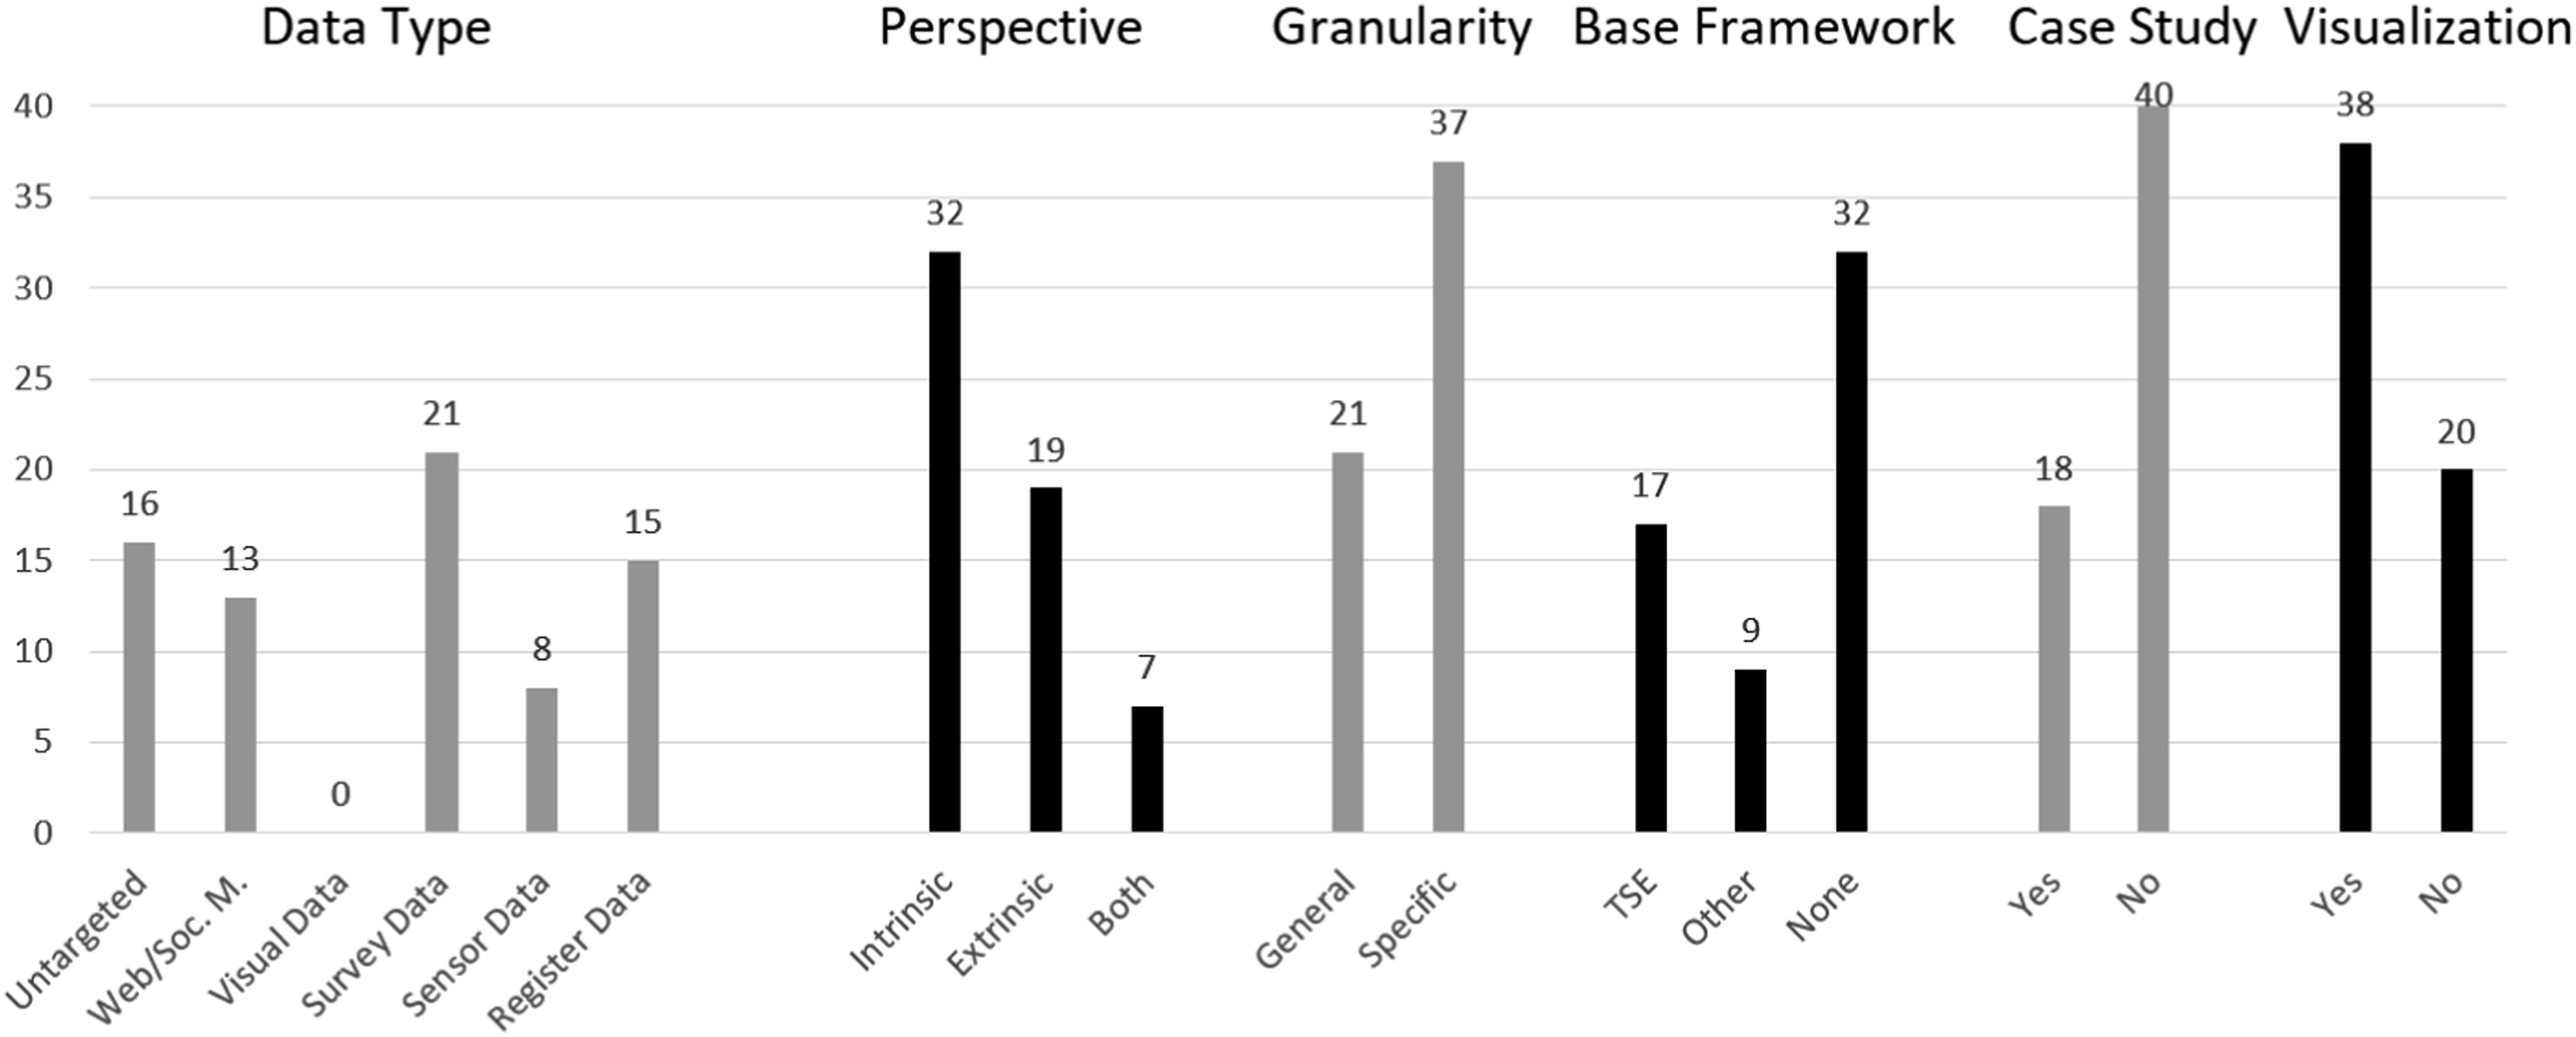
One of the main differences between the majority of the data quality frameworks is the perspective they are taking on. As Figure 2 shows, the majority of frameworks (32) take on an intrinsic perspective, similar to the one used in the prominent and much cited Total Survey Error framework (Groves et al., 2011, p. 48). As can be seen from the part on Base Frameworks in Figure 2, the TSE is referenced as the basis for 17 of the 58 frameworks that we reviewed. However, a non-negligible number of frameworks (19) departs from this perspective and take on an extrinsic perspective. We also find seven frameworks that cover aspects of both the intrinsic and the extrinsic perspectives.
There are 37 frameworks that are coded as specific, meaning that they provide a very detailed breakdown of data quality into different error sources, while 21 were labeled as general, offering broader discussions around the various aspects of data quality. In addition to the 17 frameworks based on the TSE, nine frameworks reference another existing framework as their starting point, while 32 frameworks do not reference any existing framework as their basis. Of the 58 included frameworks, 18 feature a case study, and 38 have some form of visual representation of the framework, potentially helping to fully understand and apply the framework.
Terminology Word Clouds
To complement the systematic review, we created word cloud visualizations to summarize and highlight the most discriminative words for different terminologies. To surface the most discriminative and significant terms used in the descriptions of the errors and to reduce the dominance of commonly used words like “error,” we use an approach based on Term Frequency Inverse Document Frequency (TF-IDF). Specifically, we combine the open text descriptions of each error in a single document, compute the TF-IDF scores of each keyword in all documents, and then highlight keywords with a TF-IDF score above the threshold of 0.01. This approach allows us to see which words are especially salient for certain errors instead of words that are common across all errors given the different social science disciplines they emerge from. By surfacing the most discriminative words using the TF-IDF approach, we can see which specific aspects are associated with different errors and how these errors differ from each other.
Results
Our contribution aims at providing an overview of the accumulated evidence and research gaps in data quality frameworks for classic and new social science data sources. To better guide researchers through the literature on data quality frameworks, we utilize a decision tree model, which helps identify relevant data quality frameworks for a specific research context (Objective 1). We then use an evidence gap map to highlight the social science data types and quality dimensions which are already addressed in the available frameworks (Objective 2), and to identify gaps within the existing literature on data quality frameworks that need more attention in future research (Objective 3). Finally, we take a deep dive into the data quality frameworks available in the literature, discussing common themes and major differences in our systematic review (Objective 4).
As discussed above, the intrinsic perspective is slightly more popular and has the TSE as a central point of reference, but a non-negligible number of frameworks also utilize the extrinsic perspective. The intrinsic perspective puts its focus on the factors and influences that potentially distort the data in the process of collecting and analyzing it. The extrinsic perspective, on the other hand, has the usability of the data in mind, asking “how well the data supports [the users’] needs and whether it can be used effectively to achieve their goals” (Herzog et al., 2007). Central to the extrinsic perspective is the idea of “fitness for use,” which is often encompassed with measurable attributes that refer to specific characteristics of the data. Some of the most common attributes include accuracy, completeness, timeliness, and consistency. While there is an overlap between these two perspectives (e.g., the shared focus on accuracy), their main distinction is that they pursue different objectives. The intrinsic perspective strives toward correct evidence through error-free data, while the extrinsic perspective is concerned with improving the user-friendliness of the data (for an overview, see our glossary in Table 2). To account for these differences while simultaneously highlighting their relative importance, we structure the following results section along these two different perspectives (Juran et al., 1980; Biemer, 2010). While the part of the systematic review on the intrinsic perspective is easily structured along the different sources of error, the part on the extrinsic perspective with all its multi-faceted attributes requires a more holistic treatment. As reflected in the number of frameworks for each of the perspectives, the intrinsic is typically the first and most urgent quality perspective—if the data is not accurate, it will not be usable either.
RO1: Decision Tree: Overview of Data Quality Frameworks
We present the comprehensive categorization of data quality frameworks produced by our systematic literature review in the form of a decision tree. This decision tree serves as an initial guide to navigating through the various data quality frameworks. Since decision trees are commonly utilized to facilitate decision-making in complex and high-dimensional scenarios, they enable researchers to choose frameworks that best suit their specific research problem. As a complement to the overview of available frameworks in Figure 3, we have included a complete version of the decision tree, including the references to the corresponding frameworks, in Appendix Table A3. Researchers are encouraged to consult this table in order to identify the appropriate frameworks for their use case. Decision tree overview. Appendix Table A3 offers the references for each of the different branches of the decision tree. While only 58 publications from the literature review were considered for the decision tree, the numbers at the end of the branches add up to 81. This is because data quality frameworks that target more than one data type or that take into account both the intrinsic and the extrinsic perspectives have been counted toward each of the respective branches separately.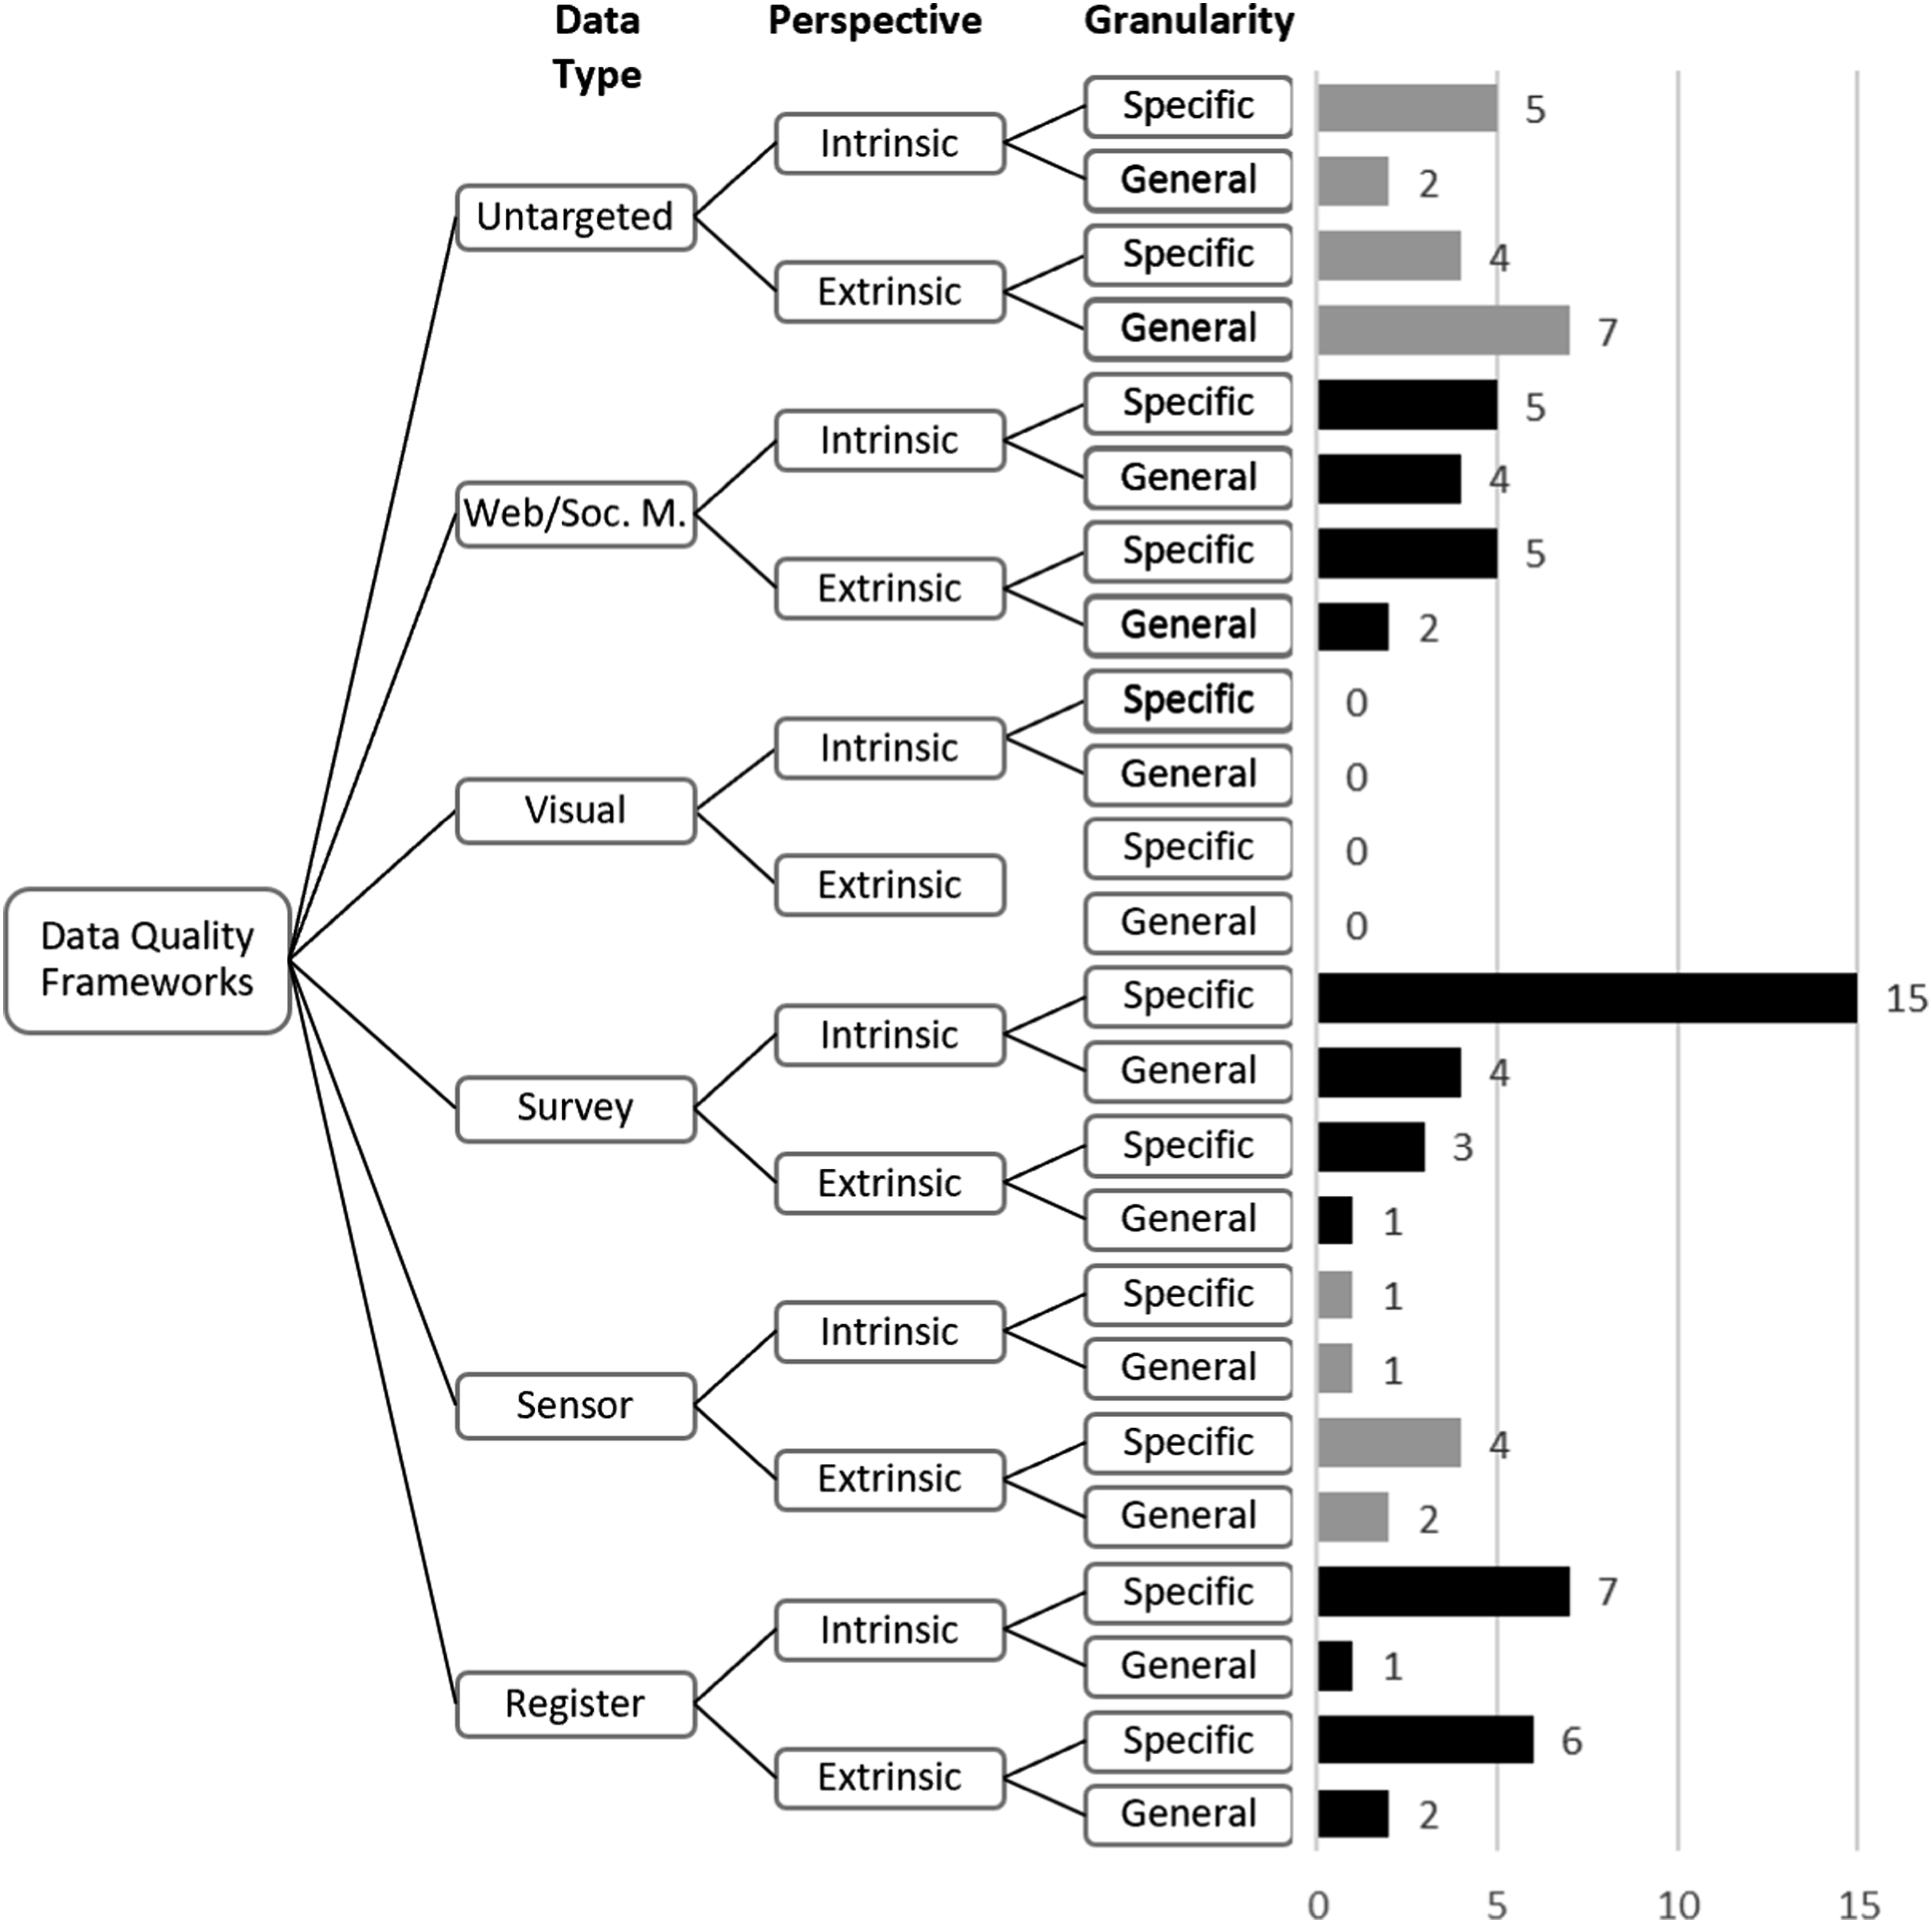
The top level of our decision tree is comprised of nodes that represent the various data types that were examined in the systematic review. We chose to place data type at the forefront of the decision tree since a significant number of the data quality frameworks that we reviewed were developed for specific data types. Therefore, the nature and features of the respective data play a pivotal role in shaping the design of data quality frameworks, making data type the primary determinant in the selection of an appropriate framework. We display nodes for the data types Web and (Social) Media, Visual, Survey, Sensor, and Register data. Additionally, the node Untargeted includes quality frameworks that were not tailored for a specific data type. On the second level, we placed nodes representing the perspective of the reviewed data quality frameworks. This emphasizes the extrinsic perspective by affording it the same space as the intrinsic perspective, and thus allows researchers to pick the most suitable frameworks for the aspect upon which they would like to focus. Moving down the decision tree, the third level contains nodes that reflect the preferred level of granularity when applying the data quality framework. The available granularity categories specific and general refer to the level of detail at which the framework can be applied. General data quality frameworks are very broad universal guidelines and include discussions of data quality dimensions on a higher level. Specific frameworks provide very concrete instructions and discuss indicators on how to test for issues of data quality in great detail.
The most prominent branch of the decision tree and thus the combination of data type, perspective, and granularity that received the most attention was survey data, intrinsic perspective, and in specific detail (15, see Figure 3). Researchers interested in this particular combination would therefore have a broad range of data quality frameworks to choose from, whereas, for other combinations, there were only very few or even no data quality frameworks available. In the subsequent sections, we will first sketch out in our evidence gap map which data types and which aspects of data quality have so far received little attention from the research community, before providing a detailed analysis of the available data quality frameworks and their characteristic.
RO2 and RO3: Evidence Gap Map: Assessing Error Frameworks from the Intrinsic Perspective
Because of the increased level of attention that the intrinsic perspective has received in the literature (see Figure 2), as well as its more systematic structure, we present our evidence gap map for the 39 frameworks that take on an intrinsic perspective (including those that have aspects of both perspectives). Furthermore, we only focus on the frameworks that were coded as specific, as only those frameworks provide a necessarily detailed breakdown of data quality issues in the individual error sources. We aim to present which data types the frameworks in the intrinsic perspective target, which error sources they include, and whether there are aspects that are not covered by the available frameworks. We then describe the frameworks taking an intrinsic perspective in more detail in the following section.
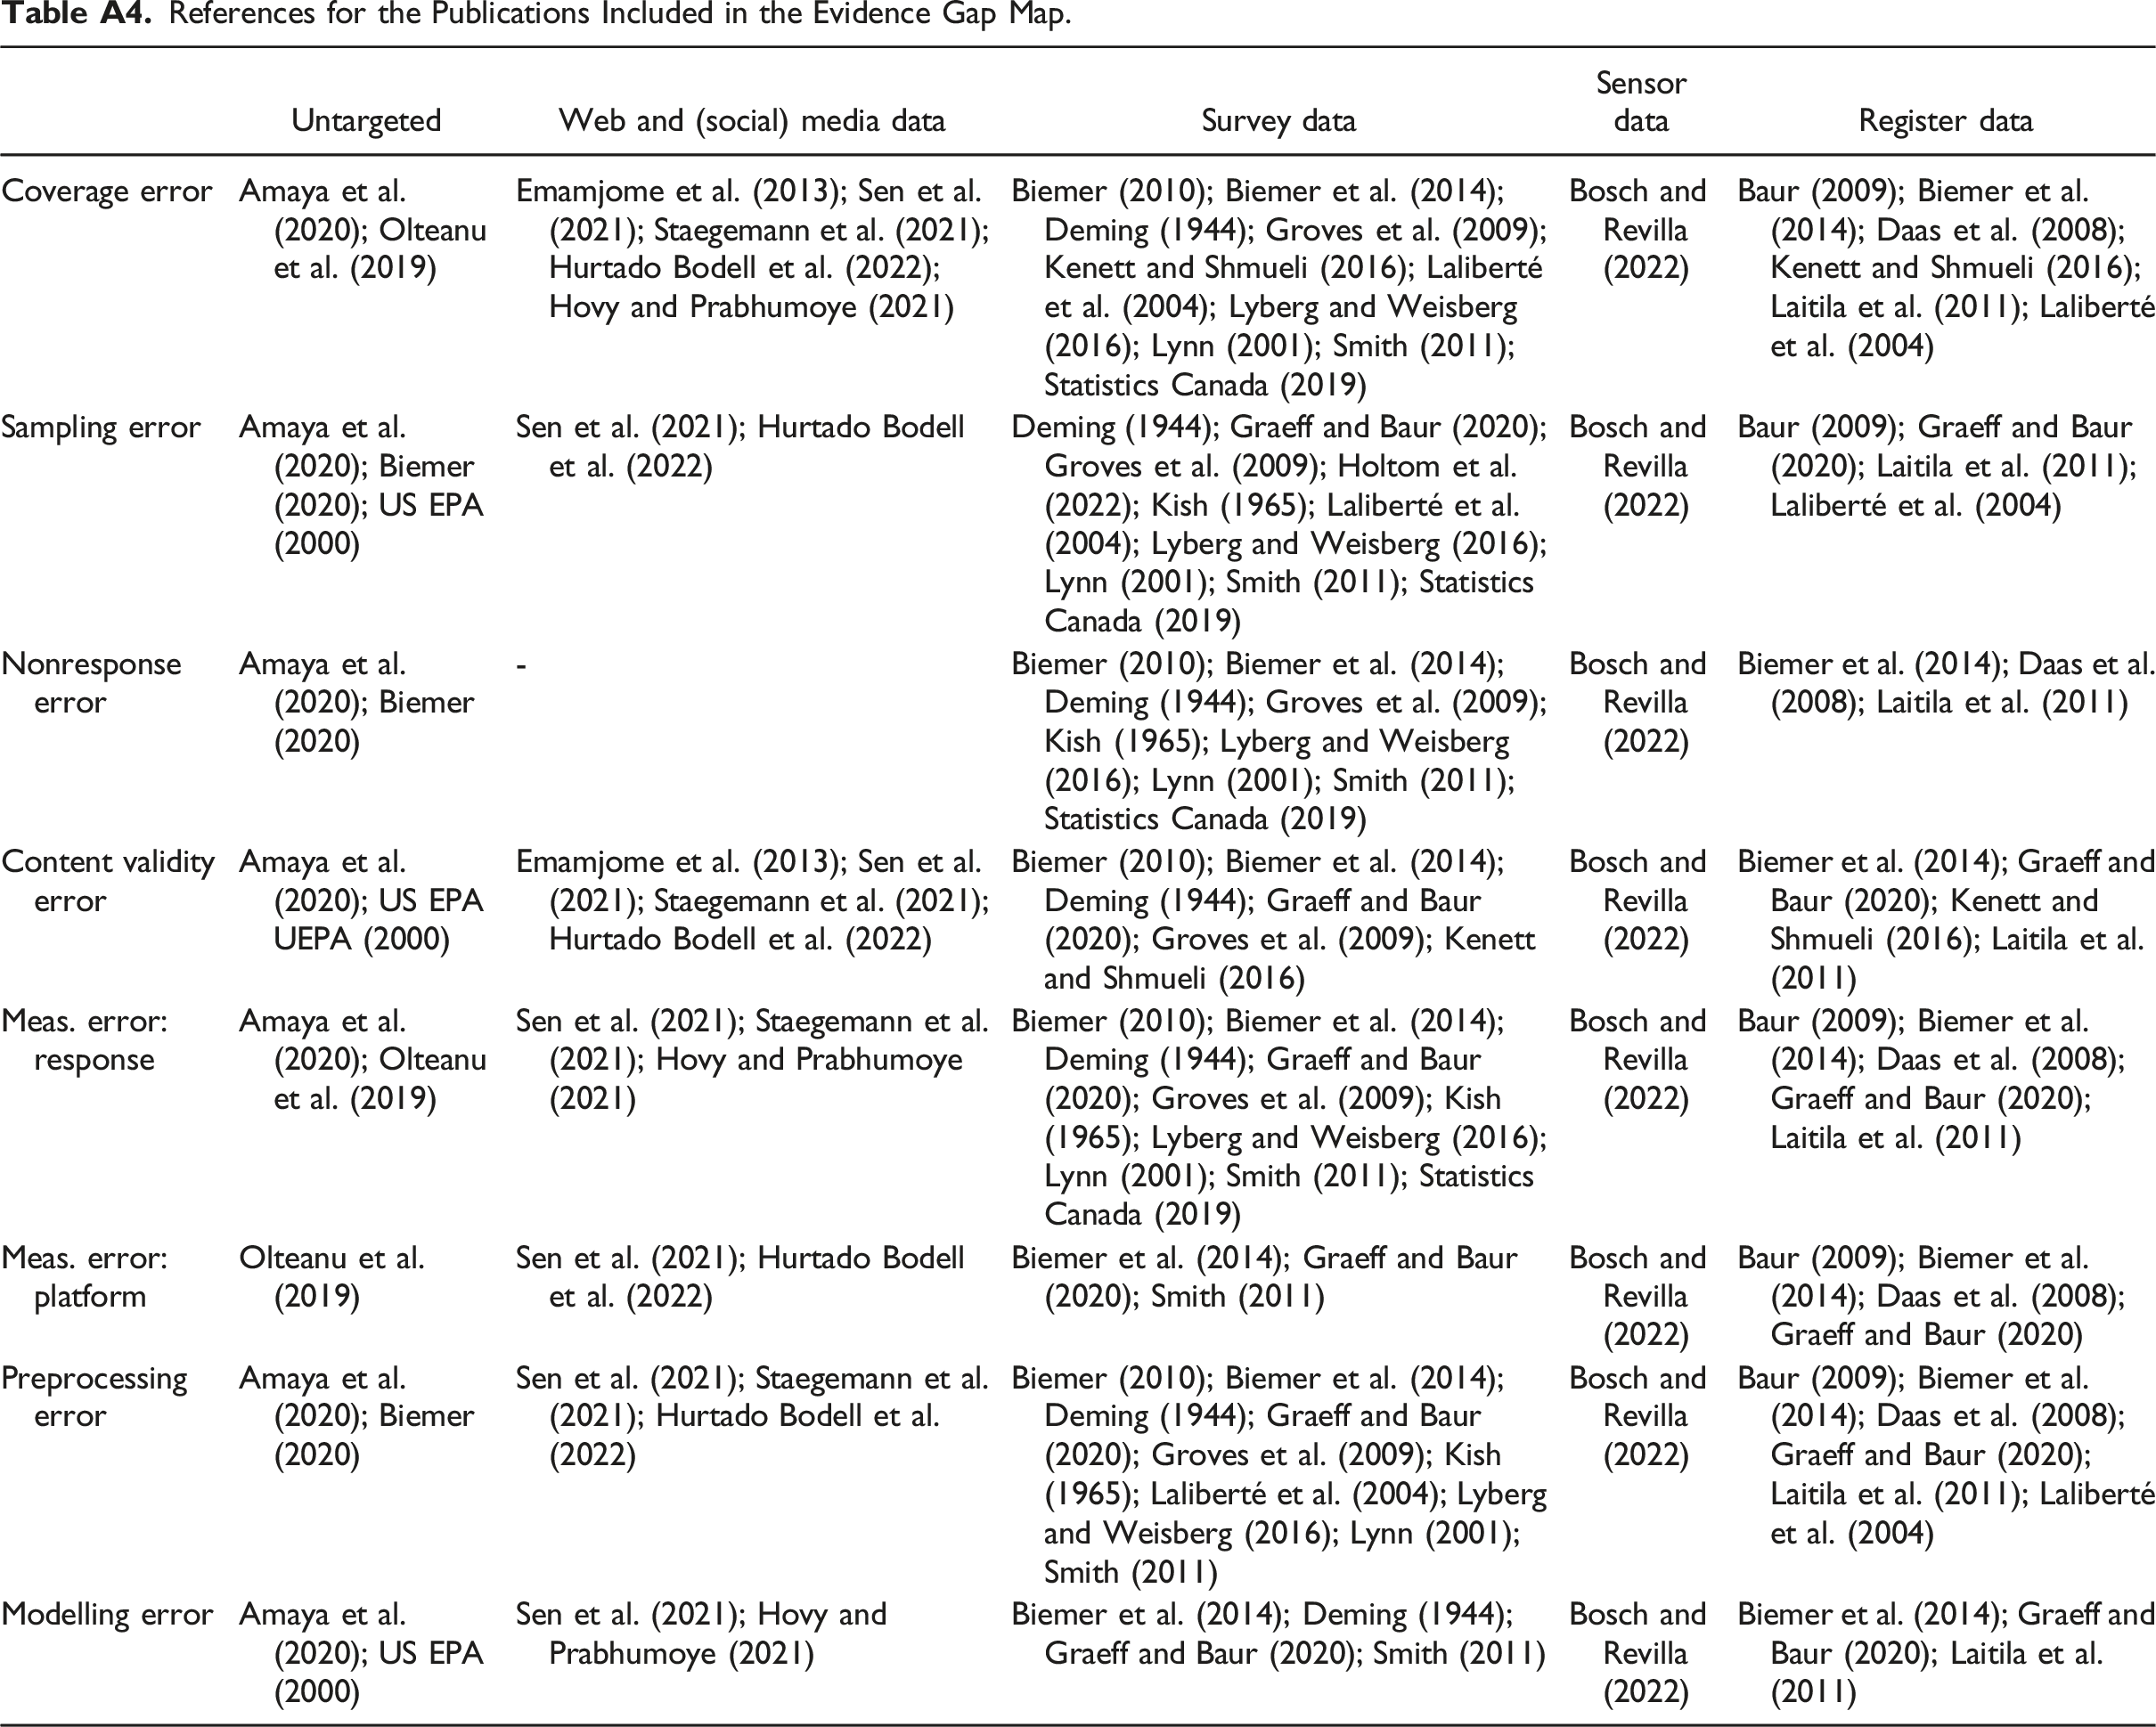
Our evidence gap map of error sources by data types in Figure 4 presents the selected error types for social science data on the y-axis, mapping them against selected data types on the x-axis. The size of the bubble represents how many frameworks include the respective error source by data type. All references for each of the individual bubbles can be found in Appendix Table A4. Evidence gap map for data types by error sources.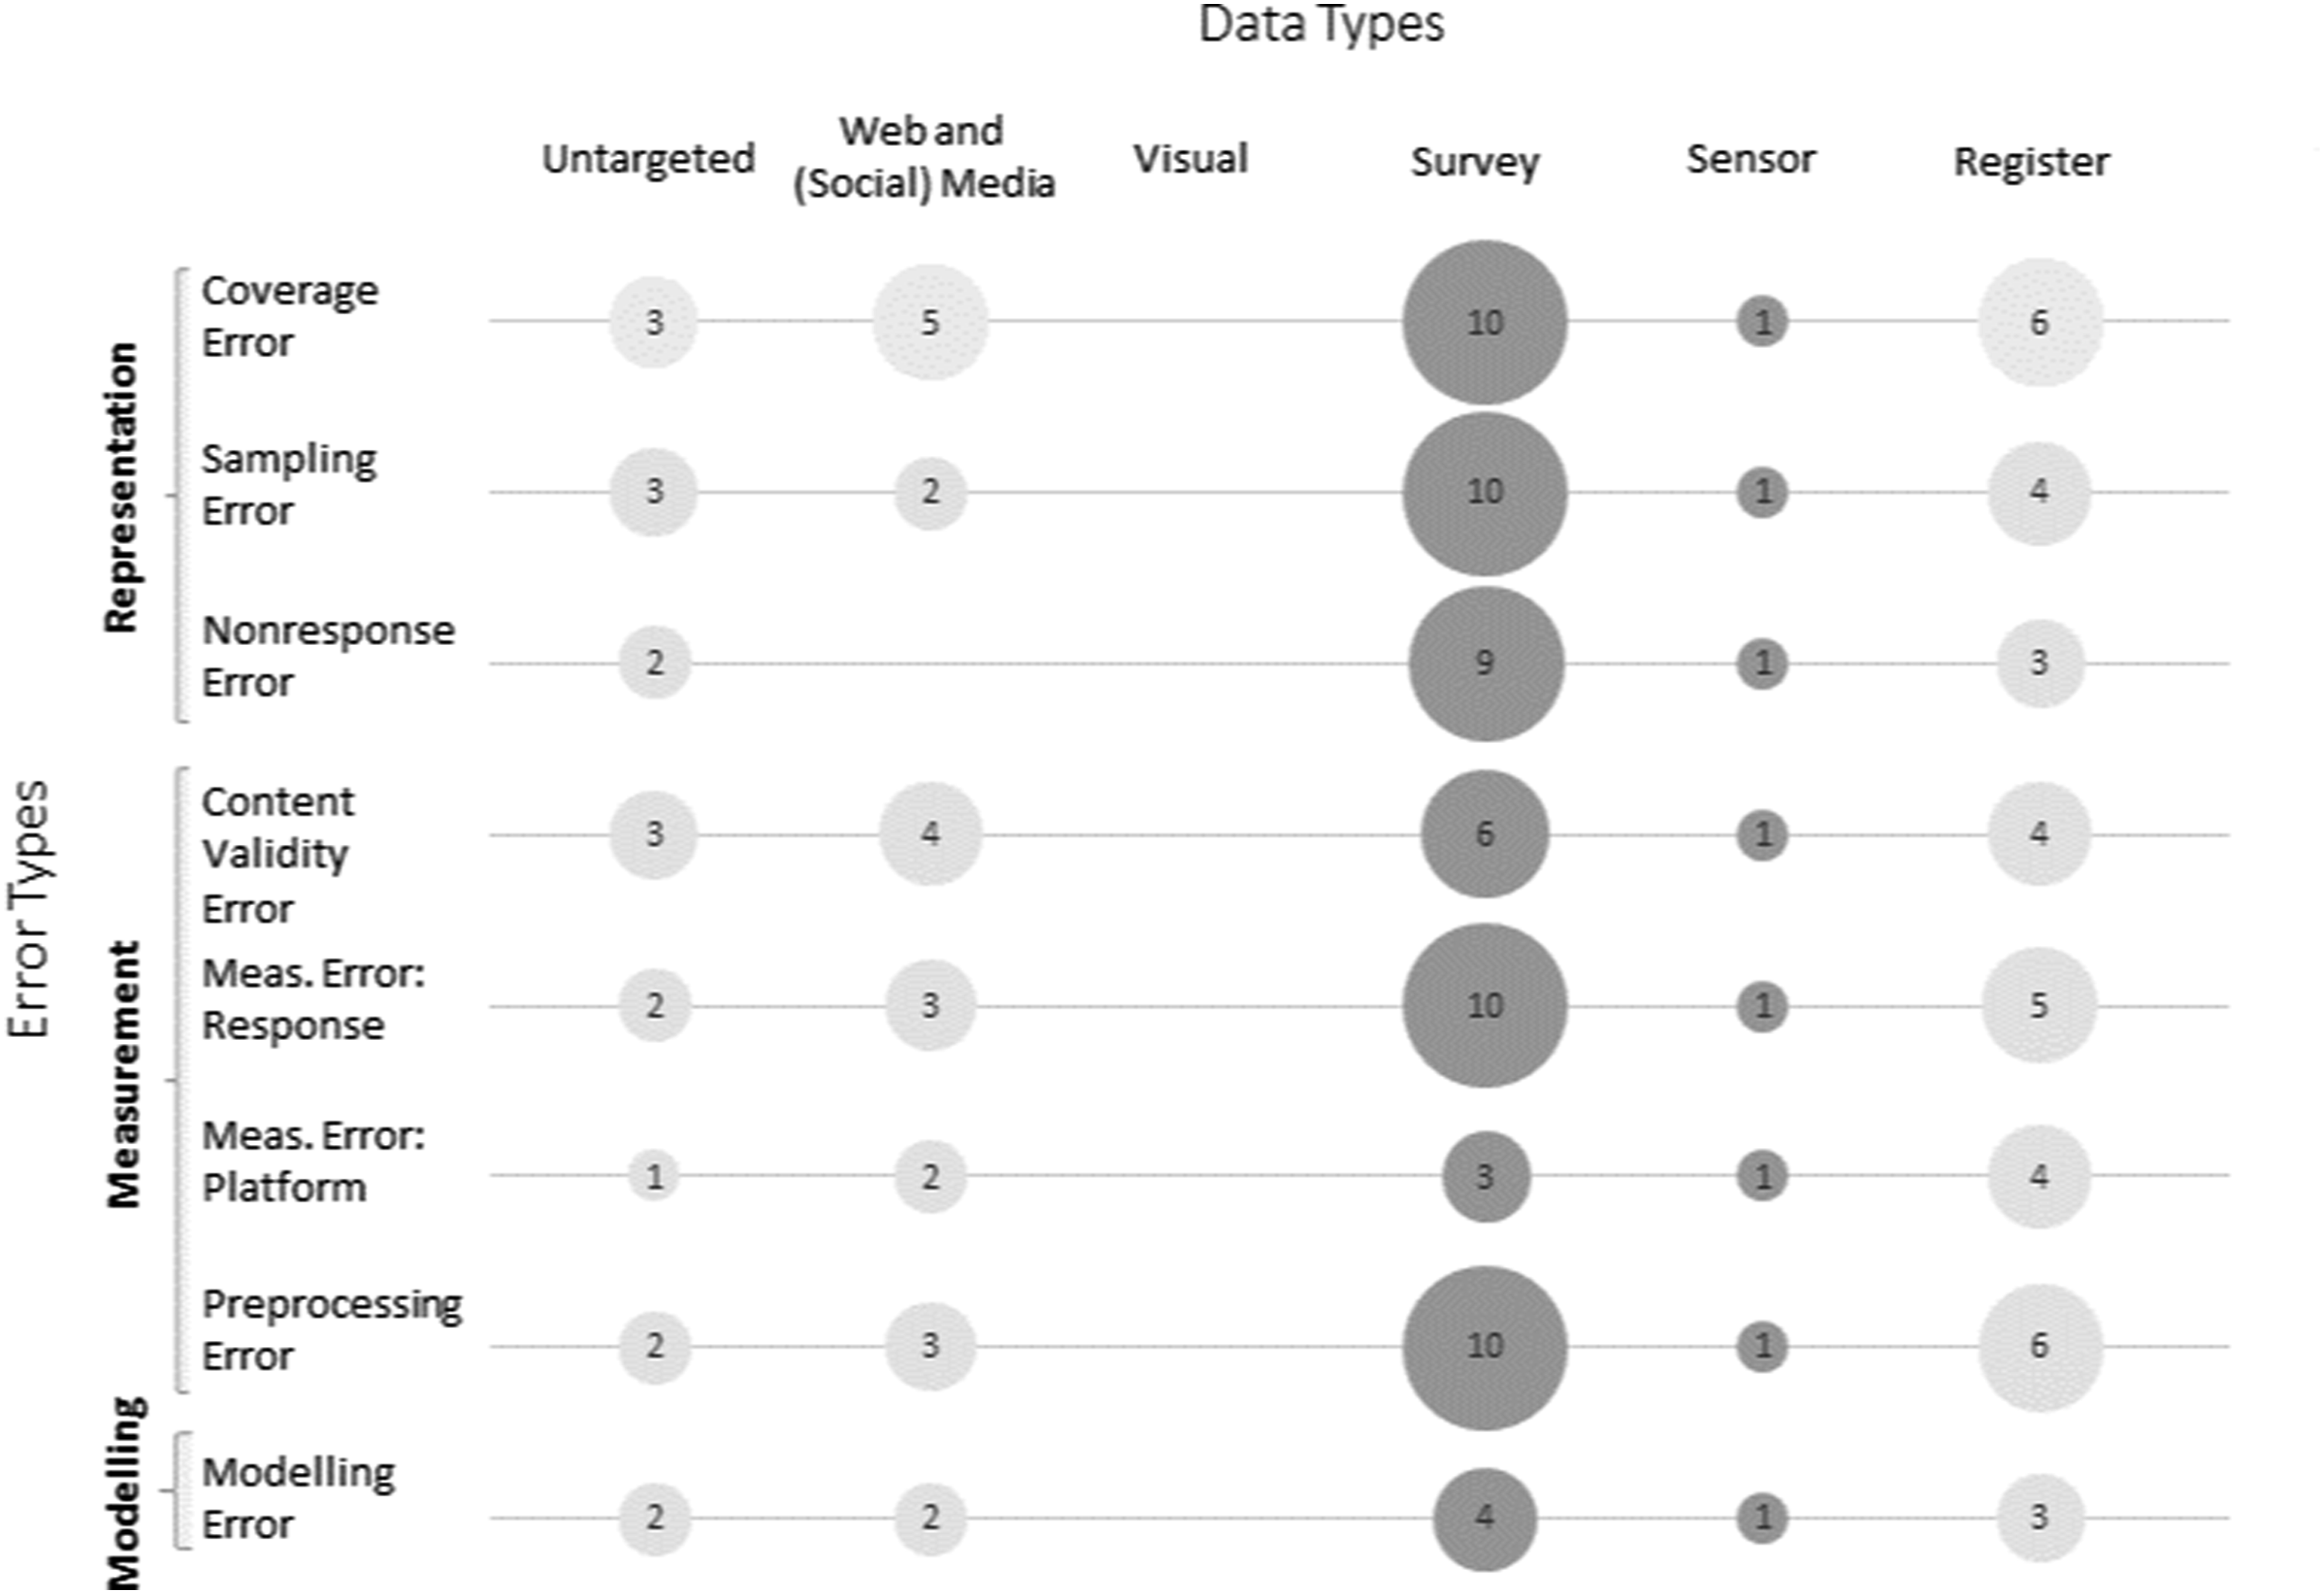
Survey data is the most frequently addressed data source for error frameworks in the social sciences; in total, there are 15 specific error frameworks for survey data taking on an intrinsic perspective. In all these error frameworks, we find a division of errors into the categories of representation and measurement. Representation errors, in particular, coverage, sampling, and nonresponse errors, are the most frequently addressed error sources by error frameworks. Even if the exact terminology used is not always consistent (see an overview in Figure 5(a)), these three error sources are addressed most frequently. The measurement error also frequently occurs in error frameworks for survey data. However, only three out of 15 survey-data-focused error frameworks go beyond the problem of measurement errors occurring due to the design of the questionnaire (Measurement Error Response) and also address measurement errors occurring due to technical difficulties with the questionnaire or the platform (Measurement Error Platform). Even the total survey error framework for survey data by Groves and Lyberg (2010) does not explicitly mention measurement errors caused by administrative considerations, such as survey mode. Two-thirds (10) of the error frameworks for survey data draw attention to the preprocessing of data as a potential source of errors. Summary of the descriptions of the different dimensions of errors. (a) representation, (b) measurement, and (c) other.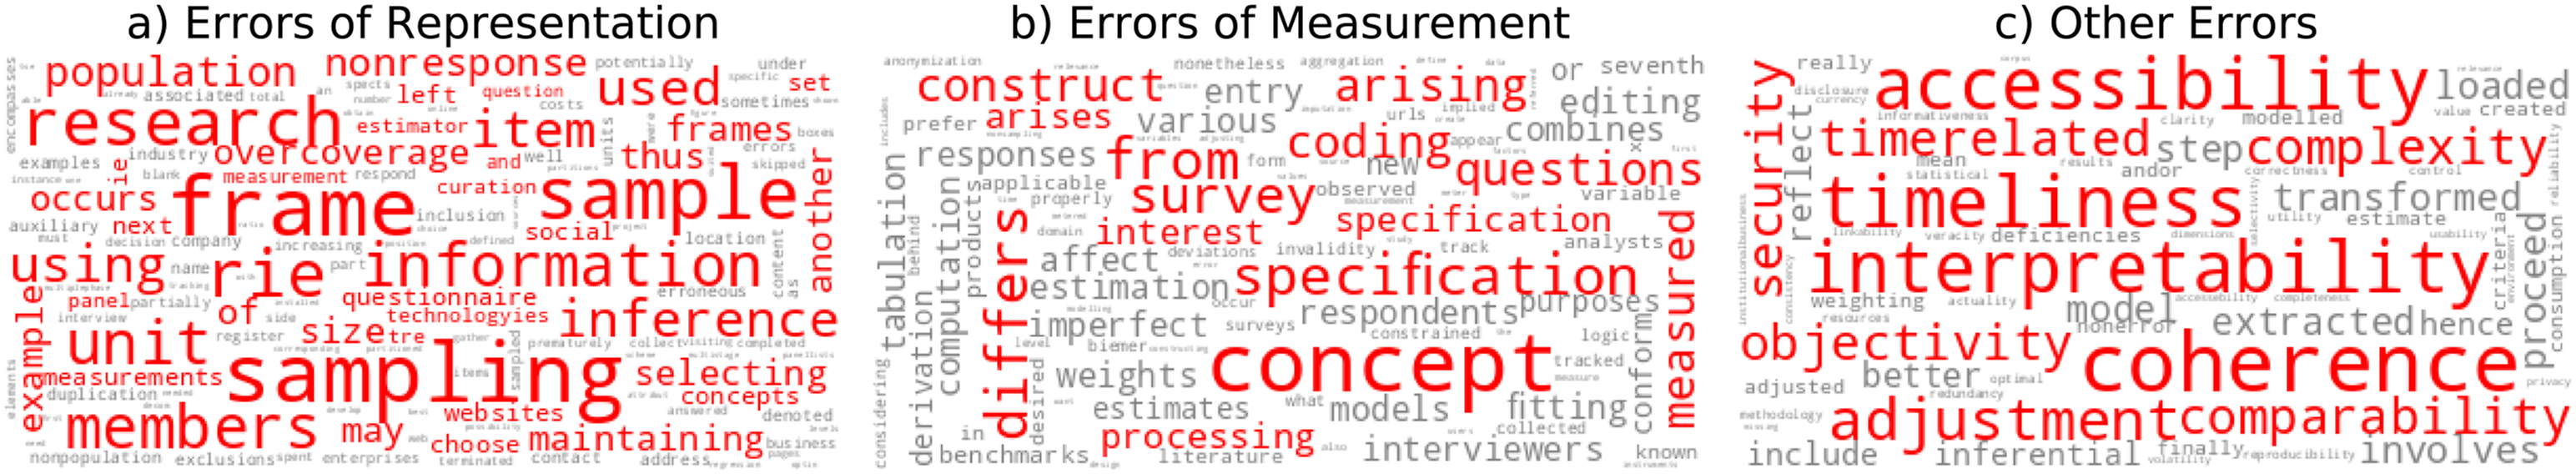
The second most frequently addressed data source of error frameworks is register data. Coverage issues and preprocessing errors are addressed in six of the seven specific error frameworks tailored to register data that take on an intrinsic perspective. These two error sources are also among the most prominent in frameworks for web and (social) media data, with five and three error frameworks mentioning them, respectively. Also prominently featured, with four of the web and (social) media error frameworks discussing them, are issues of content validity. Nonresponse problems are not addressed in web and (social) media data frameworks, likely because data of this type is often “found,” that is, participants are not recruited and data is not requested from participants. The data rather exists as a side-product of all online activities (such as texts or images in social media posts) and are “found” and collected by the researcher. Therefore, the respondents usually have no possibility to avoid the collection of their data—thus, no equivalent to nonresponse exists in these settings.
Under the category sensor data, only one error framework explicitly targeted at web tracking data could be found (Bosch & Revilla, 2022), which addresses all error sources. For another novel data source in the social sciences, visual data, no error frameworks could yet be identified. Finally, we found a few frameworks which were not targeted at specific data types. Here again, the most prominent error sources are coverage error, sampling error, and content validity error, each covered by three frameworks, but all other error sources were also at least targeted by one framework.
Overall, the evidence gap map of quality frameworks looks quite promising. All predefined data types, except for visual data (images and videos), have been addressed at least once. Furthermore, it is not trivial to distinguish from Figure 4 which bubbles are clearly missing and which would just not be meaningful. As argued above, nonresponse errors are often considered not applicable to web and (social) media data, but there might still be certain circumstances in which the nonresponse error could become meaningful for web and (social) media data. An example of a nonresponse error in web and (social) media data would be individuals that refuse to provide their content after being approached by researchers and explicitly asked to do so. This research practice, known as data donations, is increasingly gaining importance, and so might the corresponding nonresponse error for web and (social) media data. Furthermore, with our search criteria, we did not find any error frameworks that deal with problems of linking and combining different data types.
RO4: Systematic Review: Qualitative Evaluation of Error Dimensions Within the Intrinsic and Extrinsic Perspectives
To address our last objective of providing a detailed overview of the intrinsic and the extrinsic perspectives, we will now describe in more detail the evidence that we have mapped according to error and data sources in the evidence map (see Figure 4) in the form of a systematic review. In the first of the following subsections, we will focus on evidence that investigates data quality from an intrinsic perspective. Starting with the most referenced error framework for social science survey data, the Total Survey Error (Groves et al., 2011, p. 48), we will describe in more detail the evidence found according to its error sources: representation, measurement, and modeling. In the second of the following subsections, we focus on the extrinsic perspective.
(a) The Intrinsic Perspective
The Total Survey Error framework distinguishes two key sources of errors, namely, whether respondents’ answers reflect their true opinion and behavior (measurement errors) and whether the measurements are generalizable to the target population (representation errors) (Groves et al., 2011, p. 40). Through these two key sources of error, however, the Total Survey Error framework only covers the different phases of the data collection process. For this review, we follow the suggestion made by Biemer et al. (2014) and add the modelling error as another source of error. We follow the definition provided by Biemer et al. (2014), interpreting the modelling error as all those errors that occur when fitting models to the data (see also our Glossary in Table 2).
We will subsequently discuss the three identified sources of error: representation, measurement, and modelling, and describe these error sources in more detail according to the addressed data types.
First, we present word clouds in Figure 5 to account for the different terminologies used in different disciplines. Words are weighted and highlighted according to their TF-IDF scores, thus showing how the included publications named the three error sources (a) representation, (b) measurement, and (c) other errors. By this logic, modelling and other post-processing errors belong to this latter category. Representation errors revolve around sampling, coverage, and nonresponse, while measurement errors focus on the specification and operationalization of constructs. Many publications mentioned errors beyond representation and measurement, which are summarized in the “other” category; These include terms beyond the intrinsic perspective, like timeliness and coherence, which we explore in detail in the section on frameworks taking on the extrinsic perspective. The mentioning of perspectives beyond representation and measurement suggests that many frameworks mix extrinsic and intrinsic perspectives when targeting data quality.
Representation Errors
Representation errors are defined as “errors of nonobservation and pertain to deviations of statistics estimated on a sample from that of a full population” (Groves et al., 2011, p. 40). This category includes three error sources: coverage, sampling, and nonresponse error.
Coverage Errors
Traditionally, coverage error is a term used to classify errors that describe the “non-observational gap between the target population and the sampling frame” (Groves et al., 2011, p. 54). In Figure 6, we present word clouds that summarize the different terminologies used across the different frameworks for the same error source. For coverage error (left panel), the term “frame error” is the most commonly used synonym. Summary of the descriptions of selected types of errors. (a) coverage, (b) validity, and (c) platform errors.
This idea of a coverage error is not limited to survey data, for which it is mentioned in ten different frameworks, as it is also implemented for register data (in six frameworks), web and (social) media data (in five frameworks), and sensor data (in one framework; see Figure 4). Only the framework from Kish (1965) for survey data and the data-type unspecific framework from US EPA (2000) do not include coverage errors in their error considerations.
The ten frameworks addressing survey data and containing coverage error describe it largely homogeneously. One of the first frameworks, by Deming in 1944, described coverage error in an applied form as “Bias arising from an unrepresentative selection of respondents.” More recent frameworks address coverage bias in surveys more formally as “the list from which a sample is taken does not correspond to the population of interest” (Biemer, 2010; Lyberg & Weisberg, 2016, p. 4). Other frameworks, for example, the ASPIRE system for register and survey data, distinguishes coverage error in the inclusion of non-population members (overcoverage) and the exclusion of population members (undercoverage) (Biemer et al., 2014; Smith, 2011). The frameworks that focus on register data agree with these definitions (Baur, 2009; Laliberté et al., 2004). For web and (social) media and visual data, coverage error often means platform coverage error. Usually, the target population of a study is not the same as the platform population from which the researcher receives web and (social) media and visual data—that is, unless the researcher is interested in investigating the specific platform, and not a more general population. Undercoverage is the most pronounced problem (Bosch & Revilla, 2022; Hsieh & Murphy, 2017; Sen et al., 2021).
Sampling Errors
Sampling errors are the non-observational gap between the sampling frame and the sample (Groves et al., 2011, p. 56). Sampling as an error source is taken up in all identified frameworks but may be referred to using different terminologies. Also, the term “sampling error” is known in various disciplines and is largely homogeneous across disciplines. Some outliers label sampling errors as “accuracy errors,” but also errors that are particularly associated with technical terms such as “data generation error,” “user selection,” or “query error.”
The 15 specific error frameworks with an intrinsic perspective that are targeted on survey data describe the sampling error as an error that occurs because not all persons in the sampling frame are measured when a specific Sample A is drawn (and not Sample B) (Biemer, 2010; Deming, 1944). Older literature, such as Kish (1965), defines sampling error more broadly and distinguishes between sampling and nonsampling errors, whereas sampling error includes errors associated with the sampling scheme (e.g., simple random vs. multistage), sample size, and choice of estimation model.
Sampling error is always prominent when not the full population but only a sample is included in the analysis. With web and (social) media data and sensor data, sampling may have a different meaning: here, instead of trying to sample from a general target population, the task is often to create a meaningful sample out of all available data by defining search queries. In some cases, there may also be no sampling if all texts, posts, or data from a specific sensor can be analyzed and no sample is drawn. However, in some contexts, researchers may also be restricted by technical means (e.g., in cases of accessing data from online platforms or due to the lack of computational resources to study all content) and cannot receive all relevant traces or even have no control over what exactly they receive, leading to different notions of sampling errors due to lack of transparency (Sen et al., 2021).
Nonresponse Errors
Nonresponse error is the nonobservation gap between the sample and the respondent pool (Groves et al., 2011, p. 58). Some frameworks see nonresponse error as a fairly general source of error encompassing both unit and item nonresponse (Biemer, 2010), while others count item nonresponse as a form of measurement error (Shoemaker et al., 2002; Silber et al., 2021).
Nonresponse errors are particularly prominent with respect to survey data. Here, respondents have the option to refuse to participate in the survey or to break off. Parallels can be drawn for other data types whenever individuals are asked to share data, such as for sensor data sharing via smartphones (Bosch & Revilla, 2022). Web and (social) media data are usually shared publicly before they are collected for research purposes, so nonresponse errors do not occur. However, if individuals are asked to donate their social media data, and they refuse, this would fall into the idea of nonresponse.
For our systematic review, we had to exclude Schouten et al. (2009) and Schouten et al. (2012) because they described exclusively representativeness and did not take the view of a total error concept into account. However, they are highly recommended for closer examination of errors due to nonresponse.
Measurement Errors
Measurement errors refer to deviations from the true values of observation. In the context of surveys, Groves and Lyberg (2010) describe errors of measurements as those errors that arise during the application of measurement instruments in the data collection process. In sum, the authors describe three types of measurement errors—validity due to how a construct is defined, response error due to imperfect survey responses, and processing errors due to incorrect coding of responses. Finally, in the context of newer data sources, especially digital trace data, researchers also discuss platform errors related to the digital platform(s) from where the data is collected. In our review of data quality-related publications, we checked whether related errors were mentioned.
Content Validity Errors
Validity is associated with how well the construct of interest is defined and operationalized. While a few publications use this term (Kimberlin & Winterstein, 2008; Sen et al., 2021), an equal number of publications that touch upon errors of measurement refer to “specification error” (Amaya et al., 2020) as the incorrect specification of the construct. Another term often used in conjunction with misspecified constructs is “accuracy” and “correctness” (Figure 6(b)).
Measurement Errors—Response
Many publications, especially those focusing on surveys, mention response errors, particularly emphasizing interviewers (Biemer, 2010; Deming, 1944; Lyberg & Weisberg, 2016), respondents, as well as aspects related to the data collection instrument. In the context of surveys, response errors often occur due to observation effects, and thus, we see discussions of social desirability (Bosch & Revilla, 2022).
Measurement Errors—Platform
Adapted to survey data, platform errors would mean measurement error due to technical restrictions in the data collection, for example, non-intuitive survey forms (Nair & Adams, 2009) or survey mode effects (Shin et al., 2012). Based on new types of data, Sen et al. (2021) adapted response errors in surveys to their potential manifestation in web and (social) media data due to platform affordances and effects. Baur (2009) and Sen et al. (2021) mention the possibility of incorrect data collection or observation of platform data. Hsieh and Murphy (2017) and Olteanu et al. (2019) discuss linking errors in the context of platform data, while Hurtado Bodell et al. (2022) discuss issues with the digitalization of textual data.
Preprocessing Errors
Preprocessing errors are usually discussed in the context of processing survey responses or platform data in a step called “coding.” Often, there is no clear distinction between preprocessing and processing. Accordingly, researchers discuss the accuracy and reliability of statistical procedures in the processing step (Laliberté et al., 2004; Smith, 2011). Bosch and Revilla (2022), Hurtado Bodell et al. (2022), Deming (1944), and Amaya et al. (2020) refer to this type of error as “text curation error.”
Modelling Errors
Frameworks that addressed issues sufficiently similar to those labelled as “modelling/estimation error” in Biemer et al. (2014) were coded as covering some form of modelling error. These errors are called “modelling error,” “interpretation error,” or “analysis error” in two publications each. Of the ten publications that have been coded as covering modelling error, most are specialized on survey data (four), register data (three), and web and (social) media data (two). Additionally, those publications covering modelling error mostly also cover the full research process and thus most or all the types of errors we distinguish in our coding. It appears that only fully developed frameworks that offer detailed descriptions of the research process include a discussion on modelling errors, whereas more specialized data quality frameworks tend to focus on different aspects of the research process.
On the highest level, there seems to be a distinction in the literature between (a) modelling errors due to errors in the interpretation, or the “[inference] of meaning from the Twitter 2 content other than that intended by the tweeter,” as put for the context of web and (social) media data by Hsieh and Murphy (2017), and (b) more technical errors that are closely related to the method chosen for modelling, from “bad curve fitting; wrong weighting; incorrect adjusting” as observed by Laitila et al. (2011) in the survey context, to biased machine learning models, as discussed in Hovy and Prabhumoye (2021). Regarding modelling errors through wrong interpretation, Hsieh and Murphy (2017) warn for web and (social) media data that inferences which are valid in one context might not be valid in another context. Similarly, Hovy and Prabhumoye (2021) report for web and (social) media data that an inference offered by a model might be correct, but might be so for the wrong reason, affecting the level of confidence a researcher should have in the respective results. For surveys, Deming (1944) mentions misunderstandings of the questionnaire, the method of collection, and the nature of the data as reasons for interpretation errors, as well as ignoring difficulties that participants might have had in answering the survey. For register data, Graeff and Baur (2020) report a type of modelling error that arises when heterogeneous data (different time periods, different collection times) is interpreted as homogeneous and treated accordingly. Modelling errors that are more technical are often concerned with the adjustment of the data through adjustment weights or imputation. To be able to apply statistical methods for these ends, the relevant information about the population (e.g., demographics) needs to be available (Bosch & Revilla, 2022), which for the web and (social) media context might not always be the case, as noted by Amaya et al. (2020) and Sen et al. (2021).
(b) The Extrinsic Perspective
The extrinsic perspective on data quality emphasizes the importance of how well data meets the needs and expectations of the user, while the intrinsic perspective focuses on the technical aspects of the data itself (Emamjome et al., 2013; Hong & Huang, 2017). However, both perspectives are not mutually exclusive. Measures traditionally attributed to the intrinsic perspective are also relevant from the extrinsic perspective as they also influence the “fitness for use” of a data set (Jesilevska & Skiltere, 2017). At the same time, data quality attributes that relate to the legal and ethical aspects of the data, as well as the documentation and potential re-use and replicability of the data, can primarily be assigned to an extrinsic perspective. These aspects often address the FAIR Principles (Wilkinson et al., 2016). FAIR data refers to data that are findable, accessible, interoperable, and reusable. FAIR data principles are important because they enhance the overall value and utility of data, particularly in the context of scientific research. Following Mons et al. (2017, p. 50), FAIR data includes “characteristics and aspirations for systems and services to support the creation of valuable research outputs that could then be rigorously evaluated and extensively reused, with appropriate credit, to the benefit of both creator and user.” In concrete terms, the implementation of FAIR principles can reach from using comprehensive and standardized metadata to using common, non-proprietary file formats. Moreover, FAIR Principles can be complemented by the CARE Principles. While the former focus strongly on open science, the latter speak to “how scientific data is used in ways that are purposeful and oriented towards enhancing the wellbeing of people” (Carroll et al., 2021, p. 3).
From frameworks falling into this perspective, data quality is usually understood to be the degree to which data meet the needs of users for both known and unanticipated purposes (Lukyanenko et al., 2019; Radhakrishna et al., 2012). Sometimes the attributes from an extrinsic perspective are further divided into “process-oriented criteria that analyze the data along the process in which they are used, and system-oriented criteria that are related to the technical aspects of data management” (Batini et al., 2008).
Based on the extrinsic perspective, data quality can be analyzed through relevant data quality categories and related metrics (Batini et al., 2015). Different ways of categorizing and describing data quality exist: Attributes (or sometimes referred to as indicators) are specific properties of data that can be measured, and dimensions are a “broader set of data quality attributes” (Ijab et al., 2019). Sometimes these dimensions are further aggregated into concepts or hyper-dimensions that resemble abstract ideas or theories and provide a large framework for understanding data quality (Team, 2014). However, some authors use those terms interchangeably, rendering a clear allocation difficult.
There are various attributes or indicators that are commonly used to evaluate the quality of data from an extrinsic perspective. While the specific selection of attributes varies depending on the context and intended use of the data, some of the most common properties (that are sometimes also referred to as dimensions) of data quality include (see, e.g., Batini et al. (2009) and Brackstone (1999)): Accuracy (the extent to which the data represents reality and is free from errors), completeness (the degree to which all necessary data is present and accounted for, with no missing values in the data), timeliness (how up-to-date the data is and how quickly it is made available to users), consistency (the degree to which data is free from contradictions or conflicts within the same data set or across multiple data sets), and validity (the extent to which the data is relevant and applicable to the intended use or purpose). Other commonly used attributes of data quality include reliability, relevance, accessibility, credibility, believability, and interpretability. However, the specific set of attributes used to evaluate data quality varies and can be considerably more detailed. Following the extrinsic perspective on data quality, the selection of the respective metrics relies heavily on the users’ requirements of the data and often the process by which the data was collected, stored, and aggregated (Micic et al., 2017). Furthermore, specific components, like accessibility or timeliness, are universal, and users are in a good position to clearly formulate their needs (Bergdahl et al., 2007).
There is not only a lack of consistency in the literature regarding the number of data quality attributes. Various authors offer different terminology for data quality dimensions and there is no agreement on definitions and even assessment approaches. While the definitions for accuracy, for example, are largely consistent, the definitions for completeness can vary considerably (Jesilevska & Skiltere, 2017). Consequentially, the standardization of data quality information is one facet that is expected to gain importance in the future. However, it is unlikely and not necessarily purposeful that there will be complete standardization, as users have different needs, which are reflected in different data quality dimensions (Veregin & Hargitai, 1995). With the “sometimes-fuzzy nature of the domain and its definitions,” it is not always possible to define clear demarcations as they might be too “similar or interwoven with each other” (Staegemann et al., 2021).
While some attributes are overlapping and sometimes hard to differentiate, others might even be at odds and hardly achievable simultaneously. This is especially true in the realm of digital trace data. An example is the possible contradiction between the two attributes timeliness and accuracy (or completeness) (Staegemann et al., 2021). While the former attribute means, for example, in the context of web and (social) media data, that the data need to be analyzed shortly after they have been generated and collected, the latter implies a careful and time-consuming validation process. Especially in the case of a trade-off between different data quality attributes, it may be beneficial to give more weight to the extrinsic perspective (as compared to an intrinsic perspective) when deciding which attribute is of higher importance for a given data set (Brackstone, 1999). Yet, in such cases, there still needs to be a clearly defined minimum of data quality standards regarding the intrinsic perspective in place.
Discussion and Conclusion
With the present study, we aimed to provide researchers with the necessary information to select a framework to assess the data quality of their data. Using a systematic literature review, we identified and reviewed 58 data quality frameworks and created a decision tree to support researchers in this selection task (Objective 1). We further used an evidence gap map to investigate how well these frameworks cover different social science data types and quality dimensions (Objectives 2 and 3). Overall, we found variations in the frameworks’ level of granularity, which data types they covered, and how they conceptualized important data quality dimensions. Moreover, we found two dominant perspectives that frameworks took: intrinsic and extrinsic perspective. Most frameworks focused on survey and register data. Yet, we found a gap in frameworks that covered visual and linked data. Finally, we provide a review of the literature regarding both the intrinsic and extrinsic perspectives (Objective 4), which showed overlaps but also clear differences regarding the respective data quality frameworks falling under the two categories.
Our findings have several implications for social science research. First, we provide researchers with the necessary information to identify and select a data quality framework appropriate for their research context. As our review shows, many frameworks, each with its own specificities, co-exist. For example, there is considerable variation in which data type(s) or dimensions of data quality they cover and from which perspective. In our view, a systematic overview was required to enable researchers to make informed fit-for-purpose decisions on which framework to select.
Second, the data quality frameworks we identified in our systematic review stem from different disciplines. We see merit in a closer exchange of ideas between disciplines—something our study aims to facilitate by collecting and comparing frameworks from different disciplines. As we discussed before, methods in the social sciences are becoming increasingly diverse and do include approaches developed and applied in other disciplines. In our view, a closer exchange between disciplines is necessary to ensure the proper implementation and advancement of research methods. However, this exchange requires a shared awareness of the concept of data quality and how it is assessed by each discipline. Our contribution can assist researchers in this challenge.
Third, as argued above, social scientists have started to employ data collection approaches from other disciplines. In some instances, multiple approaches are combined to leverage the benefits of each data collection approach (Silber et al., 2022; Stier et al., 2020), for example, combining surveys to collect attitudinal data with web tracking to measure online behavior (Cernat & Keusch, 2022; Yan et al., 2022). When assessing the quality of these linked data, data type-specific frameworks such as the TSE likely fall short in including all relevant data quality dimensions. The present study enables researchers to identify supplemental data quality frameworks that they need to consider when performing data collection with multiple approaches. In general, with our review, we intend to stimulate the development of frameworks that include the combination of different approaches and foster the exchange of ideas between disciplines.
Limitations and Future Directions
We see merit in future research that advances our study and remedies its limitations. First, given the recent trend to collect digital behavioral data in the social sciences, we have reviewed data quality frameworks mostly stemming from social and computer science. While we see this development as predominant in the era of digital social research and, thus, the exchange between the two disciplines as important to stimulate, we acknowledge that frameworks from other disciplines exist that are not covered here. For example, the collection of biomarkers is rooted in medical sciences, yet these techniques have also found limited application in the social sciences. We assume that other data collection techniques exist that are similarly rarely used in the social sciences but might become more important in the future. Thus, we encourage future research to widen our scope and include more disciplines and data quality frameworks. Furthermore, by using only the search engines of Web of Science and EBSCO, our sample might be biased by leaving out (grey) literature, not listed in these two engines.
Second, with our study, we focused on providing a comprehensive overview and a decision tree to make informed framework selection possible, and to determine gaps in the existing frameworks. However, we acknowledge that more in-depth analyses and comparisons of the data quality indicators of selected data quality framework could be worthwhile. This could be especially beneficial if sample data sets are used to evaluate fit for purpose of the respective data quality indicators. Yet, for the purposes of our study, we had to remain at a level of higher granularity to describe and compare the 58 frameworks. From our point of view, it would be definitely worthwhile considering the extrinsic perspective in more detail. The review methodology used in our study could provide a blueprint for future research to identify relevant data quality frameworks and indicators.
Third, a logical next step following our research on data quality frameworks would be to identify gaps in the available data quality indicators and related metrics. For a data quality framework to be easily applicable in practice, it would be important that indicators are available for each of the included data quality dimensions. We would like to encourage future research to conduct a systematic review of which indicators are available, how they relate to each other, and for which data types and data quality dimensions new indicators need to be developed. Such an overview and data quality indicator gap map could enable social scientists to allocate resources to advance data quality frameworks, increase the applicability of frameworks in practice, and, ultimately, enable researchers to comprehensively assess the quality of their data.
Fourth, we solely limited this review to quantitative data quality concepts due to resource-related reasons. This implies that conclusions are limited to the quantitative social sciences. However, we see a research gap regarding qualitative social science research to systematically elaborate on data quality concepts as well.
Footnotes
Declaration of Conflicting Interests
The author(s) declared no potential conflicts of interest with respect to the research, authorship, and/or publication of this article.
Funding
The author(s) received no financial support for the research, authorship, and/or publication of this article.
Notes
Appendix
Search Terms.
Type of search
Search terms
Naive search
data quality OR error dimension AND concept OR framework AND social sciences
Final search
((error* OR bias* OR “data* accuraci*” OR “data* analysi*” OR “data* clean*” OR “data* collect*” OR “data* complet*” OR “data* qualiti*” OR “data* valid*” OR “inform* qualiti*” OR “qualiti* assess*” OR “qualiti* assur*” OR “qualiti* improv*” OR “qualiti* of data*” OR “qualiti* evalu*”) AND (survey* OR “digit* content*” OR “digit* behavior*” OR poll* OR “public* opinion*” OR “big data*” OR “health* care*” OR “sensor* network*” OR“social* media*” OR “geograph* inform*” OR “wireless* sensor*”) AND (concept* OR “assess* framework*” OR “generic* framework*” OR “literatur* review*” OR “qualiti* dimens*” OR “qualiti* framework*” OR “qualiti* monitor*” OR “qualiti* problem*” OR “qualiti* requir*”)
The Codebook That Was Used to Annotate the Publications Included in the Systematic Literature Review.
Variable name
Variable description
Variable coding
ID
Case number_General
Open text
Authors
Authors
Open text
Title
Title
Open text
Year
Year of publication
Open text
Journal
Journal/book
Open text
DOI
DOI
Open text
Targeted
Is the framework targeted on a specific data type
1 = yes, 0 = no
Survey data
Whether the authors refer explicitly to the named data type [survey data] for their framework
1 = yes
0 = no
99 = missing by design, missing because it does not make sense
95 = don’t know
Register data
Whether the authors refer explicitly to the named data type [register data] for their framework
1 = yes
0 = no
99 = missing by design, missing because it does not make sense
95 = don’t know
Text data
Whether the authors refer explicitly to the named data type [text data] for their framework
1 = yes
0 = no
99 = missing by design, missing because it does not make sense
95 = don’t know
Video data
Whether the authors refer explicitly to the named data type [video data] for their framework
1 = yes
0 = no
99 = missing by design, missing because it does not make sense
95 = don’t know
Images data
Whether the authors refer explicitly to the named data type [images data] for their framework
1 = yes
0 = no
99 = missing by design, missing because it does not make sense
95 = don’t know
Sensor data
Whether the authors refer explicitly to the named data type [sensor data] for their framework
1 = yes
0 = no
99 = missing by design, missing because it does not make sense
95 = don’t know
Web tracking data
Whether the authors refer explicitly to the named data type [web tracking data] for their framework
1 = yes
0 = no
99 = missing by design, missing because it does not make sense
95 = don’t know
Social media data
Whether the authors refer explicitly to the named data type [sensor data] for their framework
1 = yes
0 = no
99 = missing by design, missing because it does not make sense
95 = don’t know
Data type: Else
Open text
Open text, 99 = missing by design, missing because it does not make sense
Datatype
Combination of all coded data types
Open text
Perspective?
Which perspective does the contribution refer to; naming errors independent from where in the process they occur, or considering more the lifecycle of data collection as perspective and name problems here. When they refer more on data attributes or something else we won’t do the detailed coding. Data atttributes are, e.g., storable, but also accurate, etc.
Error (1) or a process-perspective (2), both (3); attributes perspective (4), else (5)
Perspective: Else
Please specify if other perspective
Open text, 99 = missing by design, missing because it does not make sense
Perspective
Specify which perspective mentioned if 1 in perspective: Else
Open text
Data attributes
Open text
Open text
Base framework?
Does the concept refer to a baseline concept? Only when they explicitly say that they took XX as reference
1 = TSE, 2 = other, 0 = NOTHING/missing
Granularity
Level of granuality/specificity of the framework; low—brings up data quality dimensions and ideas only in an implicit broad way, (theoretical concept paper (no 1:1 matching possible, low # categories, no subdimensions)) high—super granular framework which let’s nothing unexplained.
1 = low
2 = high
Casestudy?
Does the framework include a case study?
1 = yes, 0 = no
Name_Framework
How is the framework called in the paper?
Open text: e.g., ASPIRE, TSE, …, 99 = missing by design, missing because it does not make sense
Visualization?
Graphical/Tabular GENERIC representation of the framework; is there a graphic which shows how their thoughts are organized.
1 = yes, 0 = no
Repr open text
Open text representation errors; anything they write and you want to copy from the text on the representation dimension where we can draw on later on to create more categories.
Open text, 99 = missing by design, missing because it does not make sense
Repr coverage
Deals with Data Quality Dimension (DQD): COVERAGE ERROR; the sampling frame/platform does not build up the sample we want to draw inference for. Too many/few cases in the frame, i.e., frame errors arising when constructing/using the sampling frame, includes the inclusion of non-population members (overcoverage), exclusions of population members (undercoverage), and duplication of population members. First sampling stage when the sampling population does not match the target population: Evidence on German population but Twitter sample, statement on elderly people, but ESS people which excludes institutional populations as nursing homes.
1 = yes, 0 = no, 99 = missing by design, missing because it does not make sense
Name_Coverage
How this paper named the idea of COVERAGE ERROR; term they refer to which comes closest to our idea
Open text, 0 = no, 99 = missing by design, missing because it does not make sense
Repr sampling
Deals with Data Quality Dimension (DQD): SAMPLING ERROR; the final sample does not build up the sampling frame anymore. E.g., specific hashtags clusters, accessibility, and panel mortality
1 = yes, 99 = missing by design, missing because it does not make sense
Name_Sampling
How this paper named the idea of SAMPLING ERROR; term they refer to which comes closest to our idea
Open text, 99 = missing by design, missing because it does not make sense
Repr nonresp
Deals with Data Quality Dimension (DQD): NONRESPONSE ERROR: Nonresponse error (unit+item); nonresponse error (nonresponse) encompasses both unit and item nonresponse.
1 = yes, 0 = no, 99 = missing by design, missing because it does not make sense
Nonresponse occurs when a sampled unit does not respond at all or in specific items.
Name_Nonresponse
How this paper named the idea of NONRESPONSE ERROR; term they refer to which comes closest to our idea
Open text, 99 = missing by design, missing because it does not make sense
Else_Repr
Potential other dimension addressing representation; what other error sources are missing and do we need which target on representation issues.
Open text, 99 = missing by design, missing because it does not make sense 95 = don’t know
Dummy_Repr
Dimension(s) addressing representation included?
1 = yes, 0 = no
Type_Repr
Specify which dimension(s) mentioned if 1 in DUMMY_REPR
Open text
Meas open text
Open text measurement errors
Open text, 99 = missing by design, missing because it does not make sense
Meas content validity
Deals with Data Quality Dimension (DQD): CONTENT VALIDITY ERROR; error arises when the observed variable, y, differs from the desired construct, x—i.e., the construct that data analysts and other users prefer. When the construct they want to research is different from the variable/possibilities what data they can collect.
1 = yes, 0 = no, 99 = missing by design, missing because it does not make sense
Name_Validity
How this paper named the idea of (CONTENT) VALIDITY; term they refer to which comes closest to our idea
Open text, 0 = no, 99 = missing by design, missing because it does not make sense
Meas response
Deals with Data Quality Dimension (DQD): MEASUREMENT ERROR RESPONSE; measurement error is a departure from the true value of the measurement. This occurs in the stage when collection the response and it is also named as response bias. The source lies here in the response itself. Examples would include misreporting, question order effects, social desirability, a certain platform jargon, typo in tweets. They can occur intended or unintended.
1 = yes, 0 = no, 99 = missing by design, missing because it does not make sense
Name_Response
How this paper named the idea of MEASUREMENT ERROR RESPONSE; term they refer to which comes closest to our idea
Open text, 99 = missing by design, missing because it does not make sense
Meas platform
Deals with Data Quality Dimension (DQD): MEASUREMENT ERROR PLATFORM TECHNICAL CONSIDERATIONS; measurement error is a departure from the true value of the measurement. It will occur because it is not possible to collect the true value, e.g., due to plattform restrictions (character limit), space limit for open question, typo in survey question, “mode of data collection,” and issues due to the instrument order effects.
1 = yes, 0 = no, 99 = missing by design, missing because it does not make sense
Name_Platform
How this paper named the idea of MEASUREMENT ERROR PLATFFORM TECHNICAL CONSIDERATIONS; term they refer to which comes closest to our idea
Open text, 0 = no, 99 = missing by design, missing because it does not make sense
Meas processing
Deals with Data Quality Dimension (DQD): DATA PROCESSING ERROR; includes errors in editing, data entry, coding, computation of weights, and tabulation of data. All kinds of error which occur between the actual measurement and the edited response. Adjustments, weighting, x, y, z. This edited response would then directly be involved in the analysis.
1 = yes, 99 = missing by design, missing because it does not make sense
Name_Processing
How this paper named the idea of PROCESSING ERROR; term they refer to which comes closest to our idea
Open text, 99 = missing by design, missing because it does not make sense
Else_Meas
Potential other dimension addressing measurement errors; what other error sources are missing and do we need which target on measurement issues.
Open text, 99 = missing by design, missing because it does not make sense, 95 = don’t know
Dummy_Meas
Dimension(s) addressing measurement error included?
1 = yes, 0 = no
Type_Meas
Specify which dimension(s) mentioned if 1 in DUMMY_MEAS
Open text
Mod open text
Open text remaining errors; anything authors write and we want to copy from the text on the other dimensions where we can draw on later on to create more categories clusters.
Open text, 0 = no, 99 = missing by design, missing because it does not make sense
Mod modelling
Deals with Data Quality Dimension (DQD): MODELLING ERROR (modelling/estimation error); modelling/estimation error (model = estimation) combines the error arising from fitting models for various purposes such as imputation, derivation of new variables, adjusting data values or estimates to conform to benchmarks, and so on.
1 = yes, 0 = no, 99 = missing by design, missing because it does not make sense
Name_Modelling
How this paper named the idea of MODELLING ERROR; term they refer to which comes closest to our idea
Open text, 0 = no, 99 = missing by design, missing because it does not make sense
Else_Mod
Potential other dimension addressing remaining errors
Open text, 99 = missing by design, missing because it does not make sense
Dummy_Mod
Dimension(s) addressing modelling error included?
1 = yes, 0 = no
Type_Mod
Specify which dimension(s) mentioned if 1 in DUMMY_MOD
Open text
Error open text
When there is no ME and RE perspective included at all. Further information that could not be addressed in other variables.
Open text, 99 = missing by design, missing because it does not make sense, 95 = don’t know
Coder
Coder
Open text
References for the Publications Included in the Decision Tree.
Data type
Perspective
Granularity
Authors
Title
Untargeted
Intrinsic
Specific
Amaya et al. (2020)
Total Error in a Big Data World: Adapting the TSE Framework to Big Data
Untargeted
Intrinsic
Specific
Olteanu et al. (2019)
Social Data: Biases, Methodological Pitfalls, and Ethical Boundaries
Untargeted
Intrinsic
Specific
US EPA (2000)
Guidance for Data Quality Assessment: Practical Methods for Data Analysis
Untargeted
Intrinsic
Specific
Biemer (2020)
Data Quality and Inference Errors
Untargeted
Intrinsic
Specific
Analysis of Deficiencies of Data Quality Dimensions
Untargeted
Intrinsic
General
Feng et al. (2018)
Research on the Technology of Data Cleaning in Big Data
Untargeted
Intrinsic
General
Brown and Anderson (2022)
A Methodology for Preprocessing Structured Big Data in the Behavioral Sciences
Untargeted
Extrinsic
Specific
Juddoo (2015)
Overview of Data Quality Challenges in the Context of Big Data
Untargeted
Extrinsic
Specific
Analysis of Deficiencies of Data Quality Dimensions
Untargeted
Extrinsic
Specific
Batini et al. (2009)
Methodologies for Data Quality Assessment and Improvement
Untargeted
Extrinsic
Specific
Batini et al. (2008)
A Comprehensive Data Quality Methodology for Web and Structured Data
Untargeted
Extrinsic
General
Ijab et al. (2019)
Conceptualizing Big Data Quality Framework from a Systematic Literature Review Perspective
Untargeted
Extrinsic
General
Merino et al. (2016)
A Data Quality in Use model for Big Data
Untargeted
Extrinsic
General
Brackstone (1999)
Managing Data Quality in a Statistical Agency
Untargeted
Extrinsic
General
Radhakrishna et al. (2012)
Ensuring Data Quality in Extension Research and Evaluation Studies
Untargeted
Extrinsic
General
Bergdahl et al. (2007)
Handbook on Data Quality Assessment Methods and Tools
Untargeted
Extrinsic
General
Eurostat (2019)
Quality Assurance Framework of the European Statistical System, Version 1.1.
Untargeted
Extrinsic
General
Brown and Anderson (2022)
A Methodology for Preprocessing Structured Big Data in the Behavioral Sciences
Web and (social) media
Intrinsic
Specific
Sen et al. (2021)
A Total Error Framework for Digital Traces of Human Behavior on Online Platforms
Web and (social) media
Intrinsic
Specific
Staegemann et al. (2021)
Challenges in Data Acquisition and Management in Big Data Environments
Web and (social) media
Intrinsic
Specific
Emamjome et al. (2013)
Information Quality in Social Media: A Conceptual Model
Web and (social) media
Intrinsic
Specific
Hurtado Bodell et al. (2022)
From Documents to Data: A Framework for Total Corpus Quality
Web and (social) media
Intrinsic
Specific
Hovy and Prabhumoye (2021)
Five Sources of Bias in Natural Language
Web and (social) media
Intrinsic
General
Hsieh and Murphy (2017)
Total Twitter Error: Decomposing Public Opinion Measurement on Twitter from a Total Survey Error Perspective
Web and (social) media
Intrinsic
General
Lynn et al. (2015)
Towards a General Research Framework for Social Media Research Using Big Data
Web and (social) media
Intrinsic
General
Tufekci (2014)
Big Questions for Social Media Big Data: Representativeness, Validity and Other Methodological Pitfalls
Web and (social) media
Intrinsic
General
Schmitz and Riebling (2022)
Data Quality of Digital Process Data: A Generalized Framework and Simulation/Post-Hoc Identification Strategy
Web and (social) media
Extrinsic
Specific
Staegemann et al. (2021)
Challenges in Data Acquisition and Management in Big Data Environments
Web and (social) media
Extrinsic
Specific
Emamjome et al. (2013)
Information Quality in Social Media: A Conceptual Model
Web and (social) media
Extrinsic
Specific
Team (2014)
A Suggested Framework for the Quality of Big Data
Web and (social) media
Extrinsic
Specific
Batini et al. (2015)
From Data Quality to Big Data Quality
Web and (social) media
Extrinsic
Specific
Hurtado Bodell et al. (2022)
From Documents to Data: A Framework for Total Corpus Quality
Web and (social) media
Extrinsic
General
Agarwal & Yiliyasi (2010)
Information Quality Challenges in Social Media
Web and (social) media
Extrinsic
General
Lukyanenko et al. (2019)
Expecting the Unexpected: Effects of Data Collection Design Choices on the Quality of Crowdsourced User-Generated Content
Survey
Intrinsic
Specific
Lyberg and Weisberg (2016)
Total survey error: A paradigm for survey methodology
Survey
Intrinsic
Specific
Biemer (2010)
Total Survey Error: Design, Implementation, and Evaluation
Survey
Intrinsic
Specific
Weisberg (2018)
Total Survey Error
Survey
Intrinsic
Specific
Graeff and Baur (2020)
Digital Data, Administrative Data, and Survey Compared: Updating the Classical Toolbox for Assessing Data Quality of Big Data, Exemplified by the Generation of Corruption Data
Survey
Intrinsic
Specific
Moore et al. (2021)
Data Quality Assurance Begins Before Data Collection and Never Ends: What Marketing Researchers Absolutely Need to Remember
Survey
Intrinsic
Specific
Holtom et al. (2022)
Survey Response Rates: Trends and a Validity Assessment Framework
Survey
Intrinsic
Specific
Biemer et al. (2017)
A System for Managing the Quality of Official Statistics
Survey
Intrinsic
Specific
Laliberté et al. (2004)
Data Quality: A Comparison of IMF’s Data Quality Assessment Framework (DQAF) and Eurosta’s Quality Definition
Survey
Intrinsic
Specific
Lynn (2001)
A Quality Framework for Longitudinal Studies
Survey
Intrinsic
Specific
Smith (2011)
Refining the Total Survey Error Perspective
Survey
Intrinsic
Specific
Deming (1944)
On Errors in Surveys
Survey
Intrinsic
Specific
Groves et al. (2009)
Survey Methodology
Survey
Intrinsic
Specific
Kish (1965)
Survey Sampling
Survey
Intrinsic
Specific
Kenett and Shmueli (2016)
From Quality to Information Quality in Official Statistics
Survey
Intrinsic
Specific
Statistics Canada (2019)
Statistics Canada Quality Guidelines
Survey
Intrinsic
General
Kimberlin and Winterstein (2008)
Validity and Reliability of Measurement Instruments Used in Research
Survey
Intrinsic
General
Japec et al. (2015)
Big Data in Survey Research: AAPOR Task Force Report
Survey
Intrinsic
General
Blasius and Thiessen (2012)
Assessing the Quality of Survey Data
Survey
Intrinsic
General
Lessler and Kalsbeek (1992)
Nonsampling Error in Surveys
Survey
Extrinsic
Specific
Kenett and Shmueli (2016)
From Quality to Information Quality in Official Statistics
Survey
Extrinsic
Specific
Team (2014)
A Suggested Framework for the Quality of Big Data
Survey
Extrinsic
Specific
Statistics Canada (2019)
Statistics Canada Quality Guidelines
Survey
Extrinsic
General
Herzog et al. (2007)
What Is Data Quality and Why Should We Care?
Sensor
Intrinsic
Specific
Bosch and Revilla (2022)
When Survey Science Met Online Tracking: Presenting an Error Framework for Metered Data
Sensor
Intrinsic
General
Kimberlin and Winterstein (2008)
Validity and Reliability of Measurement Instruments Used in Research
Sensor
Extrinsic
Specific
Devillers et al. (2005)
Multidimensional Management of Geospatial Dataquality Information for Its DYNAMIC USE WITHIN GIS
Sensor
Extrinsic
Specific
Yang (2007)
Visualisation of Spatial Data Quality for Distributed GIS
Sensor
Extrinsic
Specific
Hong and Huang (2017)
Enabling Smart Data Selection Based on Data Completeness Measures: A Quality-Aware Approach
Sensor
Extrinsic
Specific
Batini et al. (2015)
From Data Quality to Big Data Quality
Sensor
Extrinsic
General
Guptill and Morrison (1995)
Elements of Spatial Data Quality
Sensor
Extrinsic
General
Micic et al. (2017)
Towards a Data Quality Framework for Heterogeneous Data
Register
Intrinsic
Specific
Baur (2009)
Measurement and Selection Bias in Longitudinal Data. A Framework for Re-Opening the Discussion on Data Quality and Generalizability of Social Bookkeeping Data
Register
Intrinsic
Specific
Daas et al. (2008)
Quality Framework for the Evaluation of Administrative Data
Register
Intrinsic
Specific
Graeff and Baur (2020)
Digital Data, Administrative Data, and Survey Compared: Updating the Classical Toolbox for Assessing Data Quality of Big Data, Exemplified by the Generation of Corruption Data
Register
Intrinsic
Specific
Biemer et al. (2014)
A System for Managing the Quality of Official Statistics
Register
Intrinsic
Specific
Laitila et al. (2011)
Quality Assessment of Administrative Data
Register
Intrinsic
Specific
Laliberté et al. (2004)
Data Quality: A Comparison of IMF’s Data Quality Assessment Framework (DQAF) and Eurosta?s Quality Definition
Register
Intrinsic
Specific
Kenett and Shmueli (2016)
From Quality to Information Quality in Official Statistics
Register
Intrinsic
General
Kimberlin and Winterstein (2008)
Validity and Reliability of Measurement Instruments Used in Research
Register
Extrinsic
Specific
Devillers et al. (2005)
Multidimensional Management of Geospatial Dataquality Information for Its Dynamic Use Within GIS
Register
Extrinsic
Specific
Yang (2007)
Visualisation of Spatial Data Quality for Distributed GIS
Register
Extrinsic
Specific
Hong and Huang (2017)
Enabling Smart Data Selection Based on Data Completeness Measures: A Quality-Aware Approach
Register
Extrinsic
Specific
Batini et al. (2015)
From Data Quality to Big Data Quality
Register
Extrinsic
Specific
Kenett and Shmueli (2016)
From Quality to Information Quality in Official Statistics
Register
Extrinsic
Specific
Team (2014)
A Suggested Framework for the Quality of Big Data
Register
Extrinsic
General
Guptill and Morrison (1995)
Elements of Spatial Data Quality
Register
Extrinsic
General
Herzog et al. (2007)
What Is Data Quality and Why Should We Care?
References for the Publications Included in the Evidence Gap Map.