
Abstract
Objective
Data-as-a-product (DaaP) treats data as a marketable asset by applying product management principles throughout the data life cycle. Despite the high value of healthcare data, poor data quality hinders the effective implementation of DaaP in the healthcare industry. Robust data quality assessment is necessary to ensure that data products meet stakeholder expectations. This study aims to develop a healthcare data quality indicator framework (HDQIF) combined with the perspective of DaaP, explore the interrelationships among various indicators within HDQIF, and apply the HDQIF in assessing healthcare data quality.
Methods
A three-staged hybrid method is adopted. A specialized HDQIF is initially constructed through grounded theory and revised by Delphi consultation. Then, the HDQIF is investigated to identify key indicators and disentangle intricate interrelationships among indicators using a Decision-making Trial and Evaluation Laboratory and Adversarial Interpretive Structure Modeling (DEMATEL-AISM) method. Afterward, the HDQIF is applied to quantitatively assessing healthcare data quality using the analytic network process and fuzzy comprehensive evaluation (ANP-FCE) approach, with a case study demonstrating the practical application of the HDQIF.
Results
The HDQIF was established with 16 unique indicators that comprehensively captured both established and new aspects of healthcare data quality. The DEMATEL-AISM analysis revealed that a four-quadrant influential relation map categorized 16 indicators to identify crucial ones and a nine-level topological hierarchical structure model hierarchized 16 indicators to disentangle interrelationships among indicators. The application of the ANP-FCE approach validated the framework's capacity to quantitatively assess healthcare data quality, with a case study confirming the practicability of HDQIF.
Conclusions
The HDQIF offers a consolidated framework to support fit-for-use understandings of healthcare data quality within the DaaP context. Our findings provide several insights for healthcare organizations to improve healthcare data quality. Future work exploring context-driven adaptations of the HDQIF to facilitate the assessment of various types of healthcare data products is needed.
Keywords
Introduction
Data-as-a-product (DaaP) is a methodology where data are managed as a unique asset and treated as a marketable product by applying product management principles to the data life cycle.1,2 In the healthcare industry, both practitioners and academics increasingly regard healthcare data as an invaluable asset and product characterized as additive, non-depletive, and replicable. 3 A practical example is the UK Biobank, which not only collects and stores biological information and health data from half a million UK participants but also provides researchers with access to biomedical research data and data analysis. 4 As healthcare data originate from diverse sources and exist in various formats and states, 5 the inherent complexity of healthcare data amplifies the potential value of data. The necessity to contextualize DaaP in the healthcare industry has motivated the emergence of Healthcare-DaaP. With healthcare data accumulating rapidly, Healthcare-DaaP has spurred healthcare organizations to prioritize effective data management and leverage healthcare data to harness greater economic value by sharing or selling data.
While the priceless value of healthcare data has been widely recognized, that low-quality data impede data-driven health research and decision-making5–7 may disadvantage the effective practice of Healthcare-DaaP. Healthcare data quality is vulnerable to various issues introduced at different stages across the data life cycle, including data generation, data transformation, data reuse, and post-reuse data quality reporting. 8 Initially, healthcare data are generated from various data sources, including clinical trials, real-world studies, public health surveys, and genetic tests, 9 and stored in healthcare information technology systems. Raw data require transformation to be structured and stored in repositories. Storage infrastructures support the secure and scalable retention of data and enable reuse for downstream data analysis. Integrating data analytics unlocks data value and allows organizations to optimize operations and enhance business performance. 10 While data have been identified as a de facto asset with huge economic potential, attention should be paid to data quality issues that may compromise the utility and value realization of data.
Data quality is a multidimensional concept without a one-size-fits-all definition. 11 Wang and Strong 12 conceptualized data quality as “fit-for-use” and proposed a foundational framework that underpinned data quality studies across various fields. Inheriting and extending this viewpoint, research on healthcare data quality can be roughly categorized into two perspectives. One is the purpose-dependent perspective, where data quality informs adequate fit-for-use-ness for stakeholders to achieve predetermined goals 13 ; the other is the characteristic-dependent perspective, where data quality comprises dimensions or indicators that reflect the specific data quality requirements.14,15 Both perspectives appear to be dynamically integrated within the paradigm of DaaP, as DaaP not only prioritizes aligning data products with diverse stakeholder needs but also promotes data quality assessment to ensure that data products evolve in response to feedback from consumers and business goals. However, assessing healthcare data quality is far from trivial. One of the critical difficulties in healthcare data quality assessment concerns which indicators characterize data quality, which should be assessed, and what assessment methods are appropriate. 16
Considerable progress has been made toward a systematic framework with diverse indicators to characterize healthcare data quality, such as completeness, correctness, concordance, plausibility, and currency.5,17,18 The constructs of existing healthcare data quality frameworks can be bifurcated under the concept of “fit-for-use.” Some are object-oriented frameworks for diverse data sources such as electronic health record (EHR), electronic medical record (EMR), and wearable-device data.18–20 Indicators within these frameworks emphasize intrinsic data quality determined by inherent attributes independent of the context in which the data are used. Others are purpose oriented, designed around intended data use, such as evaluating data for secondary use, assessing data reuse for clinical research, and facilitating high-quality rare disease registries.5,18,21 In contrast to the intrinsic perspective, these frameworks highlight contextual data quality, which depends on the needs of data consumers who select and utilize data products. 22
Despite the recognized multidimensionality, inconsistencies in terminology pose challenges to applying these frameworks to assess data quality. An impetus is given to construct a new healthcare data quality indicator framework (HDQIF) that integrates prior indicators with newly emerged indicators within the context of Healthcare-DaaP to facilitate data quality assessment. Moreover, the complex nature of healthcare data gives rise to the under-exploration of the interrelationships among data quality indicators. Effective healthcare data management needs to disentangle intricate interrelationships of data quality indicators and identify critical ones. Yet limited studies have endeavored to explore these interrelationships. An emphasis on interrelationships of indicators within the HDQIF is believed to be pivotal for deriving tailored strategies for improving data quality. Overall, the study aims to address the following research questions to contribute to the existing knowledge and bridge the gap:
▪ What indicators should be included in developing the HDQIF combined with the perspective of Healthcare-DaaP? ▪ Which indicators are critical to healthcare data quality, and what are the interrelationships among all indicators within the HDQIF? ▪ How can the HDQIF be applied to assess data quality? What managerial insights for improving healthcare data quality can be derived from the HDQIF?
Methods
This study employs a hybrid methodology combining qualitative and quantitative approaches. It was conducted from September 2024 to February 2025 in Zhejiang Province, China. To address the aforementioned research objective, the study intended to construct an HDQIF that characterizes data quality with a set of indicators, to explore the indicators in their importance and interrelationships, and to apply the HDQIF to quantitatively assess data quality. Three research phases were organized into the methodology, whose full roadmap was delineated in Figure 1.

Roadmap of methodology.
Phase 1: Development of the HDQIF. Phase 1 was conducted from September 2024 to January 2025. A literature analysis initially identified existing healthcare data quality frameworks following the Preferred Reporting Items for Systematic Reviews and Meta-Analyses (PRISMA) guidelines. The grounded theory with three-staged coding of initial coding, intermediate coding, and advanced coding was performed to extract indicators for building the HDQIF. In-depth expert interviews and two rounds of Delphi consultation were launched to refine the preliminary indicators, whereby 12 local experts from two healthcare data technology companies and a certified data broker company engaged. As a result, the HDQIF was established with diverse data quality indicators.
Phase 2: Exploration of the HDQIF. Conducted in January 2025, Phase 2 purposed to identify key indicators and disentangle the interrelationships among identified indicators within HDQIF using the DEMATEL-AISM method. DEMATEL is capable of clarifying the interrelationships among factors within a system by structuring the pairwise influence. 23 To quantify the qualitative linguistic description of the term “influence,” a fuzzy linguistic scale was adopted with terms represented by triangular fuzzy numbers (TrFNs) to depict the pairwise influence relationship in DEMATEL. The AISM was applied to generate a multi-level topological hierarchical structure model where significant interrelationships among indicators were retained while the noncritical ones were eliminated.
Phase 3: Application of the HDQIF. Phase 3 applied the HDQIF to quantitatively assess healthcare data quality through a multi-criteria decision-making (MCDM) approach. MCDM can serve as a newly exploratory approach in assessing data quality by integrating multiple quality indicators and expert judgments. 24 The total influence matrix from DEMATEL defined indicator dependencies and served as input for the analytic network process (ANP) to assign weights. The fuzzy comprehensive evaluation (FCE) method combined with ANP was applied to assess healthcare data quality. A case study on Chinese healthcare big-data company ZJSMH Co., Ltd, was conducted in February 2025 to demonstrate the practical application of HDQIF.
All research procedures were approved by the Ethical Review Organization at the Management School of Hangzhou Dianzi University (approved on 2 July 2024). Written informed consent was obtained from all individual experts and professional participants involved in the three-staged research investigations. Prior to their participation, all participants were fully briefed on the research purpose and potential risks (if any) to ensure voluntary and informed involvement.
Development of the HDQIF
Extracting preliminary indicators for HDQIF
To identify existing healthcare data quality frameworks, a literature analysis was conducted following the PRISMA guidelines.
25
The databases of PubMed and Web of Science were selected for retrieval of relevant papers. The search was conducted in December 2024 and covered the timeframe from January 2012 to December 2024. The timeframe started in January 2012 because the first systematic data quality framework focusing on the healthcare setting was proposed by Weiskopf and Weng.
18
To ensure the comprehensiveness of the analysis, search terms included “indicator,” “domain,” “dimension,” and “framework.” The specific search queries were as follows:
▪ PubMed: ("data quality"[Title/Abstract] OR "data accuracy"[MeSH Terms]) AND “health*"[Title/Abstract] AND ("dimension*"[Title/Abstract] OR "domain*"[Title/Abstract] OR "indicator*"[Title/Abstract] OR "framework"[Title/Abstract]) AND 2012/01/01:2024/12/31[Date – Publication] AND “English" [Language] ▪ Web of Science: TS = ("data quality") AND AB = (health*) AND (AB = (dimension* OR domain* OR indicator* OR framework*))
A total of 2691 papers were retrieved, with 1283 from PubMed and 1408 from Web of Science. In the identification stage, 1025 duplicates (45.52%) were removed, leaving 1666 (54.48%) papers for eligibility screening. Inclusion and exclusion criteria were then applied to scrutinize titles and abstracts. Papers were included for analysis if they met the three criteria listed in Table 1. Specifically, 50 papers were excluded under criteria 1. The remaining 1616 were screened for relevance to healthcare settings based on criteria 2, by independently reviewing titles and abstracts. Among these 1616 papers, 68 were outside healthcare contexts, and 1315 lacked a data quality focus, resulting in 233 papers relevant to healthcare data quality. A final full-text screening based on criteria 3 excluded additional papers, yielding 22 papers for indicator extraction.6,13–15,17–20,26–39 Figure 2 illustrates the literature analysis process following PRISMA.

Process of literature analysis in PRISMA.
Inclusion and exclusion criteria for the literature analysis.

The grounded theory, a method commonly used in qualitative research, was used to analyze the identified 22 papers. According to the research paradigm of grounded theory, a three-staged coding of initial coding, intermediate coding, and advanced coding 40 was applied to extract indicators for developing HDQIF. The coding was performed using NVivo 15. In initial coding, two researchers (R1 and R2) extracted “labels” from the 22 data quality frameworks, including dimension terminology describing data quality and their definitions. A third researcher (R3) reviewed all labels and removed duplicates to resolve disagreement. As a result, 171 labels were generated in initial coding. During intermediate coding, all 171 labels were grouped into 74 subthemes and further consolidated into 32 major themes based on their similarities and commonalities. In classic grounded theory, the goal of advanced coding is to produce a theory grounded in the collected data with the storyline technique. However, this study did not aim to derive a theory on healthcare data quality. The objective of advanced coding was adjusted to integrate the 32 major themes into multiple preliminary data quality indicators.
As existing literature characterizes data quality in multidimensional terminology, inconsistencies were observed due to overlapping definitions and synonyms, particularly for terms of “accuracy” and “correctness.” For example, Syed et al. 15 interpreted “accuracy” as “the extent to which data reveal the truth about the event being described,” while Feder 39 referred to it as “the degree to which the value in the EHR is a true representation of the real-world value.” It was informed that ambiguous terms such as accuracy, validity, and correctness should be avoided, for they were commonly used in data quality terminology but carried wide-ranging and competing interpretations. 6 Alternative terms were considered on these indicators to reduce confusion.
Finally, three researchers independently proposed indicator categorizations and reached consensus through discussion, deriving a preliminary set of 17 indicators. Figure 3 summarizes the derivation of the 17 preliminary indicators by tracing the analytical flow through the three-staged coding. The flow starts with initial coding where 171 labels were extracted from the 22 studies. From these labels, a total of 43 distinct terms to characterize data quality were identified as a priori indicators, which were further consolidated into 28 major themes based on their similarities and commonalities. Due to space constraints, the 74 subthemes are not displayed in Figure 3. Instead, the detailed mapping between 74 subthemes and 28 major themes is documented in Supplementary Table S1.

Analytical flow for deriving the preliminary indicators.
Revising preliminary indicators with the Delphi method to establish the HDQIF
A two-round Delphi consultation was conducted to revise the 17 preliminary indicators, lasting for 6 weeks from December 2024 to January 2025. Twelve experts were engaged in the consultation, including five from ZJSMH Co., Ltd, and three from HZGPT Co., Ltd, two healthcare data technology companies; two from ZJBDE Co., Ltd, an officially certified data broker that facilitates trading of data; and two faculty members who specialize in data science and digital health from A University. The background of experts is summarized in Table 2, and the consultations were held through face-to-face and online meetings. Their experience ranged from 3 to 13 years, with an average of approximately 11.3 years. Among the 12 experts, seven were male and five were female; nine held master's degrees or higher, and four had more than 10 years of experience in the healthcare industry.
The demographic characteristics of 12 experts.

The interview topics were carefully designed to concentrate on the 17 preliminary indicators and gather expert insights on DaaP, including healthcare data governance, data quality management, and data pricing. The interviews in ZJSMH Co., Ltd; HZGPT Co., Ltd; and ZJBDE Co., Ltd lasted for appropriately 106, 125, and 73 min, respectively, with an average duration of about 101.3 min. All interviews were audio-recorded and transcribed into text for further analysis. In each interview, key viewpoints from experts were documented. All 17 preliminary indicators were evaluated by experts through anonymous questionnaires (see Supplementary Appendix SA1) distributed through Wenjuanxing, an online survey platform in China. Each indicator was scored on a 5-point Likert scale. The questionnaire consisted of three sections of expert background information, scores on indicators, and an assessment of expert authority based on decision-making and familiarity with the content. In each round of consultation, the original data were transformed into Excel and then imported into Python for further analysis. The data analysis was conducted using NumPy 41 and Pandas, 42 two third-party Python packages for original data preprocessing and numerical computation.
Results of the first-round Delphi consultation
In the first round of Delphi consultation, the experts’ familiarity Cs and the average experts’ authority coefficient Cr were recorded as 0.716 and 0.734, respectively. Both of them were greater than 0.70, which indicated a moderate level of expertise and ensured the reliability of the consultation. In Table 3, among 17 indicators, “relational conformance,” “value conformance,” and “contextualization” exhibited a coefficient of variation above 0.25, implying a low consensus. Therefore, additional feedback was collected to address these indicators.
The result of Delphi consultations.

The “value conformance” and “relational conformance” were integrated into a new indicator “metadata verification.” It is agreed by experts E8, E10, E11, and E12 that both indicators reflect the fact that data should conform to predefined constraints but differ in scope that “value conformance” refers to internal constraints (e.g. data ranges and formats), while “relational conformance” addresses external constraints embedded in physical data architecture (e.g. database or data warehouse). 6 Given their shared reliance on metadata-defined rules, both indicators were revised into distinct major themes of “metadata-driven constraint” and “architecture-driven constraint” and categorized under the indicator “metadata verification.” “Contextualization,” originally defined as the annotation of acquisition context to support interpretation, 26 was recategorized as a major theme under “interpretability” based on suggestions from experts E1, E2, and E5 who noted the similarity of “contextualization” and “interpretability” in emphasizing data applicability and task relevance.
Additionally, experts E6 and E12 proposed an indicator “scarcity,” arguing that the rarity of diseases might affect the value and sensitivity of clinical-related data. For example, while thalassemia major is locally listed as a rare disease due to extremely low prevalence, minor types of alpha- and beta-thalassemia are not. Expert E6 proposed that clinical data from rare diseases collected in real-world settings were seen as having higher clinical value. Accordingly, “scarcity” was added to the HDQIF to capture the importance of disease-specific rarity and heterogeneity.
Results of the second-round Delphi consultation
A second-round Delphi consultation was conducted after modifying the 17 preliminary indicators. The experts’ familiarity Cs and the average experts’ authority coefficient of experts Cr were 0.783 and 0.774, respectively, both higher than those in the first round. None of the 16 indicators had a coefficient of variation above 0.25. The newly added indicators “metadata verification” and “scarcity” received high mean scores greater than 4.0 and acceptable coefficients of variation. Compared with the first round, 12 indicators showed decreased coefficient of variation with notable observations on “endurability” (from 0.179 to 0.106) and “relevancy” (from 0.167 to 0.101). However, the mean score of “accessibility” and “uniqueness” declined to 3.250 and 3.083, respectively. Further feedback indicated that despite lower scores, both were still regarded as essential aspects of data quality. Therefore, “accessibility” and “uniqueness” were retained in the HDQIF. As shown in Table 4, the final HDQIF comprises 16 indicators and 29 revised major themes.
HDQIF.

Exploration of the HDQIF
Identifying key indicators within HDQIF
After organizing the 16 indicators into the HDQIF, the pairwise influence relationships among indicators are evaluated by a group of experts. The evaluated relationship is characterized in a Structural Self-Interaction Matrix (SSIM). In classic DEMATEL, experts assign binary values to indicate pairwise influence relationships in the Structural Self-Interaction Matrix (SSIM).
23
However, the relationship may be uncertain since “influence” is a linguistically vague and qualitative description. Therefore, a multi-scale fuzzy linguistic terminology is employed to depict the pairwise influence relationship for dealing with vagueness. Each term is represented by a TrFN denoted as
Linguistic terms and TrFNs assigned.
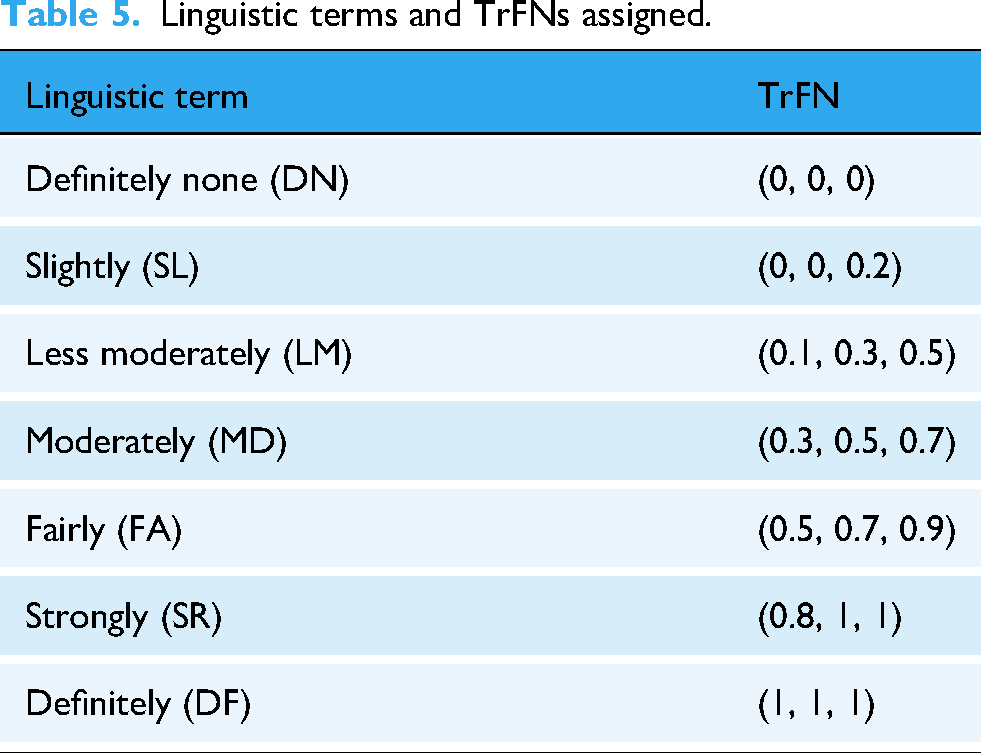
Group decision-making is employed to achieve consensus on the relationship between a pair of indicators. Expert k assigns a linguistic term to the cell ▪ CFCS step 1: Normalize each TrFN


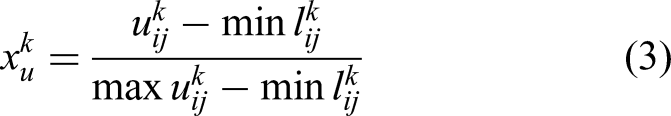
▪ CFCS step 2: Obtain left and right normalized values
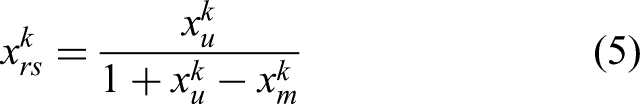
▪ CFCS step 3: Compute the total normalized crisp value

▪ CFCS step 4: Integrate the total normalized crisp value of each 


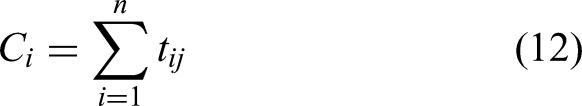
Four metrics are introduced to measure the influential extent of an indicator within HDQIF: influential degree


A questionnaire survey (see Supplementary Appendix SA2) was conducted in January 2025 to evaluate the interrelationships among 16 indicators and to obtain individual SSIM from experts. The expert group involved two big-data engineers from ZJSMH Co., Ltd (E2, E3 in Table 2); two healthcare professors from A University (E11 and E12 in Table 2); and two physicians (P1 and P2) from a local third-class hospital. Each expert assigned a linguistic term to evaluate the pairwise influence from indicators
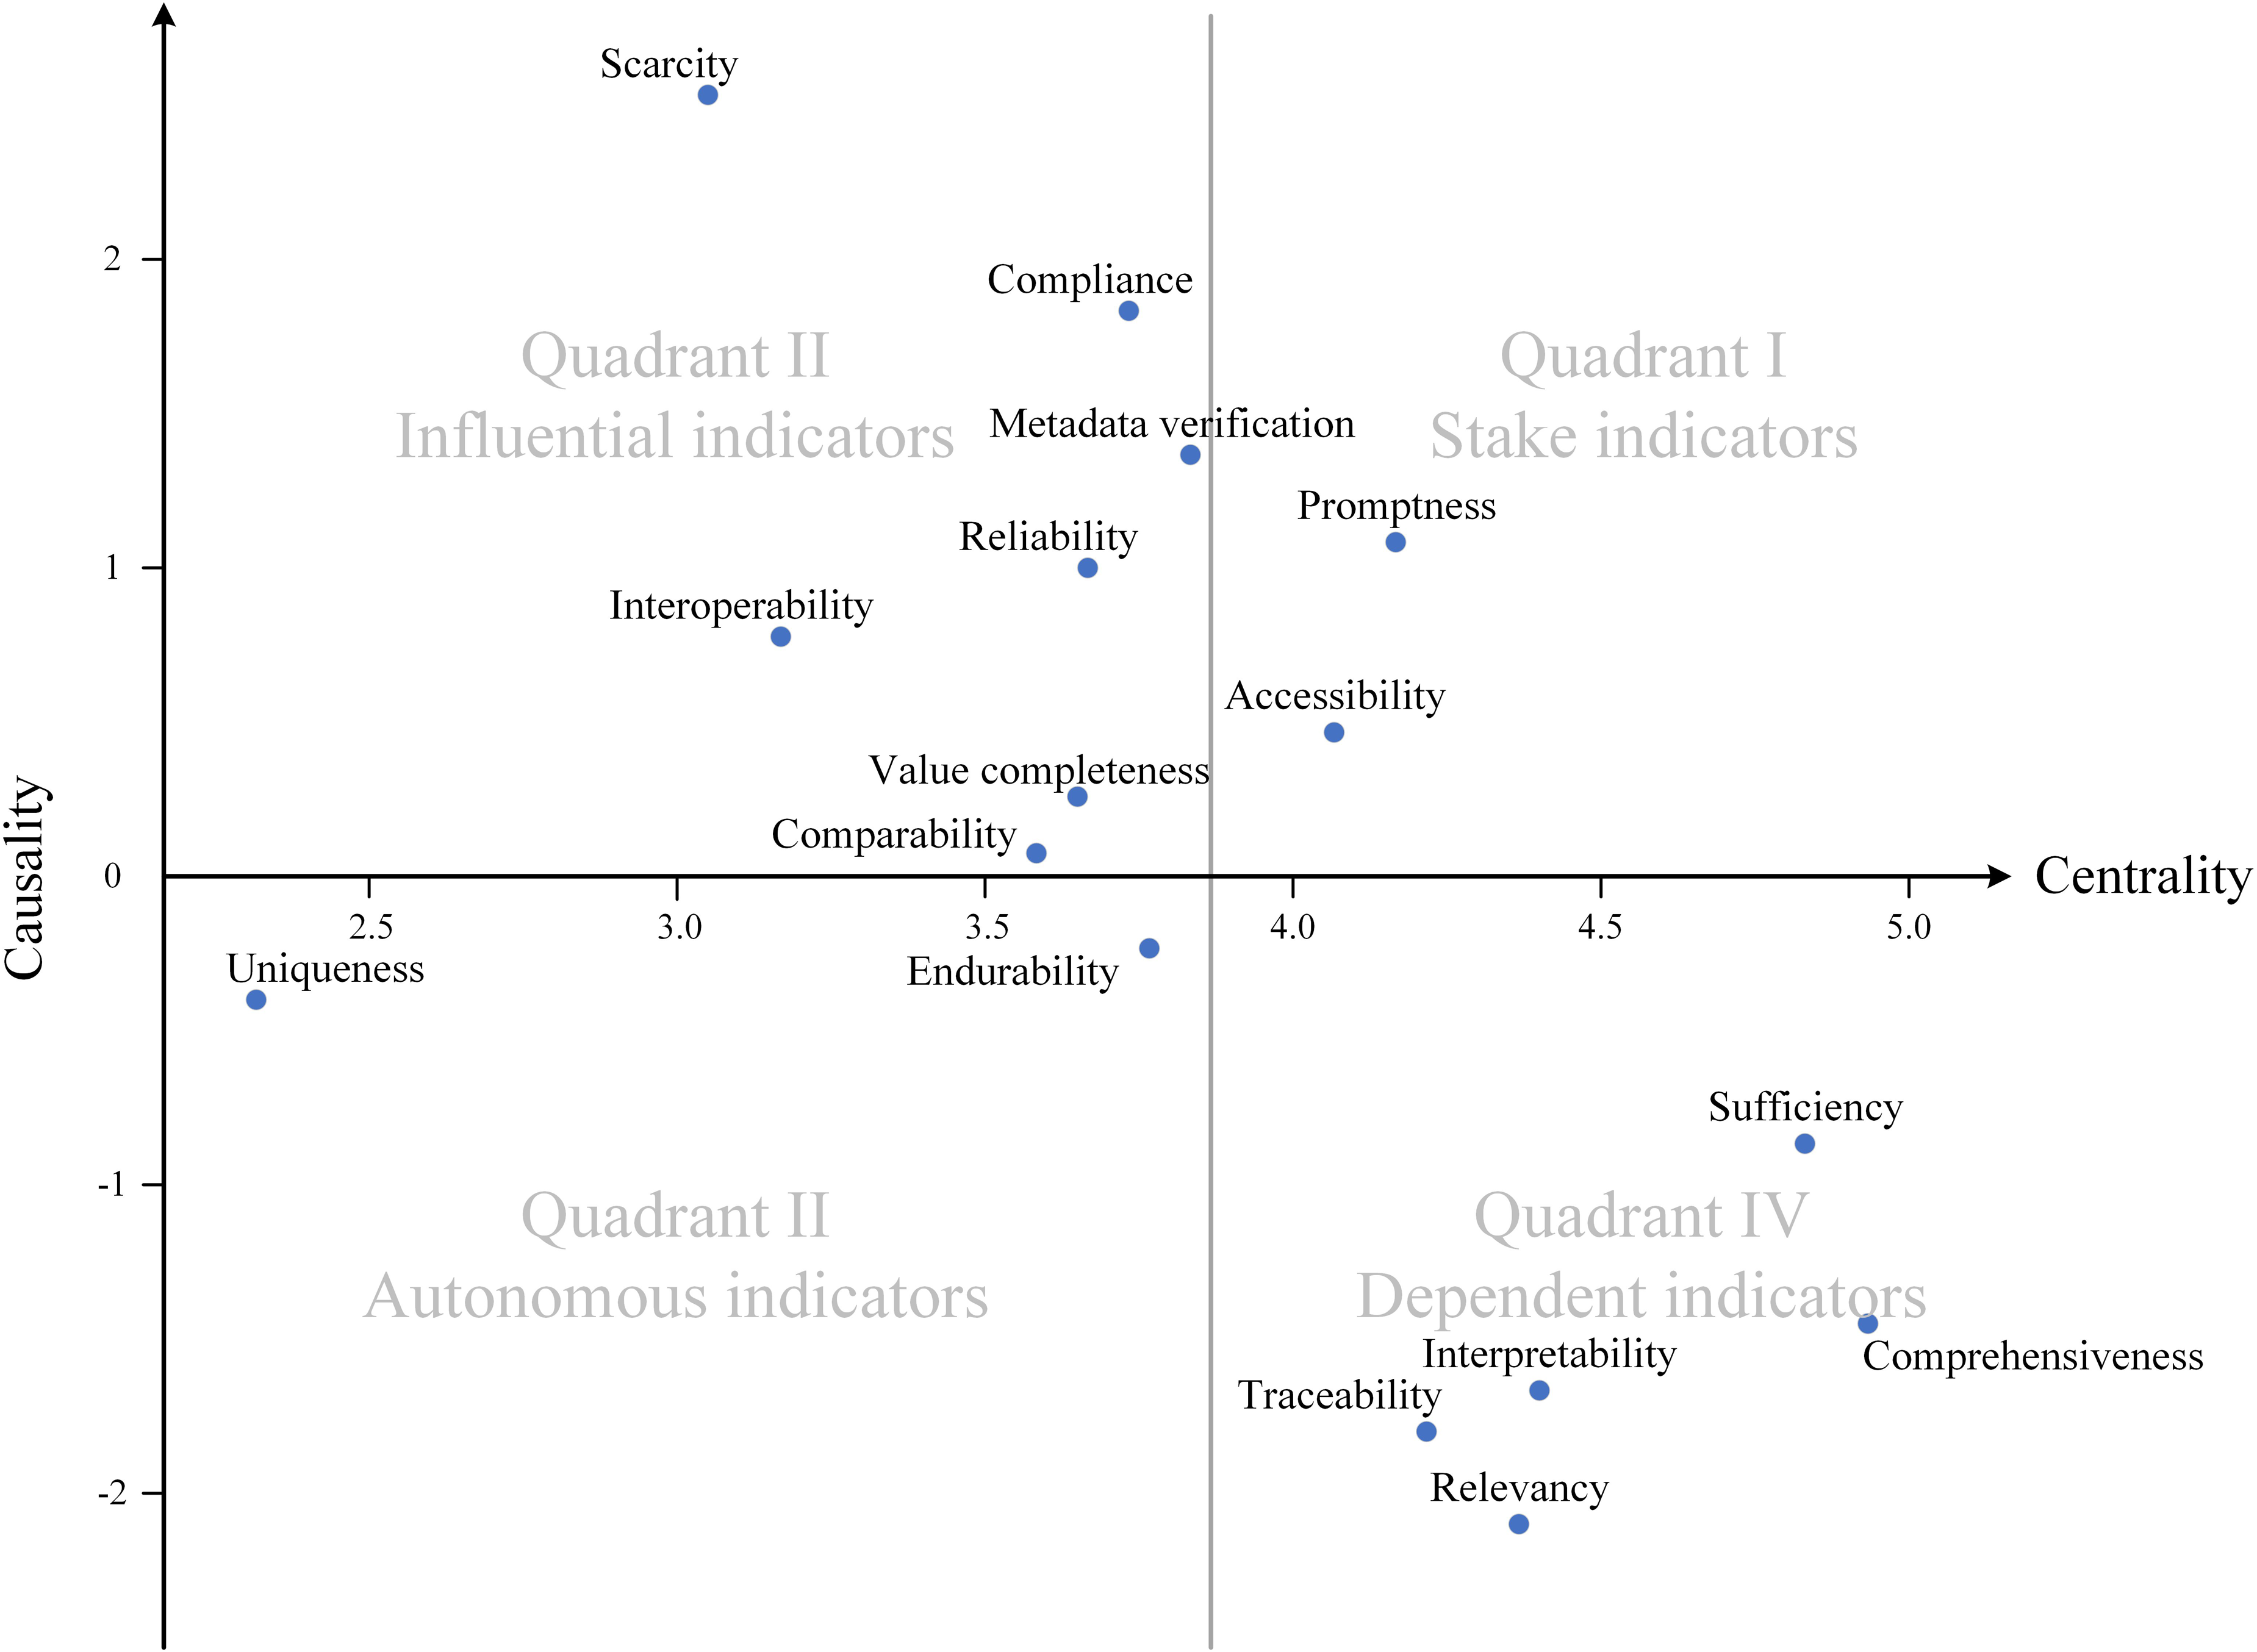
Influential relation map.
The influential relation map is categorized into four quadrants based on the mean of centrality and causality. 23 Quadrant I includes “promptness” and “accessibility” with positive causality and strong centrality. Both are denoted as stake indicators as they exert influence on other indicators and are affected by others as well. Quadrant II contains “scarcity,” “compliance,” “metadata verification,” “reliability,” “interoperability,” “value completeness,” and “comparability.” These indicators exhibiting positive causality but low centrality are identified as critical or influential indicators, as they predominantly exert influence on other indicators while remaining relatively unaffected by them. “Scarcity” exhibits the strongest causality, indicating an important indicator in the HDQIF. Indicators in Quadrants I and II should be prioritized to improve healthcare data quality, as a higher absolute causality indicates greater influence. Conversely, Quadrant III and IV include indicators with negative causality. “Uniqueness” and “endurability” located in Quadrant III are denoted as autonomous indicators due to low causality and centrality below the average. It's indicated that neither may influence other indicators nor significantly being affected by them. Quadrant IV includes dependent indicators of “sufficiency,” “comprehensiveness,” “interpretability,” “traceability,” and “relevancy,” which show a negative causality but strong centrality. Attention to these indicators is also essential for effective data quality management. Table 6 summarizes the causality, centrality, and categorization of all indicators.
Causality, centrality, category, and weight for each indicator.

Disentangling interrelationships among indicators within HDQIF
The AISM method is adopted to analyze interrelationships among HDQIF indicators. DEMATEL supports AISM by generating a total influence matrix as the basis for the reachability matrix.23,45 To better elucidate the interrelationships, AISM is modified by incorporating fuzzy theory and applying fuzzy matrix operations to derive the fuzzy reachability matrix 


A critical step is to convert the fuzzy reachability matrix 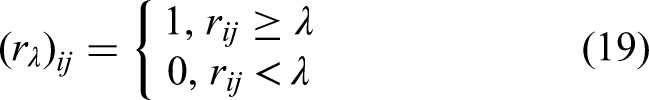
According to the fuzzy reachability matrix ▪ Threshold that yields more hierarchical levels are preferred. The number of levels exhibits a unimodal pattern with a maximum of 9 when ▪ Threshold that results in fewer connected components indicate better structural cohesion of HDQIF. Connected components reflect that the HDQIF can be divided into disjoint subsystems. The number of connected components increases gradually at first then rises sharply as the threshold increases. At ▪ Threshold with a higher number of loops. Loops indicate bidirectional feedback among indicators. For example, two loops are identified at
According to the three principles, λ = 0.14065 was selected to generate the topological hierarchical structure model, as it first reached the highest level of 9 with 2 connected components and one loop. The λ-intercepted reachability matrix
Given the 
The topological hierarchical structure model was obtained based on the general skeleton matrix and the partitioning, as illustrated in the UP-extraction diagram and the DOWN-extraction diagram of Figure 5. All indicators were arranged across levels consistent with the partitioning. Directed edges represented cause-and-effect relationships between indicators at different levels. Both diagrams had the identical number of levels. The UP-extraction diagram sequentially extracted indicators that exerted influence on others and placed them from bottom to top, while the DOWN-extraction diagram sequentially extracted indicators that were affected by others and placed them from top to bottom.

Topological hierarchical structure model diagram.
Active element and loop analysis
Active elements are indicators situated at different levels, reflecting the topological extensiveness of HDQIF. Figure 5 shows that “interoperability,” “comparability,” and “metadata verification” are identified as active elements and correspond to influential indicators in the influential relation map. Directed edges in both diagrams represent the interrelationships among indicators, while bidirectional edges indicate feedback loops. A notable loop exists between “comprehensiveness” and “sufficiency” to characterize their mutual dependence. Such loops should be treated as integrated units when designing strategies to improve healthcare data quality.
Hierarchical analysis
16 indicators are structured into a nine-level topological hierarchical structure model to delineate their interrelationships. The UP- and DOWN-extraction diagrams are largely consistent. “Uniqueness” is revealed as an isolated indicator with no connected edges, aligned with its weak centrality and near-zero causality in the influential relation map. After removing “uniqueness,” the system can be divided into three layers. The cause layer consists of the indicators at the bottom level (Level 9) including “scarcity” and “compliance.” They are only the source nodes of directed edges that hold a dominant position with significant influence on the HDQIF. The effect layer consists of “relevancy” and “traceability” located at the top level (Level 1) influenced by “interpretability.” The intermediate layer involves 11 indicators across Level 2–8 that link the cause layer and the effect layer. Intermediate-layer indicators serve as contingent coordinators that support effective and context-driven data quality improvement, due to the fact that data quality is shaped by the synergistic interrelationships among multiple indicators rather than by a few dominant ones.
Application of the HDQIF
Integrating DEMATEL and ANP enables effective indicator weighting, as DEMATEL captures total influence among indicators and simplifies ANP's computational complexity.
50
The total influence matrix T is column-normalized to obtain the weighted supermatrix W. By raising W to powers, the final weights are determined when each column supermatrix converges to a stable limit matrix. FCE is applied to assess the healthcare data quality using the HDQIF. The application steps of FCE are outlined as follows.
51
Step 1: Determining the evaluated indicator set for FCE. The evaluated indicator set Step 2: Setting up the category set for evaluating each of the indicators. The category set Step 3: Establishing the single-factor evaluation matrix. One of the tasks assigned to the experts is to establish correspondences between n indicators and m categories. The fuzzy evaluation matrix R is of the form: Each row of R is the single-factor fuzzy evaluation vector of Step 4: Producing the evaluation result. The evaluation result is produced by synthesizing the ANP-derived priority weight vector


Case study
ZJSMH Co., Ltd is a healthcare big data company in Hangzhou, China. It specializes in providing medical institutions with innovative digital healthcare tools including internet hospital, patient follow-up platforms, and remote multidisciplinary collaboration systems. By collaborating with local medical institutions, ZJSMH has accumulated diverse healthcare data resources to enhance healthcare accessibility and patient-centered care for a broader population.
In February 2025, a three-hour site visit and face-to-face interview were conducted with a professional group of five data engineers (designated as EG1-EG5), two product managers (PrD1-PrD2), and one project manager (PrJ1) from ZJSMH. Three structured datasets of type 2 diabetic patients ZA1-D, ZA2-D, and ZH-D were served as representative data products obtained from three local medical institutions ZA1, ZA2, and ZH, all of which have long-standing collaborative relationships with ZJSMH. The datasets varied in terms of their granularity, with differences in timeframe, attributes, and number of records. The intended use of these datasets was assumed to be as training sets for constructing machine learning based screening models for type 2 diabetes. Before the interview, a Data Protection and Confidentiality Protocol was signed with ZJSMH Co., Ltd Restricted temporary and on-site access to the de-identified ZA1-D, ZA2-D, and ZH-D was granted solely for healthcare data quality assessment. It was strictly ensured that no data copies were retained, and all access rights were terminated immediately upon completion of the study on the day of the site visit to ZJSMH.
At the beginning of the interview, to scrutinize the three data datasets, engineers EG2 and EG5 introduced the three datasets to allow all participants to gain an overview. Then, all participants were briefed on the HDQIF with 16 indicators. The quality of each dataset was assessed by the professional group who evaluated and scored each indicator from 0 to 100. The scoring table is provided in Supplementary Appendix SA3. Each score assigned by interviewee k generated a membership vector 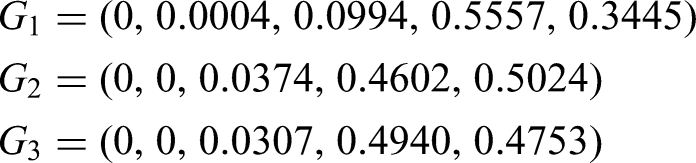
According to the maximum membership degree principle, 51 the evaluation results of ZA1-D, ZA2-D, and ZH-D are “fair,” “pretty,” and “fair,” respectively. In Supplementary Table S4, where the evaluation scores across three datasets are recorded, it is clear that ZA2-D scores higher than both ZA1-D and ZH-D on 10 out of 16 indicators, such as “relevancy,” “reliability,” and “interpretability,” which indicates adequate data quality to fulfill the fit-for-use expectations. The better performance of ZA2-D may stem from a larger data volume with 411 records and 32 clinical indicators including fasting plasma glucose, HbA1c, and fasting C-peptide. However, ZA2-D scored lower in “promptness” and “endurability,” possibly due to the temporal nature, since it was developed about three years ago and has not been continuously or regularly updated. It is suggested a trade-off between comprehensiveness and limited up-to-dateness in the quality of ZA2-D.
ZA1-D and ZH-D underperformed compared to ZA2-D. ZA1-D scored lowest on 12 out of 16 indicators, except for “promptness,” “compliance,” and “endurability.” Despite being recently collected, ZA1-D limited volume (262 records) compromises sufficiency and comprehensiveness, potentially weakening user confidence in fitness-for-use. ZH-D are presented with a close degree of membership to both “fair” and “pretty.” It performed comparably to ZA2-D on “value completeness,” “comprehensiveness,” “compliance,” “reliability,” and “scarcity.” Despite a notable gap in data quality between ZH-D and ZA2-D, ZH-D remains promising for meeting fit-for-use expectations of data consumers. Among the three diabetes datasets, ZA2-D demonstrated the highest overall data quality, followed by ZH-D and ZA1-D.
The feature of “fit for use” emphasizes that data quality should be assessed according to the intended use of the data product. It is implied that data quality assessment is inherently relative. Assigning a universal value to define “data quality” is less meaningful, as such an approach neglects the contextual requirements that determine whether a dataset is truly fit-for-use. As existing studies have largely characterized data quality qualitatively through multiple indicators, this study proposes integrating MCDM methods with the HDQIF to transform healthcare data quality assessment into a comprehensive multi-criteria evaluation problem. By treating each quality indicator as a criterion, MCDM advances the assessment from a fragmented set of 16 qualitative indicators into a unified and operational process for systematic evaluation. The case study demonstrates that using the HDQIF to assess the quality of datasets ZA1-D, ZA2-D, and ZH-D within the context of MCDM is a practical attempt. It enables data-product developers and stakeholders of ZJSMH to clearly understand both strengths and limitations of a specific healthcare dataset. HDQIF may serve as a strategic intermediate to systematically assess and monitor the healthcare data quality. As the HDQIF supports further specification of these indicators according to specific task requirements, it is possible to design explicit computational formulas for each indicator in the future according to task-oriented requirements.
Discussion
Implications of the proposed HDQIF
The proposed HDQIF systematically delineates the dimensions of healthcare data quality through 16 distinct indicators. The indicators include “comprehensiveness,” “sufficiency,” “value completeness,” “comparability,” “compliance,” “metadata verification,” “accessibility,” “interoperability,” “interpretability,” “relevancy,” “endurability,” “promptness,” “reliability,” “traceability,” “uniqueness,” and “scarcity.” The HDQIF was grounded in a systematic literature analysis and was further refined by a two-round Delphi consultation. The 22 studies span diverse scopes of data quality, including the secondary use of EHR/EMR,5,18,29,37 real-world-study data, 28 digital health, 15 clinical research,13,34 and wearable-device-generated data. 38 These scopes collectively underpin HDQIF to dedicate broader adaptability across healthcare contexts.
The HDQIF makes three contributions by harmonizing terminology, expanding indicator coverage, and operationalizing the DaaP paradigm. First, the framework harmonizes inconsistent terminologies that have fragmented prior research, where semantic overlap among terms has led to conceptual ambiguity. For instance, as shown in Figure 3, it was identified that “consistency,” “conformance,” and “concordance” were frequently highlighted but share semantic similarity. Therefore, these semantically overlapping terminologies were re-categorized into distinct major themes according to their original definitions to retain and clarify subtle conceptual differences. Supplementary Table S5 maps the HDQIF against four well-recognized frameworks6,17,18,31 and the ALCOA++ guideline proposed by the European Medicines Agency. 52 It is demonstrated that the HDQIF captures most terminology from these sources (except for “scarcity”) while offering refined definitions. Extending Weiskopf and Weng's study, 18 the HDQIF refines “plausibility” as a subtheme under “compliance” and disentangles “endurability” from “currency” to highlight that data remains up to date for task-specific use. Similarly, the multifaceted nature of “consistency”6,17,31 is further elaborated through “comparability,” “compliance,” and “metadata verification.” Furthermore, the successful alignment with ALCOA++, 52 a recognized data quality standard in clinical research, suggests that the HDQIF holds strong potential for practical application in healthcare DaaP practices.
The second contribution is that the HDQIF introduces new indicators that extend coverage to indicators of healthcare data quality that were previously neglected. Three indicators of “compliance,” “interoperability,” and “comprehensiveness” were newly conceptualized in the HDQIF. First, the term compliance is carefully selected and synthesized from two major themes of “clinical make-sense” and “formality.” In HDQIF, “compliance” is described as the processing of healthcare data that adheres to national or local standards, medical technical specifications, and clinical expert consensus. The description echoes the original notion of compliance as the extent to which patient behavior aligns with medical advice. 53 “Compliance” also aligns with the concept of “plausibility” described by Weiskopf and Weng 18 as well as “value conformance” and “atemporal plausibility” proposed by Kahn et al. 6 In healthcare context, compliance also carries security implications by stressing the adherence to relevant regulations that safeguard patient privacy and ensure data security during processing, as exemplified by Health Insurance Portability and Accountability Act (HIPAA) enacted by United States to provide a secure framework to appropriately facilitate data access and control. 54
The second is “interoperability,” referring to the capacity to exchange, access, and process healthcare data across disparate healthcare IT systems. Given the coexistence of numerous digital systems within a single facility, enabling effective communication indicates a shift from the narrower concept of data portability toward a broader interoperability. Human decision-making plays a role in achieving interoperability. A HIS engineer may be required to establish mapping between two healthcare IT systems that use incompatible data formats. Poor interoperability leads to fragmented and inaccessible medical data, which contributes to information silos and declines care quality. 3 A deliberate inclusion of interoperability as an indicator in the HDQIF deserves consideration.
“Comprehensiveness” is defined as the breadth of data that includes all desired types of data necessary for the intended task. The nuance between the terms comprehensiveness and completeness should be articulated. Completeness is characterized by “a desired proportion of available data values” that primarily focuses on data without missingness 55 ; while “comprehensiveness” highlights task-dependence to ensure that all types of data meet a desired coverage to fulfill the intended task. For example, a diagnostic model for classifying lung nodules as benign or malignant is mainly constructed based on numerous lung CT images as a dataset. Yet collecting additional relevant data alongside lung image sets, such as pathological data, clinical laboratory data, and genetic testing data, is also helpful to ensure the intended use of the model.
Building upon improving the terminology and indicator coverage, the third contribution is that the HDQIF makes the idea of DaaP truly operational. While DaaP has received growing interest in industry, it has received limited attention in academic research. Therefore, theoretically, the HDQIF takes data quality as an entry point to understand how DaaP may work in healthcare industry. DaaP consists of four care principles of Consumer-based quality, Life-cycle-oriented governance, Deliverability, and Marketability.1,2 As shown in Table 7, each principle embodies one or more of indicators from the HDQIF. It is also recognized that an individual indicator can be associated with more than one DaaP principle. For example, “metadata verification” mainly supports life cycle governance while also reflecting its relevance to deliverability. To handle this, each indicator is categorized under the principle where it plays its primary role. Such a best-fit adoption does not deny the multiple roles of indicators but provides a clear and organized way to display the connection of the DaaP's principles and the HDQIF's indicators.
Alignment of indicators with the four DaaP principles.
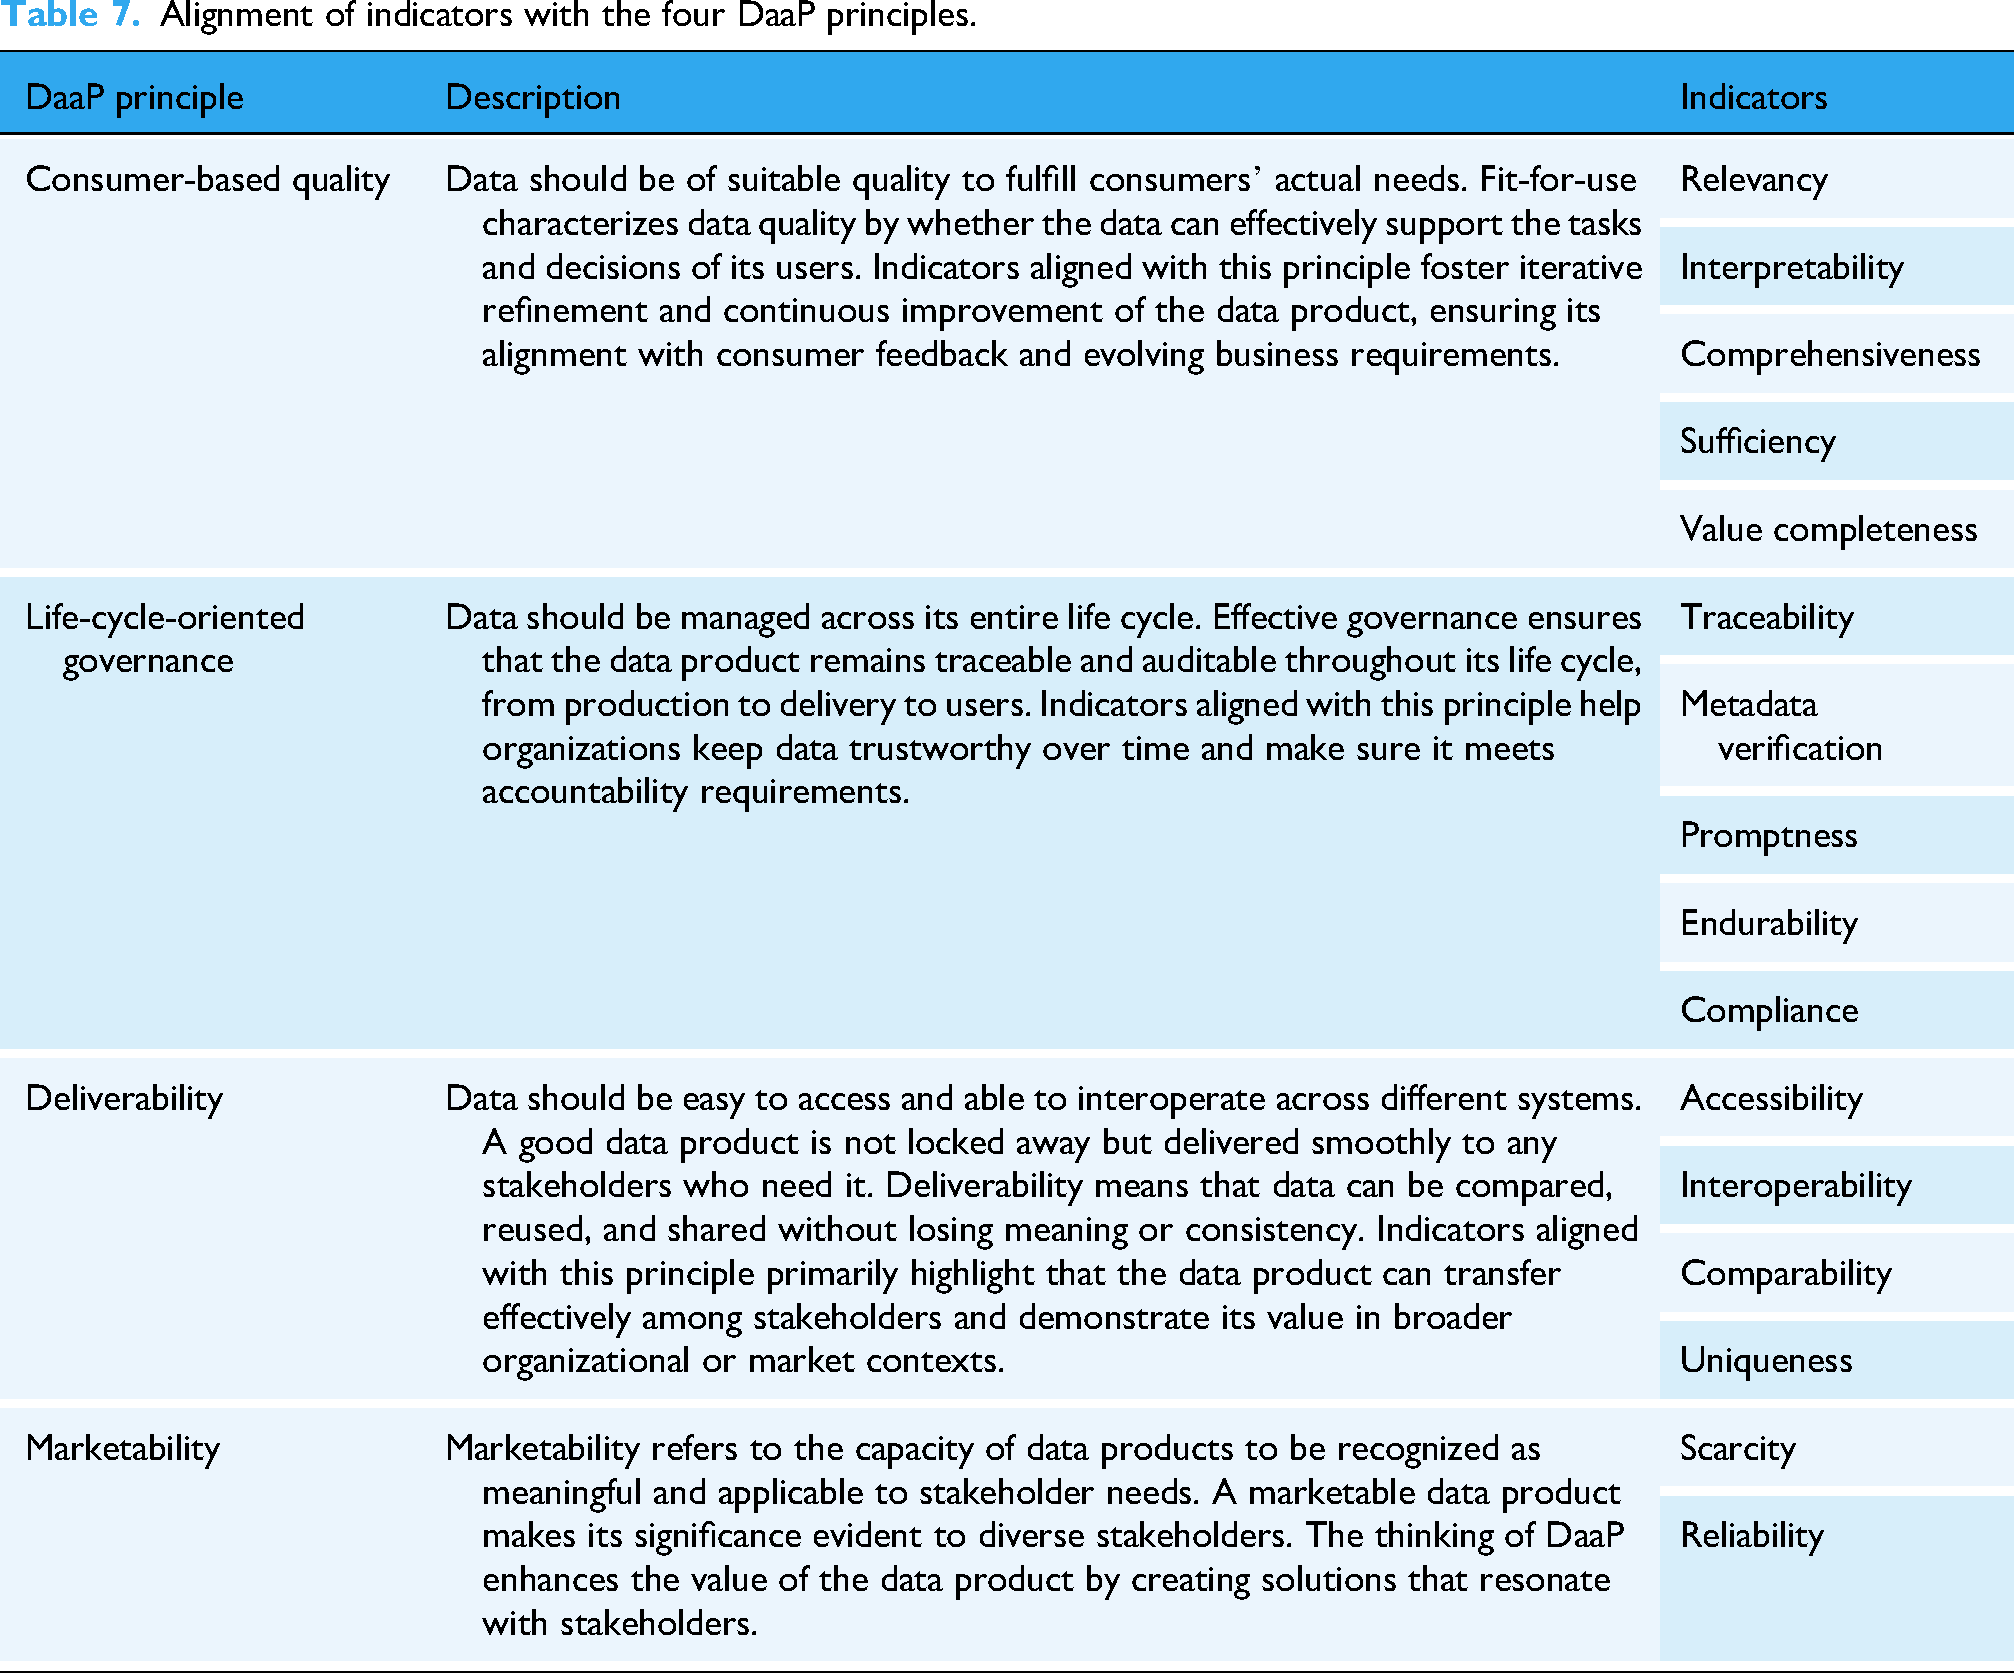
The requirement of data quality reflects the DaaP principle of consumer-based quality. In data marketplaces, the pricing of data products is driven by customers who make purchasing decisions based on their specific business objectives and preferences. 56 Although the importance of data quality has been particularly pronounced in the healthcare industry, inconsistent definitions of various data quality indicators urge clearer articulation. Given that DaaP involves diverse stakeholders such as data producers, product developers, and consumers, it is foreseeable that each of them may bring different interpretations about data quality informed by their contextual knowledge, which can result in a degradation of data quality across life cycle stages. That data quality problems may be introduced at each stage in the life cycle necessitates a full-life-cycle data quality assessment. Therefore, the requirement on continuous oversight across all life cycle stages directly echoes the principle of life-cycle-oriented governance. A consolidated HDQIF could facilitates shared understanding and coordinated quality evaluation across all stakeholders, as stressed by the DaaP principle of deliverability.
Interpretation and validation of the topological hierarchical structural model
The topological hierarchical structure model provides a theoretical foundation for elucidating interrelationships among healthcare data quality indicators, an aspect under-explored in previous healthcare data quality studies. By mapping 19 directed edges among 16 indicators, the model visualizes how these relationships can inform targeted insights for improving data quality. Validation of the interrelationships through literature supports 14 of the 19 pairs, with detailed references in Supplementary Table S6. However, the interrelationships of (1) “metadata verification” to “comparability”; (2) “interpretability” to “traceability”; (3) “scarcity” to “metadata verification”; (4) “scarcity” to “promptness” are not directly supported by existing literature.
Figure 5 positions “scarcity” as a cornerstone indicator within the HDQIF, where it is conceptualized on the rarity and heterogeneity of specific diseases. Rarer clinical cases possess greater value since such cases often provide unique insights that inform medical research. 57 However, due to scarce clinical research and variable practices, rare diseases encounter significant data quality issues, including limited interoperability, inconsistent coding, and incomplete metadata. 58 In contrast, common diseases benefit from well-established research and metadata standards. This disparity accounts for the tentative associations from “scarcity” to “metadata verification” and “promptness,” as rare disease data often lack sufficient standardization and are updated infrequently.
The relationship from “interpretability” to “traceability” remains ambiguous. Throughout the data life cycle from creation and collection to ETL processes, the importance of traceability is stressed in ensuring data quality feedback to improve data quality for stakeholders. Data should remain traceable across the life cycle to audit any changes from the initial creation to subsequent processes of all data and metadata. The requirement for traceability necessitates comprehensive annotations that facilitate accurate interpretation of data within their acquisition context. Interpretability may be considered a prerequisite for achieving traceability.
The link from “metadata verification” to “comparability” can be interpreted in the context of healthcare practice. “Metadata verification” involves architecture- and metadata-driven constraints to ensure data conforms to predefined structural and semantic standards. Even with format mappings across different healthcare IT systems, the need for unified data standards may persist due to semantic inconsistency. Meanwhile, “comparability” refers to value-level consistency across data from multiple sources, which requires alignment with a reference dataset or gold standard dataset. As healthcare IT systems expand, balancing flexible data modeling and consistent comparability becomes critical for supporting reliable clinical decisions.
Key management insights for promoting data quality
The results of the study on HDQIF provide key managerial insights for promoting healthcare data quality across organizations engaging in Healthcare-DaaP practices. Although these insights are derived from a specific organizational context, they reflect the challenges and opportunities in data quality faced by similar organizations in the healthcare industry.
A significant role of data quality assessment should be reaffirmed in the paradigm of DaaP. The case study on ZJSMH presents a practical attempt for the HDQIF to assess data quality. However, it is noteworthy that characterizing data quality through multiple indicators is merely the first step of assessing data quality. A key challenge lies in determining the appropriate method for quantitatively or qualitatively measuring each indicator. Such a difficulty is particularly pronounced in healthcare settings due to both the complexity of healthcare data and the limited expertise of stakeholders. Organizations should adopt a flexible and context-driven approach that aligns with the context-specific nature of indicators within the HDQIF.
Priority should be given to establishing a systematic mechanism that ensures the process of data complies with relevant regulations and standards. In healthcare, the security and privacy of data are undoubtedly one of the most significant issues. The concern about security makes ensuring compliance an imperative when developing or sharing healthcare data. The topological hierarchical structure model also informs such imperatives, as “compliance” is identified as a critical indicator influencing overall data quality. The evolving Healthcare-DaaP demands an adaptable compliance mechanism to help organizations proactively manage potential risks. Exemplifying early efforts in prioritizing compliance, ZJSMH Co. Ltd has explored a combined regulatory-technology approach to healthcare data governance, ensuring compliance while leveraging data accumulated through partnerships with medical institutions.
Additionally, aligning stakeholder expectations also warrants consideration. DaaP highlights the close full-life cycle collaboration among stakeholders to ensure that the data product in sufficient quality remains aligned with business objectives. However, deficient collaboration among these stakeholders at any stage of the data life cycle can lead to a mismatch of expectations on data quality. 8 Indicators such as “relevancy,” “interpretability,” and “comprehensiveness” reflect this task-dependent focus. Indeed, healthcare data can be seen as a by-product of healthcare outcomes engaged with diverse stakeholders. A close engagement among stakeholders throughout the healthcare research process requires specialized expertise on data management skills and knowledge of regulatory frameworks 59 to maintain the proper use of the data. Such interrelated dependent indicators may be influenced by stakeholder expectations and contextual understanding.
Limitations and future work
Several limitations necessitate consideration in the study. First, although the PRISMA guidelines are strictly followed to conduct a systematic literature analysis, the omission of relevant indicators not extensively covered in prior studies still exists. Some indicators may have been excluded due to database scope and search strategy limitations. Further studies could expand the scope of literature retrieval by incorporating additional databases and interdisciplinary sources to enrich the comprehensiveness of indicator coverage.
Second, the three-staged coding process may inevitably introduce subjective bias, as the extraction and consolidation of labels, subthemes, and themes are influenced by the perspectives and judgments of the researchers. Although the involvement of three independent researchers in the coding process enhanced reliability relative to a single researcher, subjective bias nevertheless remains objectively present. Further work could involve more researchers in the coding process and explore the use of large language model (LLM) to achieve semi-automated grounded theory coding. For example, a specific LLM like GPT could act as a third researcher working alongside human coders to conduct literature three-staged coding. The outputs generated by the LLM could then be compared with those produced by human researchers to analyze similarities and differences across coding results.
Third, the limitation of the Delphi consultation should be acknowledged. The study invited 12 experts with substantial professional backgrounds to participate in the Delphi consultation, and their expertise ensured that deficiencies during the construction of the HDQIF were effectively identified. However, the relatively small number of participants may constrain the representativeness and comprehensiveness of the results. Future research could expand the panel size and diversify expert backgrounds across disciplines and regions to enhance to ensure greater credibility and comprehensiveness of the HDQIF.
Lastly, the case study was limited to three dataset-type products provided by a single company. While this design illustrates the practical applicability of the HDQIF in a real-world context, the absence of comparative analysis with data products from other companies restricts the generalizability of the framework. Moreover, due to privacy and security concerns, the datasets used in this study were accessible only within the company and could not be disclosed. Variations in data product types, such as data services or data algorithms, may lead to divergent evaluation outcomes across institutions.
Conclusion
This study proposes a DaaP-oriented HDQIF with 16 indicators to characterize healthcare data quality. Indicators are categorized in a 4-quadrant influential relation map according to two metrics of causality and centrality by DEMATEL. The interrelationships among 16 indicators are disentangled and visualized in a nine-level topological hierarchical structure model using the AISM method. The application of HDQIF in the case study demonstrates a feasible pathway to quantitatively assess healthcare data quality in the view of MCDM. Significant implications in theory and practice are highlighted. Theoretically, the HDQIF advances the understanding of healthcare data quality within the Healthcare-DaaP context by integrating multi-dimensional indicators and clarifying ambiguous terminology. Our study resonates with the forward-looking focus on data-driven initiatives in the healthcare industry, such as valuation, pricing, and assetization of healthcare data. Practically, the HDQIF supports integration into cost-, market-, and revenue-based valuation methods to quantify the monetary value of healthcare data, offering actionable insights for monetizing healthcare data in data marketplaces. Future research may expand the HDQIF by contextualizing diverse healthcare settings to capture a broader range of data quality indicators.
Supplemental Material
sj-docx-1-dhj-10.1177_20552076261427506 - Supplemental material for Development and application of a healthcare data quality indicator framework from the perspective of data-as-a-product
Supplemental material, sj-docx-1-dhj-10.1177_20552076261427506 for Development and application of a healthcare data quality indicator framework from the perspective of data-as-a-product by Min Cai, Xijie Huang, Yijie Cao, Xuan Shao and Xueqi Xu in DIGITAL HEALTH
Supplemental Material
sj-docx-2-dhj-10.1177_20552076261427506 - Supplemental material for Development and application of a healthcare data quality indicator framework from the perspective of data-as-a-product
Supplemental material, sj-docx-2-dhj-10.1177_20552076261427506 for Development and application of a healthcare data quality indicator framework from the perspective of data-as-a-product by Min Cai, Xijie Huang, Yijie Cao, Xuan Shao and Xueqi Xu in DIGITAL HEALTH
Supplemental Material
sj-docx-4-dhj-10.1177_20552076261427506 - Supplemental material for Development and application of a healthcare data quality indicator framework from the perspective of data-as-a-product
Supplemental material, sj-docx-4-dhj-10.1177_20552076261427506 for Development and application of a healthcare data quality indicator framework from the perspective of data-as-a-product by Min Cai, Xijie Huang, Yijie Cao, Xuan Shao and Xueqi Xu in DIGITAL HEALTH
Footnotes
Acknowledgements
The authors would like to thank part of members from ZJSMH Co., Ltd, ZJBDE Co., Ltd, and HZGPT Co., Ltd for their engagement in our consultation. Their valuable and professional insights on assetization and commodification of healthcare data have greatly contributed to our study. The authors would like to thank the editor and the anonymous reviewers for their insightful comments and suggestions as well.
Author contributions
Min Cai: conceptualization, methodology, supervision, project administration, writing‒review and editing, and funding acquisition.
Xijie Huang: conceptualization, methodology, software, formal analysis, data curation, visualization, writing‒original draft and writing‒review and editing.
Yijie Cao: conceptualization and resources.
Xuan Shao: software and formal analysis.
Xueqi Xu: conceptualization, methodology, and writing‒review and editing.
Funding
The authors disclosed receipt of the following financial support for the research, authorship, and/or publication of this article: This work was supported by the Zhejiang Provincial Philosophy and Social Science Planning Project, Humanities and Social Science Project of Ministry of Education of China (grant number 23SYS11ZD, 24YJA630002).
Declaration of conflicting interests
The authors declared no potential conflicts of interest with respect to the research, authorship, and/or publication of this article.
Supplemental material
Supplemental material for this article is available online.
References
Supplementary Material
Please find the following supplemental material available below.
For Open Access articles published under a Creative Commons License, all supplemental material carries the same license as the article it is associated with.
For non-Open Access articles published, all supplemental material carries a non-exclusive license, and permission requests for re-use of supplemental material or any part of supplemental material shall be sent directly to the copyright owner as specified in the copyright notice associated with the article.