
Abstract
We propose a simple yet comprehensive conceptual framework for the identification of different sources of error in research with digital behavioural data. We use our framework to map potential sources of error in 25 years of research on reputation effects in peer-to-peer online market platforms. Using a meta-dataset comprising 346 effect sizes extracted from 109 articles, we apply meta-dominance analysis to quantify the relative importance of different error components. Our results indicate that 85% of explained effect size heterogeneity can be attributed to the measurement process, which comprises the choice of platform, data collection mode, construct operationalisation and variable transformation. Error components attributable to the sampling process or publication bias capture relatively small parts of the explained effect size heterogeneity. This approach reveals at which stages of the research process researcher decisions may affect data quality most. This approach can be used to identify potential sources of error in established strands of research beyond the literature of behavioural data from online platforms.
Keywords
Introduction
Digital behavioural data (DBD) is increasingly used to address social science research questions and is regarded as an emerging field (Box-Steffensmeier et al., 2022). Depending on the discipline, terms such as ‘digital trace data’, ‘process-produced data’, or ‘big data’ are used. DBD denotes large amounts of data generated unobtrusively as a side product of individuals’ actions and interactions in online environments and as part of business and administrative processes (Lazer & Radford, 2017). Although most DBD is generated for other than scientific purposes, it comes with some advantages over data from traditional sources (e.g. survey data). Automatically collected DBD allows for larger sample sizes and, therefore, may increase statistical conclusion validity due to higher statistical power (Shadish et al., 2002: 45). In some instances, external validity may also be increased by more systematic and, therefore, representative sampling of cases (Groves et al., 2009; Sen et al., 2021). However, more data in terms of observations and variables does not solve all validity problems traditional data collection methods face. External validity can be threatened if specific observations are systematically oversampled (Hargittai, 2020; Morstatter et al., 2013). Moreover, issues with internal validity – that is, factors that may confound the measured effect of the treatment on the outcome – are often not addressed in analyses of DBD. These challenges call for the establishment of scientifically grounded criteria for the assessment of the quality of DBD.
Here we put forward a tool for the conceptual and quantitative assessment of the quality of DBD. To this end, we first develop a conceptual framework that allows us to map potential sources of error in DBD. Our framework builds on the Total Survey Error (TSE) framework proposed by Groves and colleagues (2009) and extensions of the TSE to DBD (e.g. Amaya et al., 2020; Sen et al., 2021). We call our framework the Total Error Framework for Digital Behavioural Data (TEF-DBD) and argue that it overcomes limitations of previous approaches by clearly distinguishing between error components attributable to the measurement and sampling processes. Second, we apply TEF-DBD to map potential sources of error in empirical research on the relation between online traders’ reputations and these traders’ market performance (so-called reputation effects) in peer-to-peer (P2P) online markets (Przepiorka, 2023). Third, we rely on a meta-analytical dataset comprising information on around 200 unique DBD datasets from 25 years of research on reputation effects in P2P online markets to quantify the relative importance of different sources of error. We do this by means of what we call meta-dominance analysis, which applies dominance analysis (Azen & Budescu, 2006; Budescu, 1993) on meta-analytic variables such as effect sizes and study and dataset characteristics.
Our first objective is to identify the impact of sample size, that is, random sampling variability, on the overall effect variation or heterogeneity. This is particularly important as the large number of observations in DBD is an often claimed advantage (cp. the classical ‘volume’ criteria) (although see Kaplan et al., 2014). In a second step, we capture potential sources of error arising from measurement and sampling (cp. Sen et al., 2021). Meta-dominance analysis allows us to split the contribution of variables associated with different error components on the overall systematic variability in effect sizes reported in different studies. This approach allows us to assess the relative impact of different error components on the total error. In our case of application, this approach allows us to quantify the impact researcher decisions can have on DBD quality at different stages of the research process when studying reputation effects by means of P2P online market transaction data.
In what follows, we first briefly review previous frameworks and outline our proposed TEF-DBD framework. We then describe the DBD from P2P online markets and show how we use our conceptual framework to map error components in these data. In the data and methods section, we describe how we implement meta-dominance analysis to quantify potential error components by means of metadata from 25 years of research on reputation effects in P2P online markets. After reporting our results, we discuss our findings and approach in light of other initiatives that aim to assess the quality of quantitative empirical research.
Assessing the Quality of DBD
Groves and colleagues (2009) popularised a quality perspective on survey research, the TSE framework, that builds on the different sources of error inherent in the life cycles of surveys (for an account of the historical evolution of the TSE framework, see Groves & Lyberg, 2010). The TSE framework identifies several sources of error emanating from two types of inference processes that researchers engage in when conducting surveys. Here, we call these two inference processes measurement and sampling (the latter was originally termed representation by Groves et al., 2009).
The measurement process refers to how theoretical constructs are defined and measured by researchers, how these measures are perceived and processed by respondents, and how researchers process the raw survey data. The measurement process determines what we can infer from survey data about the characteristics of individual respondents (e.g. an individual’s propensity to trust strangers or vote for a specific political party). The sampling process refers to the potential and actual access to individuals of a target population, the ability and willingness of these individuals to participate in a survey, and the possibility to make up for the limitations of the former in the data analysis. The sampling process determines what we can infer from survey data about the characteristics of the target population (e.g. the mean social trust level or proportion of voters of a specific political party in a given population). In both the measurement and the sampling process, different sources of error arise, affecting the extent of bias and noise in what we infer about the characteristics of individuals and target populations from survey data. While bias causes our inferences to be incorrect, noise causes our inferences to be imprecise (Kahneman et al., 2021).
With its declared focus on the quality of survey research, the TSE framework seems limited in scope when applied on research using big data. However, Amaya and colleagues (2020) have demonstrated how the building blocks of the TSE framework can be applied to assess the quality of big data and coined the term total error framework (TEF). Other researchers have engaged in similar exercises and suggested extensions to the TSE framework with the aim to assess the quality of big data and DBD for more specific data types (see, e.g. Hsieh & Murphy, 2017, for Twitter data, Hurtado Bodell et al., 2022, for text data, and Schmitz & Riebling, 2022, for process-produced data). Our aim was to conceptualise a framework that is applicable to any type of DBD.
When conceptualising our framework, one goal was to keep the measurement and sampling strains introduced in the TSE framework as strictly apart as possible. This is important because error in the selection of cases (sampling) will affect data quality differently than error in the measurement of theoretical constructs. Another goal was to keep the error terminology as close as possible to the well-established TSE framework. The strict conceptual separation of the measurement and sampling strains helped us avoid under or over specifying the error components in our framework. For example, Amaya and colleagues (2020) draw mainly on the ETL [Extract, Transform, Load] paradigm from big data. Their framework may underspecify potential error components typically arising in DBD by reducing the seven TSE dimensions to only three dimensions. Sen and colleagues (2021), in contrast, use a more fine-grained framework that may bear the risk of conceptual granularity (e.g. both augmenting and reducing errors which result in two instead of one error dimension). Furthermore both frameworks do not strictly separate the measurement and the sampling strain, which makes it more difficult to assess the specific impact of the respective errors.
Figure 1 presents the total error framework for digital behavioural data (TEF-DBD), which integrates the TSE designed for survey research (Groves et al., 2009) and ideas from previous DBD or big data frameworks (Amaya et al., 2020; Sen et al., 2021). The total error framework for digital behavioural data (TEF-DBD).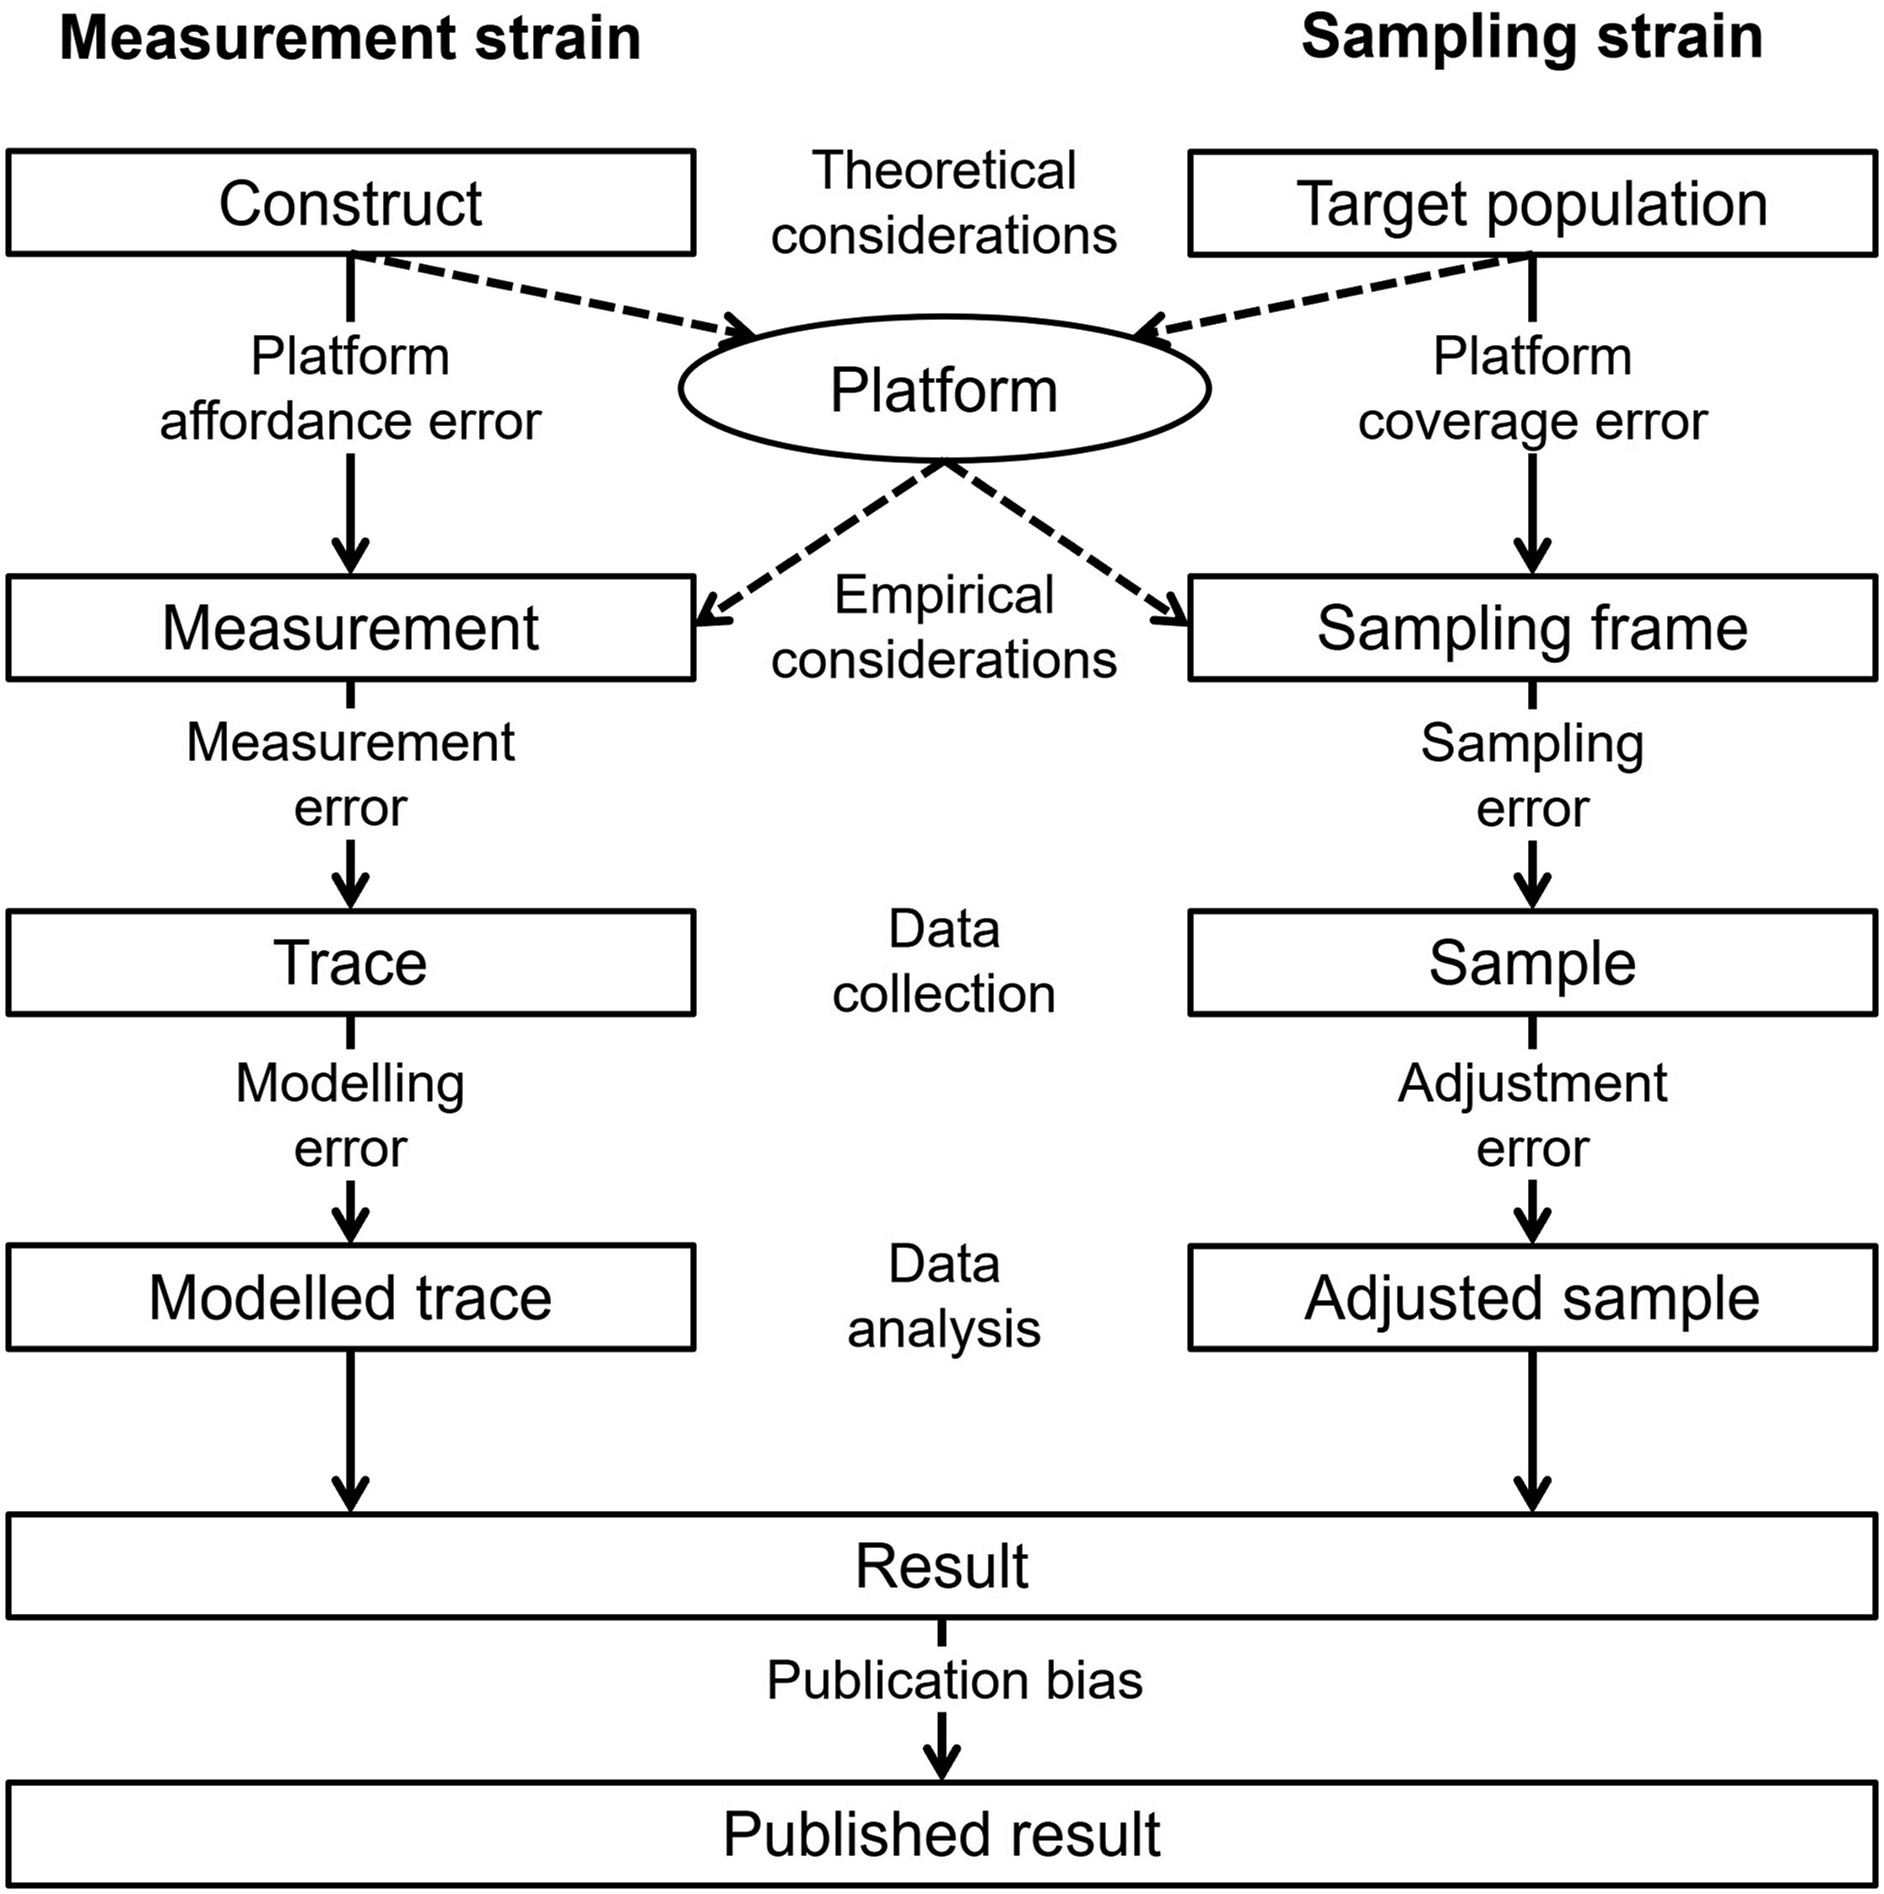
The measurement strain (Figure 1) is crucial for addressing descriptive and causal research questions. Without accurate measurement, the entity of interest (e.g. a person’s generalised trust or propensity to vote for a right-wing populist party) is measured with bias or not identified at all. The measurement strain thus encompasses the well-known concepts of construct and internal validity (Shadish et al., 2002).
The constructs of interest are defined in the theoretical conceptualisation phase, as in the TSE framework (cp. validity in Groves et al., 2009). However, the operationalisation of these theoretical constructs is – in the strict sense – not possible ex-ante using DBD. The properties of DBD are determined by the design of existing online platforms before the empirical part of the research process starts (although see Salganik et al., 2006). Similar to secondary research data, researchers are limited to available measures and cannot generally design new or improve existing measures besides using transformations (e.g. by using indices or other approaches to recover latent constructs). However, unlike secondary research data, DBD is not usually generated for research purposes but a side product of business applications focusing on increasing user traffic and revenue. Technically, the platform choice (and the possibilities in terms of query design this choice entails) mediates the measurement process offering only specific measures to researchers. If no platform provides the desired measurement or if measurements differ across platforms, platform affordance error (Sen et al., 2021) will be the result.
The empirically realised measure (i.e. trace) is obtained in the next step and can induce deviations from the conceptual measurement for two reasons. First, several different traces are supplied by platforms for the measurement of the explanatory factors and/or the outcomes of interest. Second, different methods of obtaining the data are available to researchers (e.g. direct access through the platform provider, automatic extraction via an application programming interface (API), by means of a web crawler, by-hand data collection). At this stage, researchers’ decisions on which traces to use and how to collect data can result in measurement error.
After obtaining the relevant traces, these traces may need to be modelled to better reflect the functional form of the causal relation between two variables. Modelling can entail the transformation of a trace variable (e.g. log-transformation) or the combination of several trace variables into one (e.g. formative measurement). This can result in modelling error. Modelling error must be kept distinct from adjustment error, which can result from researchers’ choice of statistical data analysis technique (see below).
Similar to the measurement strain, in the sampling strain (Figure 1), the platform choice mediates the sampling process, offering access to target populations that coincide with the user base of a platform. It is important to note that non-users are, by definition, not part of the sampling frame; all platform users are part of the sampling frame. However, non-users may be of interest in as far as they are part of the target population (e.g. the general population). In this case, neglecting non-users would lead to platform coverage error (Sen et al., 2021). However, biases emerging in the sampling process are especially problematic when descriptive research questions are addressed. These questions focus on inferring a property of a target population from the research results obtained with the analysis of DBD. For causal research, representativeness is only important if inferences or generalisations to a wider population are drawn. Even if the treatment effect is expected to vary across sub-populations, representativeness is less important as long as there is sufficient variation in the data that allows for studying interactions with variables accounting for these sub-populations (Kohler et al., 2019: 158-165).
The step from a sampling frame to a realised sample differs from the survey setting in as far as researchers have comprehensive access to the DBD of interest. With comprehensive access to the DBD, issues due to nonresponse (e.g. nonresponse bias) are unlikely to arise. Unlike survey participants (and the units of analysis they represent), units of analysis in DBD do not have to be prompted to produce the measurement of interest, they merely need to be accessed. However, for DBD it is especially important to specify the units of analysis precisely. In DBD from online market platforms where transactions are the units of analyses, users that relate to more transactions (e.g. sellers selling multiple items) will be overrepresented, whereas infrequent users will be underrepresented. However, the resulting sampling error can be corrected by using weights in order to restore an independently and identically distributed sample or multilevel techniques to account for repeated observations of the same platform users. If those sampling weights and multilevel techniques are applied wrongly (e.g. clustering used on too few higher-level units), an adjustment error can be the result. The same problem applies for possible sources of unobserved heterogeneity. As DBD is observational, several other variables may confound the relationship of interest, leading to omitted variable bias (Greenland et al., 1999). To conclude, although sampling error can be prevalent in raw DBD, it can be reduced at the data analysis stage. However, if applied wrongly, the corresponding statistical data analysis techniques can produce adjustment error.
Another error dimension that affects published research findings is publication bias, that is, the selective publication of only statistically significant results (Dickersin & Min, 1993). Although publication bias becomes visible only at the level of a research strand covering multiple publications on the same topic, researchers often decide whether a result is worth publishing dependent on its statistical significance (cp. Rosenthal, 1979). As a result, publication bias may inflate the coefficients reported in the literature. Although publication bias is not a dimension of error in the TSE, we include it in the TEF-DBD as a potential source of systematic error.
DBD from P2P Online Markets
The P2P online market data that is the object of our inquiry stems from interdisciplinary research in sociology, economics, e-commerce and psychology that studies how reputation affects mutually beneficial market exchange (Przepiorka, 2023). This strand of research comprises over 125 published research articles, each using one or several of 202 unique datasets, collected since 1998, to test a variant of the following hypothesis (cp. Jiao et al., 2022): The better an online trader’s reputation, the better is this trader’s success in the online market. Hence, most research using DBD from P2P online markets addresses a causal question, focusing on identifying a causal relationship rather than a descriptive one.
The units of analysis are market transactions comprising an item, a seller and, in case of a successful transaction, a buyer. Transactions can be fixed price sales, where sellers set the prices for their items and buyers can choose to buy items at a given price, or auctions, where sellers set initial prices, potential buyers can place bids and the buyer with the highest bid obtains the item. Next, to item prices, potential buyers can consider other item and seller characteristics when deciding which item to buy from which seller at what price. Most notably, buyers are provided with information about seller reputations in terms of reputation scores (i.e. the number of positively minus the number of negatively rated transactions), the proportion of positive ratings, or the average star rating (e.g. one to five stars). An item can be simple (e.g. USB stick) or complex (e.g. mobile phone), it can be new or used, come with accessories, and involve varying shipping costs depending on the geographical location of the seller and the buyer (for a comprehensive list of potential seller and item characteristics see, e.g. Przepiorka, 2013). After a successful transaction, the buyer transfers the payable amount to the seller and the seller sends the item to the buyer. Once the transaction is completed, the buyer can rate the seller and write a feedback text to accompany the rating. In most online markets, the seller can also rate the buyer. These ratings are then aggregated and presented next to traders’ aliases on their profile or item pages. Usually, traders’ entire rating histories are also accessible.
DBD from P2P online markets has been collected by hand, by means of web-scraping, through a dedicated API provided by the market platform, or obtained directly from the market platform providers. The data cleaning and manipulation phase can involve steps such as excluding invalid cases (e.g. mere accessory items), extracting quantitative information from item titles and descriptions (e.g. item weight and quality), matching data from different sources (e.g. information from item and seller profile pages). Most importantly, researchers decide how to operationalise seller success and reputation at this stage. Although these decisions are guided by theory, they are also restricted by the information the online market platform provides. Seller success has been operationalised in terms of item prices and sales. Seller reputation has been operationalised in terms of the number of positive and negative ratings, the percentage of positive ratings, reputation scores (number of positive minus the number of negative ratings) and using various transformations of these variables (e.g. log-transformation of number of positive ratings + 1). Meta-analyses conducted by Jiao and colleagues, 2021, 2022) give a comprehensive overview of the various approaches researchers have taken to analyse transaction data from P2P online markets.
Applying TEF-DBD on DBD from P2P Online Markets
Description of TEF-DBD error Dimensions.
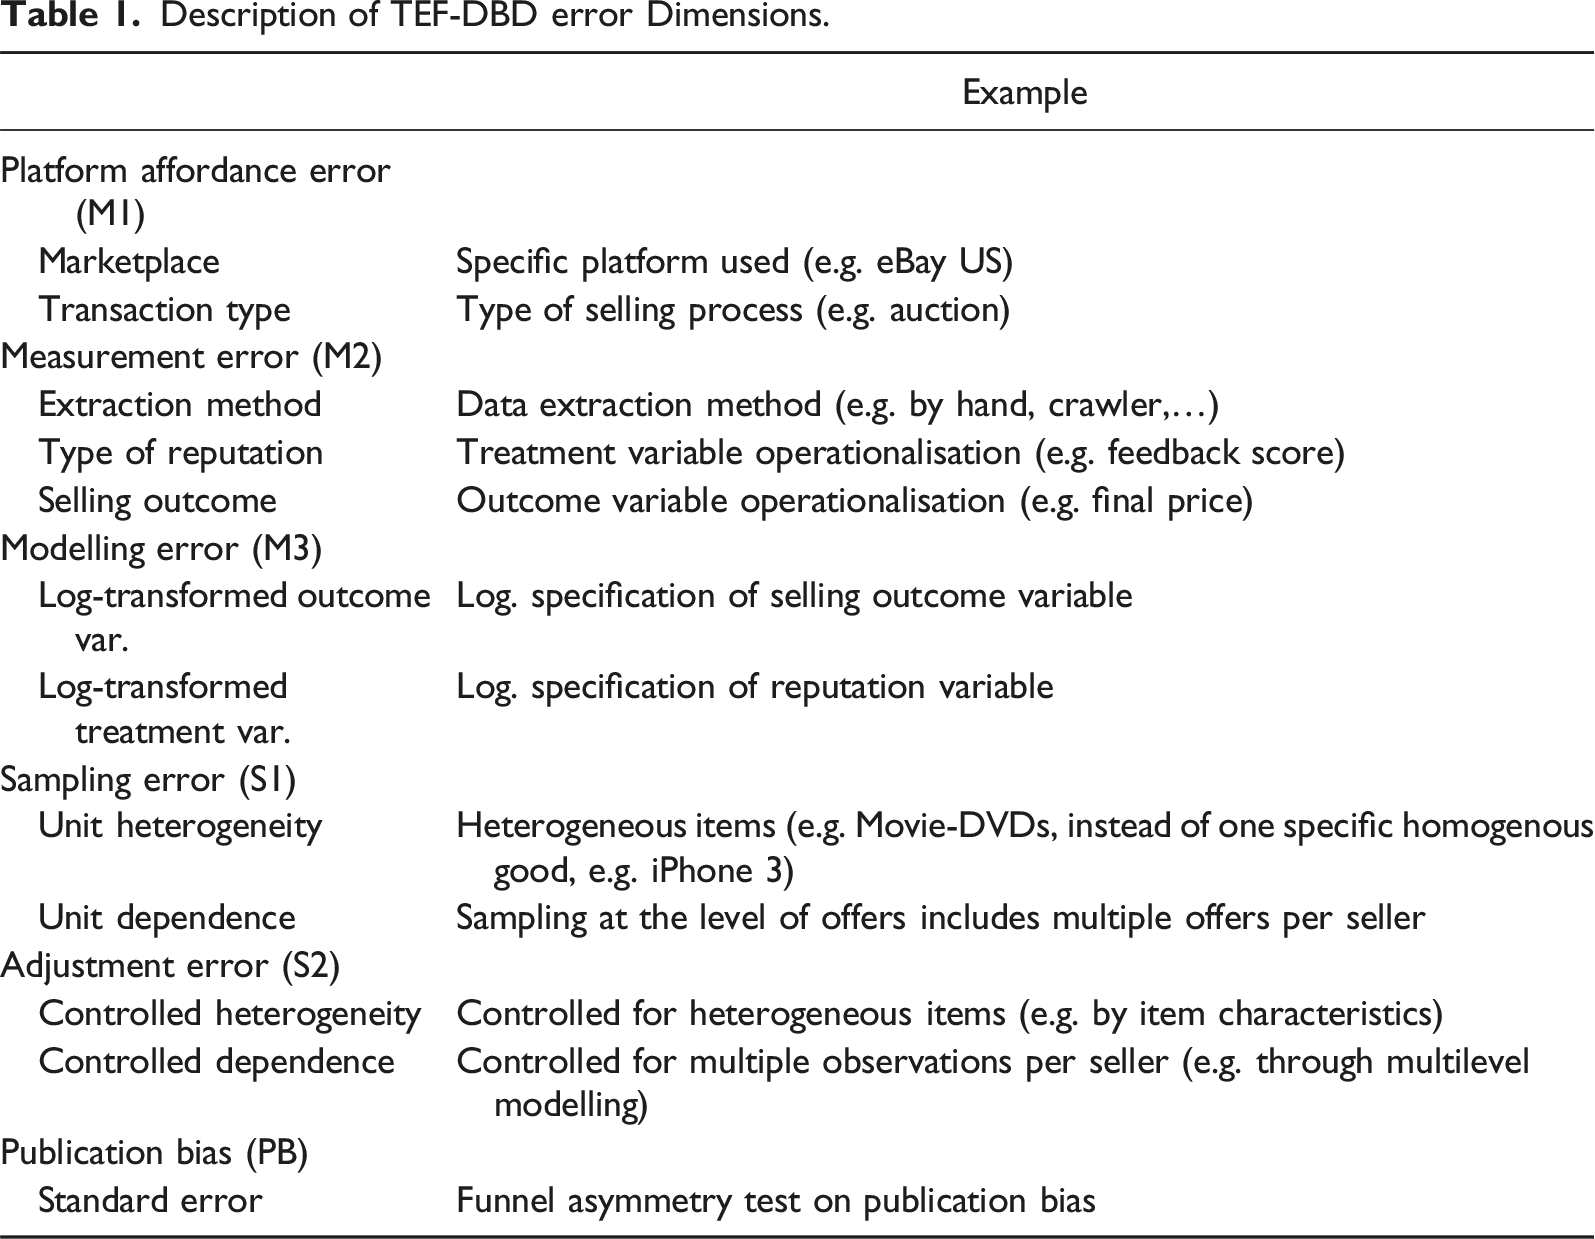
Platform affordances error refers to the bias and noise that are created by platform-specific socio-technical constraints (Sen et al., 2021). For example, unlike eBay US, eBay DE (Germany) did not provide sellers with the possibility to set reserve prices in online auctions. With setting a reserve price, the seller ties the sale of an item to the item reaching a minimum price (see, e.g. Bajari & Hortacsu, 2003). As a result, if seller success is measured in terms of item sales, sellers in the US may appear less successful than sellers in Germany because they may end up selling less. Cultural constraints can also create bias in the measure of seller reputations. There is anecdotal evidence that buyers in Asian online markets rarely leave negative feedback (Jiao et al., 2022). This would suggest that seller reputations in Asian online markets such as Taobao would be more positively biased than seller reputations in European or US markets. Further, some platforms allow sellers to offer their items in an auction format, whereas other platforms only allow for fixed price offers. Differences in the selling format create variation in how outcomes and other aspects of P2P online market transactions are measured. Most importantly, the ways in which information about sellers’ reputations is provided differs across platforms. In some platforms, information about sellers’ reputations is provided in terms of the average number of stars (e.g. ranging from 1 to 5), whereas in other platforms, seller reputations are provided in terms of the number of positive minus the number of negative ratings. These differences necessarily induce variation in estimated reputation effects.
Measurement error refers to the bias and noise resulting from using behavioural traces available in a particular platform to measure the constructs of interest. As mentioned above, seller reputation can be measured in different ways using the information provided by an online market platform. Seller reputation is usually measured utilising quantitative information on the number of positive and negative ratings or stars. However, measures of seller reputations that rely on the percentage of positive feedback ratings of all ratings a seller ever received or the average number of stars, without accounting for the total number of (rated) transactions, will suffer from low construct validity (Tadelis, 2016). A seller with an average star rating of 4.7 out of 5 based on 1000 rated transactions will be considered more trustworthy than a seller with the same average star rating based on five rated transactions. Clearly, if the necessary information is available (e.g. the total number of rated transactions), researchers can resort to variable transformations that they think would result in more valid measures of the constructs of interest. However, such modelling exercises can, in turn, lead to modelling error (see below). The same applies for different selling outcomes, which can be measured as the realised final prize (as a measure in local currency), a dummy variable standing for selling success (not sold/sold), a count variable standing for selling volume (number of items sold), as well as a ratio indicating the price premium of the achieved price compared to a (external) book value (e.g. for collectors’ coins).
Furthermore, measurement error can be introduced by the way the data is collected or obtained. For example, measurement error occurs if particular measures differ systematically depending on whether they are obtained via the frontend (e.g. website) or the backend (e.g. API). This difference may result from a faulty export computer program, a so-called web crawler, or spider. The distinction between frontend and backend data access is particularly important in DBD because the frontend data generally captures the same information as displayed to a human user. This means that frontend data, collected by hand or by a web crawler, captures the same information as a human user of the online platform can obtain. Backend data, however, may be stored differently (e.g. in a more granular form), and offer measures that are hidden from human platform users, or measures only visible on a sub-page (e.g. detail page of the offered item instead of the overview page). This would make backend data problematic for measuring behavioural constructs of human users. However, bias caused by frontend data collection is also possible due to human errors in data extraction, errors in the web crawler, or so-called matching algorithms employed by platforms to provide buyers with an individualised shopping experience. Matching algorithms distort the ability of frontend data to be reflective of how buyers experienced and interacted with an online market platform (Przepiorka, 2023).
Modelling error refers to the bias and noise that is introduced in the attempt to complement the measure of a relevant construct with information from other traces or data sources or isolate the relevant dimensions of a construct by selecting a subset of available traces. For example, trader reputation could be modelled as a function of the quantitative ratings (e.g. number of positive and negative ratings) as well as the sentiment scores of the feedback texts accompanying these ratings. This may lead to more accurate measures of seller reputations because buyers who are reluctant to hamper sellers’ business by leaving negative ratings may instead choose to write a negative feedback text while leaving a neutral or even positive rating (Macanovic & Przepiorka, 2023). However, incorporating information contained in feedback texts in a measure of seller reputation may decrease the validity of the measure if potential buyers do not usually consider comprehensive textual information. Moreover, modelling error can result from transforming (or not) the raw trace variables to be used in further analysis. For example, it is commonly accepted and theoretically sensible to transform the number of ratings by taking the logarithm of the number of ratings (+1). This is to account for the fact that the relation between sellers’ reputations in terms of the number of positive ratings and these sellers’ market success increases with diminishing returns. Failing to capture the functional form that characterises the relation between these two variables may lead to a biased estimate of the reputation effect.
Platform coverage error refers to the bias and noise resulting from the discrepancy between an online platform’s userbase and the relevant target population (Sen et al., 2021). Clearly, this error matters if one aims to generalise results obtained with the analysis of DBD from an online platform to members of a population that do not use this platform. However, as in many other cases, this is not the aim in the research on reputation effects in P2P online markets.
Sampling error refers to the bias and noise that results from the way units of analysis are collected and selected. In the case of online market transactions, studies usually focus on one product category (e.g. mobile phones) and sample items that are offered in this category and within a certain time frame. Bias and noise may arise due to the fact that relevant items might be listed in other product categories or irrelevant items (e.g. accessories) are listed in the focal product category. Moreover, when measuring seller market success in terms of prices, such analysis can only use cases of sold items because unsold items do not have selling prices (or, more precisely, these are censored at the initial price). Moreover, sampling advertisements may lead to repeated sampling of sellers because some sellers advertise several offers. This in turn may induce sampling error, because reputation measures hardly differ within a seller in the usually short timeframe of data collection. Also sampling very broad product categories (e.g. mobile phones) may introduce sampling error, as product characteristics (e.g. condition, model, accessories) confound the relationship of interest (i.e. induce unobserved heterogeneity).
Adjustment error refers to the bias and noise that results from the way non-random samples are adjusted (e.g. through weighting), repeated observations of same units of analysis (e.g. multiple transactions with the same seller) are accounted for, or product heterogeneity is controlled for during the statistical analysis. Repeated observations of transactions involving the same sellers are frequent in P2P online market data and need to be accounted for by, for example, employing multilevel techniques. If this is ignored or multilevel techniques are applied wrongly, study results may be, respectively, more prone to type I error (i.e. false positive conclusion) or result in biased estimates of reputation effects. The same also applies if features of heterogenous products are not controlled in the statistical analysis (e.g. by controlling for condition, specific model, accessories, etc.).
In what follows, we perform a dominance analysis based on a meta-analytical dataset collected and used in previous meta-analytic studies by Jiao and colleagues (2021, 2022). The dominance analysis approach allows us to assess how much of the variance in reputational effect sizes can be attributed to different sets of variables in the meta-analytical dataset. We use our TEF-DBD to assign these variables to the different sources of error described above. This, in turn, allows us to specify at which stages of the research process decisions are being made that are most critical for the quality of DBD.
Data and Methods
The study at hand builds on the data of the meta-analyses of Jiao and colleagues (2021) and the meta-regression analyses of Jiao and colleagues (2022) on the effect of reputation on selling success in P2P online markets (e.g. eBay). This dataset contains information on the effect sizes and coded information of the included studies, datasets and models (e.g. specification of seller market success or reputation, platform under study). For the purpose of the analyses reported in this paper, we added information on the sampling of sellers, product heterogeneity and the data extraction method (e.g. via crawler or by hand). The final sample includes 346 estimates from 109 publications covering 25 years of research. 1
All empirical estimates were transformed to a common effect size metric, Fisher’s z (z’), a standard-normal transformation of Pearson’s correlation coefficient to make them comparable across estimates (see Jiao et al., 2021 for details on how effect sizes were calculated). For one specific treatment effect, namely, negative reputation scores, the sign of the effect size was switched (negative to positive sign of coefficient and vice versa), because an increase in negative ratings usually leads to a decrease in sales and prices.
Importantly, the main interest of our analysis is to quantify the impact of specific variables or groups of variables on the explained variance (R 2 ) in the effects reported in the literature. To this end, we use meta-dominance analysis, which is dominance analysis (Azen & Budescu, 2006; Budescu, 1993) applied on meta-analytic variables such as effect sizes and study characteristics (for an example of dominance analysis applied to survey data, see Hakanen et al., 2021). This is unlike moderator analysis, where meta-regression-analysis is used to quantify the impact of variables on the sizes of the effects reported in the literature (see, e.g. Jiao et al., 2022). Our analytical approach closely corresponds with our TEF-DBD (Figure 1), because the explained variance measures the impact of a variable or group of variables on the systematic effect heterogeneity.
Keeping the focus on the explained variance, different error sources can be disentangled and compared in their relative contribution to the overall error, that is, the overall systematic variance of the effects. Measuring the explained variance as a relative error has the advantage that no assumptions about the true underlying effect have to be made; such assumptions would be inevitable if we focused on the absolute error, that is, the difference between the true and measured effect. However, two problems with estimating relative error exist: First, since primary studies reporting effects based on a small N show statistically a higher variability, they should be given a lower weight in the analysis. Second, the relative importance of the error components has to be modelled, allowing for possible dependencies between the variables.
To account for the higher variability of smaller studies, we implement a weighted least squares (WLS) meta-regression model using the inverse of the effect estimates’ variances as a weighting variable. Larger, more precise studies with a smaller variance receive a higher weight, and smaller, less precise studies with a larger variance receive a lower weight. The WLS meta-regression model is, in its intercept-only version (i.e. without any added variables), equivalent in its point estimate to a fixed-effect meta-analysis. We use a WLS specification because simulation studies have shown that, especially under the condition of effect heterogeneity, the variance is better identified than in the fixed-effect or a random-effect model (Stanley & Doucouliagos, 2015).
To estimate the relative importance of our error components, we have to estimate a meta-regression model including all variables capturing our error components and, in a second step, estimate their contribution to the explained variance in effect sizes by means of dominance analysis (Azen & Budescu, 2006; Budescu, 1993). In our meta-regression model, predictors of the specific error components are included as per Table 1. The dependent variable is the effect size 
So far, the presented meta-regression model can only show the impact of the included predictors on the effect heterogeneity of primary studies in a Pearson correlation coefficient metric. However, nothing can be said about the relative importance of the different error sources, our central research aim. If the explanatory variables were uncorrelated (M1-M3, S1-S2 & PB), it would be possible to use the R2 of meta-regression models on each variable (group) separately to estimate the impact of these variables on the overall error (Grömping, 2007: 139). However, in the data at hand, substantial correlations between the explanatory variables exist (ranging from −0.793 to 0.796 in terms of Pearson correlations). A possible solution for this problem is dominance analysis (used terminus in psychology, Azen & Budescu, 2006; Budescu, 1993) or the Shapely-Owen decomposition (used terminus in economics, Lipovetsky & Conklin, 2001). 2
When applied to (meta-)regression models, the difference between the R2 of the regression models with a variable j, 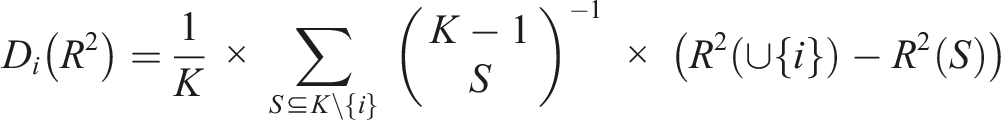
Bootstrapped standard errors are calculated to test each error component’s contribution against the null hypothesis that no such error exists. One thousand bootstrap replications of the abovementioned routine were implemented to obtain point estimates of the dominance statistic and the standard error as a measure of precision (cp. Fryer et al., 2020). All computations were done in Stata 17. Meta-analysis conducted in Stata produces similar results as R and Python (Masoumi & Shahraz, 2022). All materials to reproduce the paper’s results are available on OSF. 3
Results
Descriptive Results for the Composition of the Meta-analytic Sample.
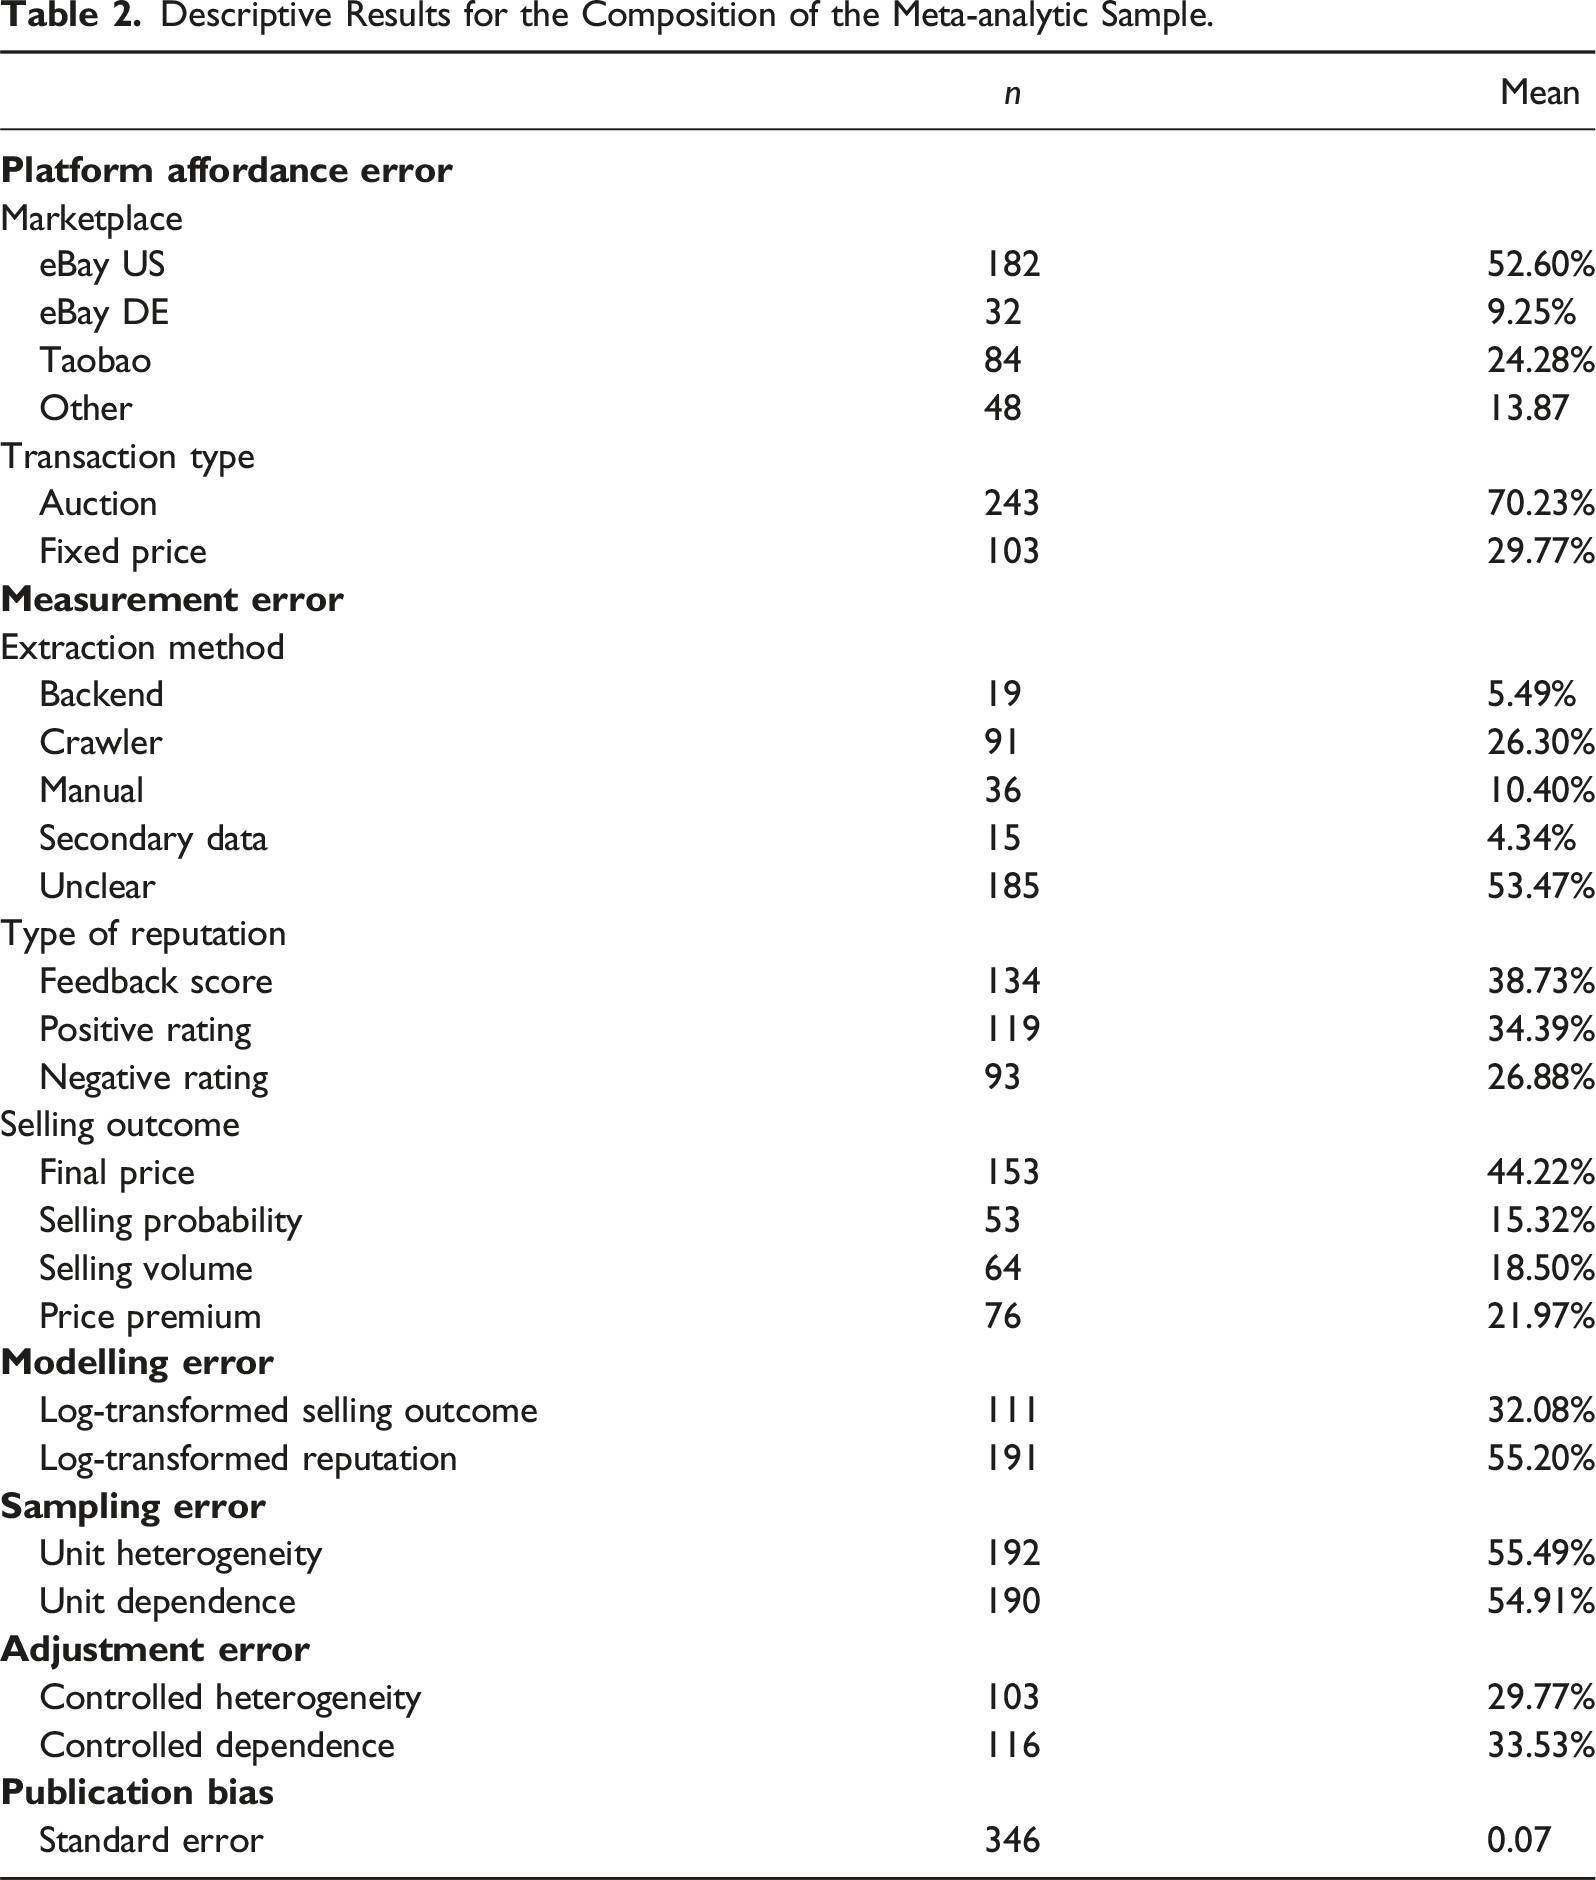
Measurement error is operationalised by the data extraction method authors implemented to obtain the data in the primary studies, the chosen reputation measure and selling outcome measure. In more than half of the studies, the data extraction method is not described. Most of the other studies employ web-scraping using a custom-written program to extract DBD from an online market frontend (i.e. web page). Around 10% of primary studies extracted their DBD manually (e.g. by copy & paste from a web-browser). Manual extraction is similar to web-scraping because the frontend is used to extract data. However, manual extraction differs from web-scraping because only relatively small datasets can be collected by hand, the method is more prone to human error, and it is arguably less prone to systematic error that can result from automatised data collection. In around 5% of the estimates, the authors obtained their data directly from the backend, meaning that the online platform provided the data for the specific research purpose. Another 5% of the estimates relied on secondary data indicating that the authors used data already collected for previous studies for their analyses. The reputation measure (treatment variable), or the selling outcome (outcome variable) spread quite evenly over the categories. Most studies rely on the reported feedback score for the type of reputation, whereas slightly fewer studies use the number of positive or even less likely the number of negative ratings. For the selling outcome, the distribution is more skewed. Nearly half of the estimates concentrate on the realised final price of the item and substantially less focus on the selling probability, the selling volume or a potential price premium.
Specifying a wrong functional form for the relation between the target variable and an explanatory variable (e.g. by using one linear term while the true relation is u-shaped) can lead to biased coefficient estimates. We use two variables to operationalise modelling error in the functional form of the relation between the selling outcome and the reputation variable. Around one-third of the estimates result from a logarithmic specification of the selling outcome, whereas more than half of the estimates result from a logarithmic specification of the reputation measure.
Sampling error is captured by two variables indicating whether estimates are based on analyses of item data from different product categories and whether multiple offers per seller were sampled. In more than half of the cases, advertisement sampling was present but not controlled for in the analyses. An equally high share of studies sampled at the level of advertisements. More than half of the included estimates rely on data potentially affected by sampling error.
Adjustment error is defined as the use of (computational) methods to account for both issues of sampling error, namely, product heterogeneity and the multiple sampling of sellers. In the case of product heterogeneity, 30% of the estimates are based on models that account for product heterogeneity by controlling for product characteristics. A similar result can be observed for advertisement sampling; 34% of the estimates implement correction methods to account for potential dependencies of observations and obtain valid test statistics (e.g. multilevel models or clustered standard errors).
We start with the commonly used meta-analytic estimation strategies, a fixed-effect and a random-effect model, to keep results comparable. In the case of the fixed-effect meta-analysis of the complete data, a very small 4 overall and statistically significant effect was present z’ = 0.033 (z = 187.9, p < .0001). This result only slightly changes in the random-effect specification, which yielded a larger but still small effect z’ = 0.098 (z = 10.7, p < .0001). Also the WLS model shows a similar overall effect with an overall very small effect size z’ = 0.033 (z = 21.24, p < .0001). 5 This finding and the substantial results from the meta-regression analysis (cp. Table A1 in the appendix) are highly comparable to the substantial meta-analyses by Jiao and colleagues (2021, 2022).
More important for our research is the share of substantial variation in the results beyond random error, that is, the share of sample-size-induced random variation on the overall variation in effect sizes. We rely on I 2 , a measure used in meta-analysis to describe the percentage of between-study variability to total variability in effect sizes (i.e. within-plus between-study variability, cp. Higgins & Thompson, 2002). In our case about 99% of the variation in the effect sizes (I2 = 98.72%) is systematic and only about 1% of the variation is caused by sampling error that results from different sample sizes of the primary studies. This means that the systematic variation likely occurs due to the different sources of error specified in TEF-DBD (Figure 1) and will not disappear with larger sample sizes. These sources of error may have introduced bias in the primary studies and, consequently, in meta-analyses using these primary studies’ results. In contrast, as discussed above, random error can be addressed with a WLS meta-regression analysis.
In addition, the WLS meta-regression model described in the methods section is able to control for effect heterogeneity by accounting for potential moderators. In our case, it is possible to explain 55.9% of the variance in primary studies’ results. 6 In other words, more than half of the substantial heterogeneity is explained by the variables capturing the different error components as per the TEF-DBD. However, this also means that nearly half of the systematic variation remains unexplained. If we missed important variables contributing to the error components of the TEF-DBD, the impact of these errors on study results may be underestimated in our analyses. The results presented below can therefore only serve as a lower bound of the importance of the respective error components.
Dominance Statistics by error Component as per TEF-DBD.
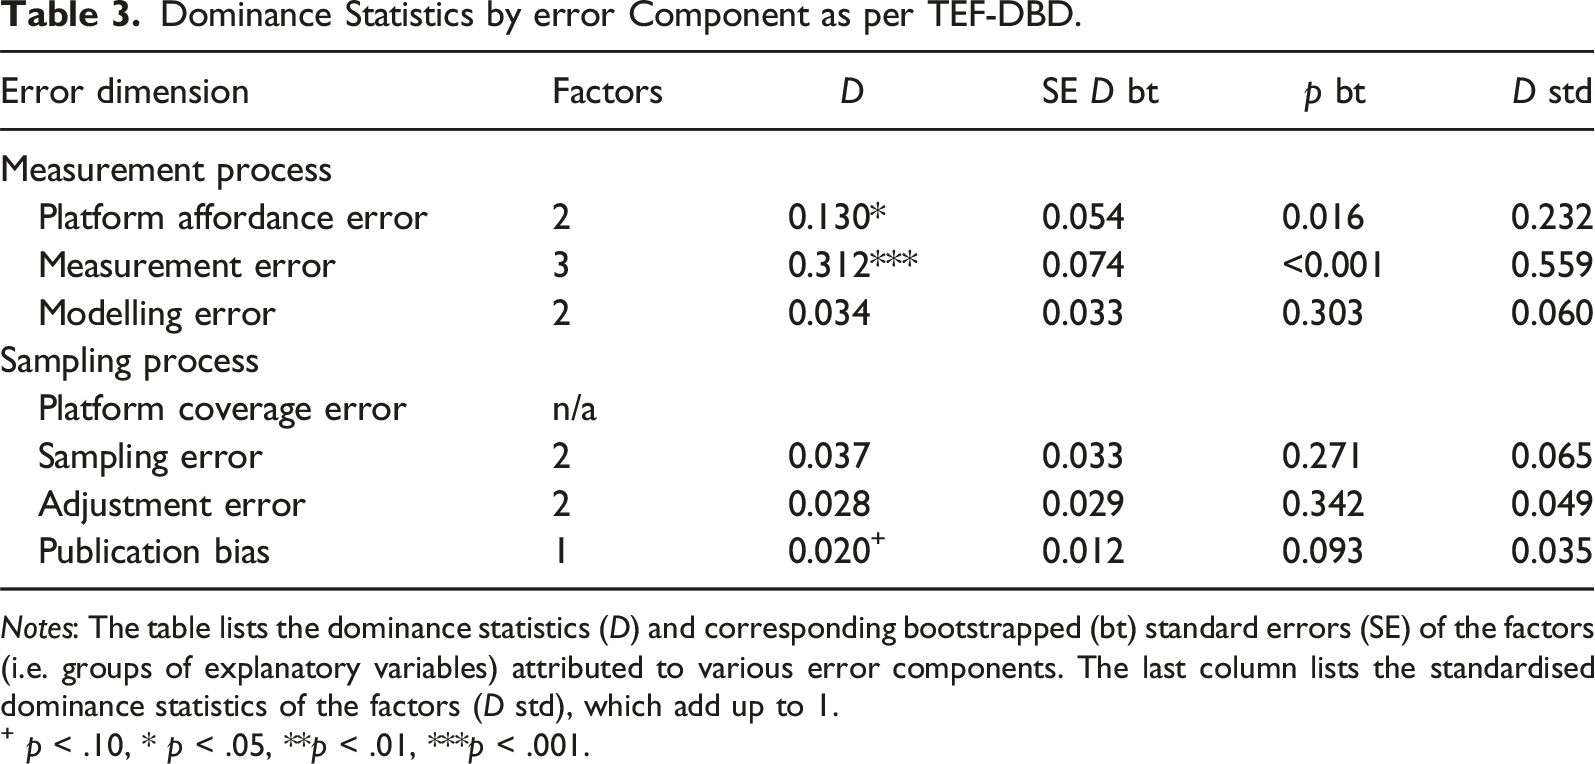
Notes: The table lists the dominance statistics (D) and corresponding bootstrapped (bt) standard errors (SE) of the factors (i.e. groups of explanatory variables) attributed to various error components. The last column lists the standardised dominance statistics of the factors (D std), which add up to 1.
+ p < .10, * p < .05, **p < .01, ***p < .001.
The variable groups that account for the error components of the measurement process explain together 47.5% of the overall variance and constitute 85% of the explained variance. This is far more than the variable groups accounting for the error components of the sampling process or publication bias. When ranking the error components by the size of the dominance coefficient D, measurement error is the most important error component, followed by platform affordance error. All other components each explain less than 5% of the total variance.
Three variables stick out in importance when splitting up the error dimensions into dominance statistics of all included variables (see Table A1): First, the procedure chosen to obtain the data accounts for 12.1% of the total error variance. Second, the operationalisation of the selling outcome accounts for 11.6% of the total error variance. Third, the market platform accounts for 7.3% of the variance. These three variables explain together 32% of the overall variance and constitute 55.5% of the explained variance.
Discussion and Conclusions
In this paper, we propose a new conceptual framework and a meta-analytic tool for the assessment of the quality of digital behavioural data. We call our conceptual framework TEF-DBD (Total Error Framework for Digital Behavioural Data). TEF-DBD draws on the classical TSE framework (Groves et al., 2009) as well as recent applications of the TSE framework to DBD and big data (Amaya et al., 2020; Sen et al., 2021). TEF-DBD seeks for conceptual separation of sources of error emanating from the measurement and sampling processes in research using DBD. It specifies three sources of error stemming from the measurement process (platform affordance error, measurement error, and modelling error) and three sources of error originating from the sampling process (platform coverage error, sampling error, and adjustment error). Statistically, our meta-analytic tool is based on dominance analysis (Azen & Budescu, 2006; Budescu, 1993), which separates the contributions of explanatory variables to the explained variance in an outcome variable. We call our modelling approach meta-dominance analysis as it combines both, a WLS meta-regression model and dominance analysis. While TEF-DBD facilitates the conceptual attribution of our explanatory variables to the six sources of error, the meta-dominance analysis provides information on which sources of error may have the largest bearing on the variation in effect size estimates.
Identifying the most relevant sources of substantial error allows us to pinpoint the stages in the research process at which researchers’ decisions have the largest potential impact on study results. Based on these insights, assessing the quality of a particular dataset can focus on researchers’ most consequential decisions when conceptualising, collecting and analysing their data and generate judgements about the appropriateness of these decisions.
We demonstrate the applicability of our framework and tool with an empirical example using reported estimates of reputation effects from P2P online markets. The results of our meta-dominance analysis show that the measurement process in general and measurement error in particular explain the most substantial share of the variance in study results. This means that due to measurement factors, substantially different research results exist, which serves as a sign of systematic error. The sampling process, which also includes the choice of statistical data analysis technique to adjust for potential sampling error, is of minor importance in our empirical example. It is important to note that (primary) sampling variability is almost no issue at all. This shows that mere sample sizes, an often appraised quality criterion of DBD or big data, may not affect data quality substantially.
A plausible explanation for these findings could be that the contexts in which data from P2P online markets were collected (e.g. eBay US vs. Taobao in China), the ways in which these data were collected (e.g. backend vs. frontend), and the ways in which the constructs of interest were operationalised (e.g. probability of sale vs. selling price) induced more systematic effect size heterogeneity than researchers’ choices of statistical data analysis techniques.
Relying on the statistical concept of dominance analysis has the great advantage that the dependencies between the included variables are covered by the estimation method. Although we utilised the available meta-analytical dataset of Jiao and colleagues (2021, 2022) and expanded it by coding additional variables, a relatively large proportion of systematic effect size heterogeneity remains unexplained in our meta-dominance analysis. It is also possible that we missed to capture some relevant source of error in the sampling process.
Conceptually, TEF-DBD has its strength in strictly separating error sources from the measurement process and the sampling process. This strict divide may be more difficult to maintain in an empirical example. For example, the operationalisation of the platform affordance error (measurement process) could arguably also be used to capture the platform coverage error (sampling process), as the platforms from which DBD was collected may determine both, the measurement and the sampling process. However, for research that uses DBD to address causal rather than descriptive questions, as in our empirical case, this ambiguity may not arise because no conclusions are drawn from study results to a general target population beyond platform users.
Our study adds to the literature on data quality a relatively simple-to-implement method to assess error sources in a specific strand of research. Next, to so-called many-labs approaches (Klein et al., 2014, 2018; Landy et al., 2020), TEF-DBD paired with meta-dominance analysis allows identifying sources of systematic variation and error across different model specifications and data sources. This is a clear advantage compared to multiverse studies (Auspurg & Brüderl, 2021) and crowdsourcing approaches (Breznau et al., 2022; Silberzahn et al., 2018) that are limited to one specific dataset and therefore are only able to examine systematic variation across different analyses of this dataset. As our empirical example shows, a dedicated focus on researchers’ decisions preceeding the data-analysis phase may be crucial, as large parts of the variability in our results originate from these phases.
Similar to many-lab replication studies (Baumeister et al., 2023; Lo Iacono et al., 2023), TEF-DBD paired with meta-dominance analysis can map the entire research process – from the theoretical conceptualisation to the empirical operationalisation to the data collection and the data analysis phase – and assess the relative importance of different sources of error. However, meta-dominance analysis is more feasible because it relies on meta-analytical data that builds on the past work of researchers and their publications rather than data that first needs to be produced by means of new study designs and data collection efforts.
The approach to asses data quality described in this paper is not limited to applications with digital behavioural data such as online market transaction data or social media text message data. For example, our approach could be used to assess data quality of behavioural data stemming from social scientific experiments conducted in the lab, the field and online. One particular source of meta-analytical data that could be used for this purpose is the Cooperation Databank (Spadaro et al., 2022). This initiative has accumulated fine-grained meta-data of 2636 studies on human cooperation conducted in 78 societies between 1958 and 2017.
There are a couple of limitations to our approach. While TEF-DBD, our conceptual framework, is quite flexible, meta-dominance analysis hinges on data availability. Meta-dominance analysis can be applied if a considerable number of studies that use quantitative research methods to address a similar research question have been conducted and reported; it cannot be applied to assess the quality of single datasets. However, data availability is a requirement for any statistical modelling effort and given the increasing availability of meta-data, this limitation may have a timely expiration date. Second, our empirical approach is based in a relative error framework and, therefore, cannot identify specific research choices that cause error, but research choices that cause effect heterogeneity (similar to the concept of vibration of effects, Patel et al., 2015). The relative error is therefore only able to identify groups of seemingly error-prone factors in the research process, rather than definite sources of error. However, although an absolute measure of error (Hurtado Bodell et al., 2022; Meyer & Mittag, 2021) would be better suited to assess DBD quality, such an approach must first identify a true effect from which different error dimensions deviate. This is impossible in most practical cases.
To conclude, TEF-DBD paired with meta-dominance analysis can help researchers to make informed decisions at different stages of the research process. The major role of measurement in our empirical application may also hold for other research areas and may point to the fact that conscious, theoretically bolstered decisions are crucial when measuring and operationalizing key constructs. However, it seems important to use the TEF-DBD and its empirical counterpart of meta-dominance analysis also beyond the topic of reputation effects in P2P online markets as this will allow to generalise results regarding data quality on a wider range of data types.
Footnotes
Acknowledgements
We would like to thank Ruohuang Jiao for completing the meta-analytical data used in this study with information from studies written in Chinese. We are grateful to Indira Sen for helpful comments on an earlier version of our paper.
Declaration of Conflicting Interests
The author(s) declared no potential conflicts of interest with respect to the research, authorship, and/or publication of this article.
Funding
The author(s) received no financial support for the research, authorship, and/or publication of this article.
Notes
Appendix
Meta-regression model and dominance statistics by each included variable. Notes: The table lists meta-regression coefficients, standard errors (SE), dominance statistics (D) of the explanatory variables, and the standardised dominance statistics of the variables (D std), which add up to 1. The last column (Rank) lists the importance of the variables in terms of their contribution to the model fit statistic. +p < .10, *p < .05, **p < .01, ***p < .001.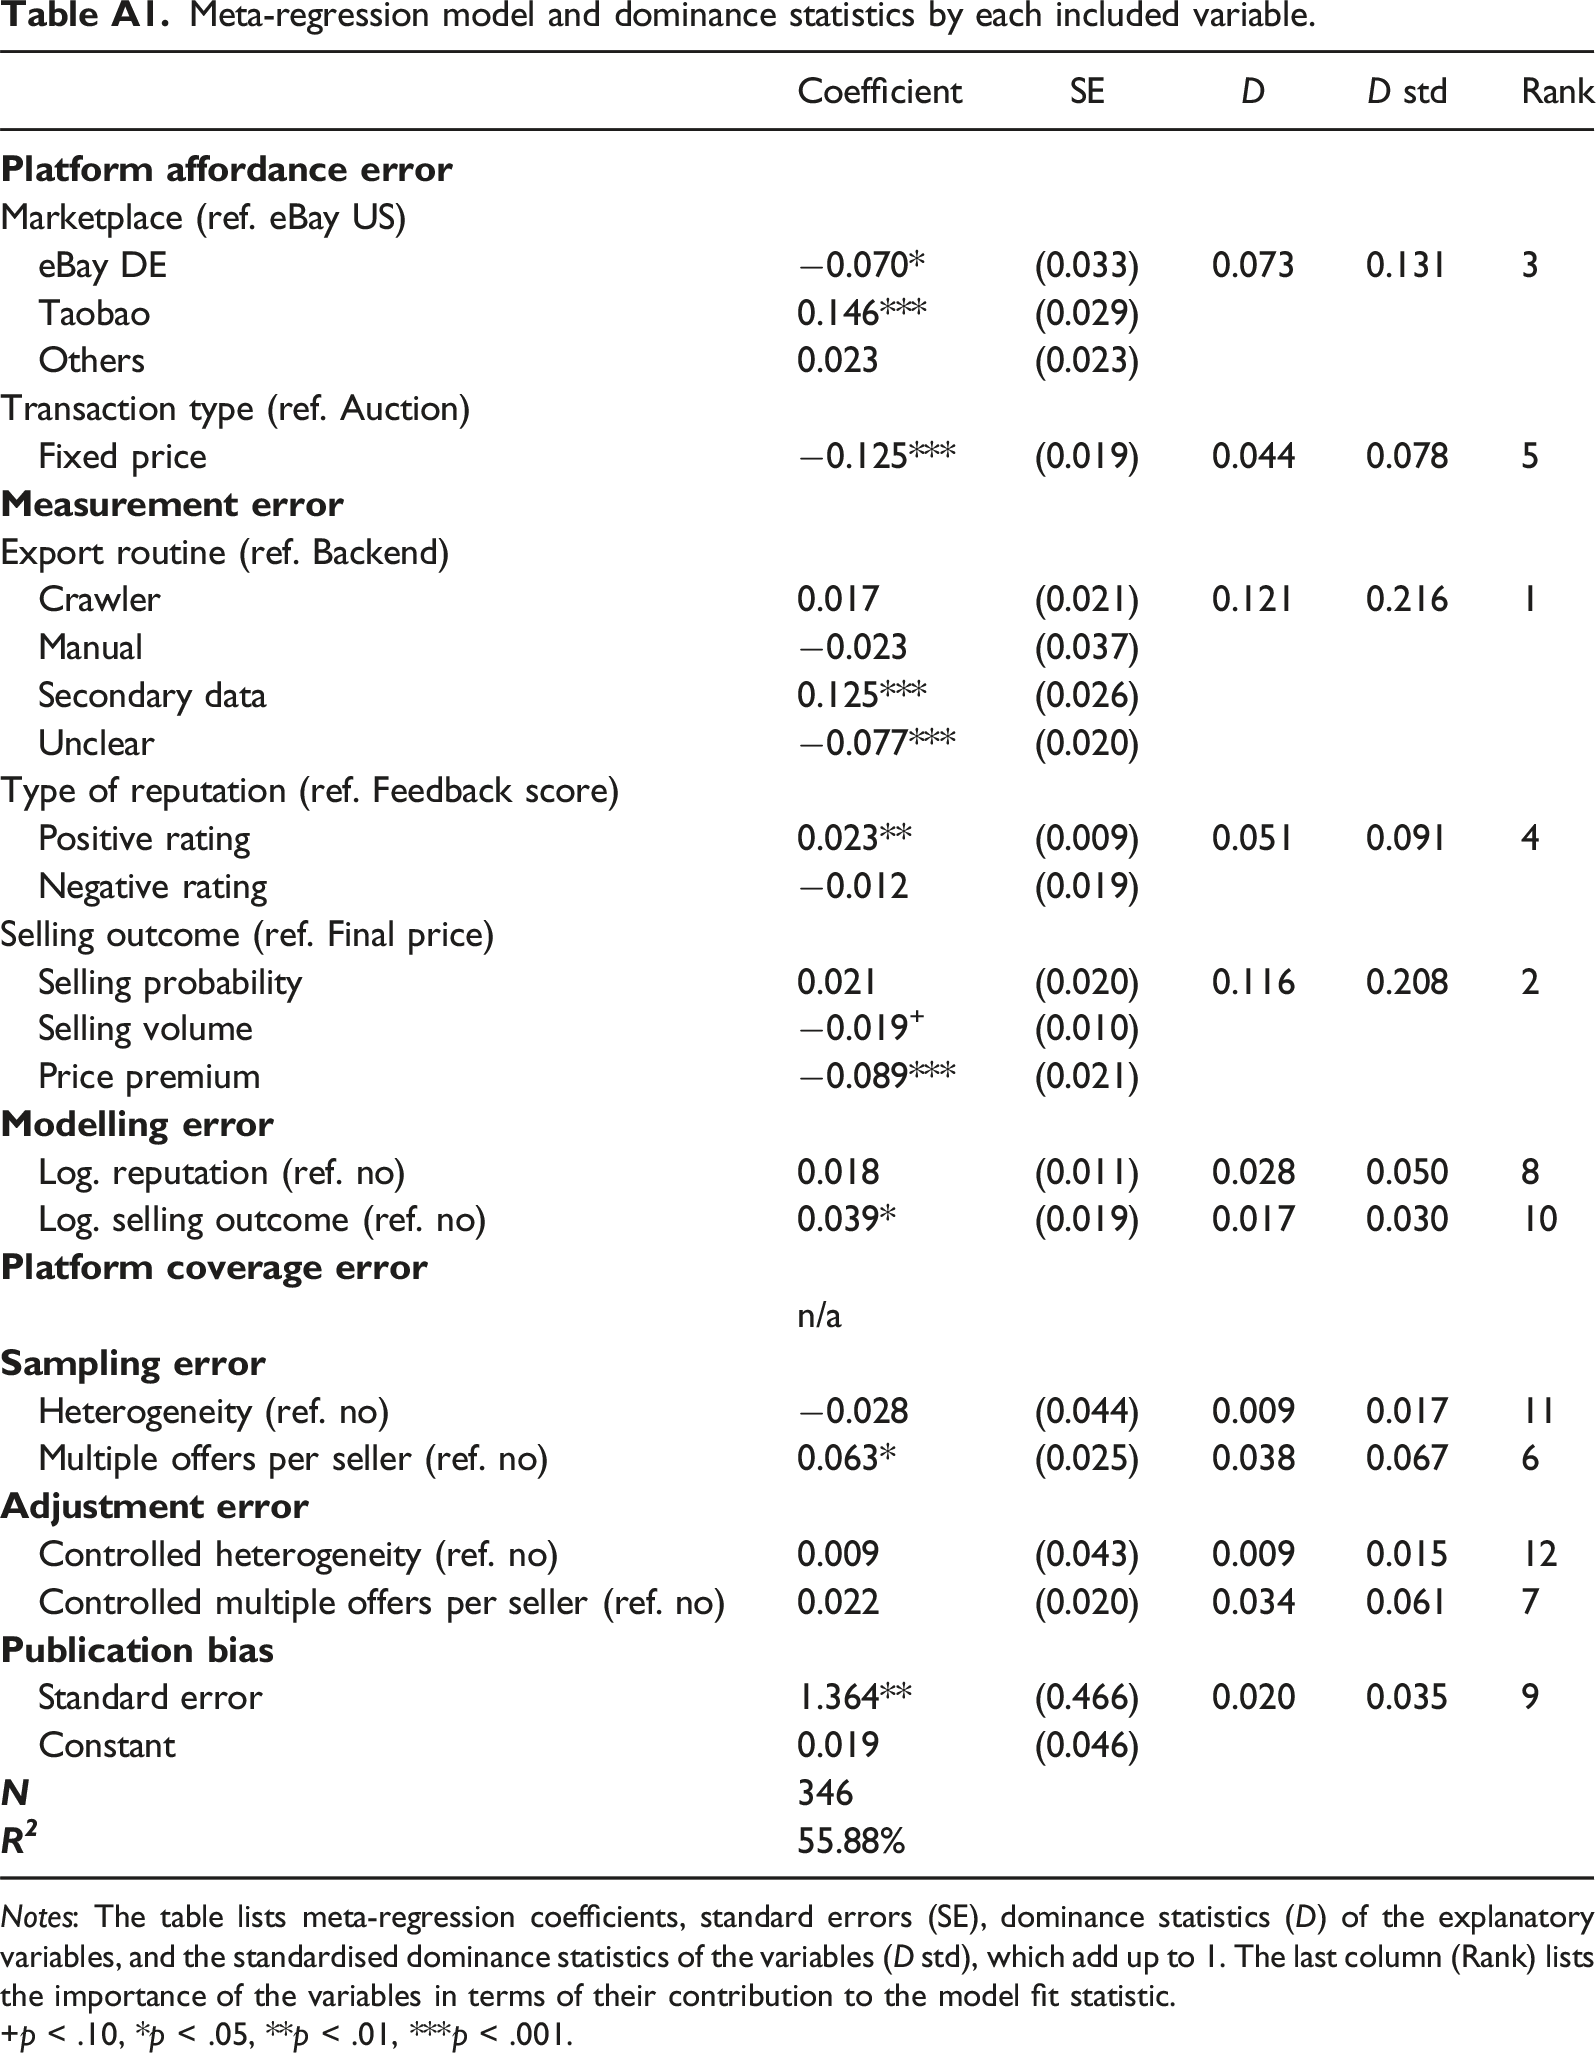
Coefficient
SE
D
D std
Rank
Marketplace (ref. eBay US)
eBay DE
−0.070*
(0.033)
0.073
0.131
3
Taobao
0.146***
(0.029)
Others
0.023
(0.023)
Transaction type (ref. Auction)
Fixed price
−0.125***
(0.019)
0.044
0.078
5
Export routine (ref. Backend)
Crawler
0.017
(0.021)
0.121
0.216
1
Manual
−0.023
(0.037)
Secondary data
0.125***
(0.026)
Unclear
−0.077***
(0.020)
Type of reputation (ref. Feedback score)
Positive rating
0.023**
(0.009)
0.051
0.091
4
Negative rating
−0.012
(0.019)
Selling outcome (ref. Final price)
Selling probability
0.021
(0.020)
0.116
0.208
2
Selling volume
−0.019+
(0.010)
Price premium
−0.089***
(0.021)
Log. reputation (ref. no)
0.018
(0.011)
0.028
0.050
8
Log. selling outcome (ref. no)
0.039*
(0.019)
0.017
0.030
10
n/a
Heterogeneity (ref. no)
−0.028
(0.044)
0.009
0.017
11
Multiple offers per seller (ref. no)
0.063*
(0.025)
0.038
0.067
6
Controlled heterogeneity (ref. no)
0.009
(0.043)
0.009
0.015
12
Controlled multiple offers per seller (ref. no)
0.022
(0.020)
0.034
0.061
7
Standard error
1.364**
(0.466)
0.020
0.035
9
Constant
0.019
(0.046)
346
55.88%