
Abstract
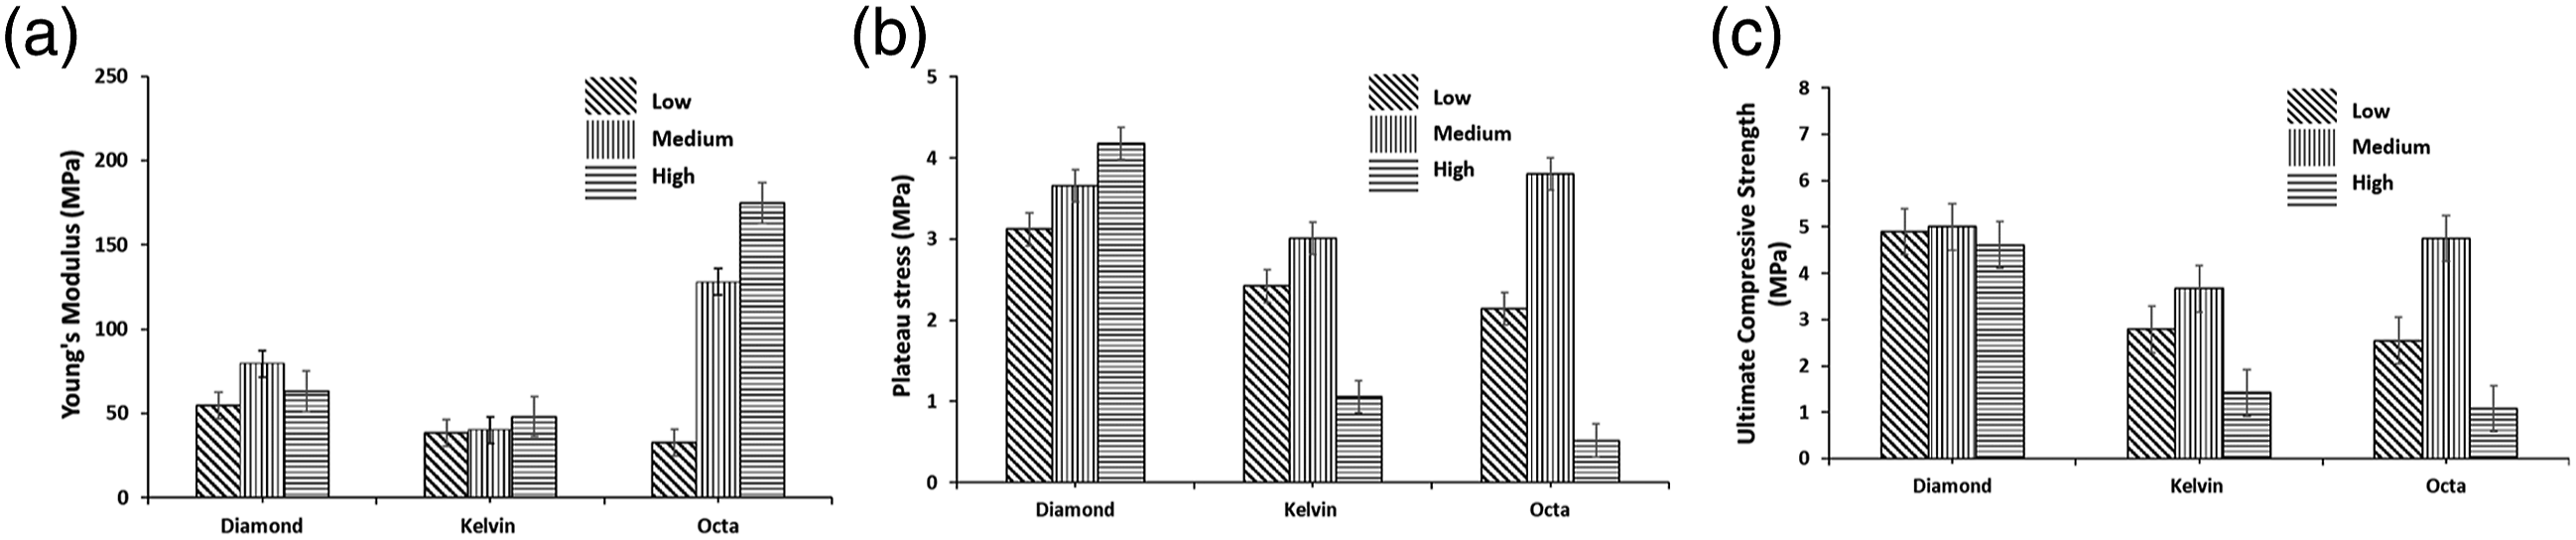
Lattice structures have been proven to be one of the best choices since their inception, for various structural and other commercial applications, for enhanced mechanical properties, especially in the case of vibration isolation, where band gaps play a vital role. In the present study, additively manufactured 3D printed lattices are prepared with the help of fused deposition modelling (FDM) under various design variations such as Diamond, Kelvin, and Octa formations. Further, three variations in the form of cell density have been used in all the designs, such as low, medium, and high density. The effect of the design variations on Young’s modulus, ultimate compressive strength, and plateau stress have been studied, and comparative analysis amongst the designs has been carried out. In the case of the diamond foam, the Young’s modulus of 54.84, 79.43, and 63.13 MPa has been obtained for low, medium, and high density, respectively. However, in the case of Octa formation with a high-density apology, highest value of young modulus is obtained, which is 174.94 MPa. But the plateau stress is the best in the case of high-density diamond topology and least in the case of high-density Octa formation. In addition, the diamond foam with the medium density has shown the best compressive strength, i.e., 5.003 MPa. Moreover, vibration analysis properties were explored; interestingly, it has been seen that the transmissivity of the medium-form structures for all shapes is higher than the others whereas the natural frequency of the Diamond and Octa shapes is lower. Hence the shape and form of the lattice have a significant effect on the final properties of the lattices and lattice structures contribute to structural integrity in terms of better properties and enhanced behaviour.
Introduction
Additive manufacturing (AM) is a well-known technique for the layered manufacturing system, which offers freedom in selecting an infinite number of shapes and designs for the fabrication of parts using a wide variety of materials.1–4 This design freedom in the development of complex geometries allows the use of AM for imparting the tailorable properties in the components.5–9 One such property is termed vibration isolation which is generally attained by high-mass architecture to dampen the effect of mechanical excitations. In contrast, high-mass architectures have the disadvantage of propagation of the waves in the whole part, which restrict the properties of vibration isolations. 10 Therefore, additively manufactured lattice structures based upon repeated unit cells can provide a novel methodology for isolating mechanical vibrations with the lowest transmission and low mass structures. 11 Usually, honeycomb and truss structures are used as lightweight structures and shock-absorbing materials in various industries, including aerospace, architecture, automobile, and electronic industries.12,13 Lattice structures fabricated by AM techniques have many advantages compared to solid structures and porous structures formed by conventional manufacturing techniques.7,14–20 In the field of vibration isolations, the benefits of AM processes comprise low mass architecture, high absorption capacity for impact loading, and a high degree of freedom in the design and properties of the cellular structures. The lattice designs in AM provide the freedom for the development of the lattices with material grading to provide variations in the structural properties with well-regulated deformation and a low chance of failure. 21 Also, designing lattices facilitate topologically optimised structures to bear the loading under unpredictable conditions.22–24 The conventional techniques of vibration isolations do not ensure the complete extinction of the pulses at the designed frequency.25,26 Hence, additively manufactured designs of phononic band gap (PBG) lattice can help in the process of vibration isolations by developing the structure with lower resonant frequency and topologically optimisation of the architectures in a selected range of the frequencies of excitations. PBG structures restrict wave propagation at specific frequencies by Bragg scattering. Many of the PBG structures have been reported by researchers for various applications. Ampatzidis et al. 21 analysed the banded behaviour of the additively manufactured one-dimensional composite structure. This work developed a band gap structure to act as an acoustic isolator. Lucklum and Vellekoop 27 discussed the suitability of AM techniques for the fabrication of miniature and three-dimensional phononic structures. Additionally, a comprehensive characterisation of phononic cubic crystal lattice was performed. The results were observed such that the inside and outside transmission losses differed as per the lattice orientations. Matlack et al. 25 fabricated a structure with AM process for supporting the formation of low-frequency and wide-band gaps while reducing their overall mass. The result concluded that the design strategy facilitated the fabricated structure for applying in the vibration isolations, shock mitigations, and noise proofing. Wormser et al. 28 presented a methodology for the parametric shape optimisation and maximisation of phononic bands. The resulting design principle was used to fabricate a three-dimensional part by utilising the electron beam melting AM process. The manufactured structure developed a band gap below the audible frequency, justifying that the structure was effective in noise isolation. The detailed literature study revealed that researchers had worked substantially to develop lattice structures by using various AM techniques.29–31 Further, the benefits such as complex design manufacturing, functional part development and material selection freedom of additive manufacturing, etc. are pushing researchers to design and develop tailored lattice structures for various applications like vibration isolation.23,32 Additive manufacturing enables innovative structural design for industrial applications by allowing the fabrication of lattice structures with enhanced mechanical properties like a high strength-to-relative-density ratio.5,21 However, to commercialise lattice structures, it is necessary to define the designability of lattice geometries and characterise the associated mechanical responses, including the compressive strength. 33
The present work includes the design, printing, and mechanical testing, including vibration isolation, of the three different formations, Diamond, Kelvin, and Octa. Fused Deposition Modelling (FDM)S was used to print the specimens with PLA filament. Further, three densities (low, medium, and high) have been chosen to explore the physical behaviour and vibration isolation properties. Various experiments have been performed, such as compression test, energy absorption behaviour, and vibration isolation test. This study aims to provide an optimized design process for lattice structures and carry out a lattice structure characterisation that can be used to differentiate unit cell topologies and guide the unit cell selection for compression-dominated structures.
Materials and method
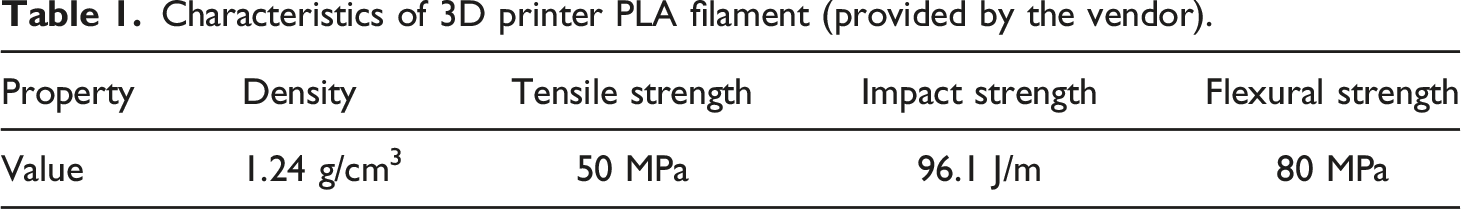
Characteristics of 3D printer PLA filament (provided by the vendor).
3D printing
A fused filament fabrication (FFF) based Prusa MK2 machine single extruder machine was employed for the 3D printing of lattice structures. Using the computer-aided design (CAD) program Magics, the specimen’s design was developed, as shown in Figure 1. Three different designs of unit cells were chosen for the lattice structures, such as Diamond, Kelvin and Rhombic Octahedron. CAD model of the unit cell, uniform, and graded foam along with dimensions and naming description.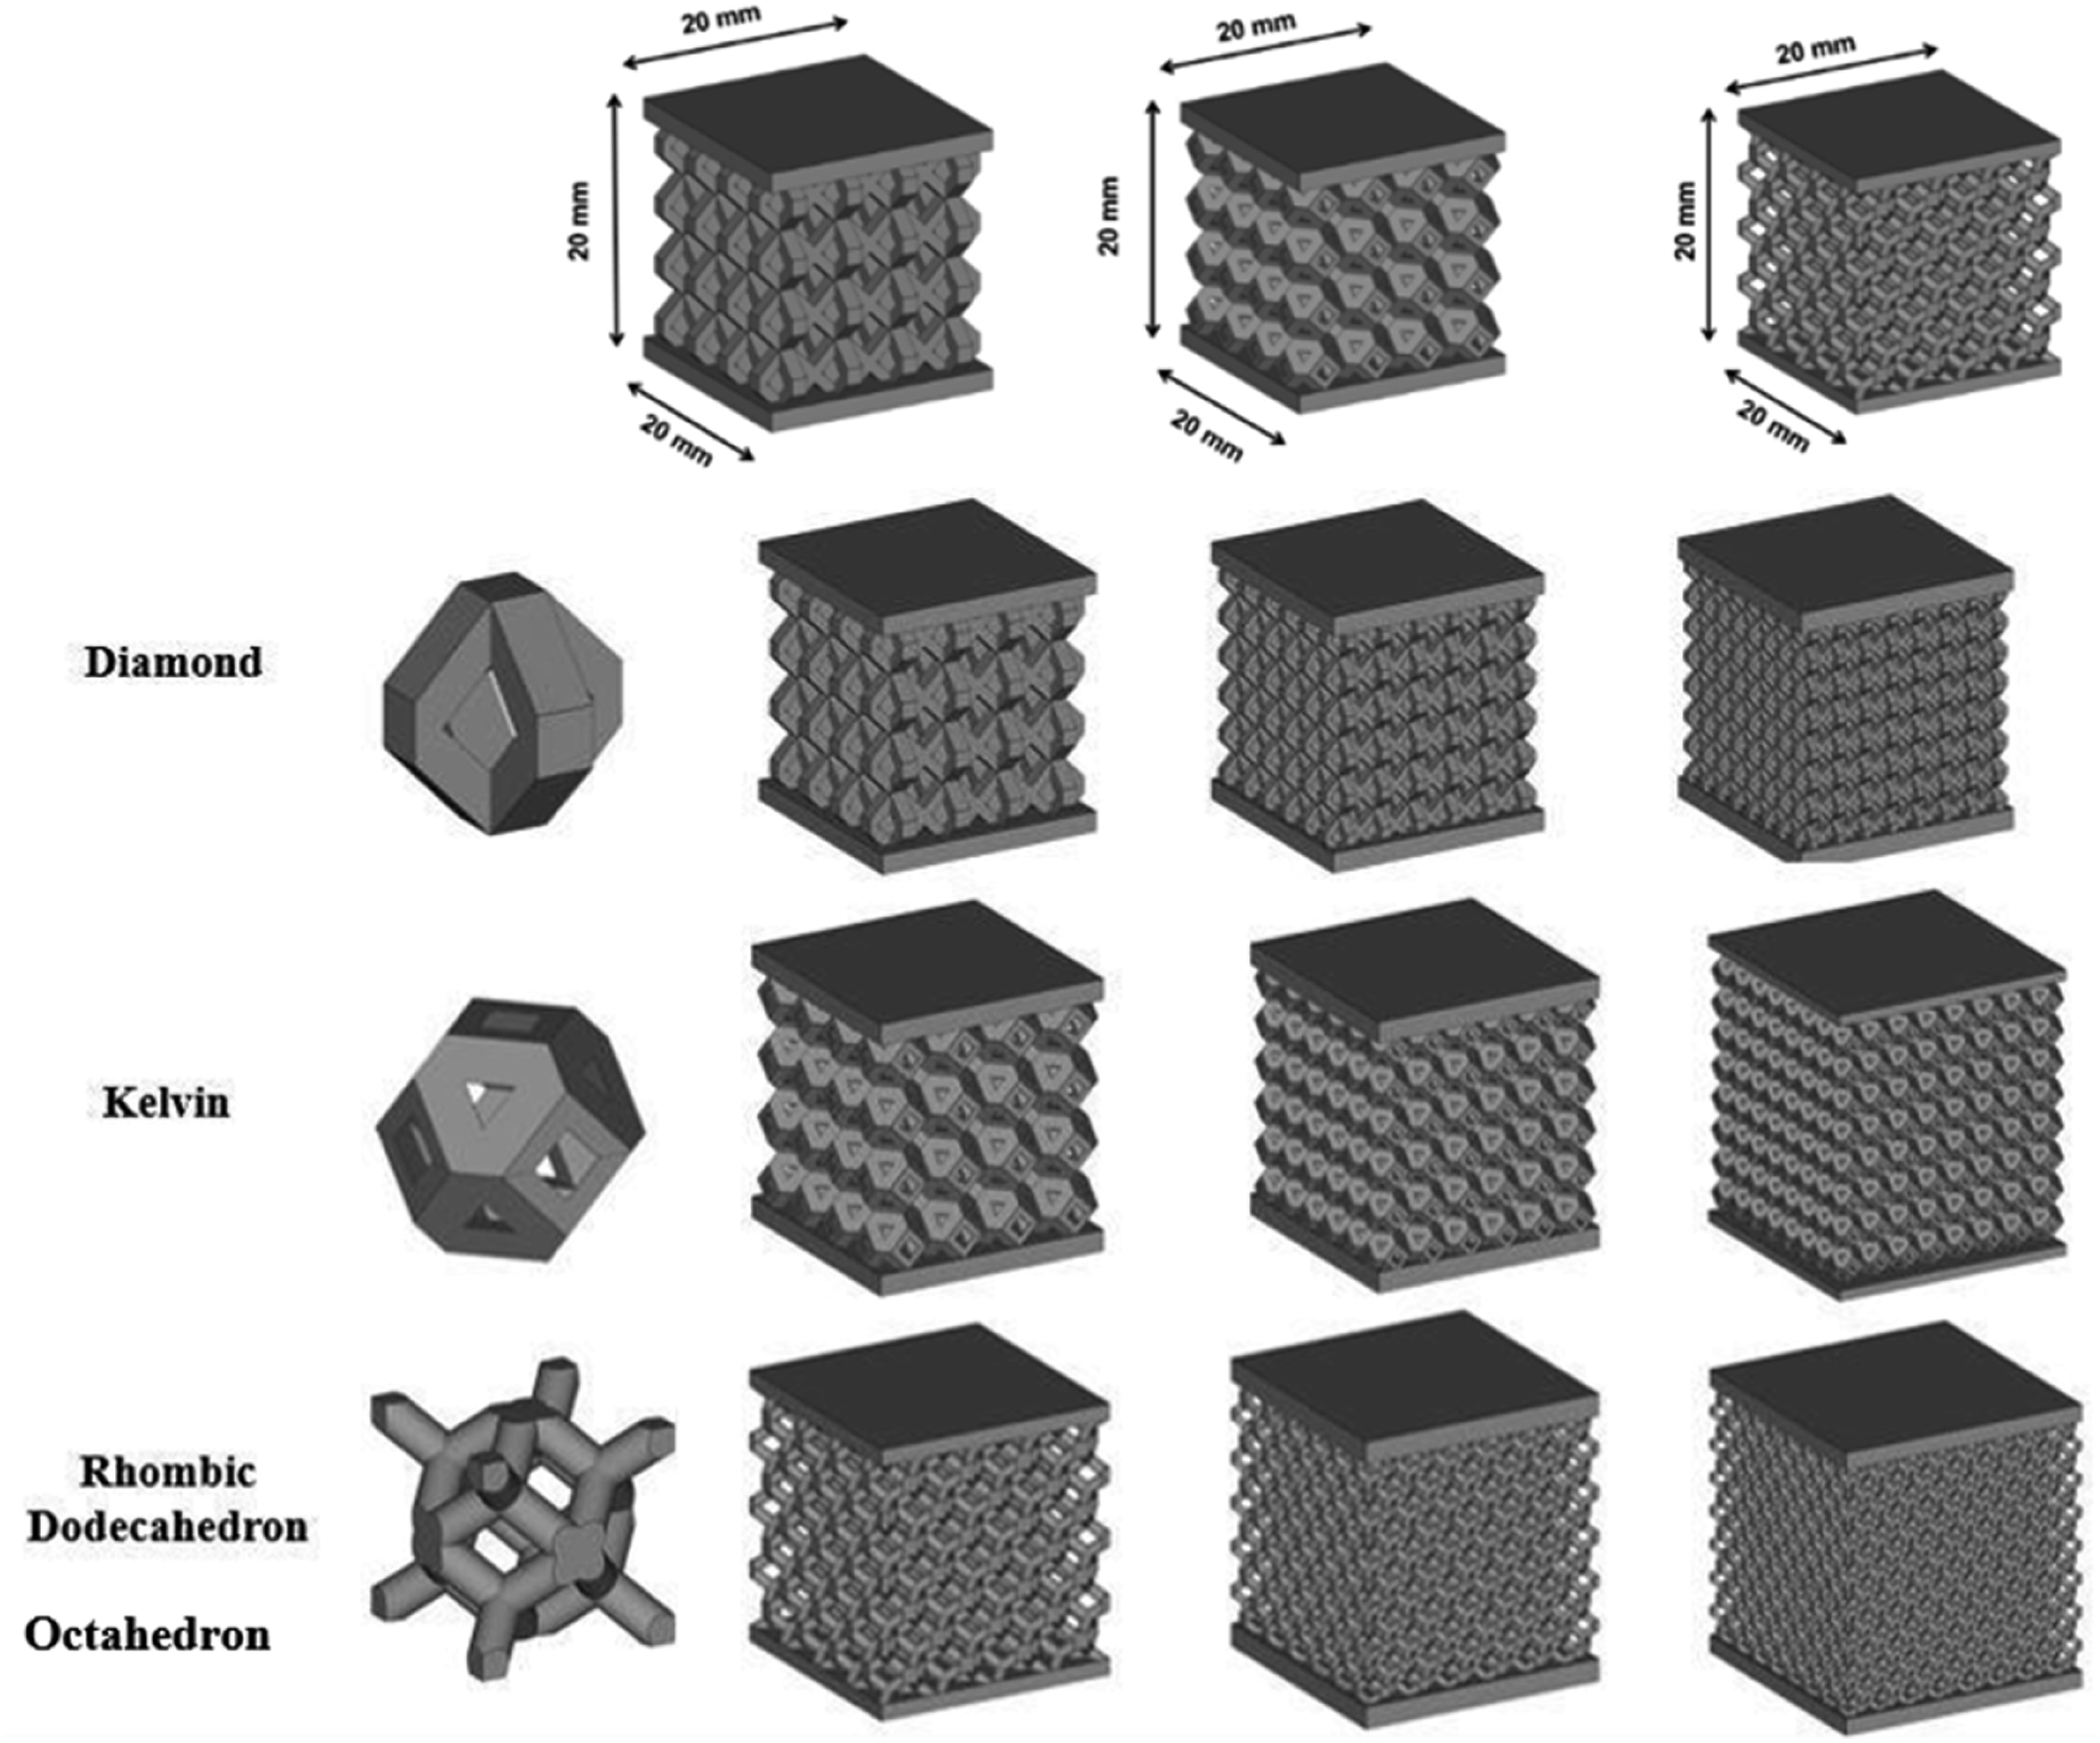
According to the literature, these unit cells were based on their excellent mechanical-to-weight ratio. A total volume of 20 × 20 × 20 mm was selected for the fabrication, including plates of 2 mm on the top and bottom sides of the lattice structures. Three different samples of each unit cell were designed, with other volumes having 4-, 6- and 8-unit cells in each direction. These are named as Low (L), Medium (M) and High (H) dense structures. The samples were printed with a polylactic acid (PLA) material (Solidspace, India). All the parts were printed with 0.15 mm layer thickness, 25 mm/s printing speed, 0.4 mm nozzle diameter, 195°C extruder temperature, and 100% infill.
Morphology study
The geometrical morphology of the 3D printed foams was analyzed using Dino lite microscope. The microscope was calibrated using a calibration scale and employed to capture the unit cell size and strut size from the 3D printed part. The data was recorded from three different places. The average was calculated along with the standard deviation.
Mechanical testing
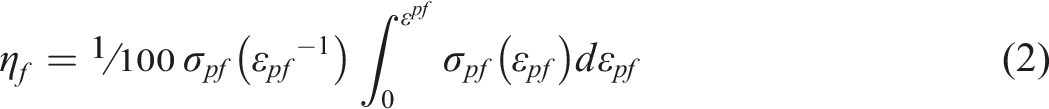
Samples for the compression testing were designed as per ISO 13,314. The compression tests were performed by employing Instron 5582 universal testing machine (UTM). The traverse velocity was kept at 0.5 mm/min. The load and change in length data were measured from the machine. Stress was calculated by the ratio of load to cross-sectional area, and the ratio of change in length to the actual length of the samples calculated the strain. The linear region slope of the stress-strain curve was used to calculate Young’s modulus. The stress, at the first peak of the stress-strain curve, was measured as the compressive strength. The plateau stress was calculated from the mean of the compressive stress till the densification strain. To visualise the deformation behaviour of the polymer foams during compression tests, Dino-Lite camera with 55 frames/sec was used. To observe the energy absorption capacity of the polymer foams, area under the curve was calculated from the stress-strain curve till the densification strain as per ISO 13,314 (ref. equation (1)).
The densification strain will be the value of strain at the maximum value of the efficiency strain curve.
Vibration isolation
The vibration tests were carried out using an electromagnetic shaker in accordance with the standard BS EN ISO 13,753:2008. As seen in Figure 2, a specimen with the same dimensions as that used in compression testing was attached to the shaker platform. To measure the responsive acceleration, another measurement accelerometer (PCB 352A56 with a sensitivity of 101.7 mV/g and a measuring range of 50 g) was adhesively installed on top of the sample. Acceleration transmissibility, defined as the ratio of the acceleration of the load mass to that of the shaker platform, was used to assess the vibration isolation behaviour of the foam samples. To determine the acceleration transmissibility at various frequencies and excitation levels, shaker was harmonically stimulated with frequencies ranging from 4 to 500 Hz and the peak acceleration varied from 0.1 to 0.5 g, where g = 9.8 m/s2. For each test condition, three specimens were tested. Experimental setup for vibration transmissibility of polymer foams.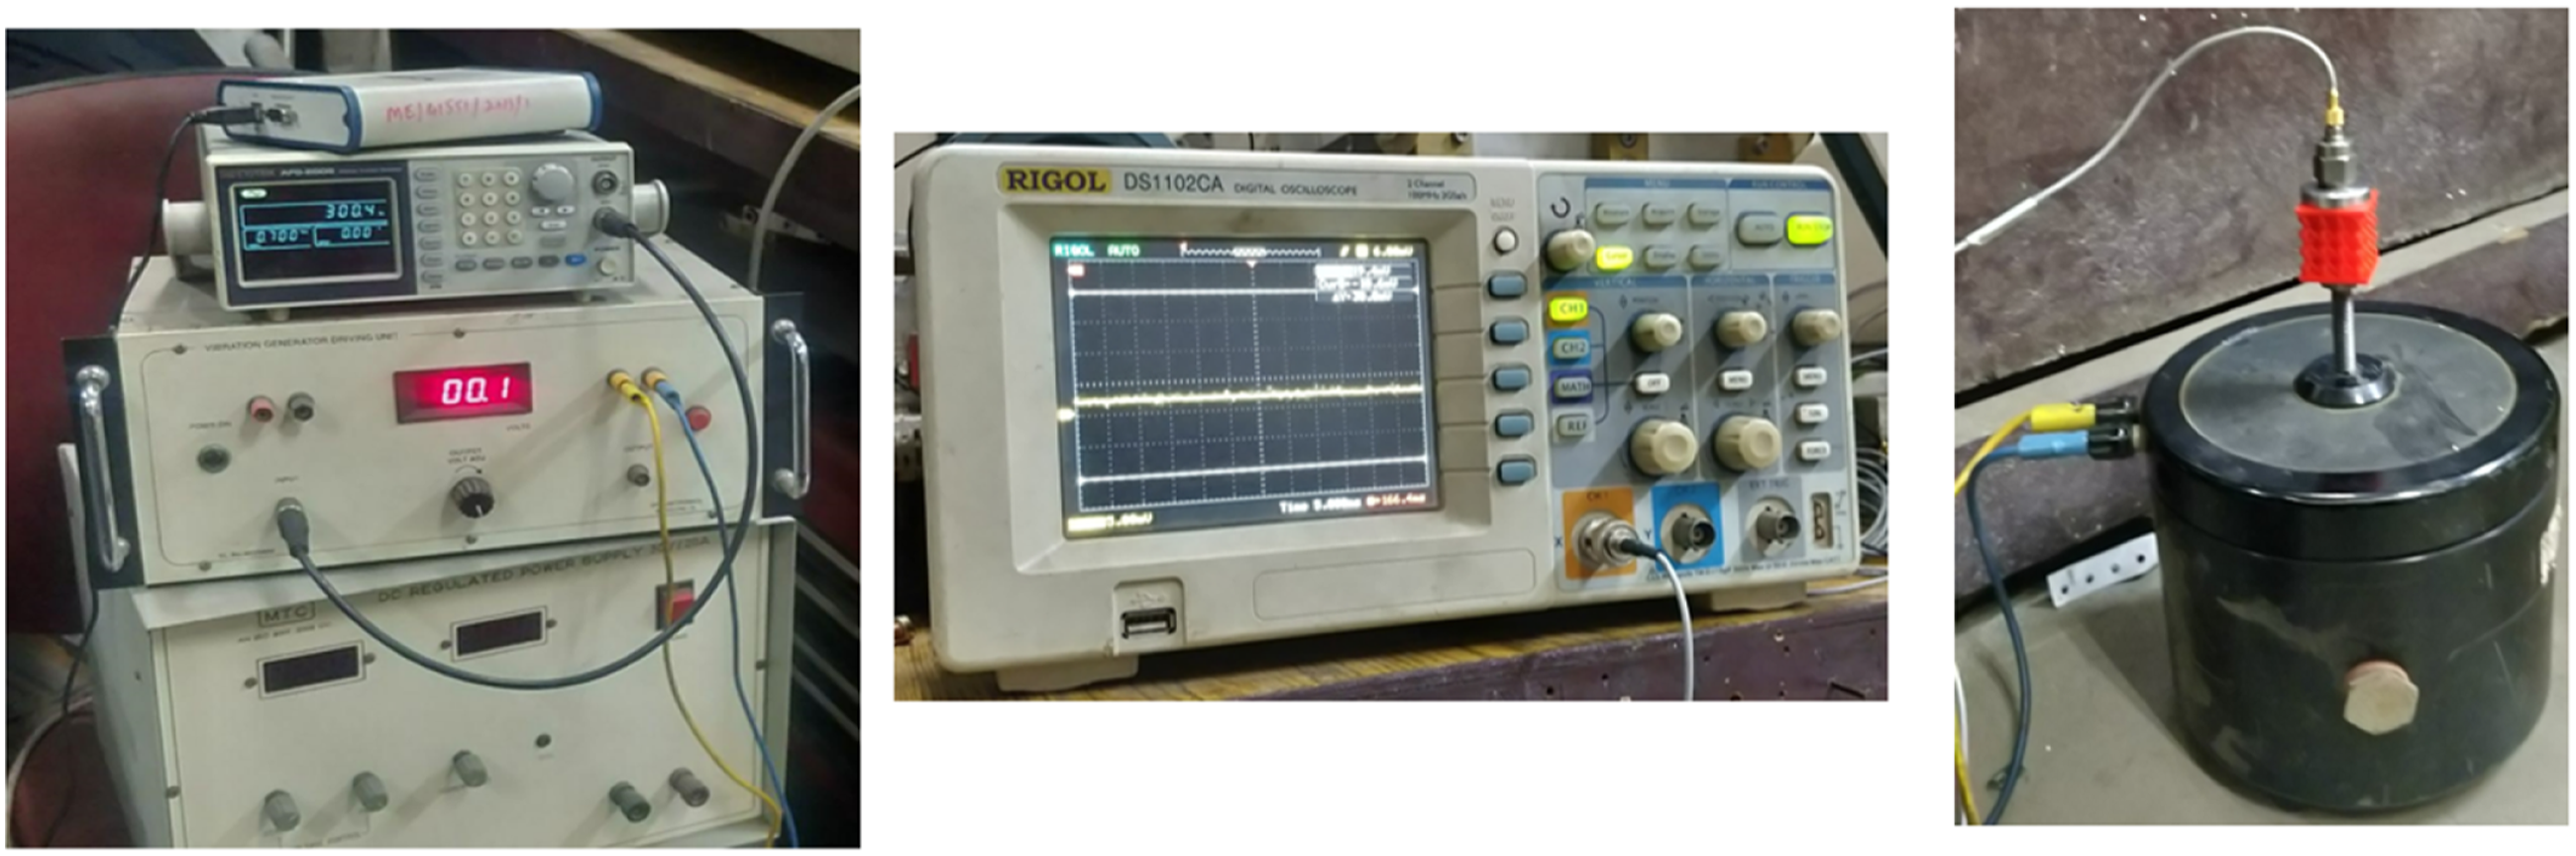
Results and discussion
The 3D printed lattice samples of PLA material with different unit cell designs, such as Diamond, Kelvin and Rhombic Octahedron, are shown in Figure 2. Three different samples of each lattice structure have been printed with low, medium, and high-volume unit cell’s fractions, in turn, a total of nine samples have been prepared. Dino lite microscope was employed to measure the unit cell and strut size of the 3D printed samples (Figure 3). The geometry deviation of a unit cell and strut size of the 3D printed lattice structure from the designed CAD model was compared and given in Table 2. 3D printed samples. Geometry deviation of 3D printed lattice structure from CAD model.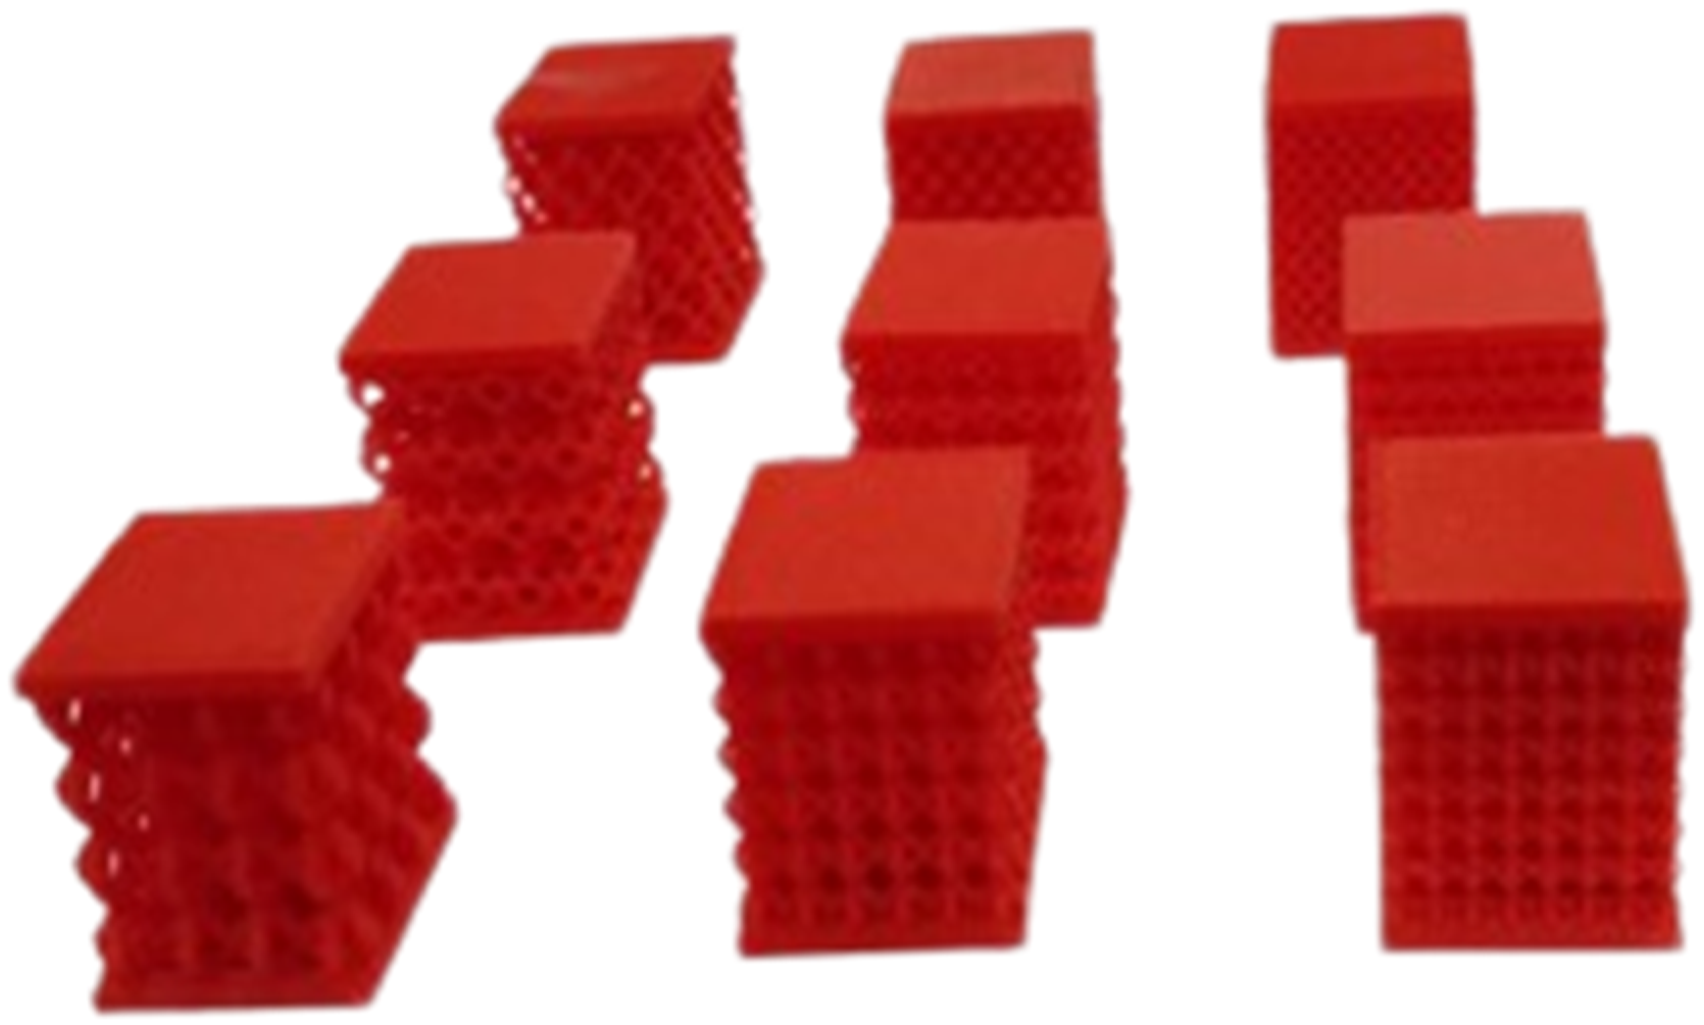
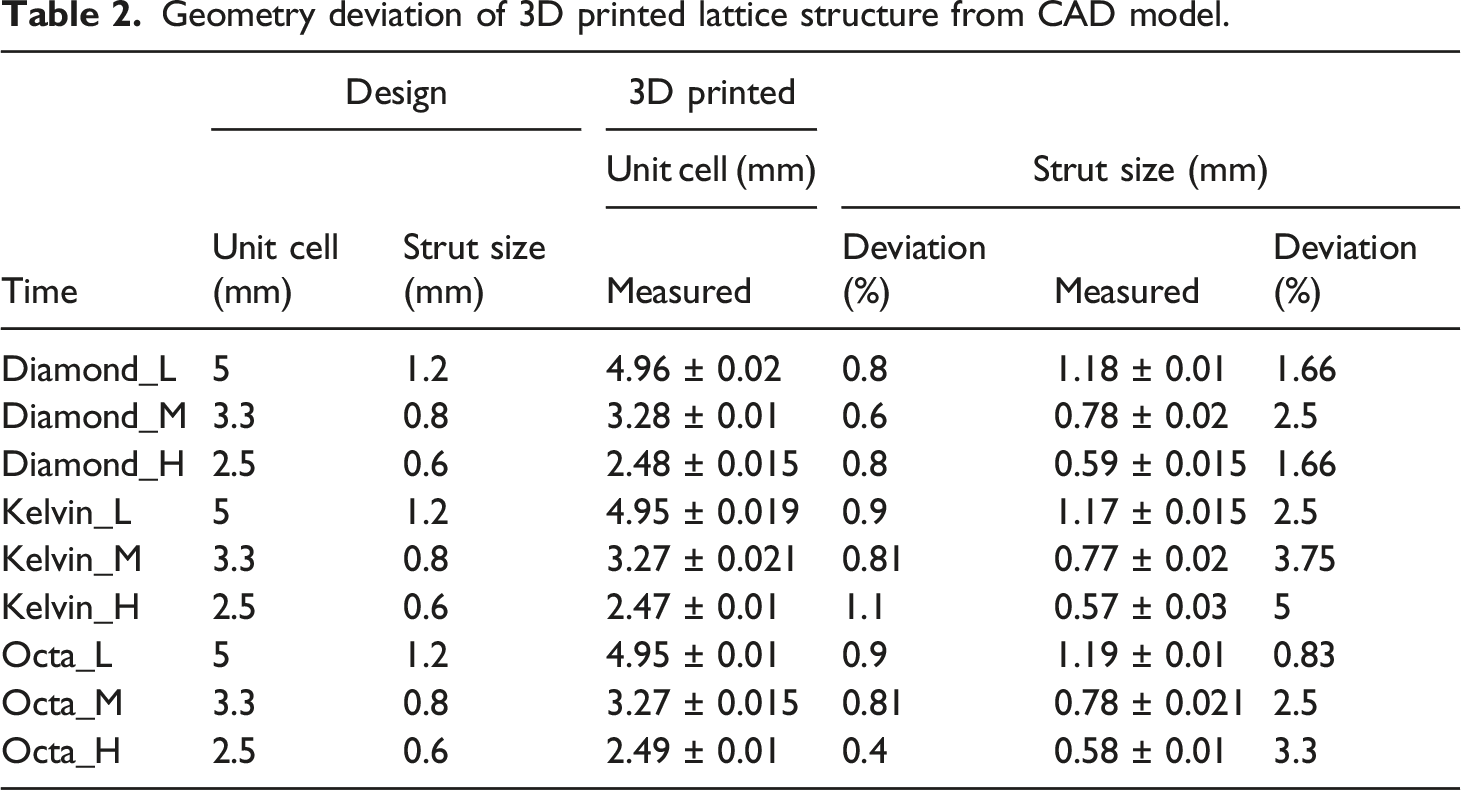
Diamond-based lattice structure has shown less variation in unit cell size from 0.6 to 0.8% and strut size from 0.59% to 1.18%. The significant deviation in the unit cell and strut size of Kelvin unit cell-based lattice was observed from the CAD model. It was 0.81%–1.1% in the unit cell and 2.5%–5% in the strut size. Deviations of 0.4%–0.9% and 0.83%–3.3% for the octahedron-based lattice structures were found in the unit cell size and strut size compared to the CAD file. The significant deviation for the Kelvin-based unit cell could be due to the difference in structure, which resulted in significant shrinkage as compared to the other unit cells.
Mechanical properties
After preparing the samples, compression tests were conducted to obtain the force-displacement diagram, which was then used to obtain stress-strain graphs and the ultimate compression strength, Young’s modulus, and plateau stress. Young’s modulus was obtained from the stress-strain values, and plateau stress was calculated with MATLAB code. The results of the compression experiment were presented as graphs of stress versus strain. The stress was determined by dividing the axial load by the cross-sectional area of the manufactured test samples. The strain was calculated by dividing the crosshead displacement (change in length) by the original value. The stress-strain behaviors of the simulated models mimicked the ideal behaviors of the foam with three regimes; (1) elastic regime, in which the stress and strain increased linearly up to Young’s modulus of the structure, (2) plateau regime, in which the stress did not change as much as the strain value and fluctuated around a mean value, and (3) densification regime, in which the stress value increased instantly due to the deformation of struts.
Compression and energy absorption study
The samples shown in Figure 2 are exposed to the compression analyses and force-displacement diagrams have been obtained which were used to obtain stress-strain graphs shown in subsequent figures. In the next section, the behaviour of the structures is compared to the pictures obtained during the test.
Figure 4 depicts the stress-strain curves and deformation behaviour of the samples as captured by the Dino-lite video camera during the compression test. As previously stated, stress-strain graphs were derived from the force-displacement behaviour of the structures. After obtaining the stress-strain graphs, the graphs were compared to the compression test deformation photographs. The graphs and images were viewed in conjunction with one another. Then, the graphs of the high-, medium-, and low-density structures were compared. In each instance, a rise in stress value has been observed due to the structure’s resistance. In the scenario of low density, however, a rise in the stress value was detected until 6%–9%, and shortly after, at 10%, a drop in the stress was observed due to a rapid structural failure. The curve gradually declined from 10% to 25%, followed by an increase to a 30% strain rate. A similar trend was observed in the photographs. After this point, the curve remained constant until 60%. The structure continued to rupture gradually until this point. Further, due to its increased density, it began to offer more resistance, resulting in a rise in the curve. In the case of medium density, the curve demonstrates a sharp dip at 8%, which continues until the range of 15%–20% and then stabilizes at 35%. The medium-density structure was seen to be capable of retraining up to 5 MPa of stress, and the drop in the curve after rupture was not as steep as it was for the low-density structure. In this instance, the progressive increase in strain rate has been observed for a substantially longer period after 40%. In the case of the high-density diamond formation, a very similar pattern was observed up to 20% strain, after which the curve exhibited a steady pattern due to the structure’s high density. The explanation for this trend is that the material resisted from the start to the point of complete rupture. (Figure 5) (a) Stress-strain curves along with (b) deformation behaviour of the diamond lattice structure. (a) stress-strain curves (b) deformation behaviour of the Kevin lattice structures.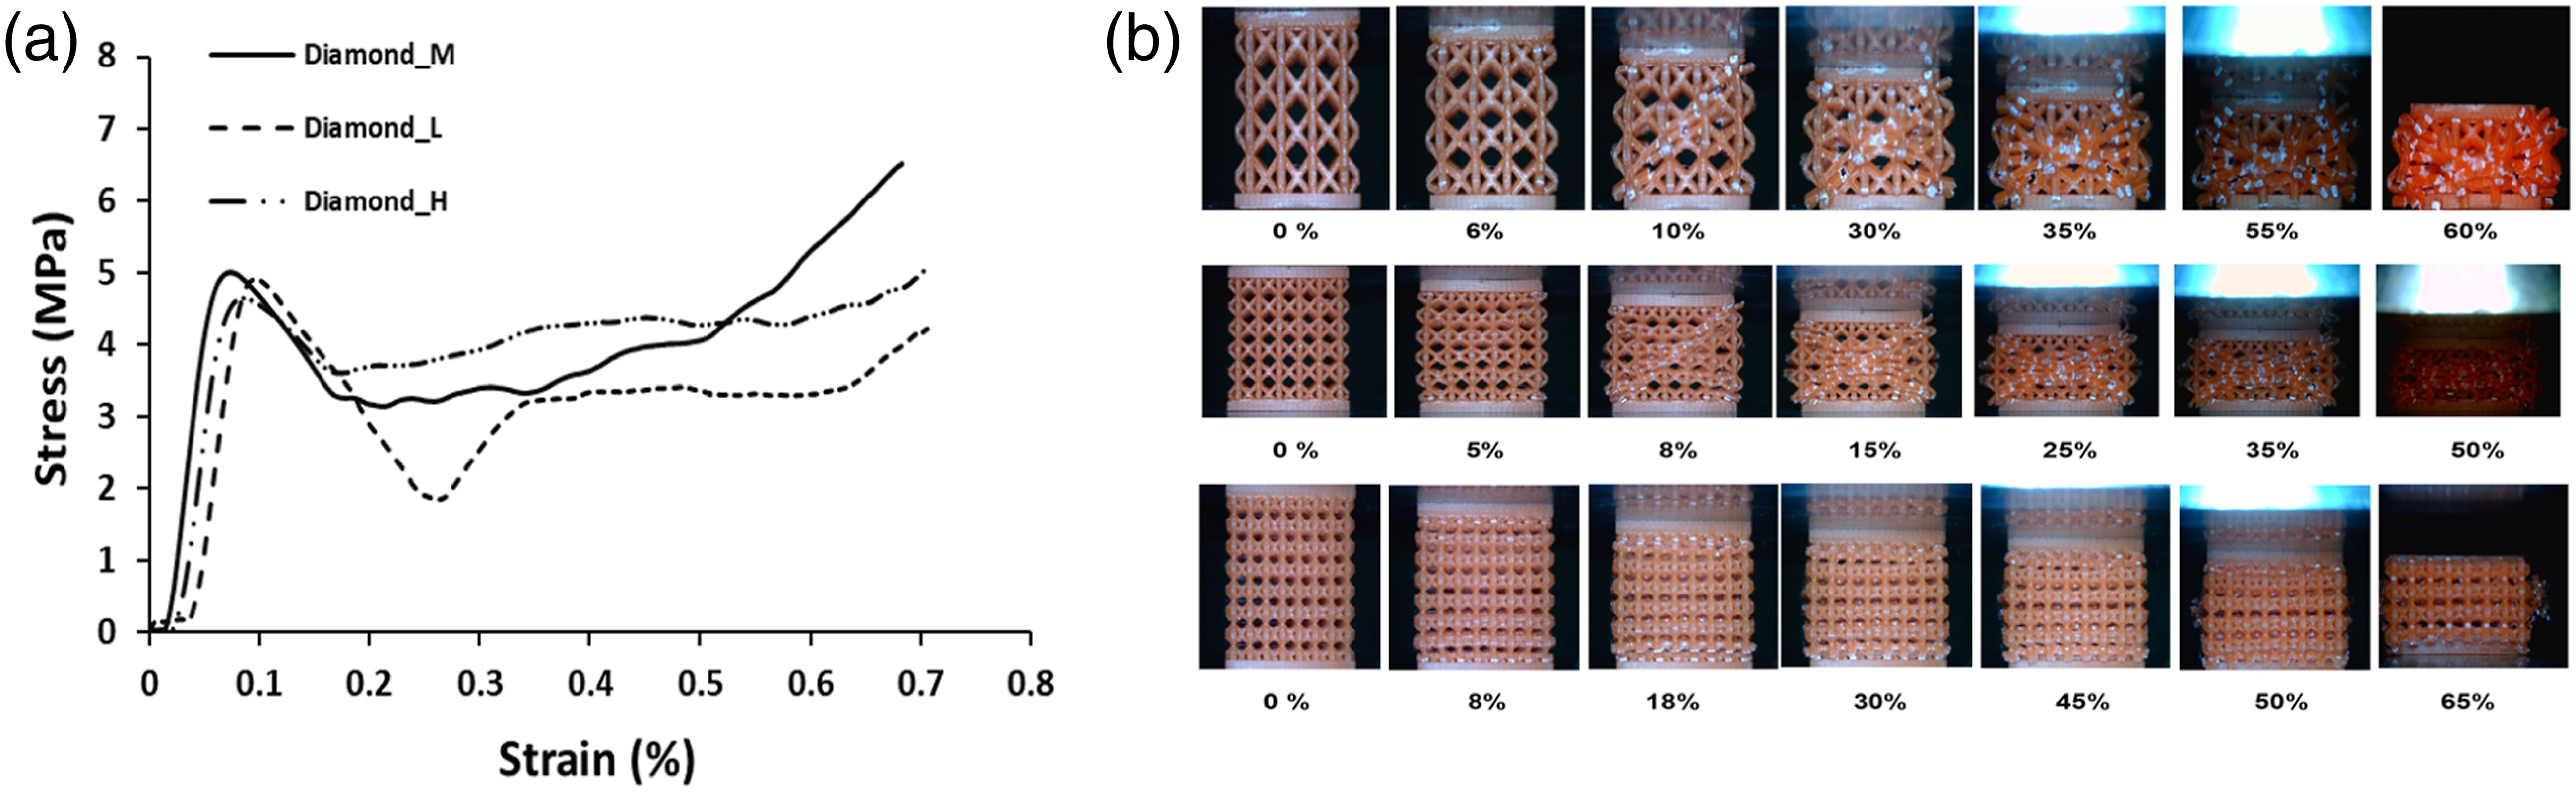
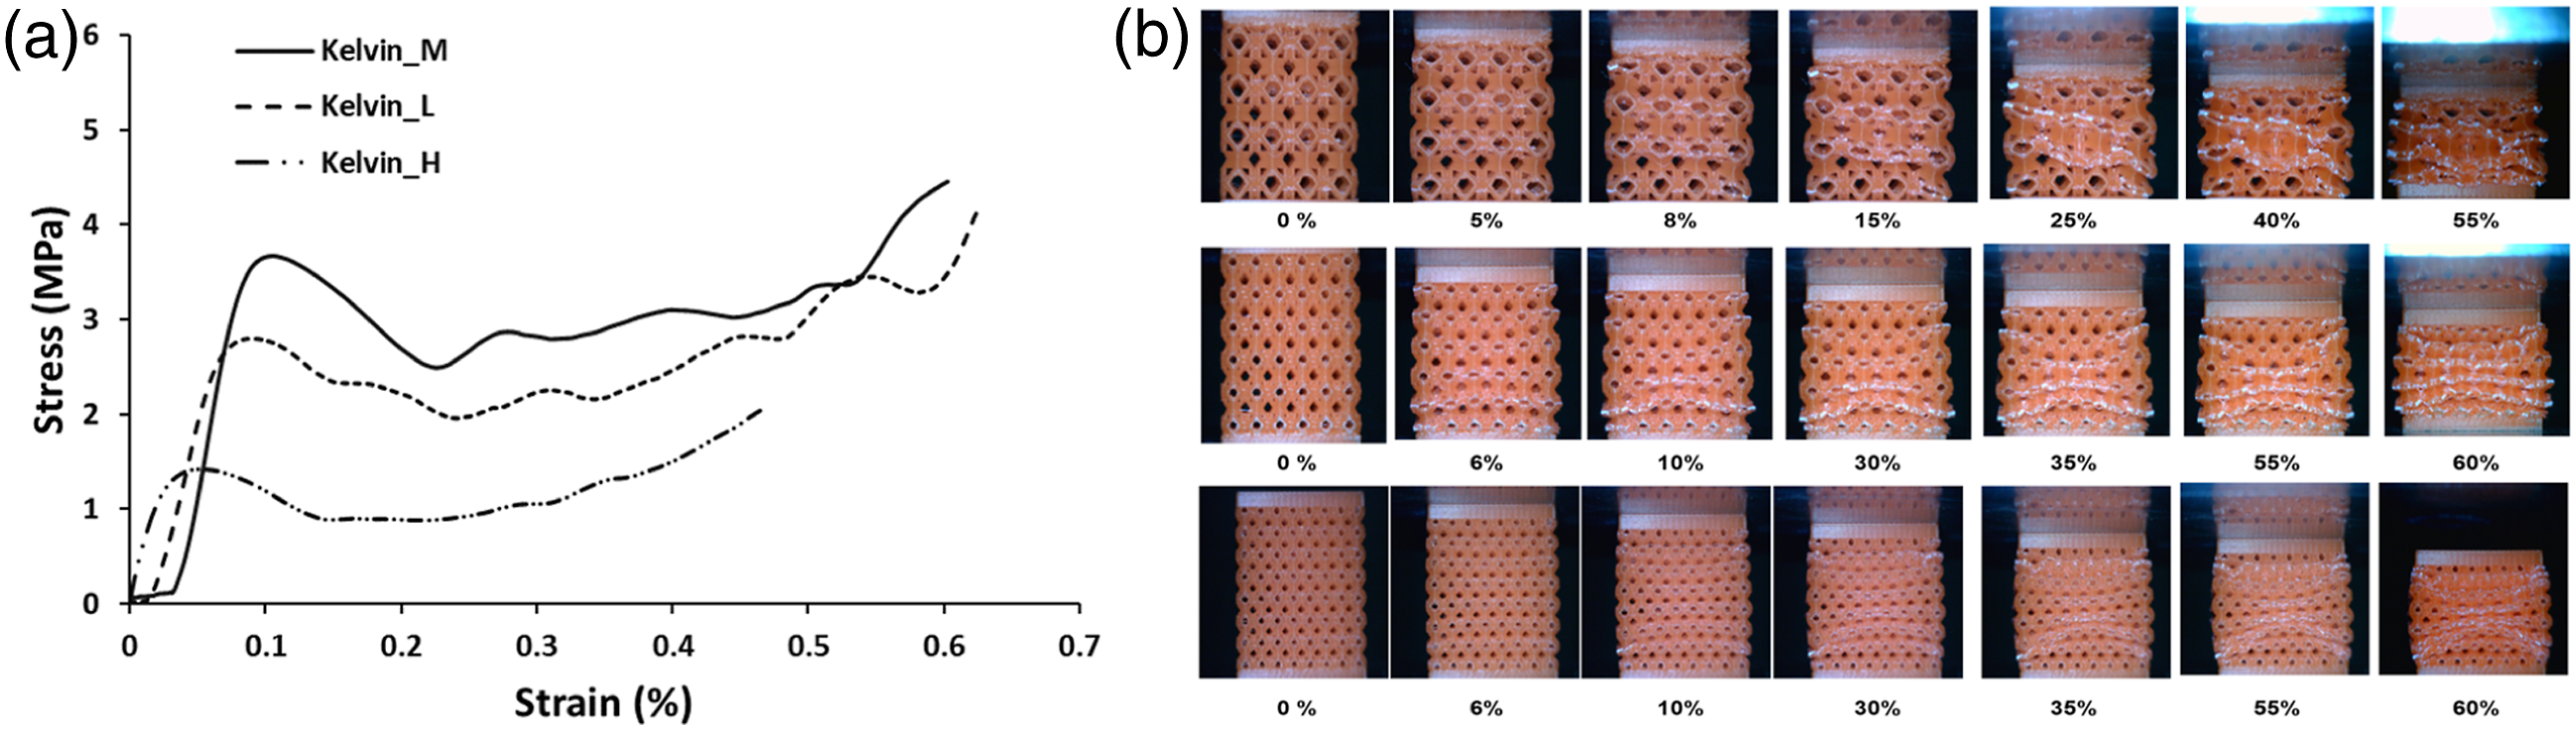
In the case of Kelvin, it can be observed that the structure with a medium density provided the highest resistance, and the stress was significantly greater than that of structures with low and high densities. When a load was applied, the stress curves continued to increase, and the maximum resistance was observed at 3.5 MPa. However, the resistance of low- and high-density structures was significantly lower than that of medium-density structures. After the maximum peak value, a gradual decline to the 25%–30% strain range with a maximum stress of 2.5 MPa had been observed. Nonetheless, the curve exhibited a stable trend after 30% strain and maintained it until a 50% strain rate. It can be observed that after a certain value of stress or after resisting a certain value of the load, the structure ruptured and the density of the structure increased, resulting in the structure providing greater resistance. Due to this, the curve could be observed to ascend after a certain strain value. All graphs of the kelvin form exhibited a consistent trend, and although with much lower stress values. In the final instance of Octa formation structures, the trend of maintaining the integrity of the medium-density structure continued, and a stress maximum of nearly 5 MPa had been observed. In addition, the elastic range of the material demonstrated that the structure can withstand much less strain before failing. After 4%–5% strain, the material began to fracture, resulting in an increase in strain and a decrease in load value, indicating that the material’s load-bearing capacity had been drastically reduced.
After this stage, there was a gradual decline, followed by a gradual increase after 20% strain and nearly 3 MPa stress. However, the structure’s load-bearing capacity was significantly greater than that of the low- and high-density formations. In the cases of formations with low and high densities, the rupture occurred at 2.5 MPa and 1 MPa, respectively. In the case of low density, the curve obtained a stable trend after rupture, whereas in the case of high density, the curve continued to rise due to the increased density. Due to the metamaterial formation, the diamond structure emerged as the most resistant structure in nature after comparing all cases. Even though all the structures were metamaterial-like structures that derived their properties from geometry, the chemical composition of the materials determines their properties. Interestingly, in the case of the Diamond structure, all three variations exhibited consistent behaviour, whereas, in the case of Kelvin and Octa, a significant difference was observed between the low, medium, and high-density formations.
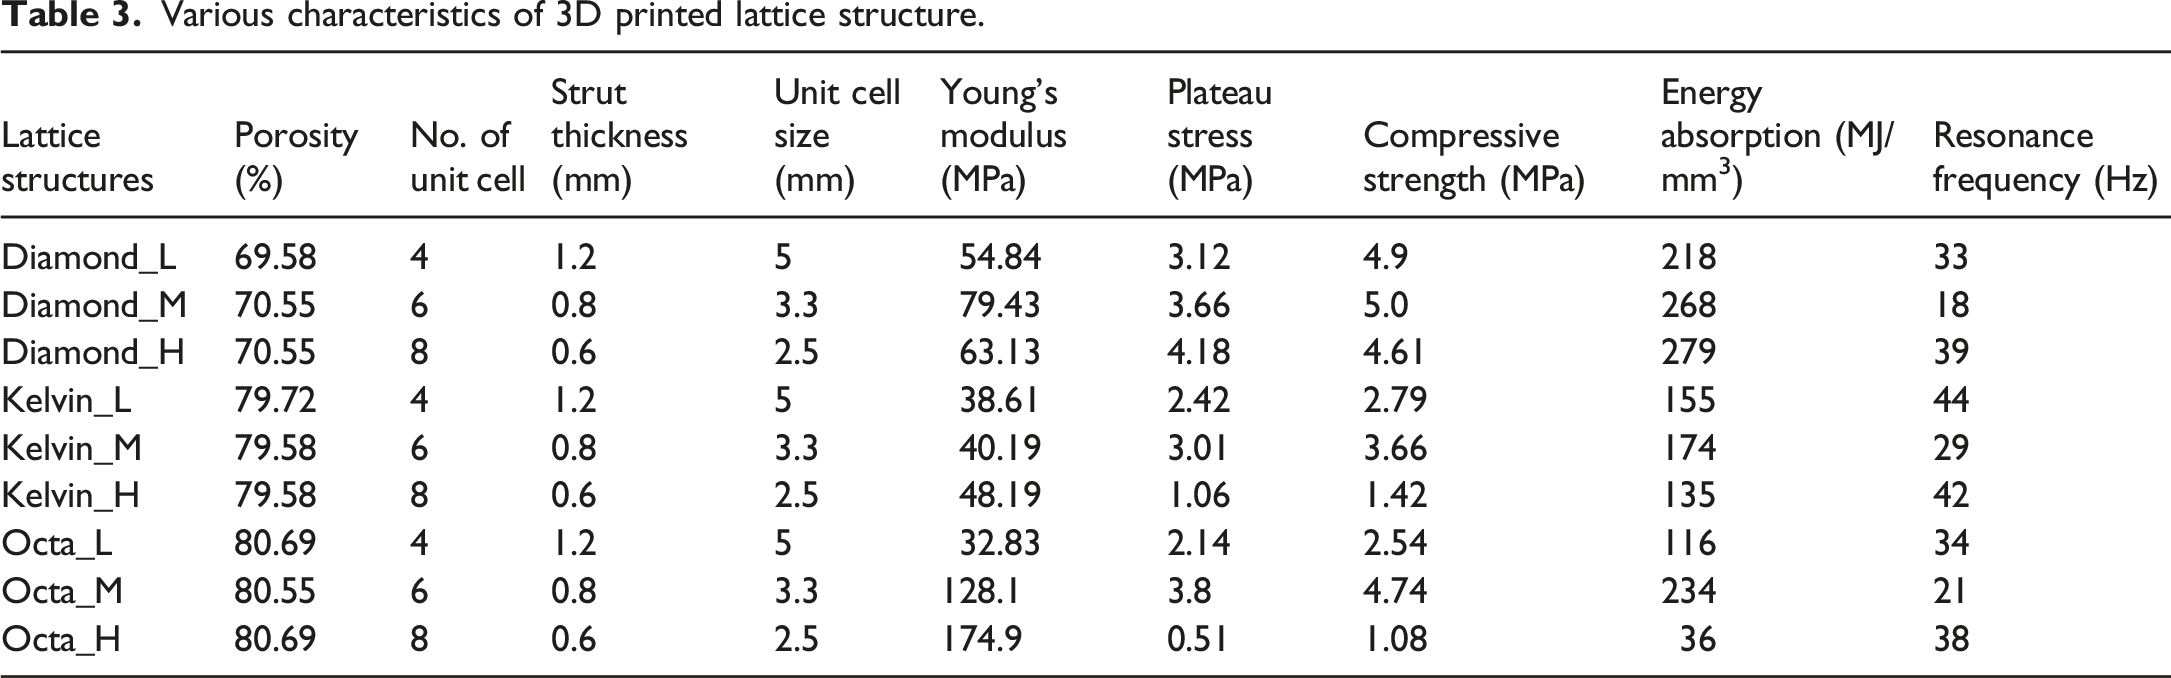
In this section, further properties have been discussed after the compression test, and Young’s modulus, Plateau stress, and Ultimate compression strength have been obtained. Young’s modulus had been obtained from the stress-strain diagrams and report in Figure 6 and the behavior can be seen in the same. It could be observed that the highest value of the young’ modulus had been obtained in the case of the high-density Octa formation which was 174.94 MPa followed by the medium-density Octa formation. Whereas the Kelvin formation had shown consistency throughout all the densities and the Diamond formation had shown best in the case of the medium density which was 79.43 MPa. In the case of the plateau stress, the Diamond formation has seen more resistance at 4.18 MPa, followed by the medium, and low-density formation. Interestingly the Octa formation had shown a very low value of the plateau stress in the case of High-density formation. Finally, the ultimate compressive strength had been obtained and the diamond formation had shown consistency in this field in two out of all the densities. In the case of Kelvin formation, the best value had been obtained in the case of medium-density formation followed by the low density and then high density. The Octa formation on the other hand had shown a very low value in the case of high density and had shown the best value in the case of medium density formation. From all these graphs interesting fact had been noted that the medium density formation in the case of Octa formation had given the better results in terms of Young’s modulus, plateau stress, and ultimate compressive strength. (Figure 7) (a) Stress-strain curves (b) deformation behaviour of the Rhombic octahedron lattice structures. Comparison of (a) Young’s modulus, (b) plateau stress and (c) ultimate compressive strength for low, medium, and high-volume fraction lattice structures of diamond, Kelvin and Rhombic octahedron unit cell.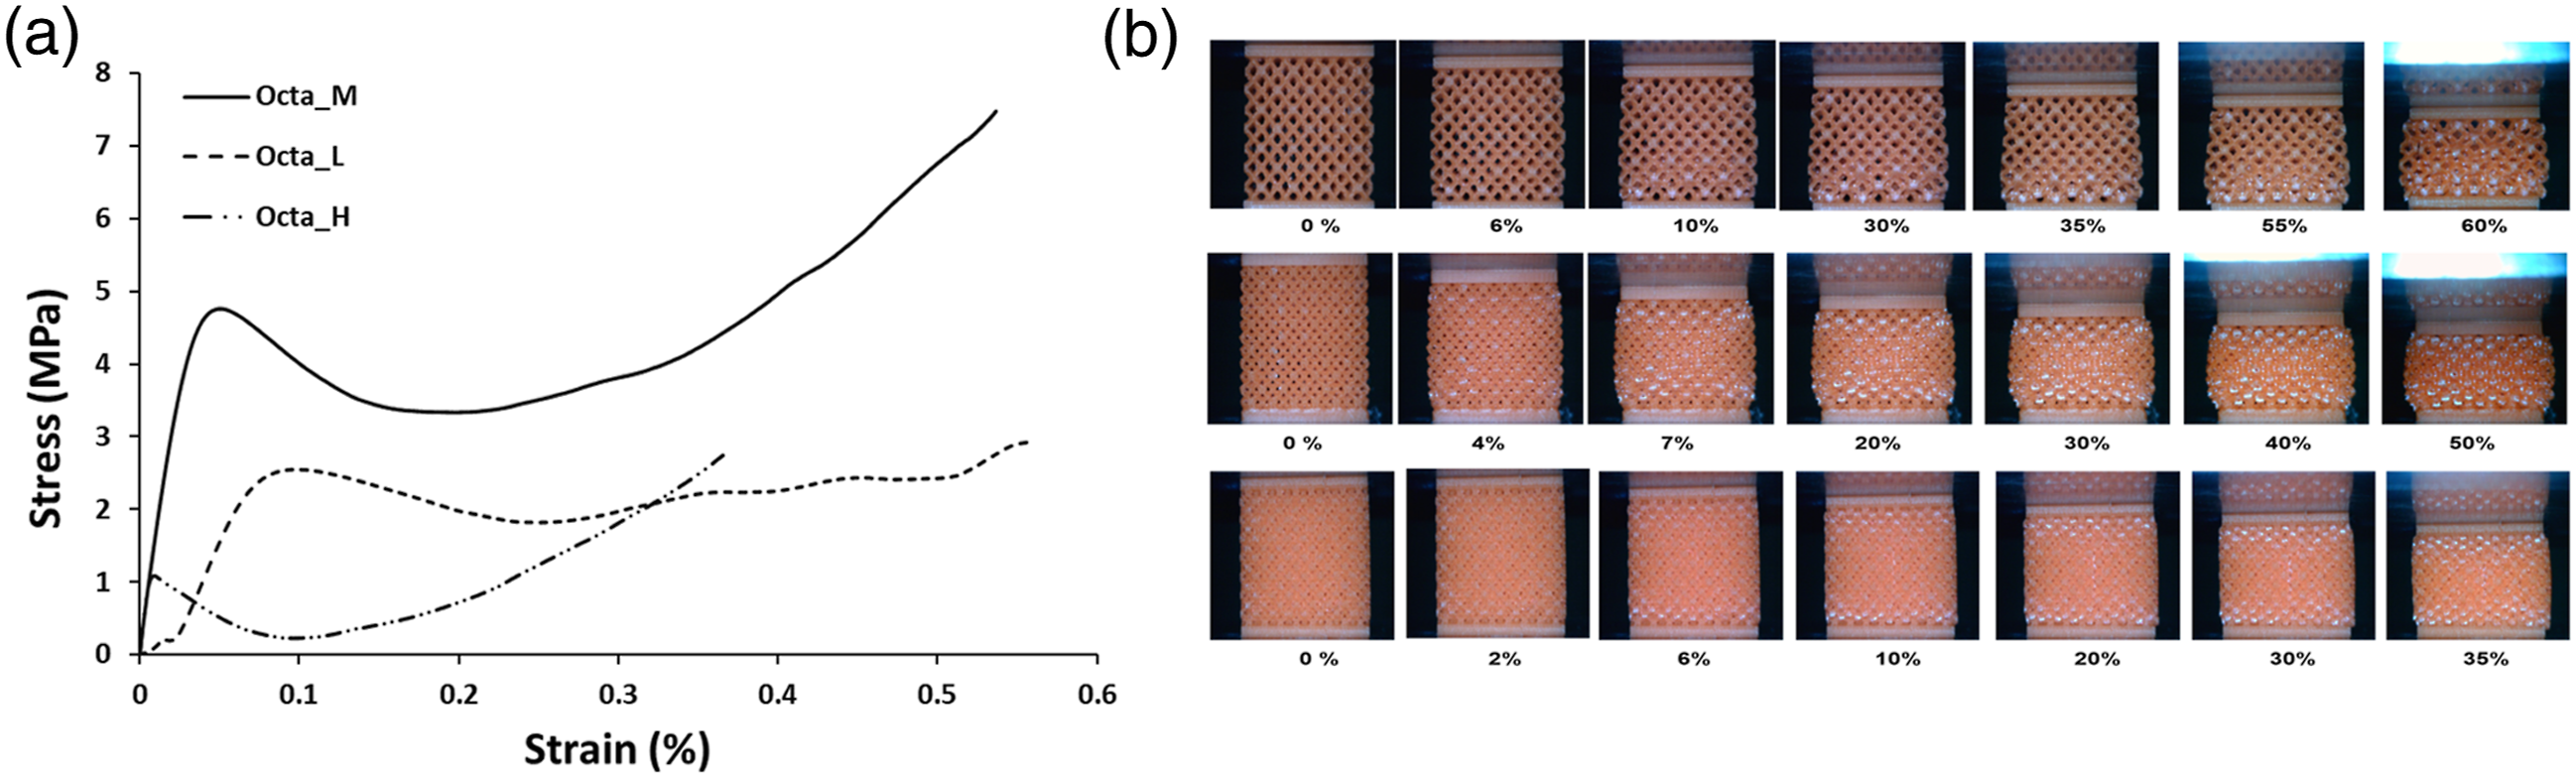
For the cellular structure, the energy absorption property is defined as Densification Strain which is termed a critical strain at which all the cell walls are packed together.
34
The measurement of the densification strain has been accomplished by the relation proposed by Ramon and Miltz.
35
The sublayer and multi-layer densification represented the multiple collapses of the struts attributed to the several kinds of vibrations. Due to this, conflicts in calculated densification strain were observed. The energy absorption efficiency for the diamond, Kelvin, and Octa form is shown in Figure 8. The densification strain in the energy absorption efficiency versus strain graph was considered at the point of a peak at a maximum which was also counted as a global maximum peak. All these observations were similar to the findings of Li et al.
36
Similar methods were used by Li et al.
36
for determining the densification strain values of the developed structures based on energy absorption efficiency. Figure 9 represents the energy absorption per unit volume versus strain for Diamond, Kelvin, and Octa forms which were calculated as the equation (1). It was observed that the energy absorption efficiency of the high-density and medium-density diamond foam was increasing concerning strain and maximum near the strain of 5% and 4%, respectively. In the Kelvin foam structure, the energy absorption efficiency in the low-density and high-density foams was higher in comparison to the medium-density Kelvin foam. The higher value of energy absorption efficiency was observed only for the low values of the strains. However, the medium-density Kelvin foam depicted an increase in energy absorption efficiency with an increase in strain near 4%. Among the three, the energy absorption capacity of the diamond form was found to be higher even for the increase in the strain rate. Energy absorption efficiency versus strain graph for diamond, Kelvin and Octa foams. Energy absorption versus strain graph for diamond, Kelvin, and Octa foams.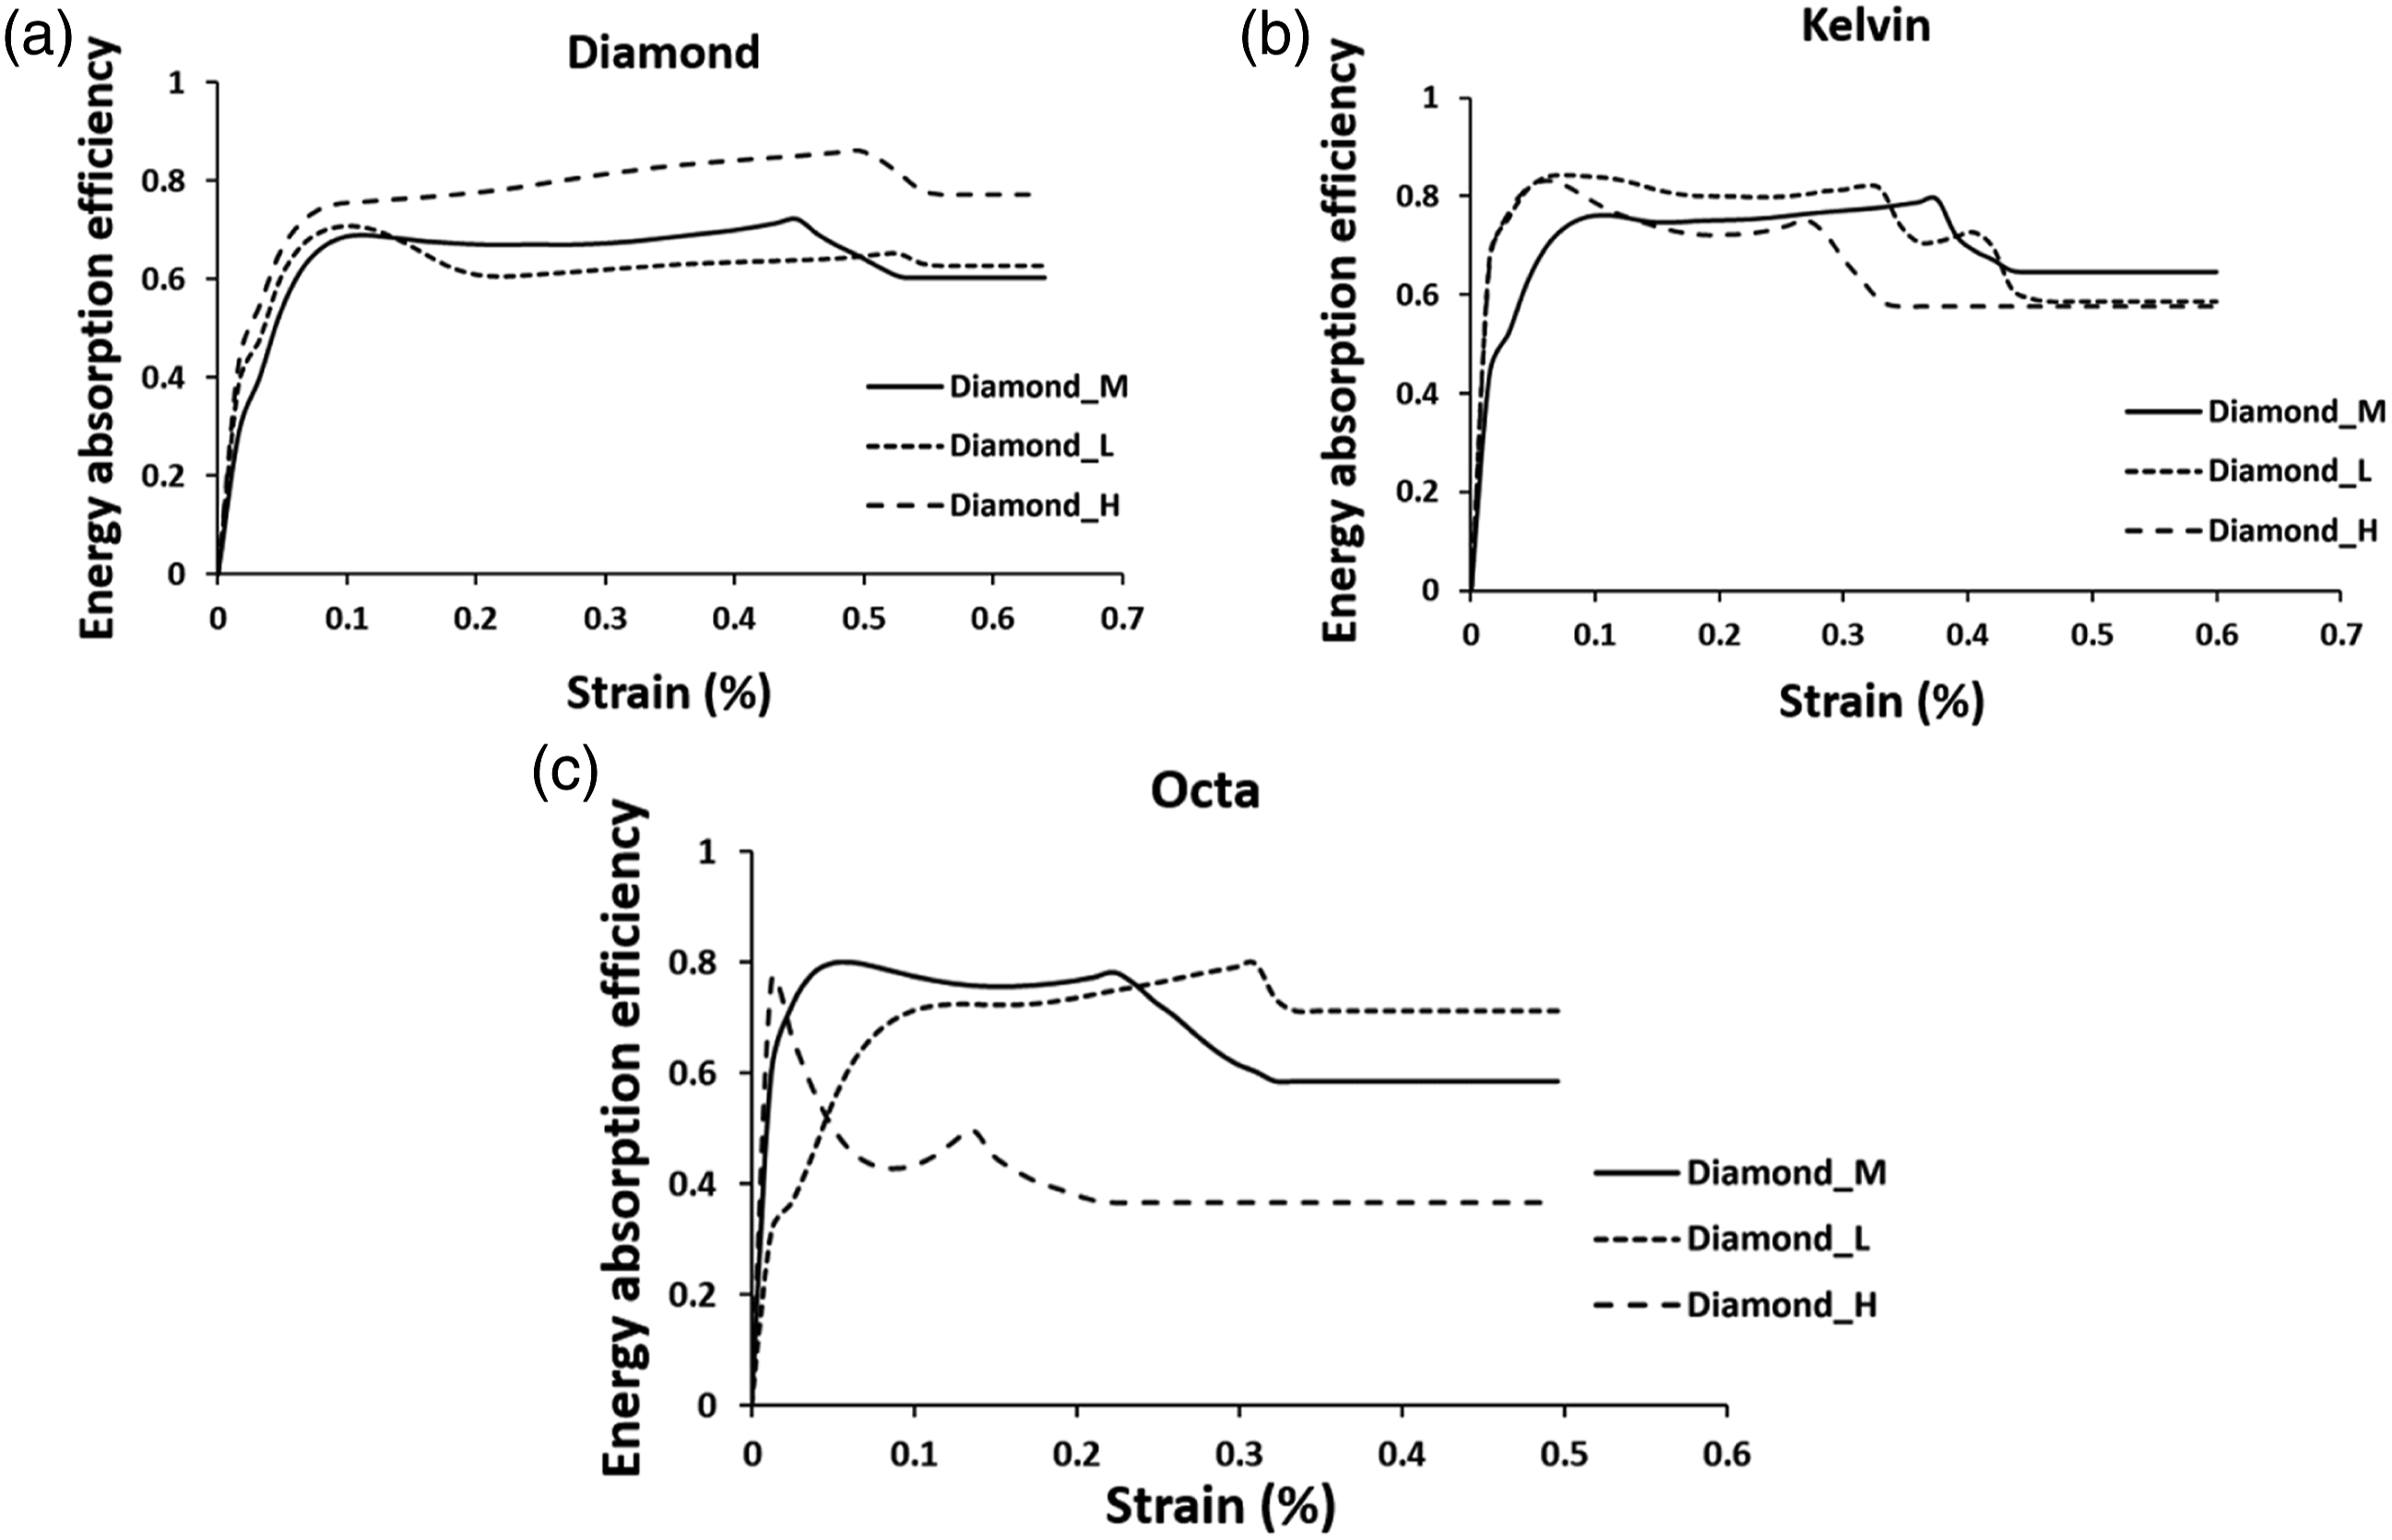
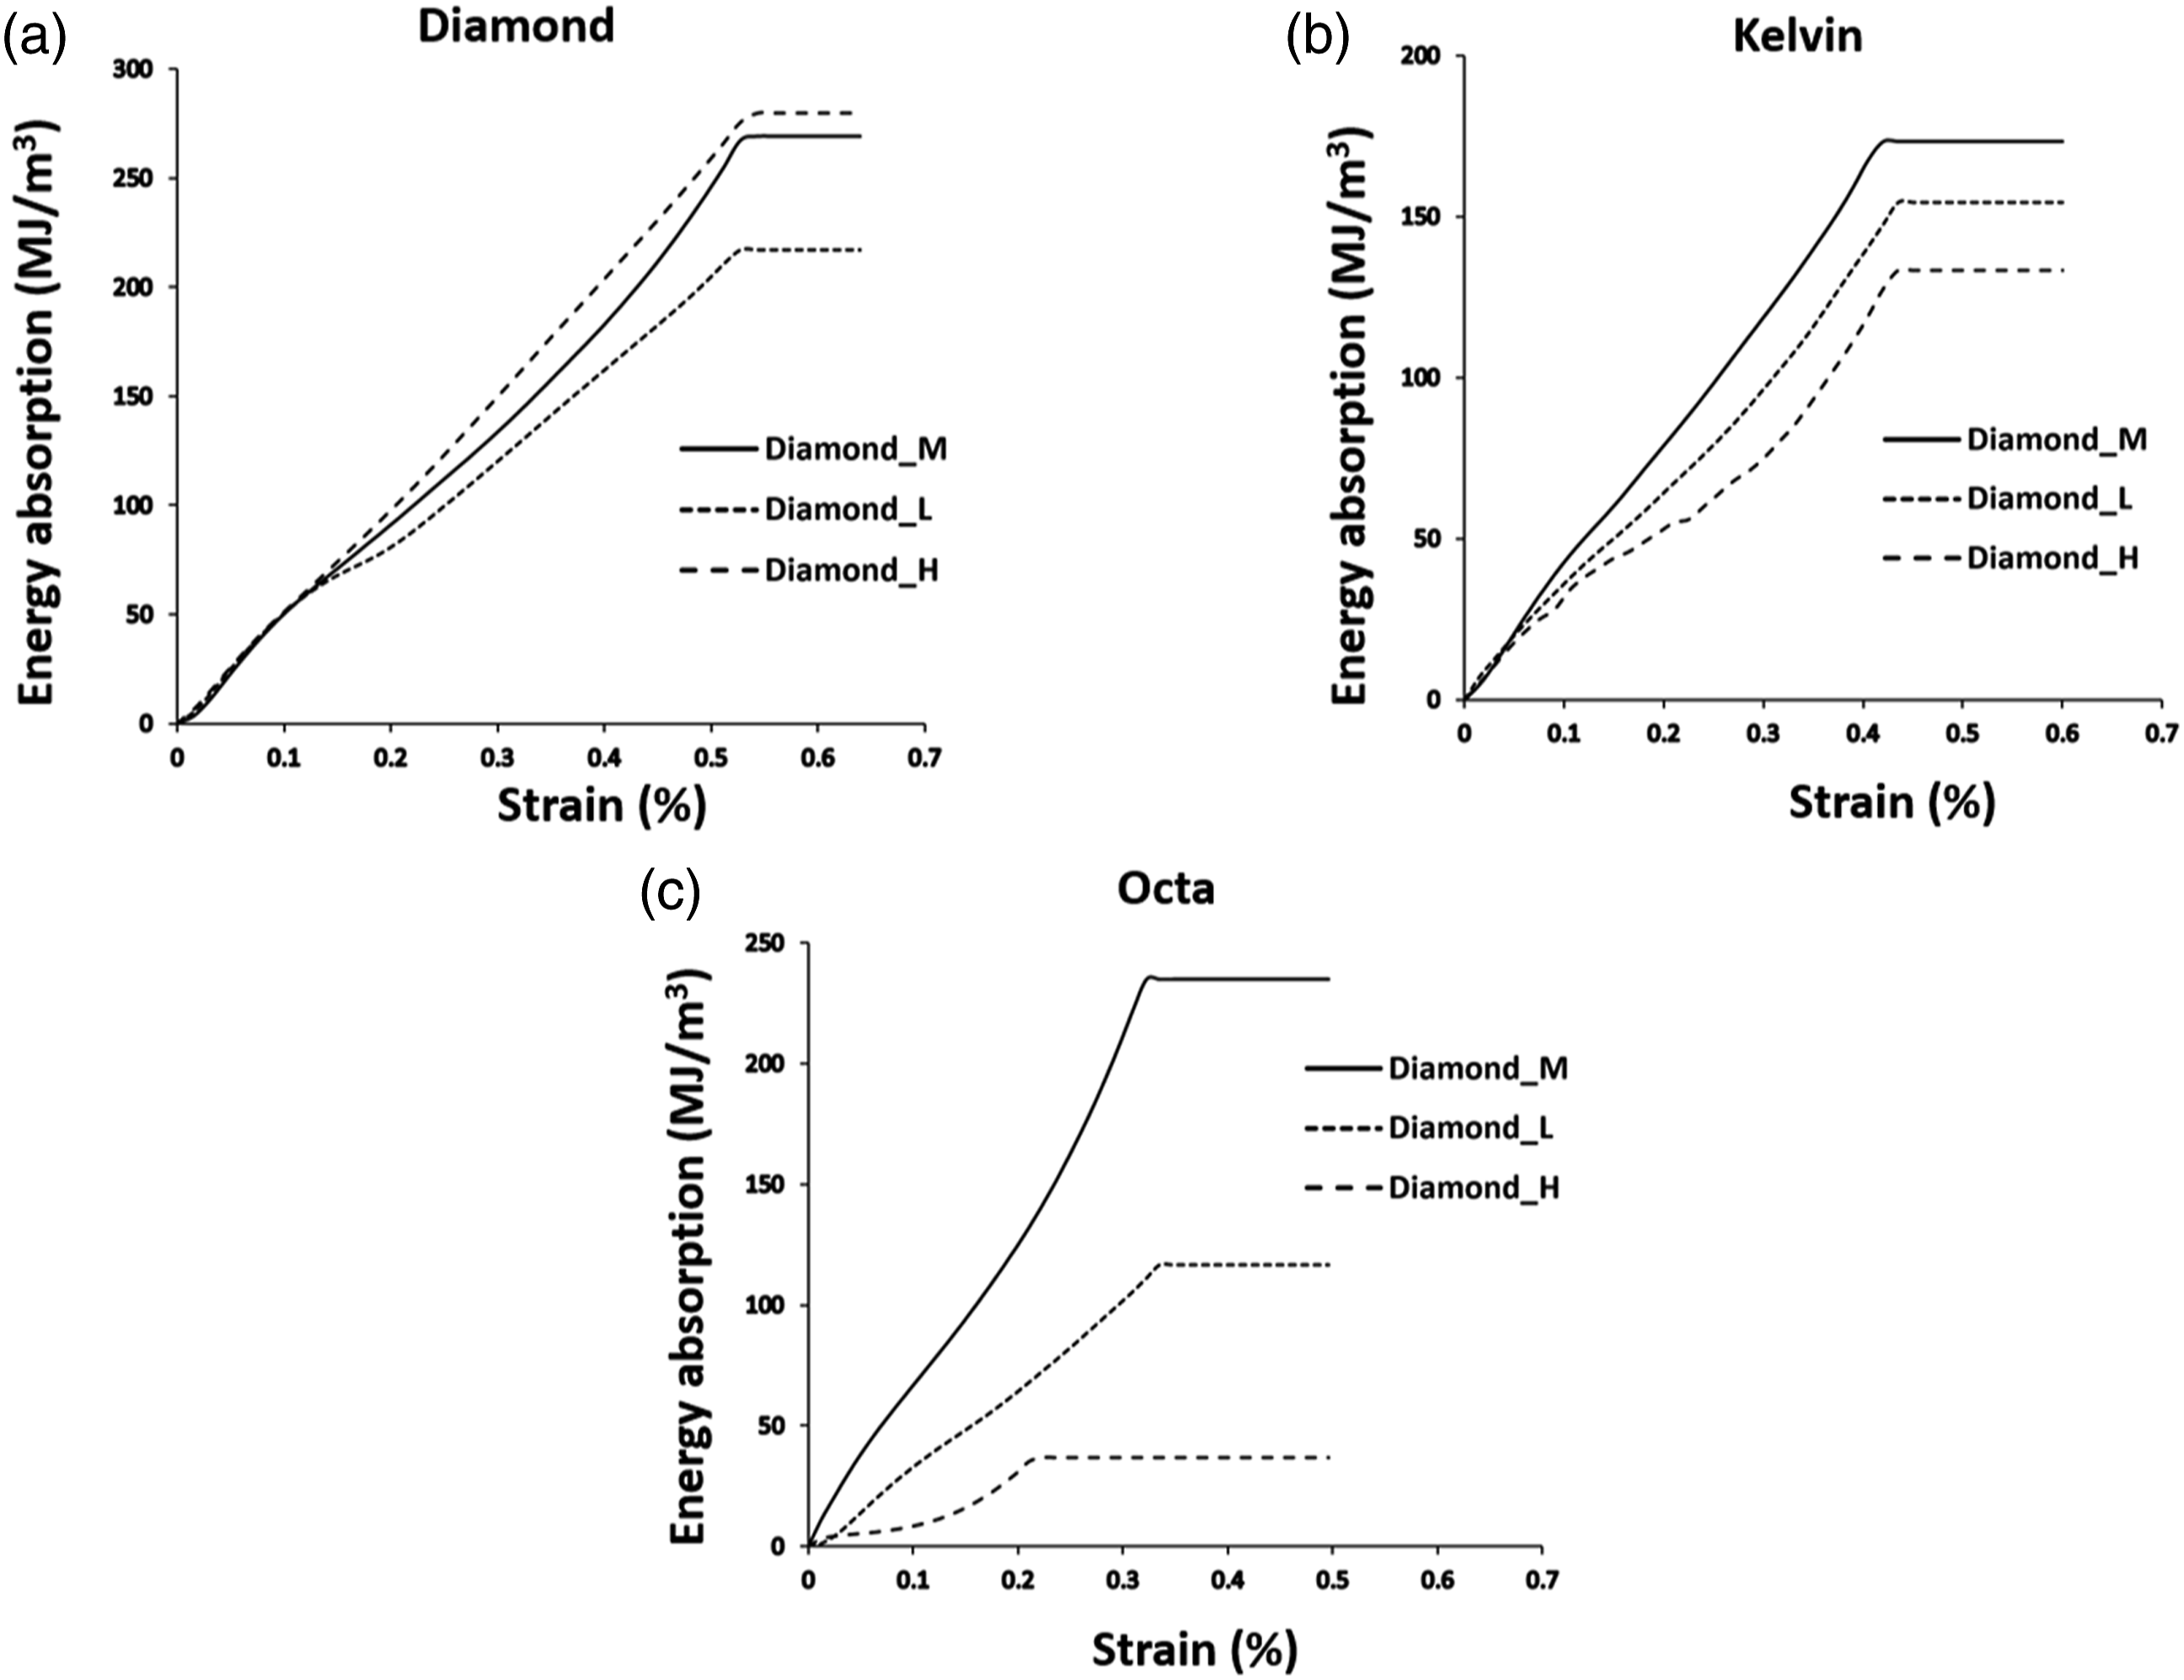
On the other hand, the energy absorption capacity of high-density diamond foam was higher among all other foams such as medium density, low density, Kelvin’s well as Octa’s foams. The reason for such behaviour of high-density diamond foam might be due to the failure at the high value of the strain rate. Conclusively, it was observed that Diamond foam possessed a high amount of energy absorption capacity than the other two foams in the considerations. In summary, the increase in the relative density and interconnectivity of the foam structure in the Diamond shape was the reason for the higher value of high energy absorption capacity. 37 It was further observed that the cell structure also contributed to the high jamming of the deformed cells which is attributed to high energy absorption efficiency as well as capacity in diamond form.
Vibration isolation
The vibration isolation behaviour can be evaluated by accelerating the transmissibility. The transmissibility is the ratio of the mass acceleration to the shaker platform acceleration. The transmissibility calculated for the different sets of lattice structures is shown in Figure 10. It can be observed from Figure 10(a) that the transmissibility curve started from nearby one and reached the resonance frequencies of 33, 18 and 39 Hz for the small, medium, and large volume fraction lattice structure of the Diamond unit cell. Further increasing the frequency, the transmissibility decreased to one and further decreased to less than 1. The isolation frequency, a crucial factor determining how well an isolator performs, is the frequency that divides the transmissibility curve into an amplification zone and an isolation region. Transmissibly frequency curves for (a) diamond, (b) Kelvin, and (c) Rhombic octahedron unit cell lattice structures.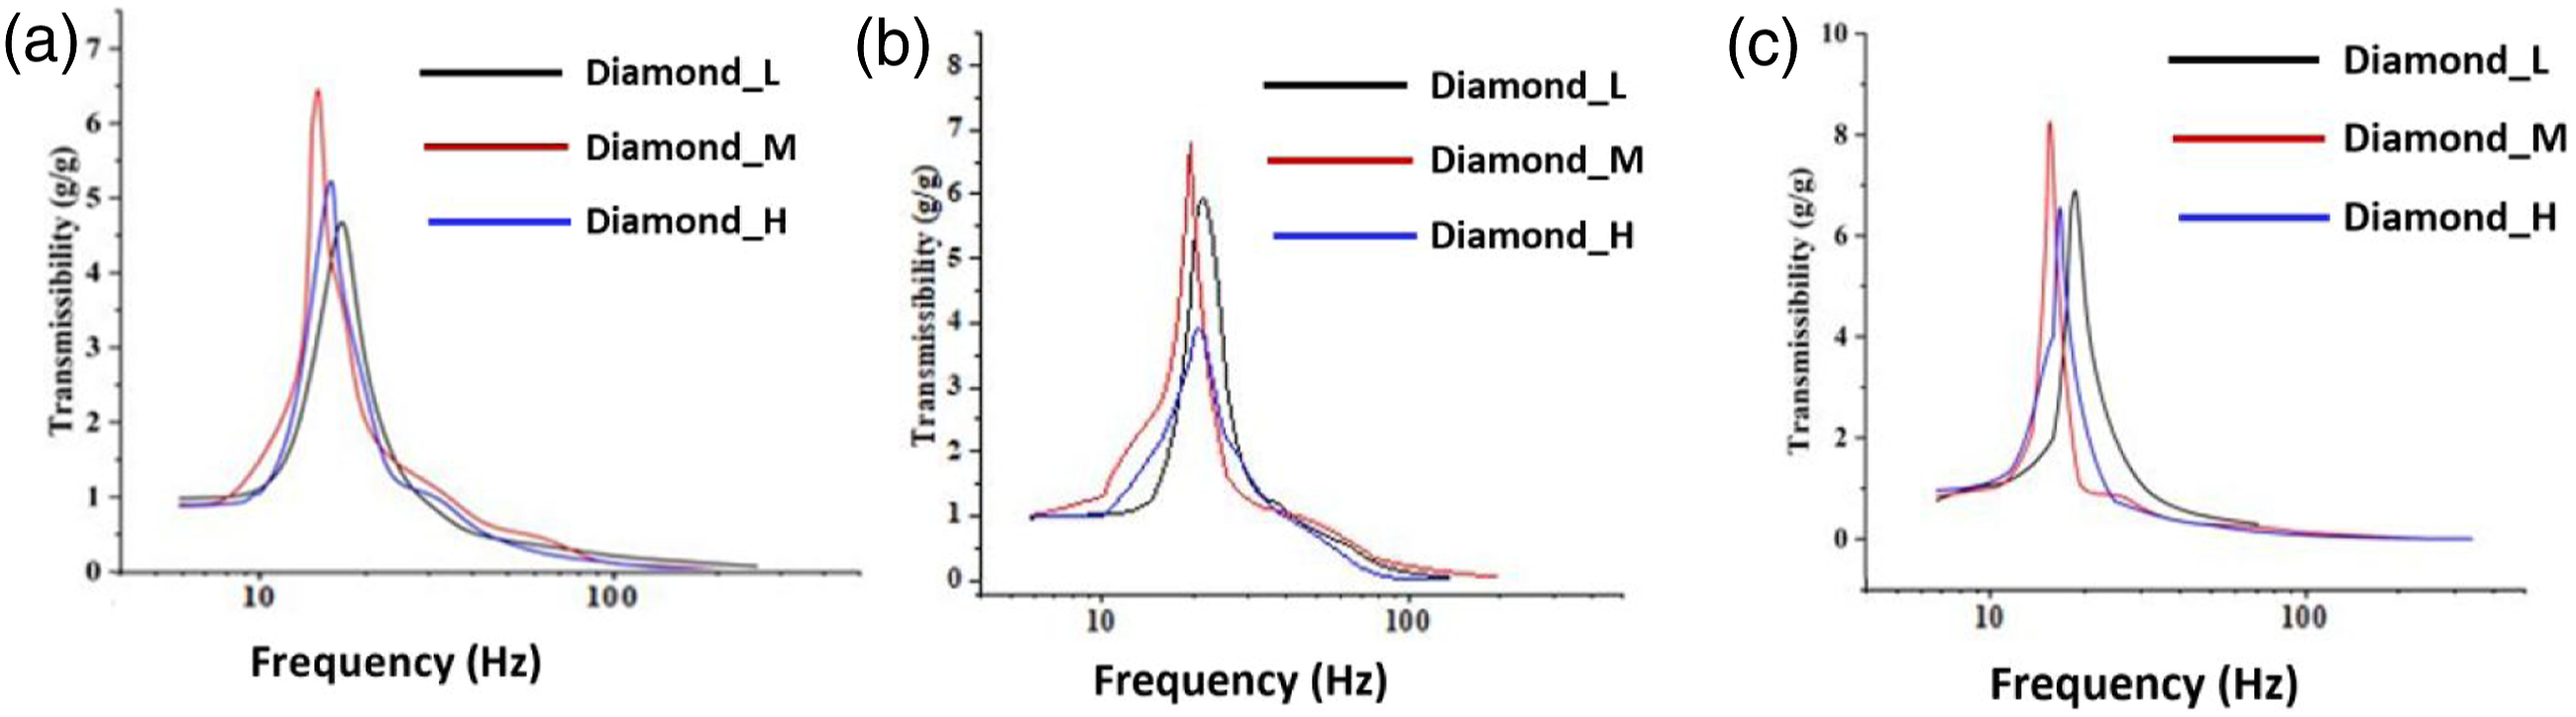
Various characteristics of 3D printed lattice structure.
Conclusions
This article has focused on the experimental investigations and behavior of the lattice structures under compression loading and vibratory environment to select the foam structure that has high vibration isolation properties with the simultaneous ability to sustain the load. In the present work, three foam structures namely Diamond, Kelvin, and Octa have been investigated at the different density of the cell structure as low, medium, and high density. The novelty of the work is to determine a specific kind of cellular structure among the given to achieve better vibration properties that can be easily fabricated by additive manufacturing. From the analysis, a few of the conclusive points have been identified which are highlighted below: 1. Given the geometry of the fabricated cell structures, significantly, less amount of deviation was observed in the Kelvin foam structure attributed to the geometrical design of the unit cells. However, Octa foam displayed a higher deviation due to variable shrinkage in the unit cells. 2. Due to the metamaterial formation that derives its properties from geometry, the Diamond structure has emerged as the most resistant structure in nature after comparing all cases. 3. Medium-density formation in the case of Octa formation has given the best results in terms of plateau stress, and ultimate compressive strength instead in the case of Young’s modulus the high density has given the best results. 4. Among the three, the energy absorption capacity of the diamond form was found to be higher even for the increase in the strain rate. Conclusively, it was observed that Diamond foam possessed a high amount of energy absorption capacity than the other two foams in the considerations. 5. Due to complex unit cell design, Kelvin lattice structures were quite large as compared to Diamond and Octahedron lattice structures. While rhombic octahedron lattice structures resulted in a similar trend to the Diamond lattice structures in terms of resonance and isolation frequency.
The lattice structures have demonstrated remarkable strength in terms of Young’s modulus, Plateau stress, and ultimate compressive strength, as demonstrated by the data presented above. Lattice structures can be utilized in a variety of high-end applications that need a high strength-to-weight ratio. It can be derived from the above conclusions that additively manufactured form structures have the ability to distinguish themselves from traditional materials.
Footnotes
Authors’ contributions
Conceptualization, Narinder Singh and Gurminder Singh; Data curation, Ilenia Farina, Jasvinder Singh; Investigation, Narinder Singh, Gurminder Singh; Supervision, Francesco Colangelo; Validation, Narinder Singh, Gurminder Singh; Writing— Narinder Singh and Gurminder Singh Writing— review and editing, Jasvinder Singh, Ilenia Farina, and Francesco Colangelo. All authors have read and agreed to the published version of the manuscript.
Declaration of conflicting interests
The author(s) declared no potential conflicts of interest with respect to the research, authorship, and/or publication of this article.
Funding
The author(s) received no financial support for the research, authorship, and/or publication of this article.