
Abstract
Lattice materials are one of the most desirable and widely used materials due to the characteristics derived from their geometrical formation as opposed to their chemical composition. In this article, a lattice material has been designed and printed using polymer filament wire made of polylactic acid (PLA) and fused deposition modelling (FDM), followed by mechanical testing. In addition, tensile testing of the PLA printed samples has also been carried out to ascertain the tensile properties of the material in use, and the material has shown 38–40 MPa tensile strength with a Young’s modulus value of 1538 ± 120 MPa. The lattice was designed using 3D CAD software, and numerical results were obtained using the Autodesk Inventor simulation module. In addition to the experimental test, theoretical tests were also conducted, and the results were compared to the experimental results. With this methodology, the lattice material failure process can be comprehended. Along with the lattices, the PLA tensile test samples were also prepared and tested to check the feasibility of the PLA being used and ascertain the properties. In addition, it has been observed that after a specific load and deformation, the material’s resistance increases due to its increased density and repeated cell interference. The major purpose of the study is to explore the aspects and feasibility of the PLA printed lattice material with complex shapes and explore the application potential of such shapes.
Introduction
Using additive manufacturing (AM) capabilities, lattice structures with exceptional characteristics, such as light weight, high resilience, energy absorption, and vibration reduction, have been thoroughly explored and developed. 1 Due to their exceptional properties, lattice structures are widely used in aerospace, bioengineering, robotic systems, and other manufacturing fibres. 2 Whilst also lowering expenses and improving manufacturing effectiveness, lightweight products with excellent mechanical properties are employed in functional approach with a better strength-to-weight ratio which is an asset to an engineering product.3,4 The current state of technology for 3D printing enables the production of such structures from metallic and non-metallic substances. 5 Depending on the level of their porous forms, the 3D-printed components can be designed as porous or foam components to their lattice-like formation and internal voids. 6 The component must meet damage tolerance standards to avoid early damage and equipment malfunction.7,8 The authors developed a new AM porous lattice design method. Parallel layers with radius-specific pillars make up the architectural form. Many researchers have also used different reinforcements such as nano particles for making PLA thermoplastic composites for 3D printing applications. 9 Veeman et al. studied the process parameter optimization in the printing of 3D lattices through the fused deposition modelling and used regression analyses. In this research authors used almond shell as reinforcement in the PLA filament and then optimised the parameters. 10 Biodegradable Polymer blends have also been used to study the structural properties. In such research the blends were prepared with PLA, poly (butylene adipate-co-terephthalate), and montmorillonite. Which can also be used for the preparation of biodegradable filaments. 11 Yan et al. 12 studied gyroid structure formation. Structures were built from several test specimens with different volume ratios. Metallic additive technique has produced samples with different cell sizes that match a virtual model.13–15 Testing showed that structural strength declines with base cell size. Zhang et al. 16 developed hierarchical porous foams with high strength and porosity using 3D-printed boemite gel foams. Gel foams are great for 3D printing due to their printability. Kulka et al. found that its stability, yield stress, and storage modulus make it printable. 17 Some scholars investigated the theoretical foundations of mechanical constitutive modelling of porous polycrystalline ceramics under deformation.18–21 The specimen failure and crack kinking are caused by the elastic phase, the formation of dislocation bands, the commencement of microcracks, and the crack-development stage. 21 They also predicted mesoscale porous ceramic mechanical behavior. The micromechanical modeling of porous polycrystalline ceramics under different loadings shows two fracture initiation mechanisms due to stress concentration at the pore boundary. 22 Deformation was analyzed under tension and compression. The scientists found that polycrystalline ceramic material splits mostly intergranular due to the grain boundary’s lower fracture toughness than the grains. In addition, they also examined different responses of porous poly-crystalline ceramic materials under tension (uniaxial) and compression of aluminium oxide (Al2O3). The damage description method mirrored mechanical feature changes well in both stress regimes. Tandon et al. conducted the study of vibration and acoustic measuring methods for bearing rolling element faults. 23 Localized and diffused faults were detected. Bearing noise and vibration were defined. Frequency domains and vibration measurement in both times using signal processing techniques like high-frequency resonance are included. Tandon et al. compared vibration and acoustic methods for rolling element bearing condition monitoring. 23 New and simulated faulty bearings were measured. Acoustic emission revealed faults better than other measures. Chan examined robust optimization of topologies of multi- material lattice systems under material and load uncertainty. 24 In this article, the focus has been made on developing a robust topology optimization method for multi-material call models under any material and load uncertainty though in current case polylactic acid (PLA) filament. In research by Qin et al., the authors studies printing of lattice materials and studied their compression performance. In this research, the authors used biodegradable PLA to design and prepare the bear loading lattice structures. The authors were successful in preparing the lattice based on the biodegradable filament and observed good results. Interestingly the author mixed inorganic fillers such as, CaCO3 and TCP in the PLA and produce the biodegradable properties in the final filament and thus in the lattice.25,26 Further in the same area, Tang et al. studied the effects on the 3D lattice structures by changing the process parameters for lattice printing. In this research, the authors studied the physical properties of the lattice by using digital image correlation, which is very interesting. Along with the mechanical testing the SEM experiments have also been carried out to study the cross-section of the samples. The tensile strength this case was found to be nearly 50 MPa which is very close to the results of current work.27,28 Li et al. studied spin-chain topological phase and lattice formation. 29 Using multiple comparable models, the researchers examined the topological trait. They showed that material anisotropy could generate the topologically nontrivial phase in the lattice structure model under other model parameters. Even-bond dimerization is closely related to it. This concludes the system’s topological invariant and may provide topological materials for experimental research. Geng et al. examined cellular lattice structure fracture characteristics under tensile strain. 30 This study demonstrated a finite element approach and numerical results. The simulation showed additional experimental damage situations. Researchers estimated porous ceramic dynamic fracture toughness. Their research compares experimental results of dynamic stress intensity factor (DSIF) and its static equivalent. Al2O3 and MgO ceramics with different porosity fractions were tested. 31 Zargarian et al. 32 studied additive-manufactured lattice structure fatigue. Their article examined how numerous factors affect fatigue failure of high-cycle additive technology lattice models. This study however, showed that 3D lattice materials’ physical properties need several experiments. 33 Thus, this work investigates the physical behavior of the 3D lattices printed with the help of the FDM based 3D printer by using PLA filament material because of the availability and high rate of recycling. Since other material are difficult to recycle and have less recycling capacity while PLA can be recycled and used much time without losing its properties. Thus, major focus has been focused on investigating the comparison between numerical and experimental results obtained.
Materials and Methods
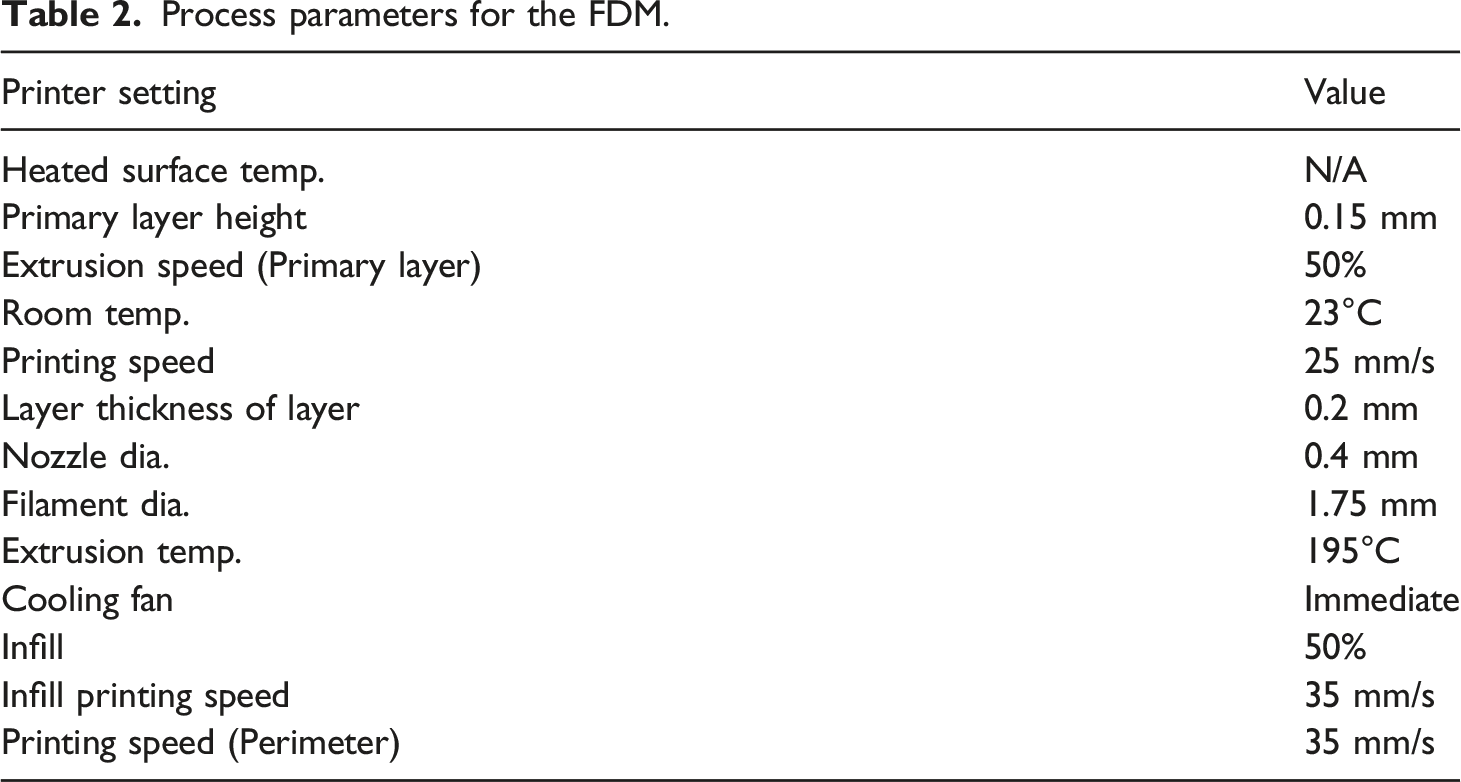
Characteristics of PLA filament.
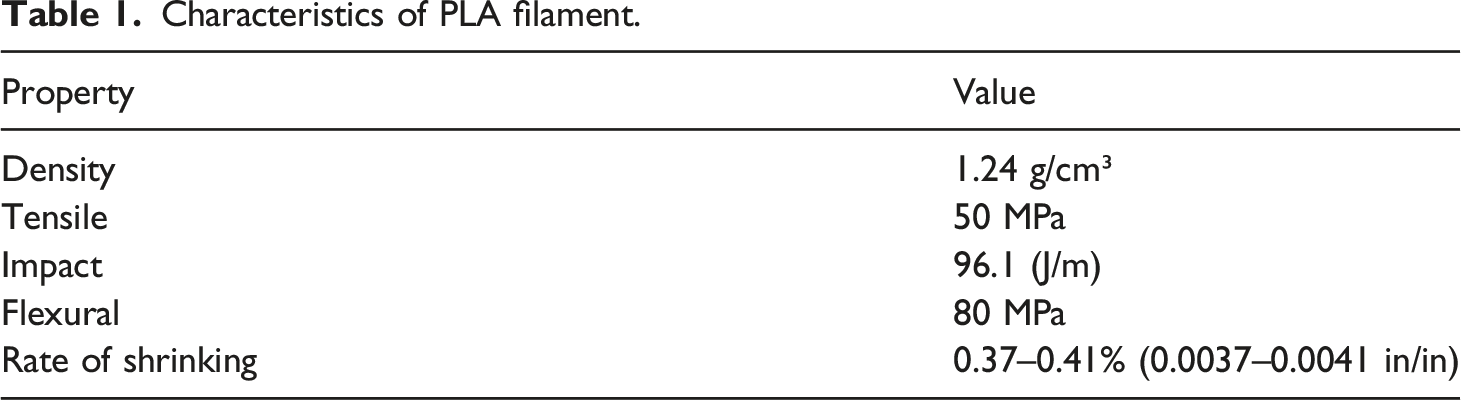
The lattice structure which has been prepared have basic cell size 10 mm × 10 mm × 10 mm and lattice size 80 mm × 80 mm × 90 mm (l*b*h). Figure 1 shows the lattice cell and lattice design, along with the discretised model Figure 4, which have been designed and printed with the help of the Autodesk inventor. In addition, the thickness of the strut has been kept to 2 mm as to have more self-stability and easy printing because of the printer’s capabilities. The material which has been used, PLA is the current case, has volume V
p
= 1.84 × 105 mm3 whereas the total volume of the sample is V
s
= 5.04 × 105 mm3. The printing of the material has been carried out at the printed setting given below by using the combination of CURA and 3D printronics printer. After printing of the lattice materials, the materials have a particular volume, which is not as same as the volume of the filament used because of the of the difference in the infill density. Where V
p
(in mm3) is the volume of the raw PLA utilized in construction, and V
S
(in mm3) is the total volume of the sample. Manufacturing samples involved an FDM (Fused Deposition Modeling) printer (3D pretonic). Kelvin lattice designed with different views.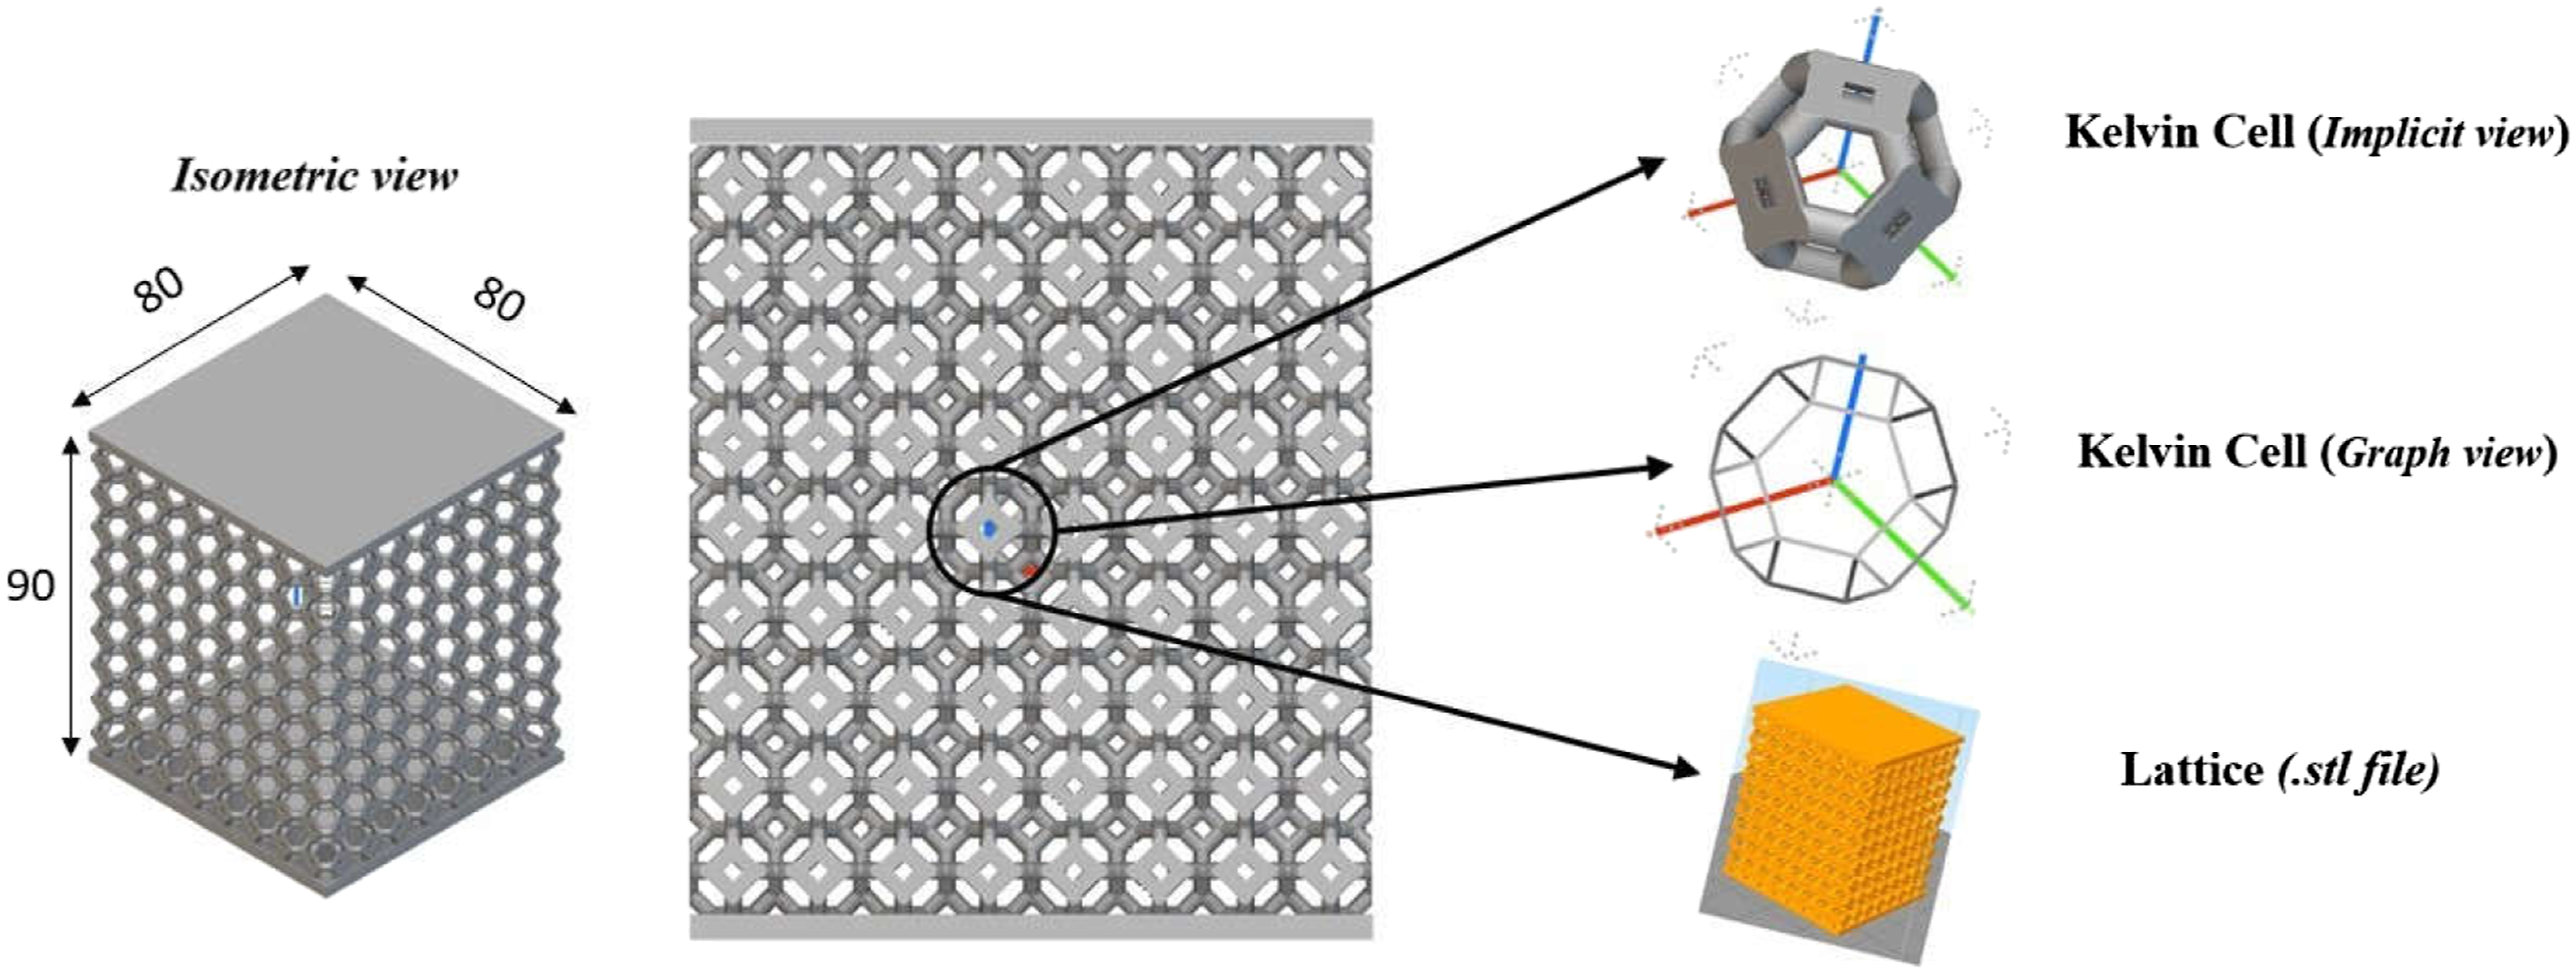
Experimentation
Design
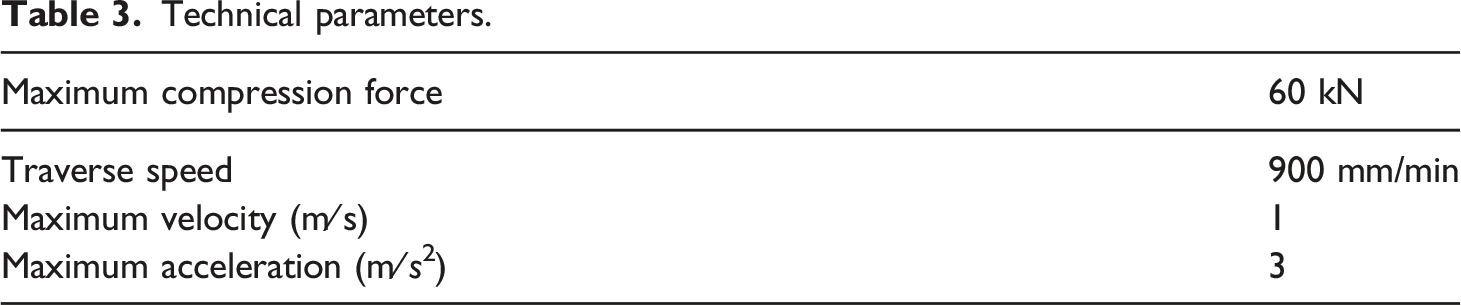
In this section, the printed samples, which have been designed and printed, are tested for the mechanical properties. Before the testing of the 3D lattices, the test samples of the PLA have been tested for ascertaining the tensile properties by using a tensile testing machine. The tensile test samples were designed (see Figure 2) according to the ASTM D638 standard and printed with the same printing parameter that were used to print 3D samples (see Table 2). The samples were printed in three different orientations, Sample 1 corresponds to printing in 0°, sample 2 corresponds to 45° and sample 3 corresponds to 90° with respect to printing platform for both the tensile and lattice samples. Three set of experiments were conducted for each orientation. The average of the results was taken along with the standard deviation. In this phase the printing parameters for both the geometries (Tensile samples and lattice cell) been kept the same as every polymer can has different working parameter. The parameters for the PLA have been ascertained by printing the tensile samples and testing the samples for ascertaining the propertied of PLA. Since the PLA can be printing easily but the parameters such as temperature and speed affects the most. After testing of the specimen has been carried out in the tensile testing machine (Figure 3(b)) and the graph obtained from the testing has been shown in the Figure 5. Since the PLA material is brittle in nature, the curve has shown the sudden drop after the maximum load as shown in the Figure 5. After sudden drop the samples failed to withstand the load and broke immediately. It has been seen that the values of the filament properties, which are shown in the Table 1, are in line with the properties obtained from the tensile samples. Though the comparison is not necessary because of the non-identical shape of the samples (tensile and lattice structures). But the samples have minimum withstanding power which was necessary to process. Materials having less withstanding power would not be good for printing of lattice materials or structures. Since in lattice structures the point connections are very small than the other shapes such as shapes used for the tensile testing. Lower mechanical properties would have negative effects in terms of mechanical property on the lattice structure. Hence, this testing was conducted to verify the claims made the vendors about the PLA material. The samples were assessed with the universal tensile testing machine in the Department of engineering at University of Naples “Parthenope,” Italy. Compression tests were conducted on the additively manufactured specimens because most of the structural materials are usually subjected to the compression loads and force-displacement variations can be obtained from the physical behavior of the lattice under observation. In addition, the force-displacement can be used to obtain the stress-strain, Young’s modulus, and the value of ultimate compression load. The machine used in this experimentation is capable of has certain fundamental technical parameters, which are listed in Table 3. The compression tests were quasistatic, to retain internal thermal-physical characteristics, with a traverse velocity of 0.5 mm/min and a displacement driver. The tests were conducted until the complete rupture of the specimen as to observe the behavior of the ruptured specimen. In addition, the samples were also visually tested during the test with the help of the optical camera to see the crack/rupture formation and the exact location of the compression zone CAD design of test specimen. Process parameters for the FDM. (a) 3D printer used in the study; (b) Tensile testing machine used. Technical parameters.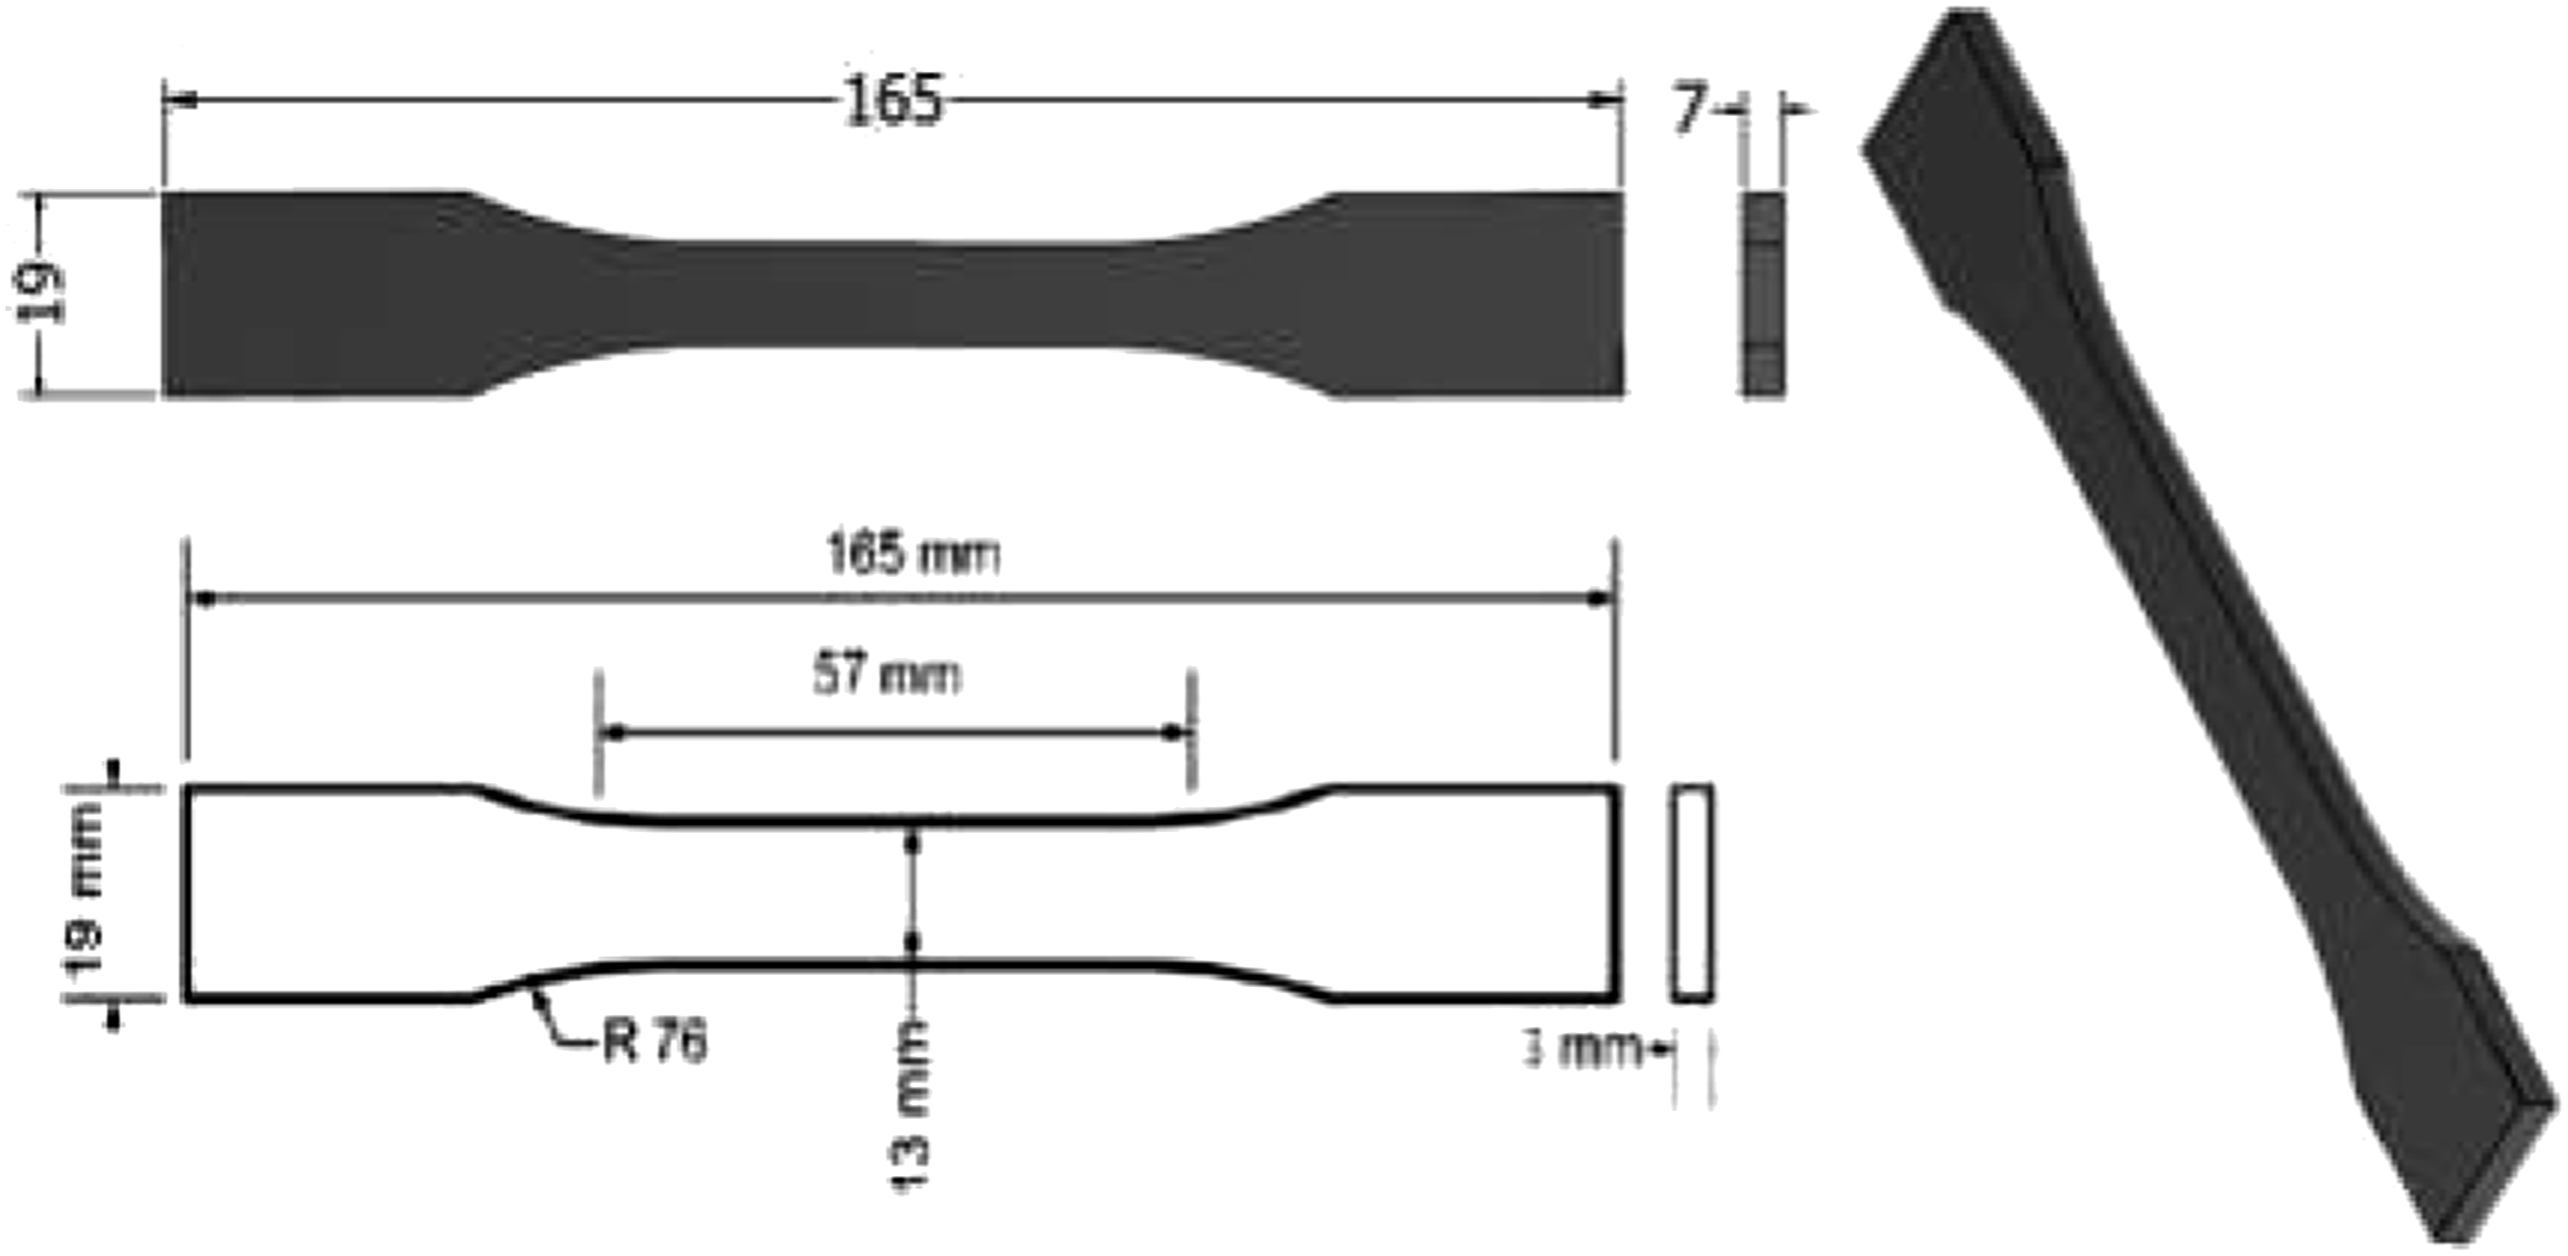
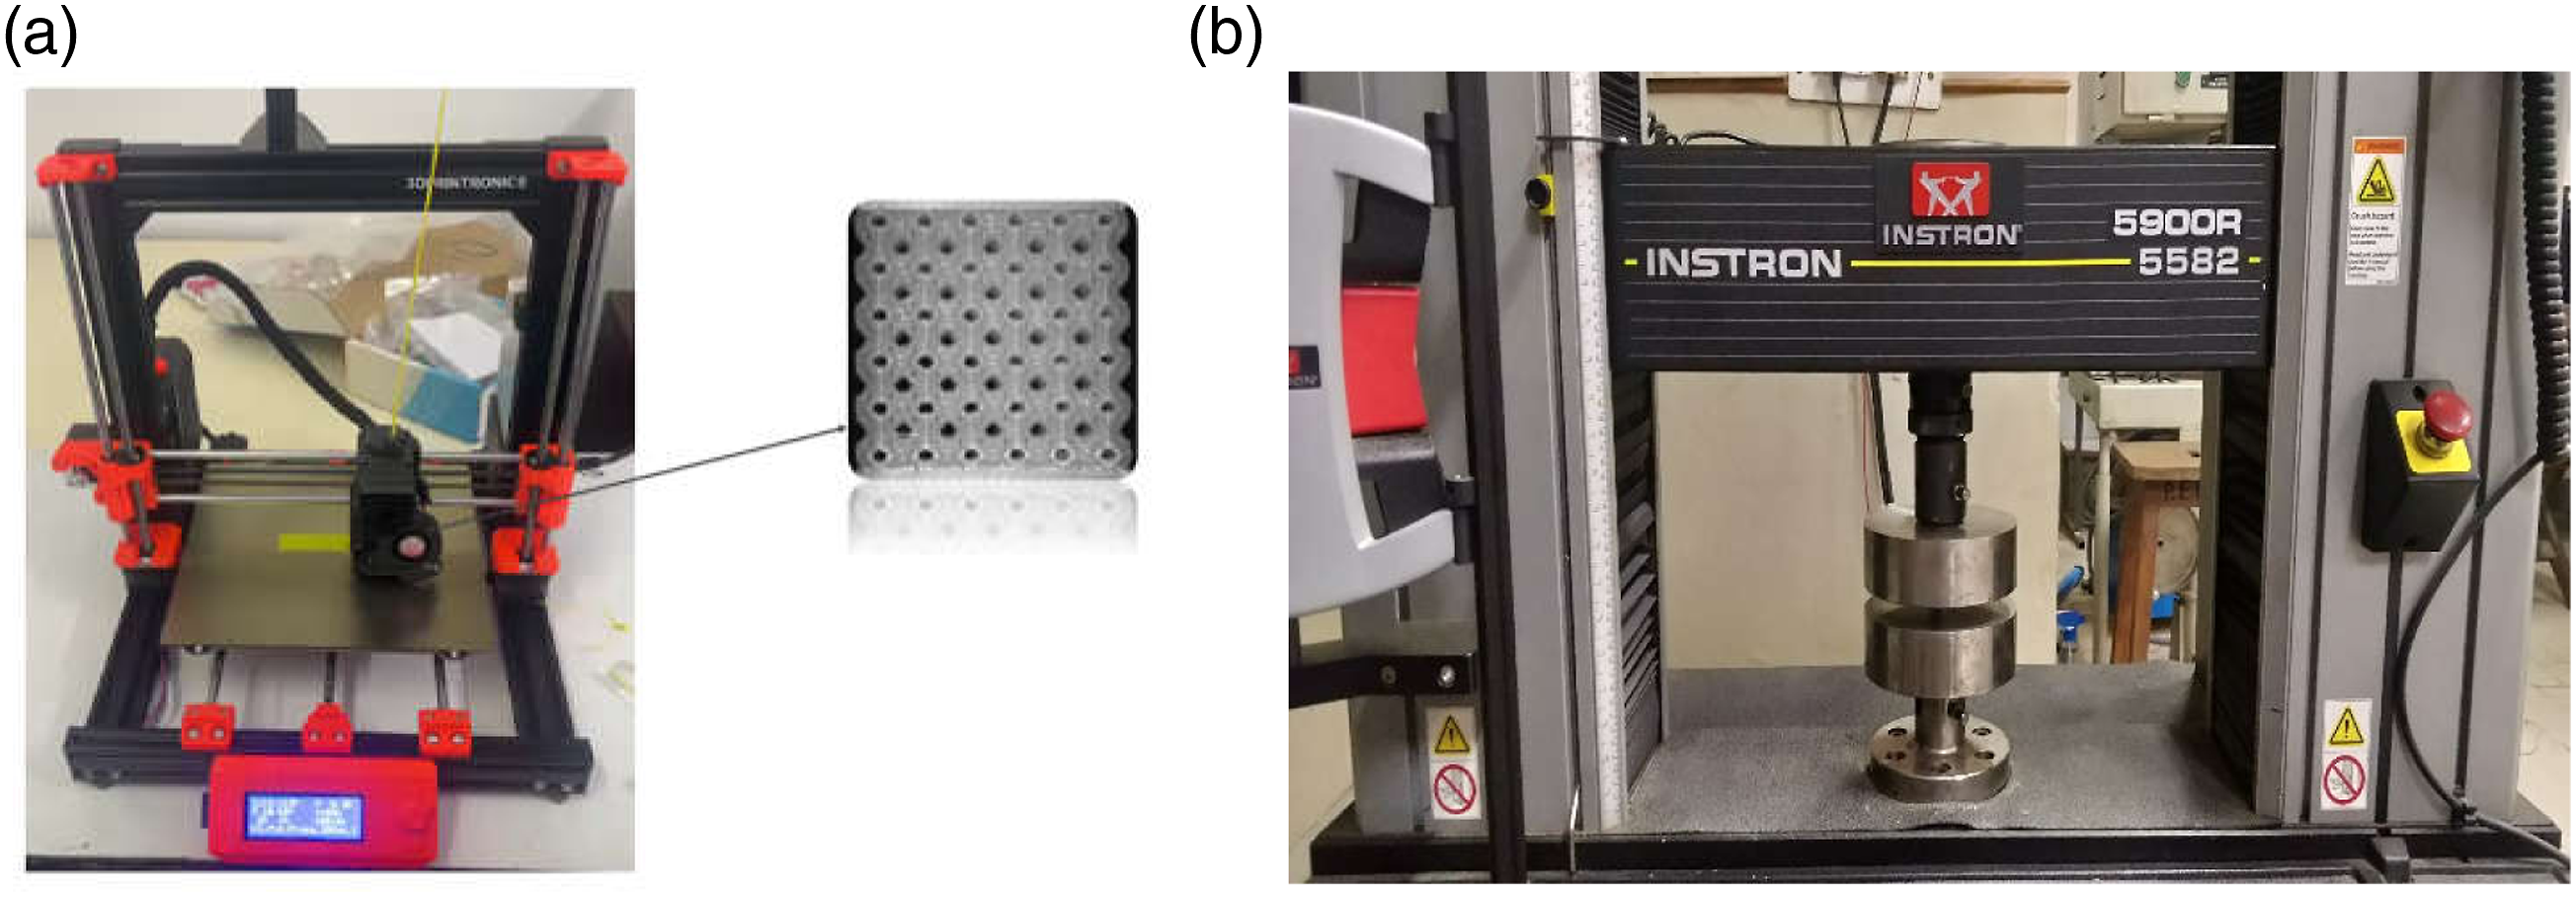
Three samples have been designed and printed for the sake of testing.
The test specimens were designed and printed with the help of the FDM based 3D printed (see Figure 3).
In this section, the numerical test and the results from physical tests have been compared. It must be noted that the tests have been conducted in one-directional compression mode. The numerical analyses that have been carried out on the designed lattice cells (see Figure 4) has resulted in FEA analyses and the compression graphs have been obtained. Solid model and model mesh created with help of CAD software.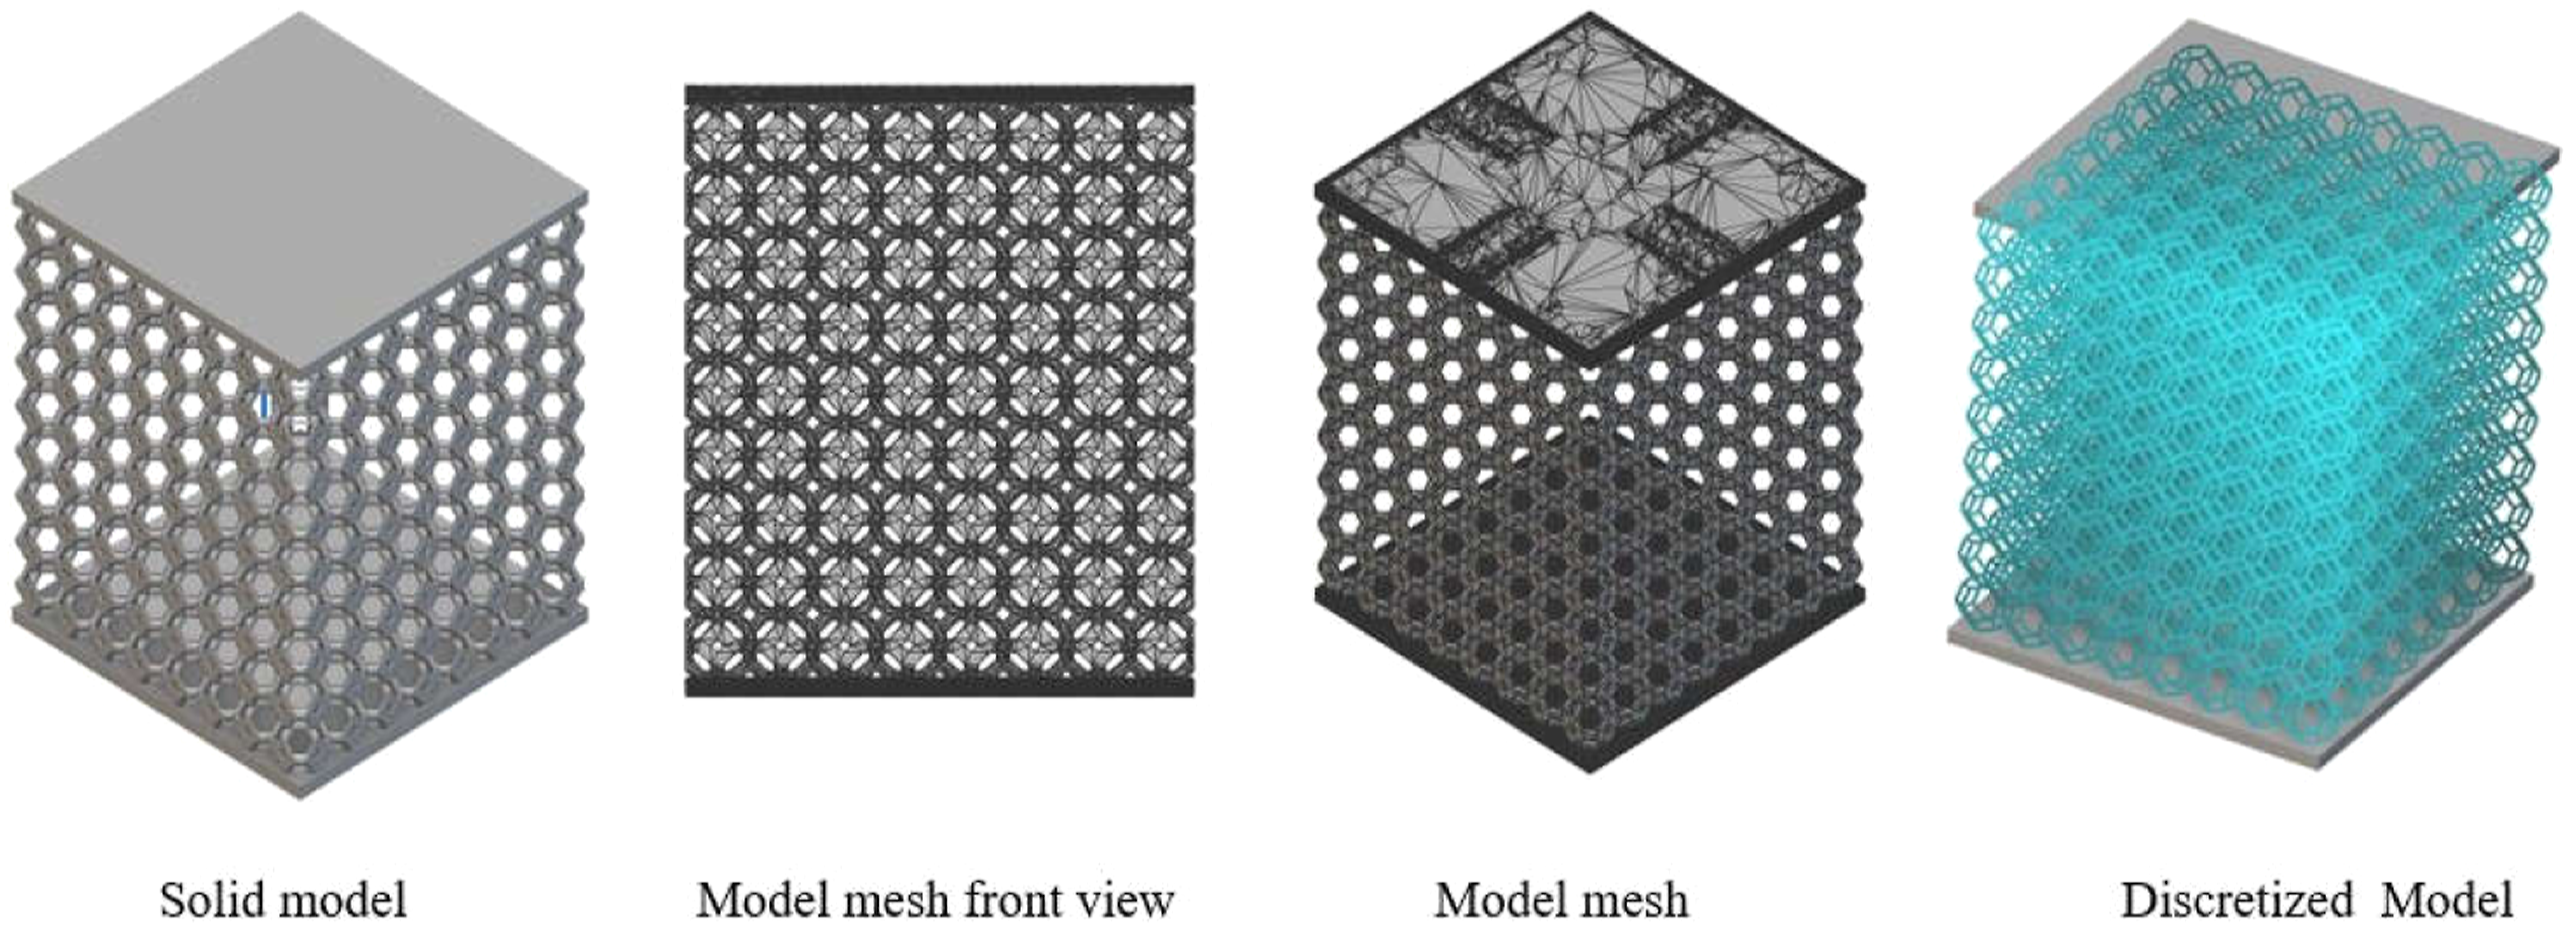
The graphs that are obtain from the experimental tests were compared to the graphs obtained from the numerical tests. Based on empirical one-directional compressive results, the materials model was described as elastic- plastic with damage. The experimentally measured stress-strain characteristic was incorporated into the Inventor CAD software environment using the corresponding in-built material calibration technique. The properties of PLA were already in the materials library considering the material homo-genius. In this step, a simple rate-sensitive elasto-viscoplastic constitutive model has been employed. Several fitting coefficients resulting from tensile testing on dog-bone tensile specimens generated at different orientations were allocated to matching struts due to the angle-dependent feature of the strut characteristics. As the angles were altered during print, the model has become viable. The Young’s modulus is taken to be constant, and the elasticity response is described by.
34

Where “I” is the unit tensor and are the corresponding elastic strain rate tensor and Cauchy stress rate tensor. The Lame coefficients σ and ϵ are dependent on the direction of the strut. The elastic deformation stress-strain response acquired at various strain rates is averaged out to get the elastic modulus used for each strut angle.
To detect rate-dependence of the overall stress-strain response of real lattice samples, it includes the quasi-static experimental results examined in an earlier work by the other authors. If inertial resistance is the primary factor influencing the lattice’s rate sensitivity, models that incorporate quasistatic material qualities ought to closely match experimental dynamic responses. This suggests that there is less inertial resistance. Contrarily, the strong difference between the experimental responses for dynamic compression and the results of the FE simulation (with quasi-static cell strut material properties) shows that the rate- dependent cell strut material is primarily responsible for the enhanced strength and post-yield stress level of lattices.
Since in this research article only in direction printing has been conducted but some researchers have carried out the printing in different direction and in that case the current flow rate can be first Considering the isotropic yield surface defined by the von Mises criterion:
F denotes if the materials deform plastically, where σ is the equivalent stress and Y is the present flow stress. Adopting an associative flow rule, the progression of Y with effective plastic strain is given by the following form function [34]:
The flow stress Y is decomposed into two angle (θ-dependent components, namely the initial yield stress Y0θ defined by Equation 1, and a dimensionless factor hθ, which describes the flow stress as a function of the equivalent plastic strain. The rate-sensitivity of the strut material for each orientation is considered by Y0θ, and the fitting parameters are in ref. (2). The Equation 3 can only be employed in one scenario in the current example, though, because it has previously been stated that a one-directional load has been distributed on the load carrying part. The present situation’s conditions were established by preventing the X and Y corner nodes from moving in either direction, as well as preventing translations of the bottom-surface elements in the Z direction. Only the Z-axis was available for movement in the load direction. The load was delivered in line with the experiment, which required a quasistatic change in the reference point’s displacement along the Z-axis from zero to its maximum value. All the cells at the model’s upper surface received an equal distribution of the displacement value.
The quantitative computations that were conducted were geometrically nonlinear. The Newton-Raphson approach, which is progressive and sequential, was used to solve the issue. The approved analytical method allowed for the structure’s large compression- induced displacements and strains to be considered. Interface interactions were included to the formulation of the numerical method as the General contact option, simulating all internal contacts inside the model in the usual directions. Based on the findings of an experiment (1D compression), the model was identified as an elastic-plastic one with damage. The program environment was modified to reflect the stress-strain characteristic that was discovered through experimentation. Since no appreciable asymmetry was seen during the early experiments carried out within the elastic deformation range, the derived material model was a specific uniformity of the mechanical properties of the PLA. The FE and discretized model have been shown in the Figure 4.
Results and discussion
In this section experimental results, which were obtained through the physical numerical testing, have been shown and well explained after in-depth analysis. As it has been discussed that 3 sets of lattices were designed and prepared for physical-mechanical testing, which was compression. From such testing environments the force displacement diagrams have been obtained which were further used to obtain stress strain diagram for the lattice materials. In the case of the tensile testing of the samples, The observation, which is to be noticed that the one-directional compression testing has been performed for availing the force-displacement variation. Based on experimental compression results, the material model was described as elastic-plastic with damage. The analytically measured stress-strain feature was introduced into the Autodesk Inventor simulation module environment using the built-in process for material calibration. It can be seen in the Figure 5(a), the average behaviour of the each set of samples during the test. The Young’s modulus data with average and standard deviation is shown in and Figure 5(b). In addition, the in the inset the tested samples have been shown. In addition, the coloured samples in the Figure 5(b) shows the comparison of the experimental and theoretical results which have been obtained from the stress analyses carried out with the help of the Autodesk inventor. There was no significant difference in the tests results of the samples printed in different orientations. (a)Physical behavior of tensile test samples as per ASTM D638, (b) Young’s modulus obtained.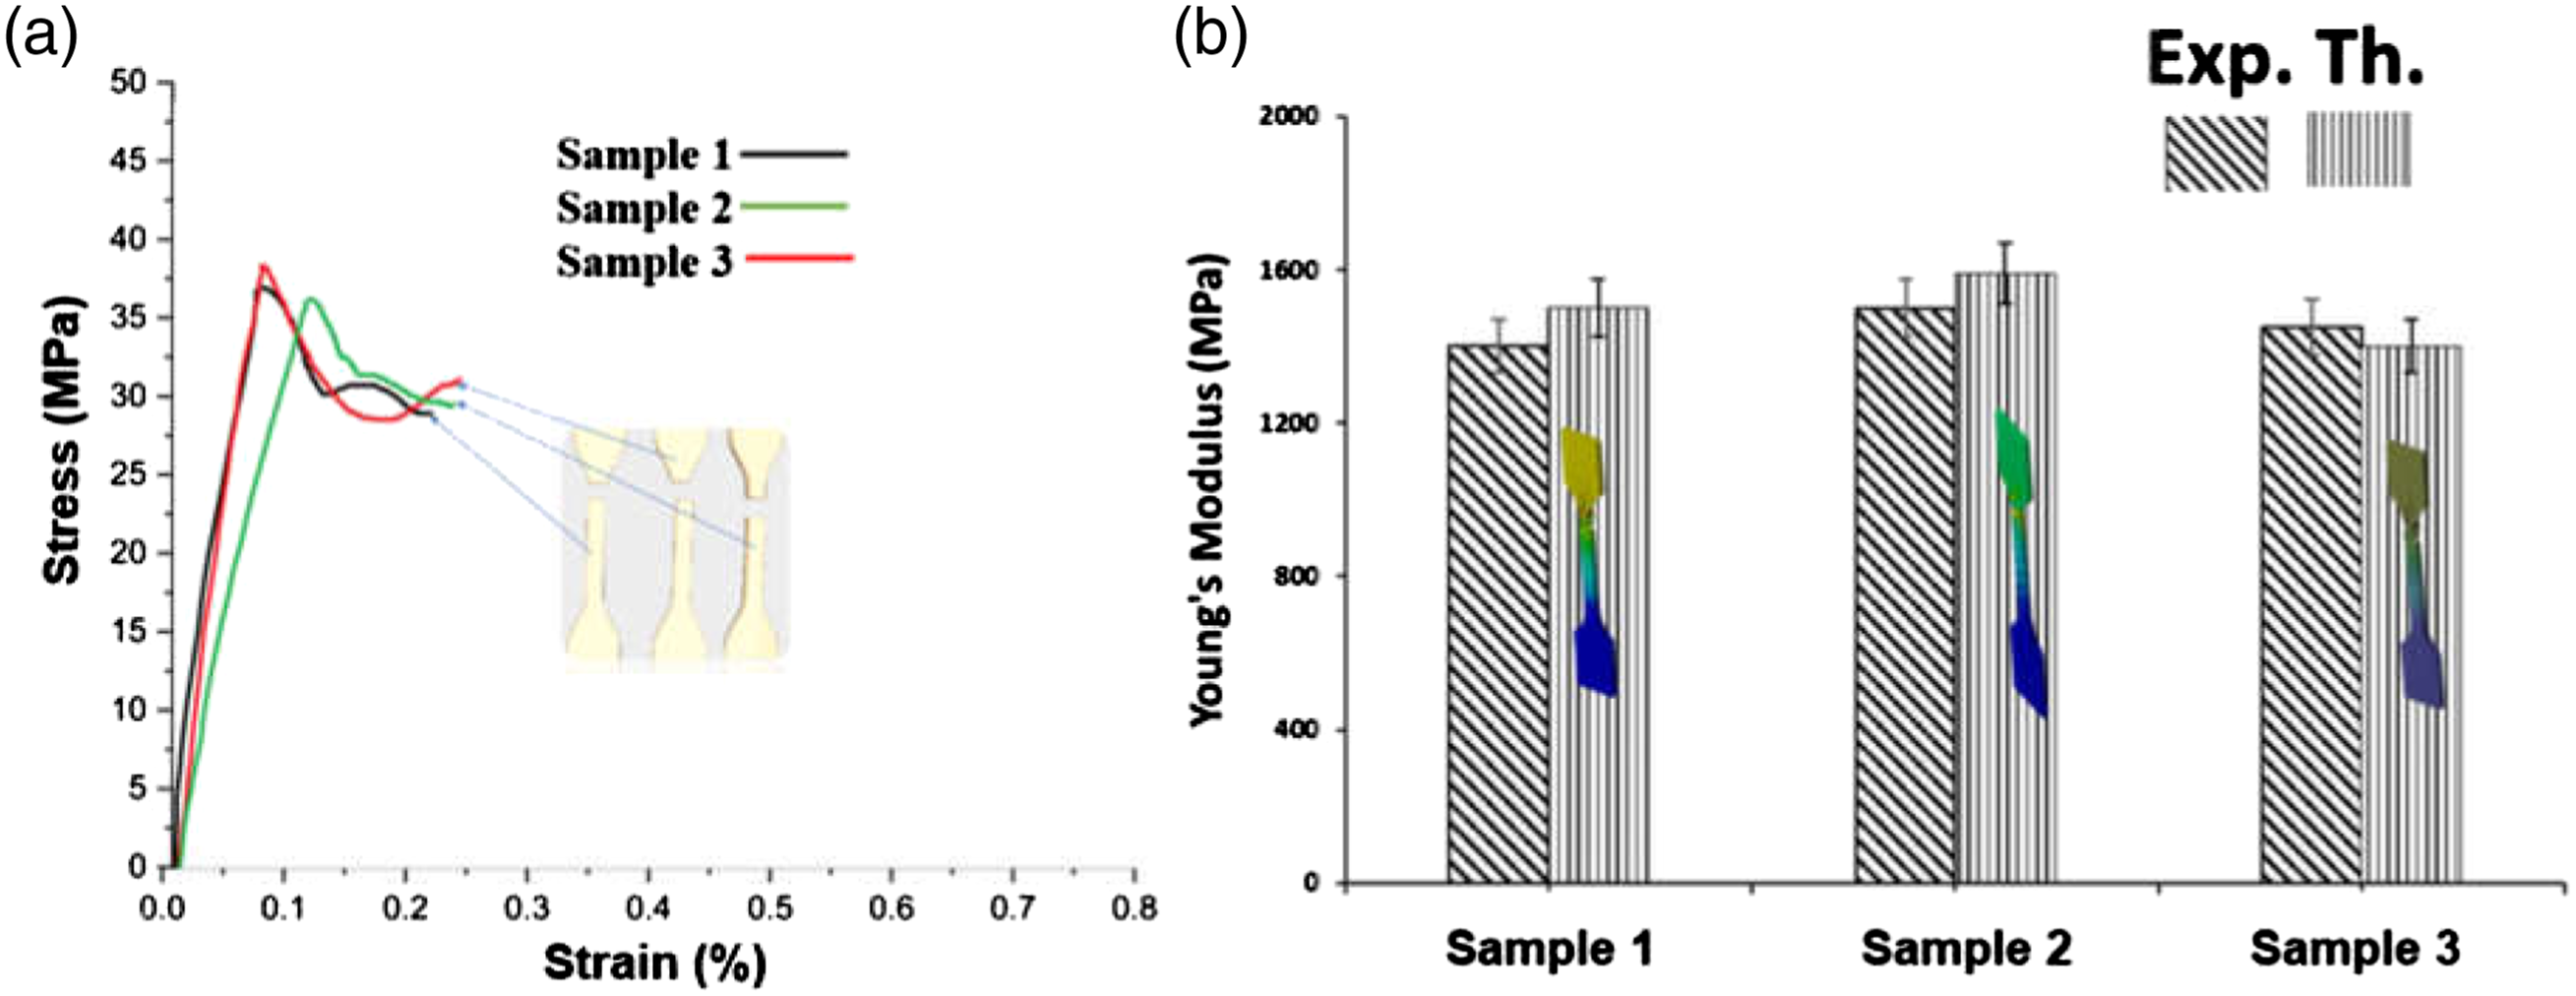
As no substantial asymmetry was found during pre-liminary experiments done within the elastic deformation range, the resultant material model represented a “uniformity” of the physical properties of the PLA. The maximum stress that the specimen was able to withstand is 38–40 MPa. The value of strain is very less because of the brittle nature of the PLA and almost no elongation has been seen because of such nature. In addition, the Young’s modulus of the samples turns out to be is 1,540 ± 120 MPa. In addition, in compression test, the ultimate compression strength has also been found to nearly 43–45 kN. The graph obtained from the tensile testing shows the results from the 3 samples as to have maximum accuracy. In addition, the load distribution scheme, for the lattice structures, has been shown in the Figure 6. Load distribution scheme.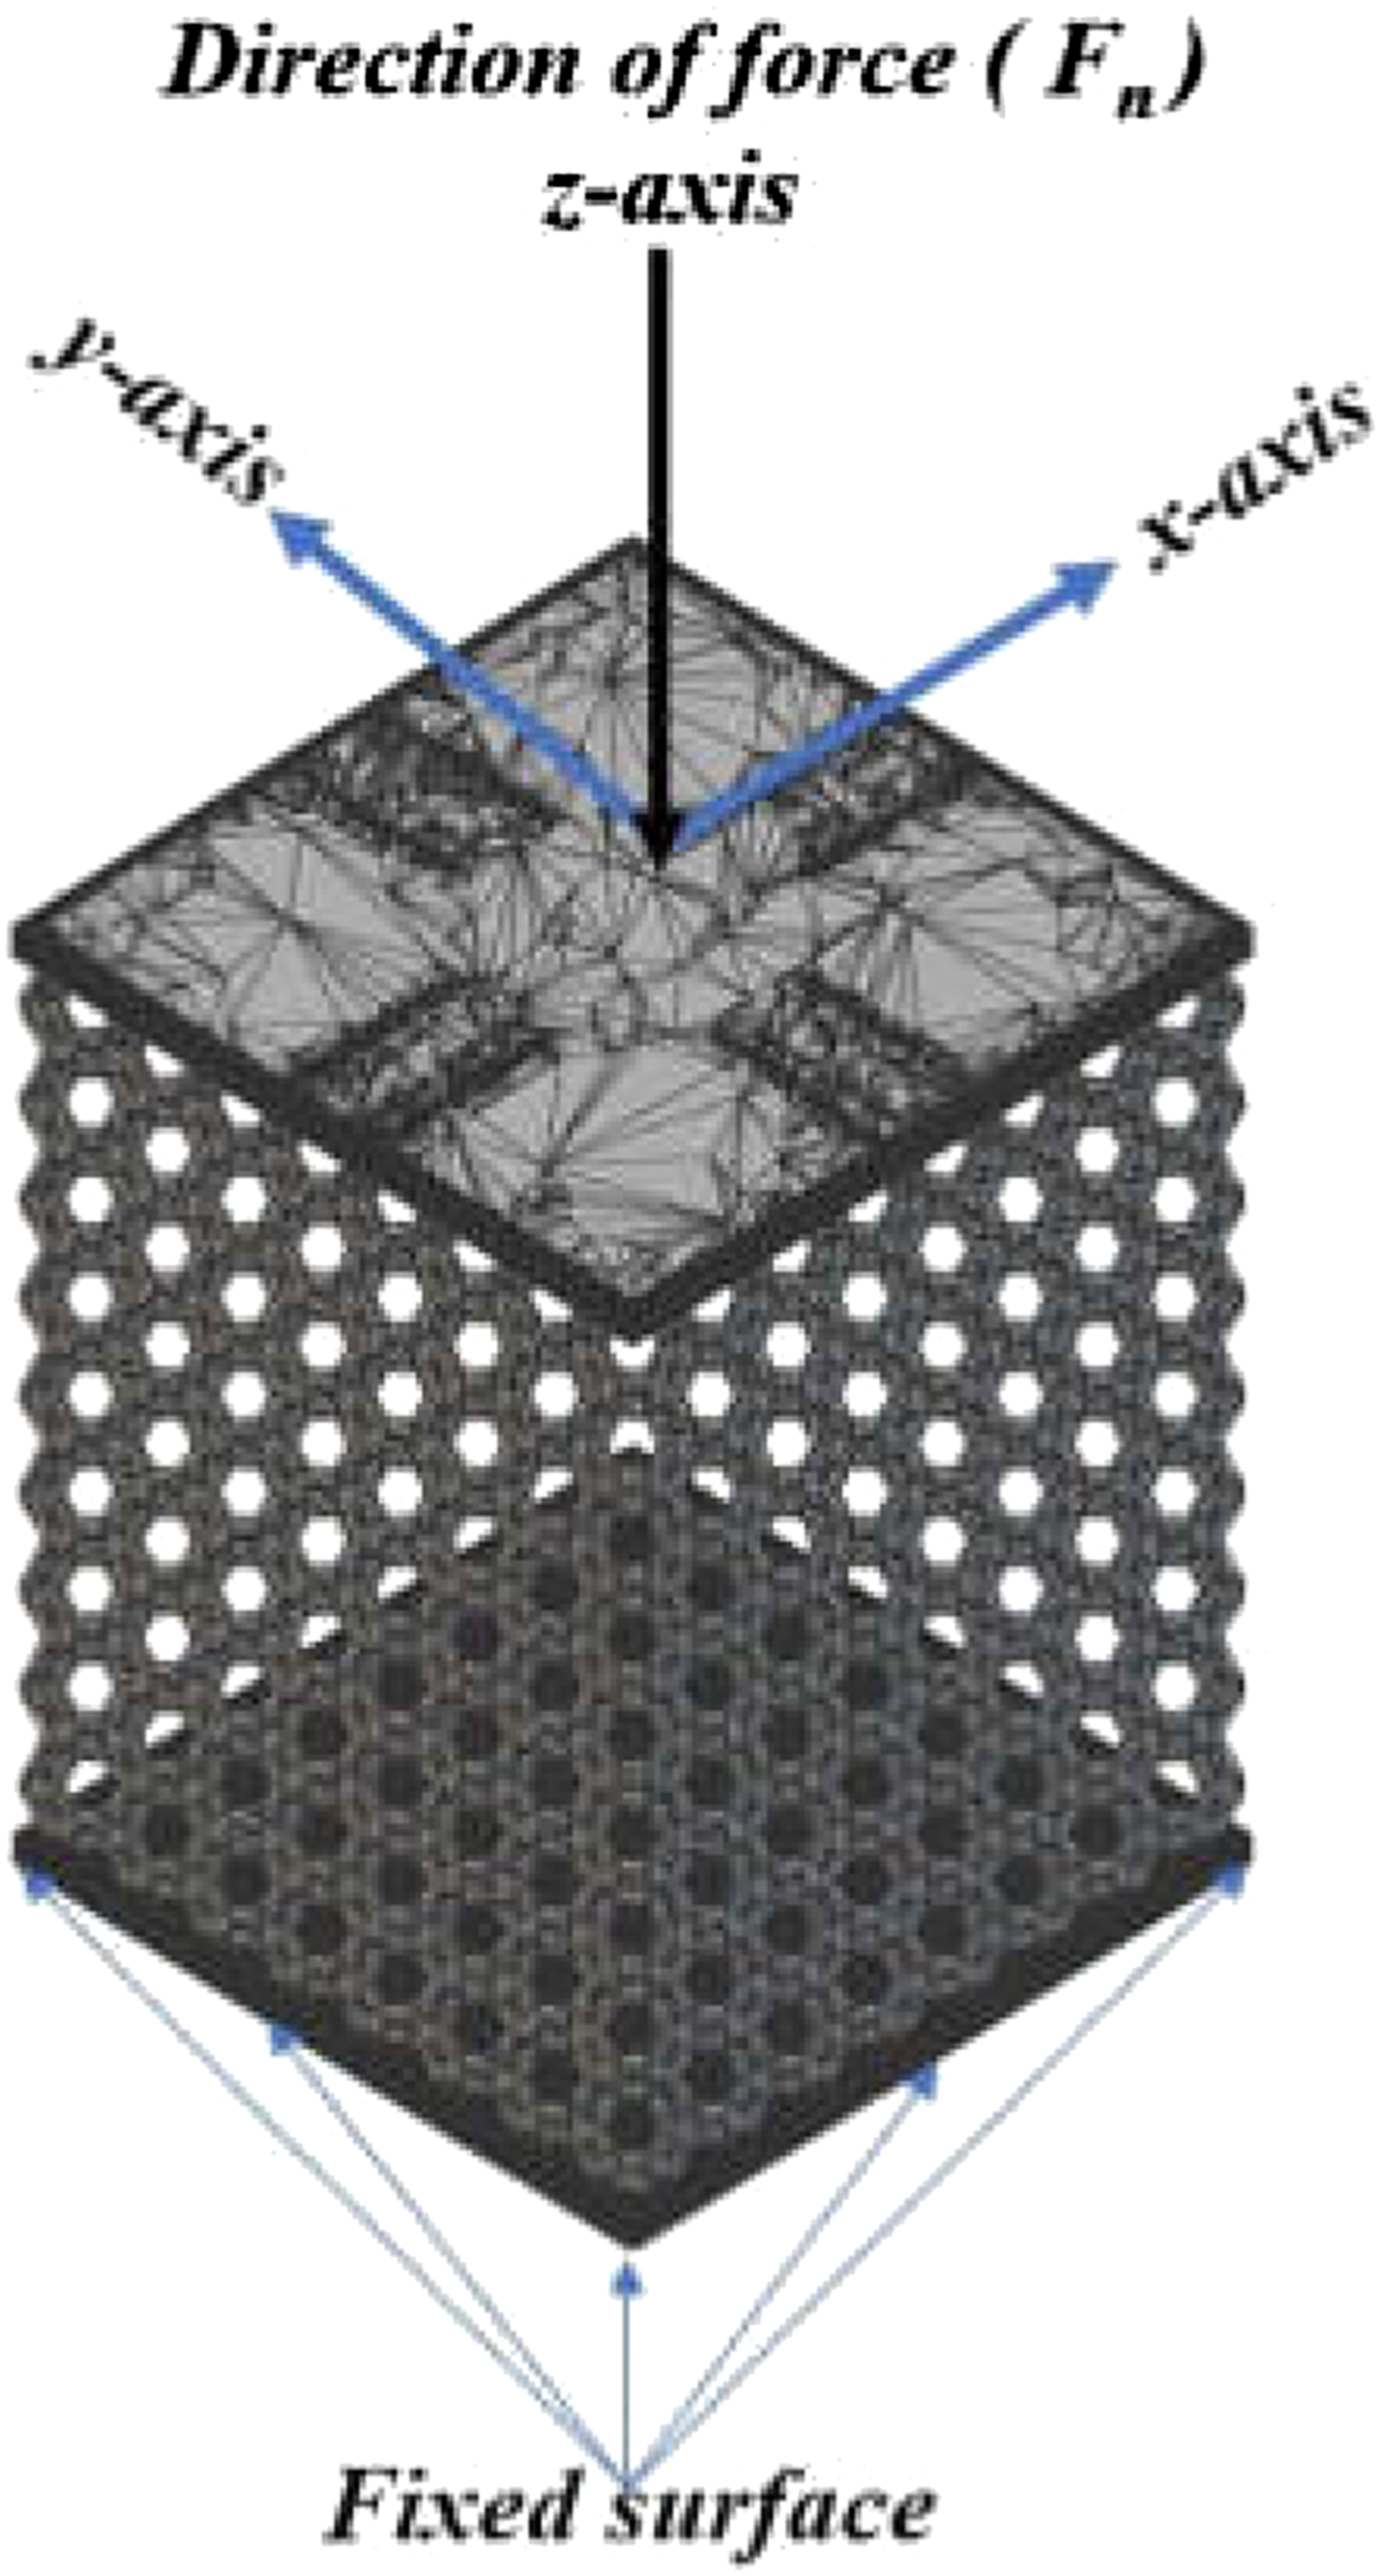
While testing the lattice materials the data in the form of force and displacement was obtained through data acquisition system (DAS). It has been observed that the variation of load from the point where the first crack was observed to the point of complete failure differ by 25 kN. The minimum load that the structure was able to resist was 20 kN (where the first crack was observed) while the total rupture of the system or the structure was observed at 43 kN. From the data of force-displacement and the complete the cross-sectional area of the structure the stress versus strain graphs have been obtained. Since the PLA material is brittle in nature and does not show any signs of ductility or elongation however in the compression it has been seen but the material or structure was trying to resist the maximum load which was 43 kN. This was because of the internal structural disturbance which gave the structure a unique characteristic. All the three samples were assessed to obtain forced displacement variations. At the same time the maximum or ultimate compression strength has also been observed and noted Along with the Young’s modulus of PLA lattices Figure 7(c). The ultimate compression strength was observed as 43 kN for the second sample Figure 7(d) and the Youngs modulus observed was 1548 ± 120 MPa Figure 7(c). As for the force-displacement and stress strain variations along with the compression variation has been shown in Figure 7(a). It can be seen from the Figure 7 that the second sample has given better result but the variation was not too high so it can be considered a stable test when the experimental and theoretical tests have been performed. In terms of the displacement, the maximum displacement has been seen around 60 mm. Which turns out to be nearly 70%. It can be seen from the force displacement diagram after the maximum under force a sudden drop has been noticed which was because of the sudden rupture along the struct. It can be seen from the graph ultimate stress is 43 MPa and ultimate strain is 0.7. It can be seen from the graph the exact point from where the failure starts and up to which point material resisted the load. The sudden rupture along the street has been seen because of the non-ductile nature and material failed plasticly at this point without showing any elastic reaction. The very similar behavior in stress-strain (see Figure 7(a)) graph has been observed because after the sudden drop the material was able to resist the force or stress and decrease in force and rise in displacement value was seen for a particular time zone after which again the increase in stress has been observed. This interesting nature of the lattice structure was because of the continues increase in the density off the structure due to the intercell interference. Stress-strain analyses of 3D lattices (a) stress-strain behavior of lattice samples (b) force-displacement diagram of lattice samples (c) Young’s Modulus obtained from experimental and FEM stress analyses (d) ultimate compressive stress obtained from experimental and FEM stress analyses for lattice samples.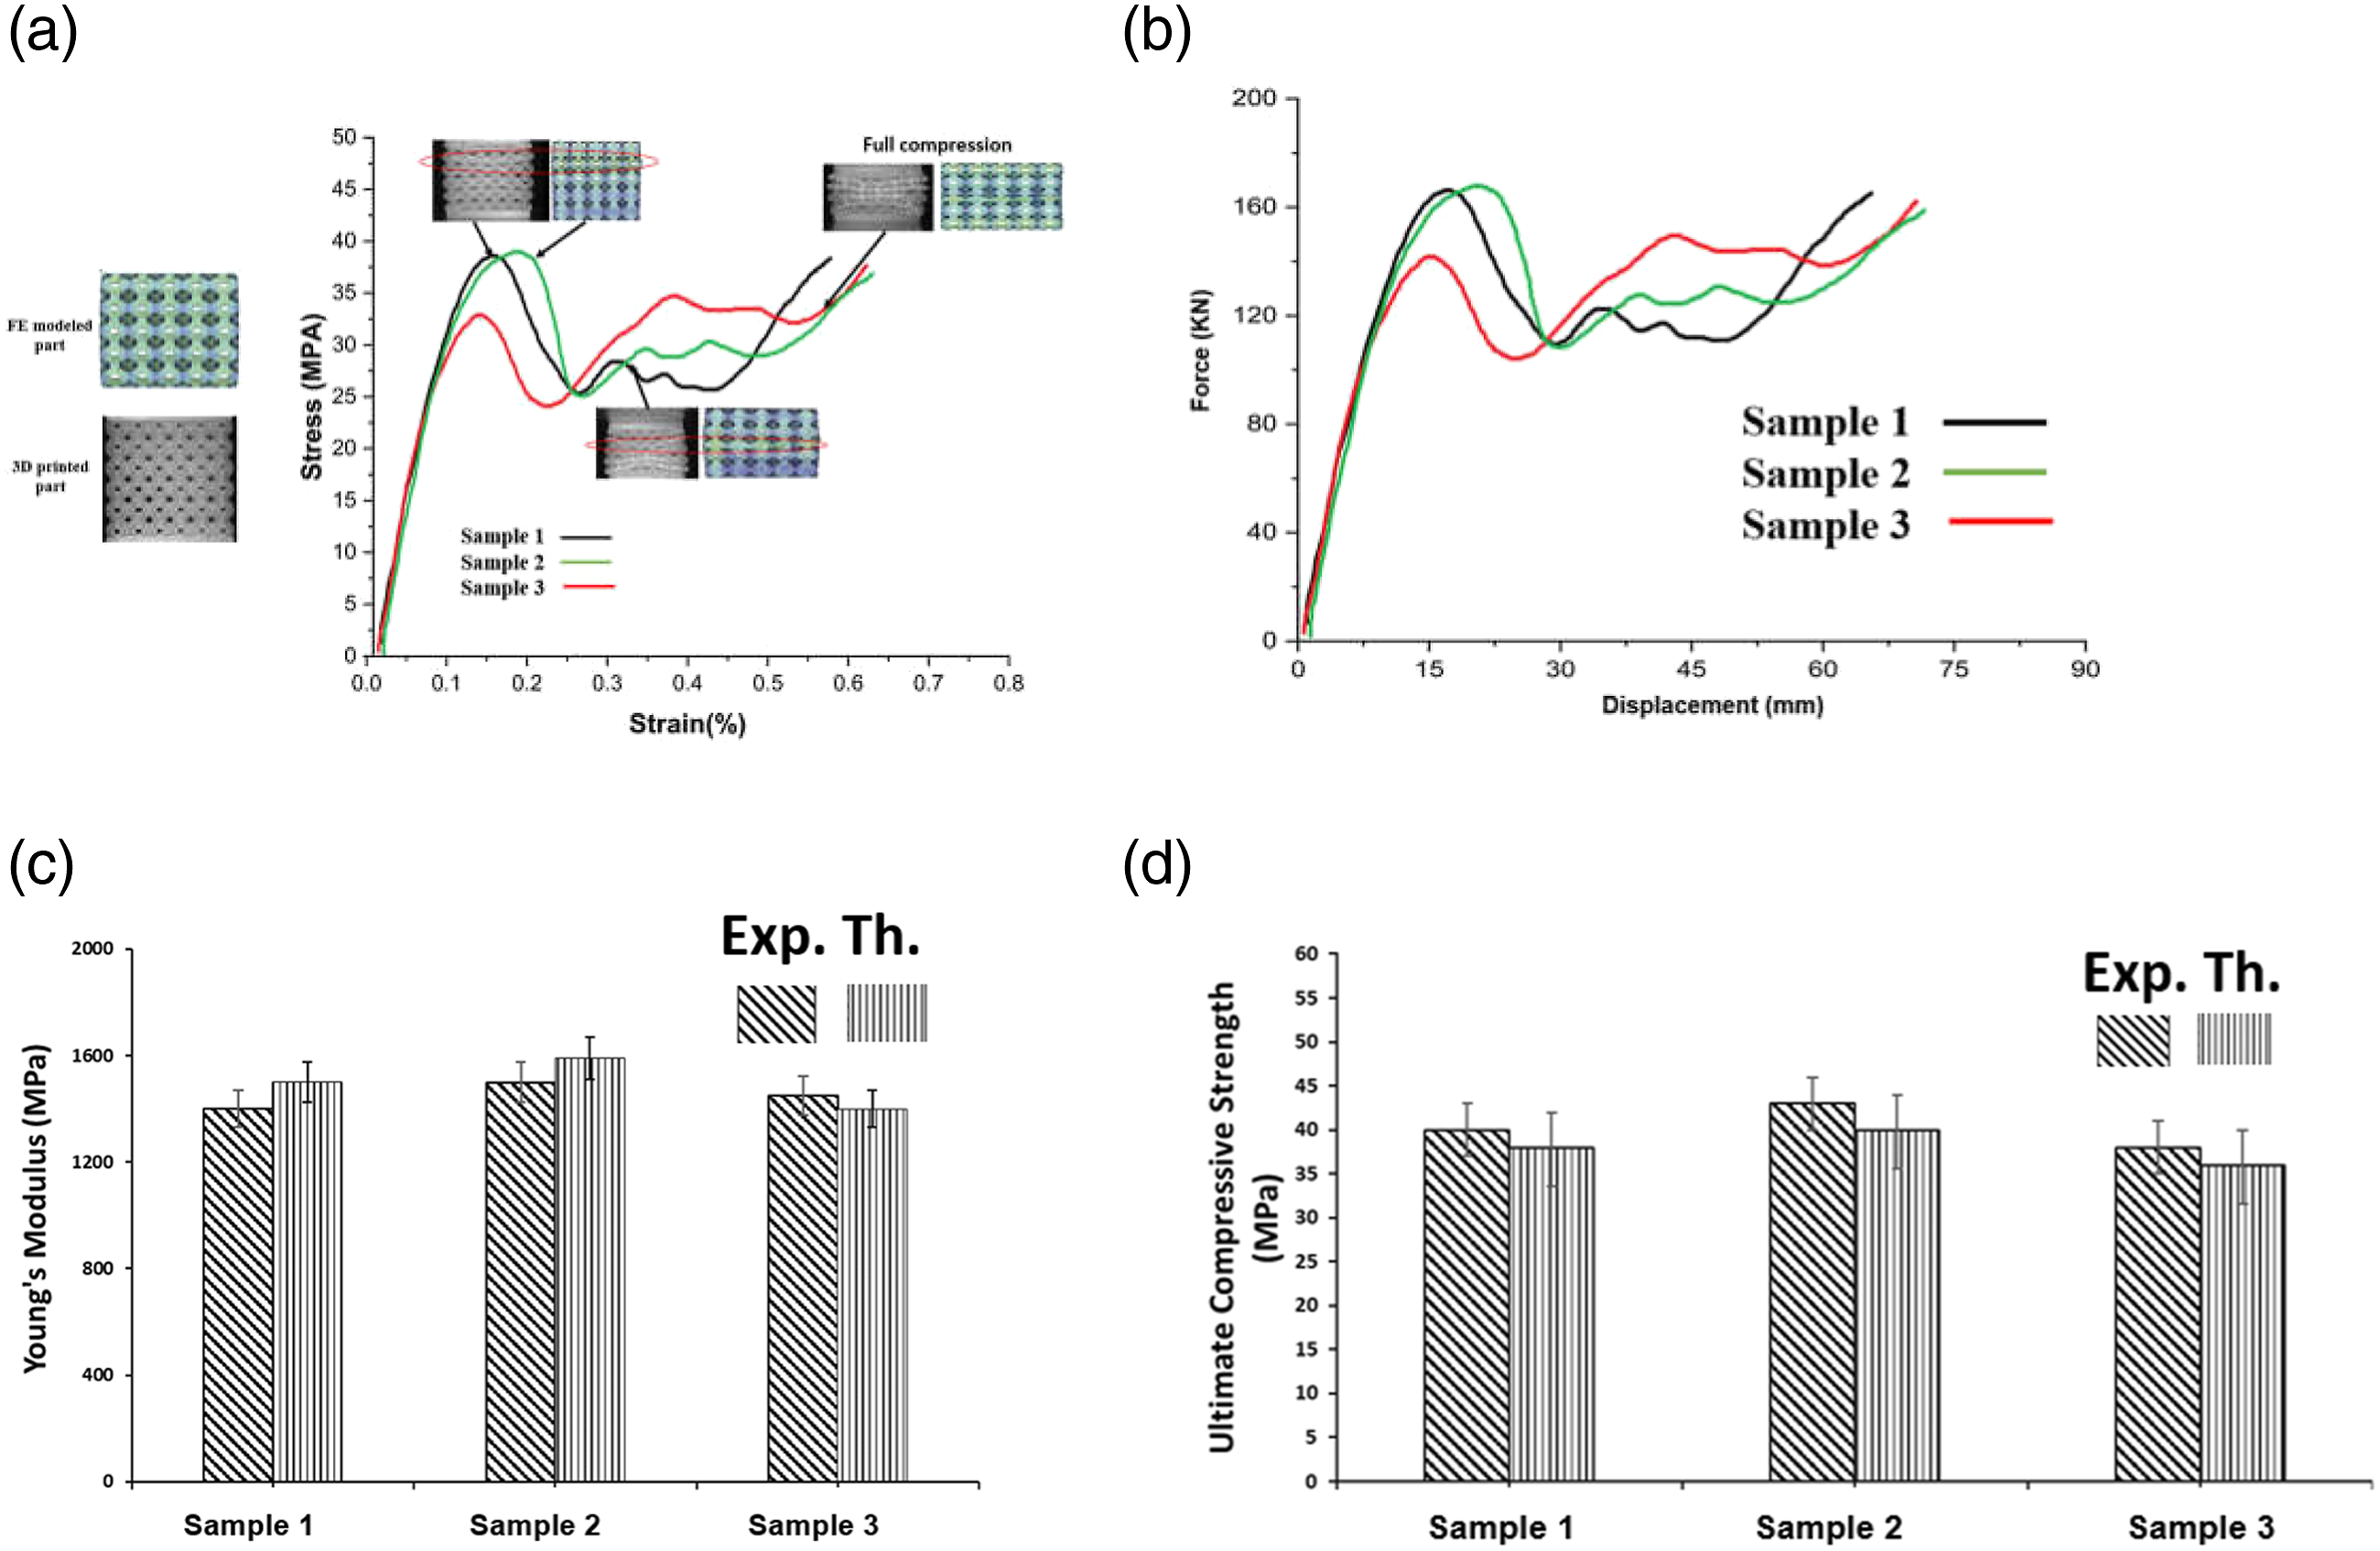
To achieve the 100% rapture or damage high amount of force would be needed. It can be seen also from the FE analysis and experimentation tests very identical results have been obtained. The prediction of failure from the FE analysis matches the actual failure through the experimentation tests. It can be concluded from the experimentation that material did not go into plastic deformation before any crack. Finally, the comparison of experimentation and in numerical analysis which was given in this study helped to figure out the properties and characteristics owned by a metamaterial-based structure which increases the application potential of such lightweight models in various applications. Since it is a comparative study between lattice materials or metal-materials, the use of an ASTM standard was not considered. But in the case of the tensile testing ASTM standards were used as per the requirement.
Conclusions
This study used FDM to design and develop an arbitrary lattice structure. The main goal was to determine how fundamental cell shape affects additive manufacturing samples’ mechanical properties. The uniaxial compression experimental tests conducted allowed the identification of the material model required for inclusion in the FE simulations carried out using the FE program and demonstrated the damage behaviour of 3D printed lattice. Before printing the lattice structures, the tensile samples were tested according to the ASTM standard, followed by the physical and theoretical testing of the lattices. It has been observed that, after testing of the 3 sets of lattices, the Young’s modulus is nearly about the 1,538 ± 120 MPa and the ultimate compressive strength about 40 MPa, which has been verified with the stress analyses carried out by using the CAD program. Identical results for the tensile samples have been observed. Further, the behaviour of the samples corresponds to the curves obtained from the testing, and the brittleness of the samples has shown the sharp changes in the curves. Though the distortion of the samples is observed after 40 MPa, which is characterized by the localization of vertical deformation upon impact in the same direction, This is attributed to mechanical instability caused by the inclined struts in the collapsing layer’s cells buckling. However, while being isotropic in terms of geometry and material, the lattice has the potential to develop asymmetrical damage. In the future, testing on various other shapes of lattices would pave the way for highly durable structures for various applications.
Footnotes
Acknowledgement
Authors would like to acknowledge the great support received from Dr. Sunpreet singh and Dr. Ranvijay kumar for the guidance.
Author contribution
Conceptualization, Narinder Singh and Gurminder Singh; Data curation, Ilenia Farina; Investigation, Narinder singh; Supervision, Francesco Colangelo; Validation, Narinder Singh; Writing— Narinder Singh and Gurminder Singh Writing— review and editing, Ilenia Farina and Francesco Colangelo. All authors have read and agreed to the published version of the manuscript.
Declaration of conflicting interests
The author(s) declared no potential conflicts of interest with respect to the research, authorship, and/or publication of this article.
Funding
The author(s) received no financial support for the research, authorship, and/or publication of this article.