
Abstract
Additive manufacturing is an emerging technique for manufacturing 3-D objects from the design of the component. Lattice structures are incorporated in metal and polymeric materials and find various applications in aerospace, marine, and other engineering fields. The present research work concentrates on incorporating hexagonal-shaped lattice structures through the fused deposition modeling (FDM) technique. The optimization was carried out by varying the printing process parameters such as infill density (80%, 90%, and 100%), layer thickness (0.1 mm, 0.2 mm, and 0.3 mm), and printing temperature (195°C, 205°C, and 215°C). The impact of printing parameters with respect to the quality characteristics responses such as tensile strength/density and dimensional area error can be considered for the optimization process. The samples are prepared using an L9 orthogonal array, and the process condition was optimized using the Taguchi optimization technique. The tensile strength/density is observed to be higher at a lower infill density of about 80%, a minimum layer height of 0.1 mm, and a maximum extrusion temperature of 215°C. From the ANOVA analysis results, the influential parameters sequence for the tensile strength/density was infill density > layer thickness > printing temperature. And the sequence of effective parameters for obtaining the lowest dimensional area error was infill density > printing temperature > layer thickness. Therefore, this research has found the application for incorporating hexagonal-shaped lattice structure in the PLA material. The material is capable of structural applications in automotive and marine applications, etc.
Introduction
Additive manufacturing (AM) is explained as the technique of integrating materials to form a three-dimensional (3-D) object by the American Society for Testing and Materials. 1 It has been developed in a mercantile manner since the late eighties. The additive manufacturing process is quite the opposite of the principle of the subtractive fabrication process. 2 Other terms for the additive manufacturing process are as follows: solid freedom fabrication, additive processes, layer manufacturing, direct digital manufacturing, additive fabrication, rapid manufacturing, and rapid prototyping. 3 The AM process plays a significant role in manufacturing the functional and structural parts and the manufacturing of small-sized components of the prototypes. 4 Other applications are as follows: complexity in the geometry of the elements, usage of materials, and energy. 5 The additive manufacturing process helps remove the additional materials, and it also helps create the finite shape for the industry’s demanding models. 6 The method of additive manufacturing drastically reduces time. It also can build parts that cannot make through subtractive fabrication, and the cost for fabricating small stakes is very efficient compared to other methods. The widespread technique used in the generation of the polymers is the FDM (Fused Deposition Modeling). 7
Fused Deposition Modeling (FDM) is a 3D printing or additive manufacturing process in which the material is deposited layer by layer through the nozzle. 8 Currently, FDM parts have applications in various fields such as aerospace, medicine, construction, and civil applications. 9 The FDM process is most popular nowadays due to its cost-effectiveness, easy-to-use, and acceptance for various thermoplastic materials such as PLA, ABS, PC, and acrylic. 10 During the FDM process, the polymeric materials are deposited in a layer-by-layer manner. So, there is a chance of a weak interlayer boundary that will affect the prepared component’s quality. 11 There is a necessity to optimize the various process parameters before preparing the FDM components.
Many reports are available in the process optimization of the FDM process concerning the study of the mechanical properties under static loading conditions. Dong et al. 12 has optimized the various FDM process parameters for the mechanical properties. The result shows that the raster angle, layer thickness, infill density, and build orientation play a significant role in printing PLA components. Wang et al. studied the various process parameters for the FDM printing of PLA materials. 13 And the results depict that layer thickness has a significant influence on the interlayer bonding strength. Qattawi 14 optimized the FDM process using experimental parameters such as infill percentage, infill pattern, layer thickness, and extrusion temperature. The results highlight that the optimum combination for attaining the high tensile strength will be higher temperature, high infill density, lower layer thickness, and a hexagonal line pattern.
The strength of the additive manufactured component is lower than the molded components. But, the material usage and application of the additive manufactured polymer component is exceptional. In recent days, additive manufactured polymer components have got a great demand in structural applications. Some researchers are attempting to improve the strength of the various thermoplastic polymers by adding the fiber particles as reinforcement. 15 Vinyas et al., has developed the organically modified nano clay and short carbon fiber reinforced PETG composite. The results highlighted that, the added clay which improves the damping property of the PETG composite.16,17
The structures are introduced into the additive manufactured components for energy absorption from the applied load. 18 The celluloid structure can be classified as a three-dimensional structure such as lattice and a two-dimensional structure such as honeycomb. 19 So, this kind of structure can be used as structural and support elements in the various end applications. 20 Incorporation of lattice structure has impacted the huge variation in the strength and mechanical properties of the 3D printed polymeric materials. And also, the failure modes and mechanisms should be varied with different lattice structures and it should be investigated experimentally. 21
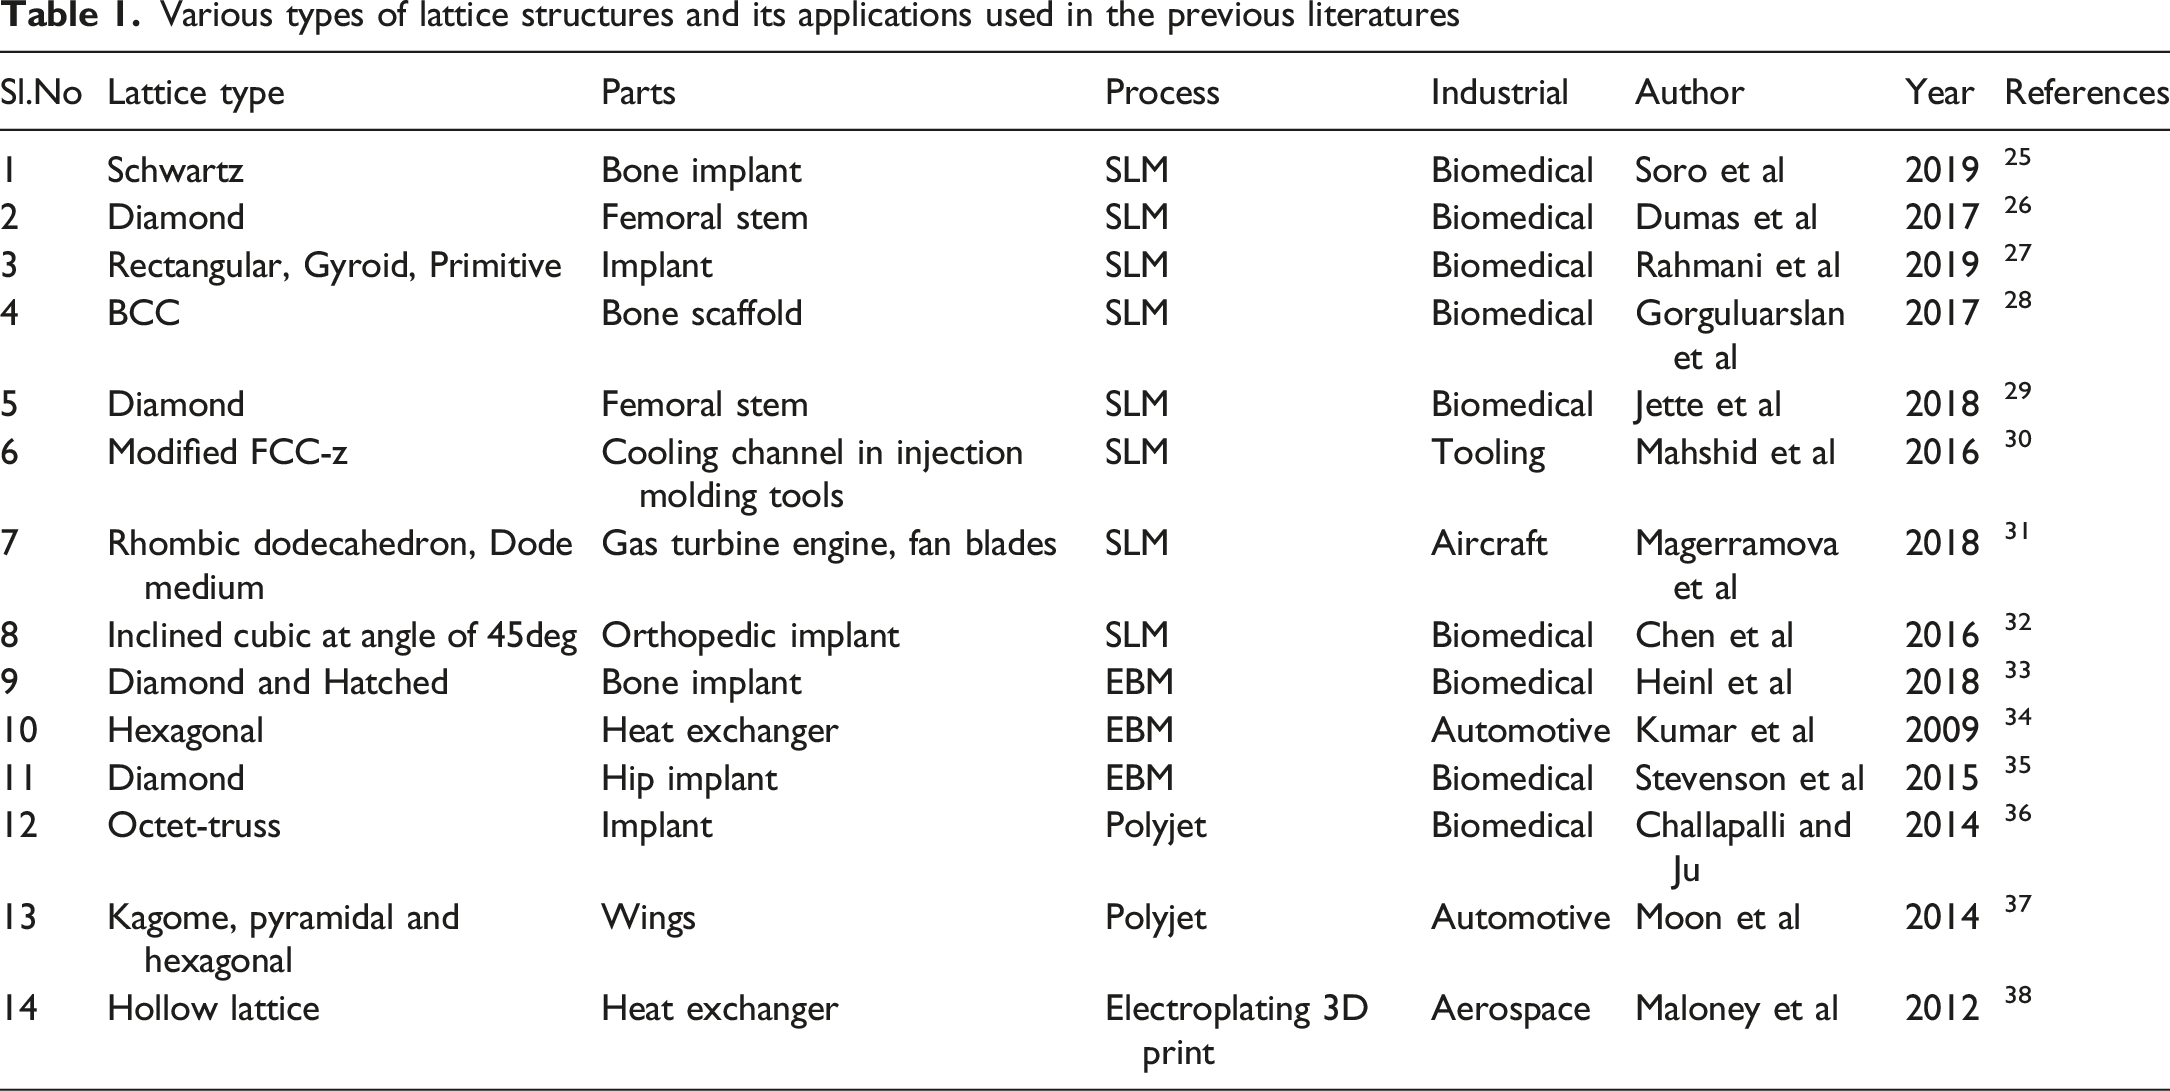
Various types of lattice structures and its applications used in the previous literatures
Apart from the geometric parameters of the polymer material, the lattice structure, strength, and quality were influenced by the printing process parameter. Vishwas et al., has optimized the process parameter for the FDM process, to print the ABS and Nylon materials. The result shows that the printing orientation and shell thickness has affect the quality of the dimensional accuracy. 39 Joseph et al., has studied the effect of in plane compressive properties of additively manufactured ABS and PLA based hexagonal shaped honeycomb structures. The results highlighted that, the loading rate of 100 mm/min, with a maximum cell wall thickness the rupture occurred due to stress softening effects. 40
In this research work, the hexagon shaped lattice structure was included in the PLA matrix, compared with the previous work there is limited studies available on the lattice structure incorporation in the polymeric materials. The novelty of the present work is to reduce the density of the component by converting the fully filled material with design structure and reducing the infill density of the printed components. This work clearly describes the impact of each parameter with respect to dimensional accuracy and tensile strength/density for the incorporated hexagonal shaped lattice structure.
The present work deals with the process parameter optimization of hexagonal lattice structure on the PLA polymeric material using the FDM technique. This study implicates the process optimization of the mechanical properties such as the tensile strength/density and dimensional area error of the prepared hexagonal lattice structure incorporated PLA sample. The process optimization was done by an L9 orthogonal array followed by the Taguchi optimization technique. By using analysis of variance techniques, the percentage contribution of each parameter and percentage with respect to experimental and predicted results were analyzed.
Materials and method
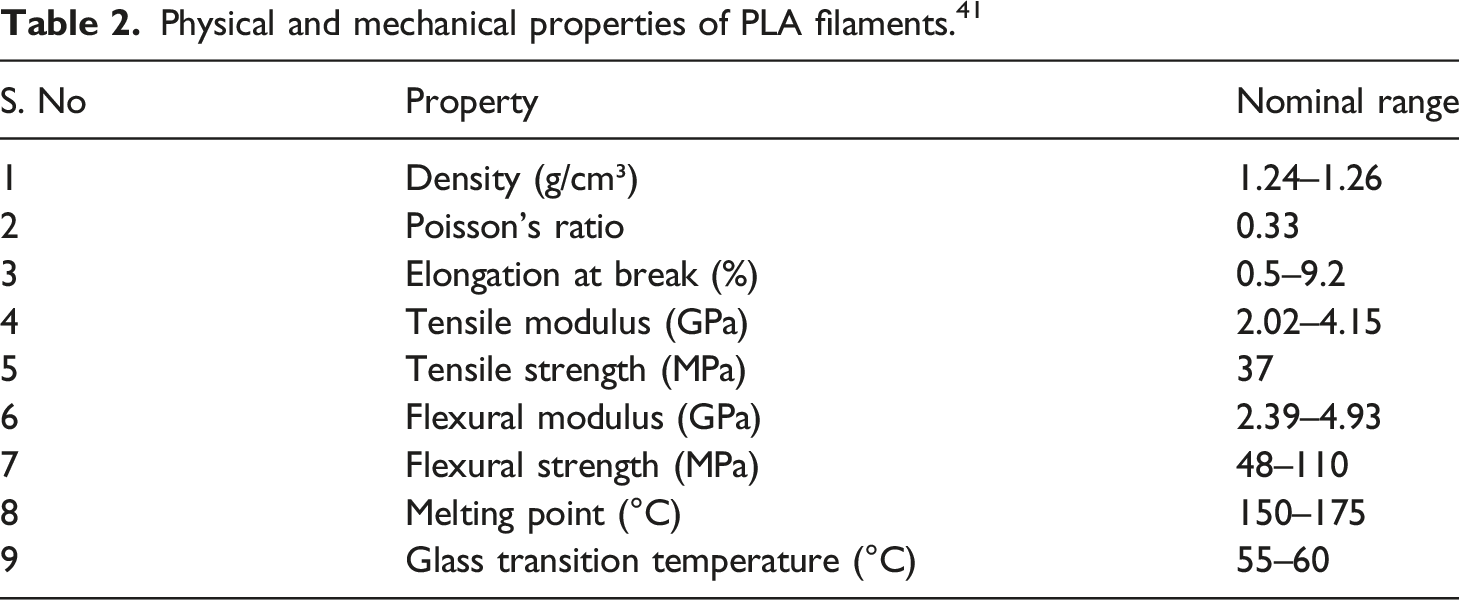
Physical and mechanical properties of PLA filaments. 41
Design modeling of the polymeric specimens
The hexagonal lattice structure was modeled in the solid PLA tensile samples by using CATIA V5 R20 3D modeling software. The hexagonal lattice structure with a unit cell of length 1 mm. The sample was prepared with a thickness of about 3.6 mm. The 2D pictorial representation of the prepared lattice structure sample is shown in Figure 1(a). (a) Front view of 3D printing machine (b) side view of 3D printing machine (c) PLA spool.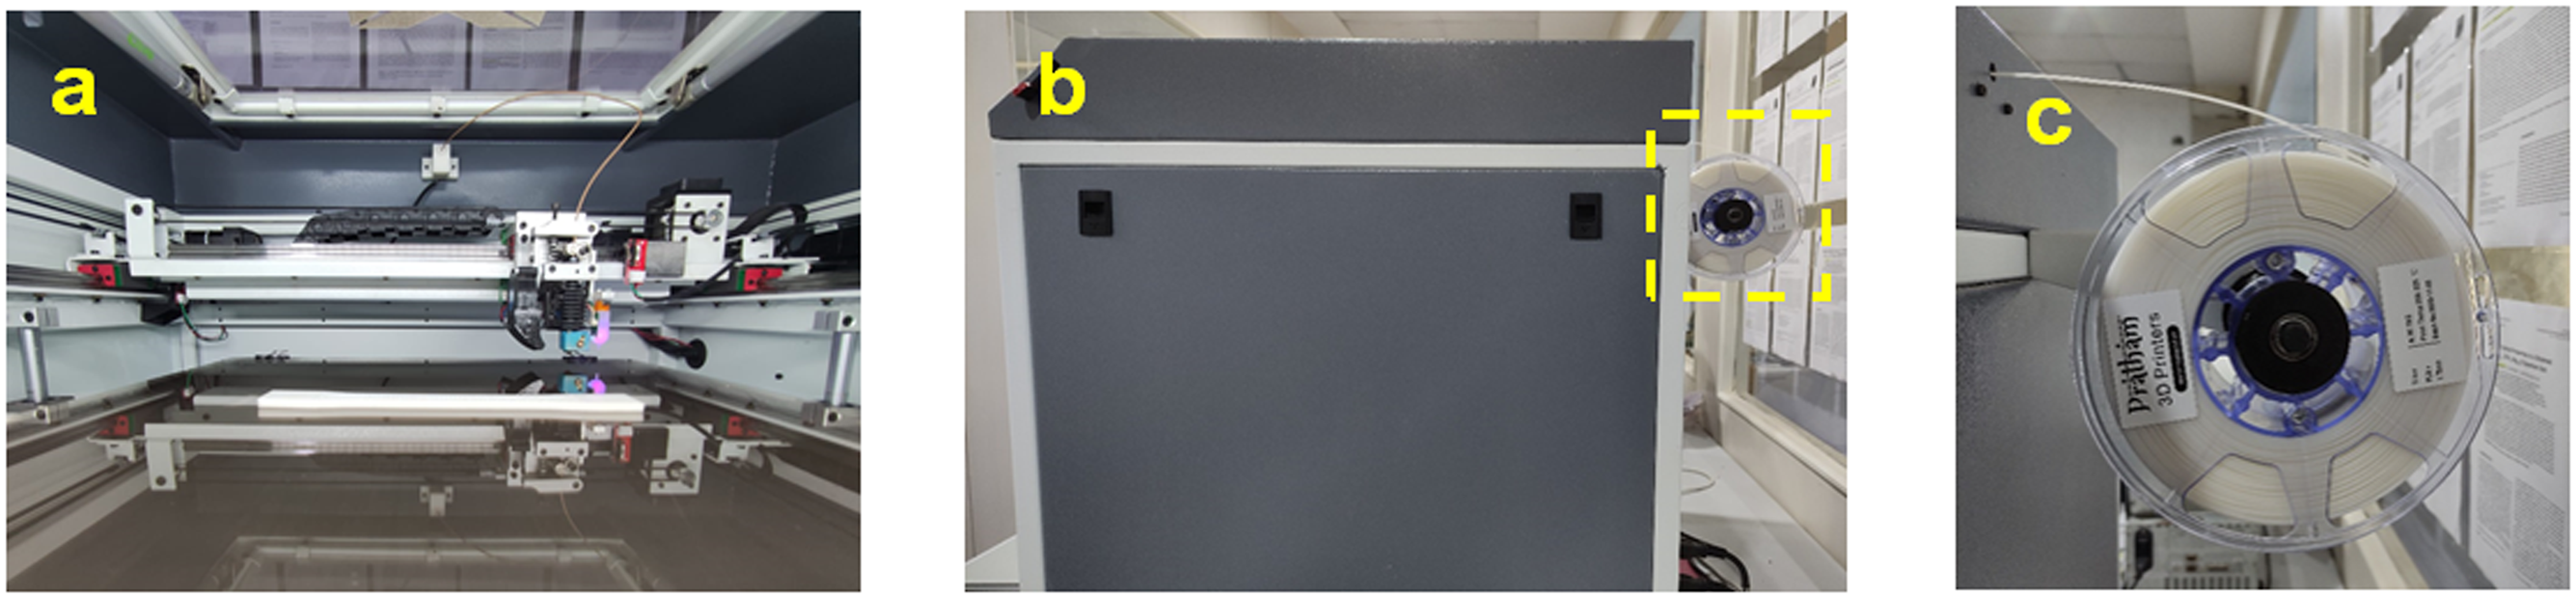
Sample fabrication
Constant printing parameter for the printing of lattice structure using 3D printing.
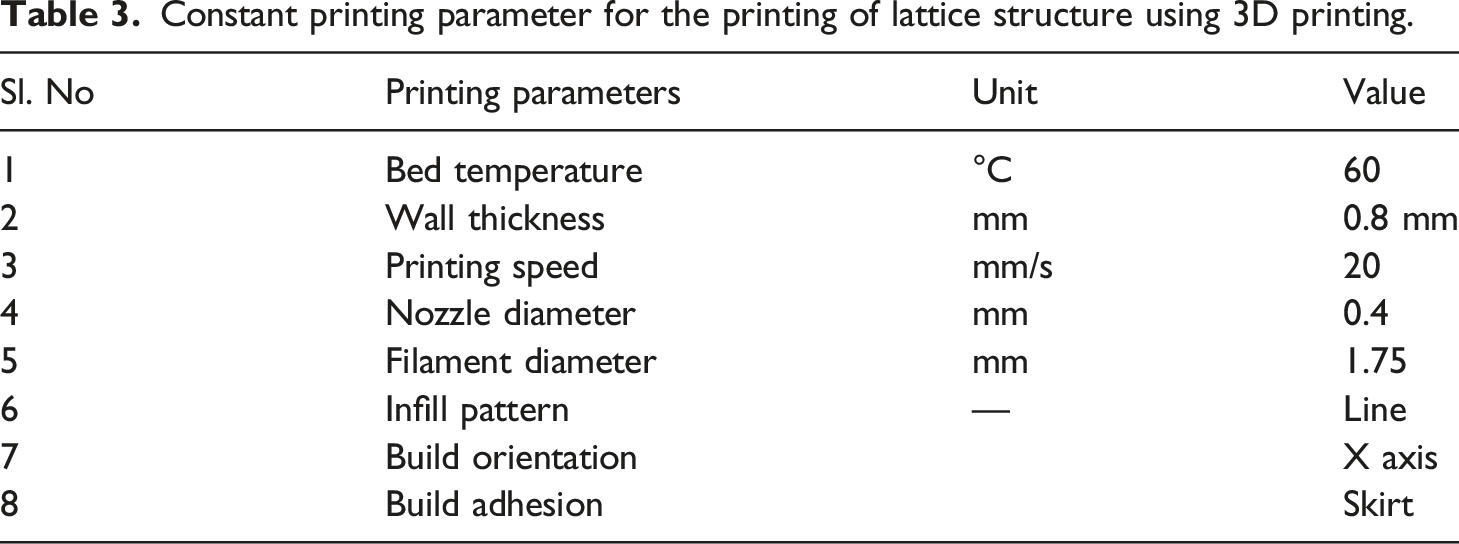
Figure 2(a) to (c) show the three-dimensional model and the prepared hexagonal lattice structure sample. Secondary pre-treatment processes are not involved in maintaining any deviation in the experimental results. For each test parameter, ten sets of samples are prepared. For nine trials, 90 samples are prepared for the optimization process. The designed model of the hexagonal lattice structure was sliced using the open-source software (Ultimaker Cura). The sliced layer of each model is converted into a set of instructions for the 3D printer to print the samples. This set of instructions are referred to as G-Codes.
45
Hexagonal lattice structure on the (a) Line diagram, (b) 3D design, and (c) prepared polymer sample.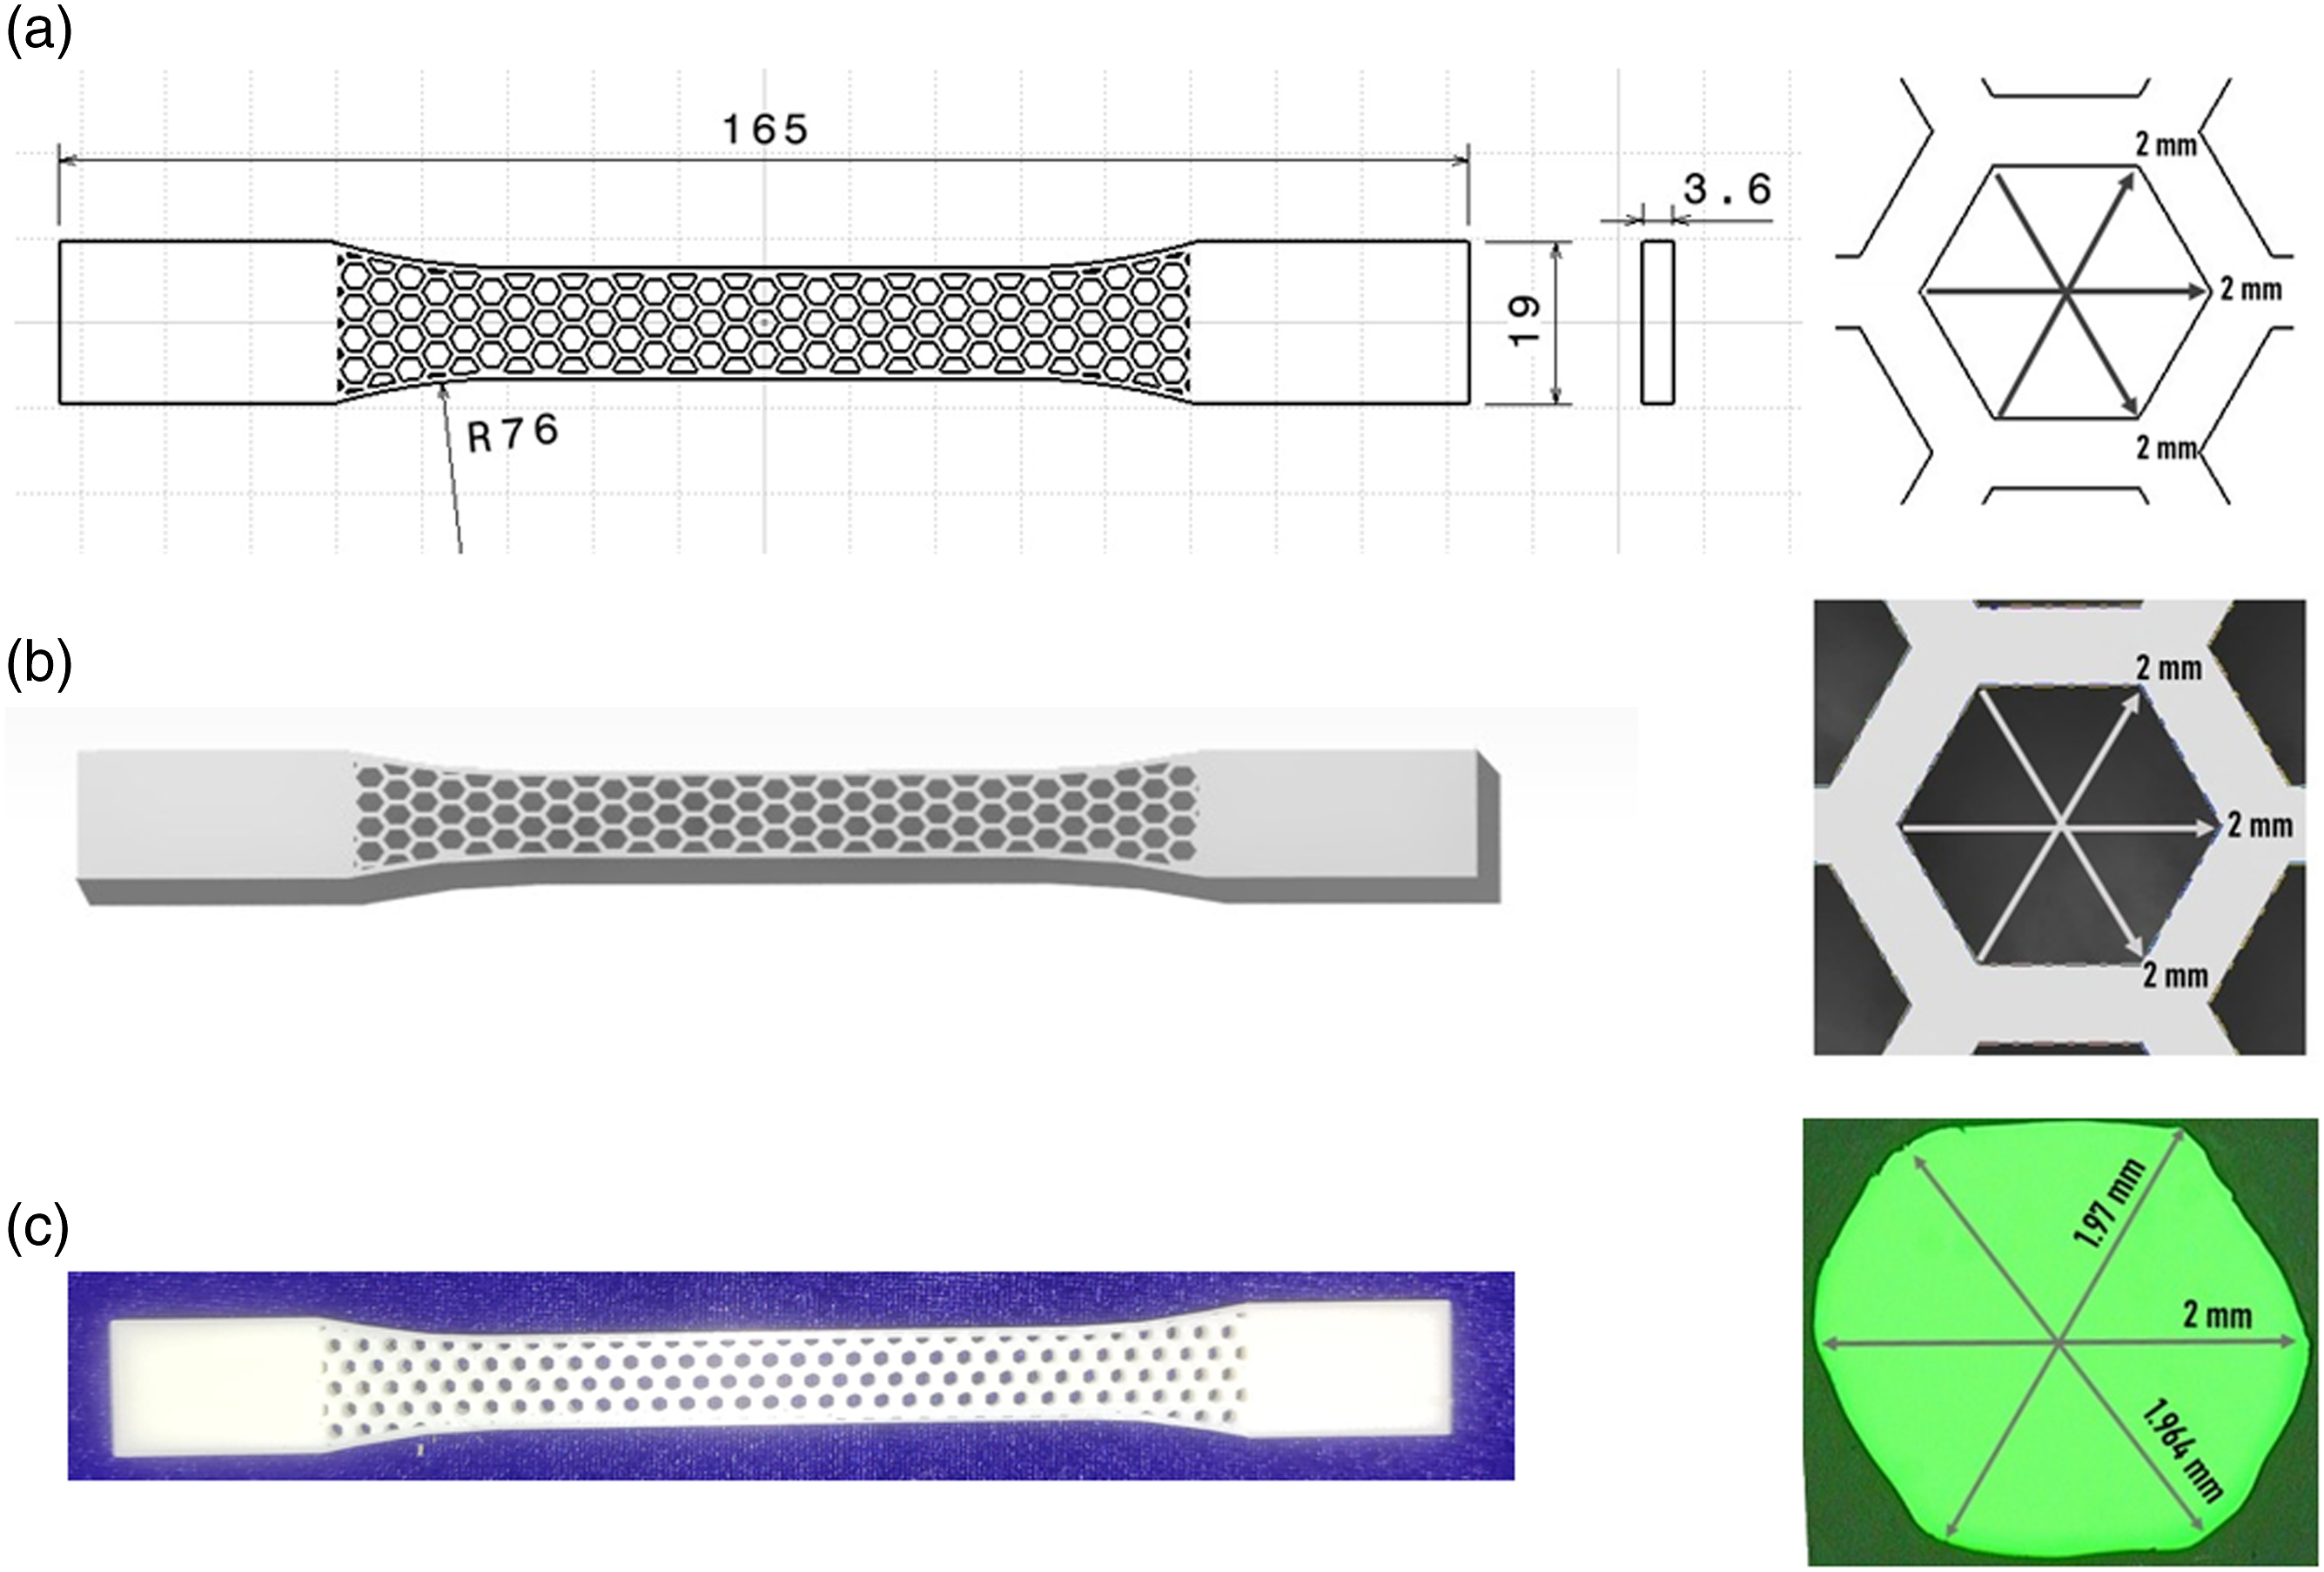
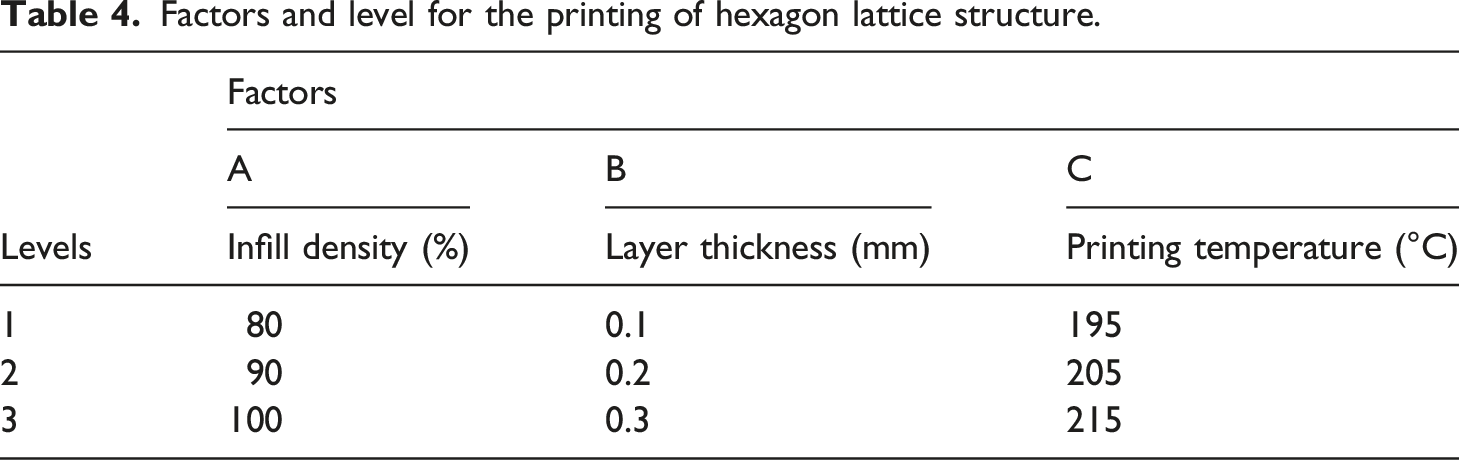
Selection of process parameters for sample preparation
Factors and level for the printing of hexagon lattice structure.
Mechanical testing and area measurement of the prepared sample
Tensile tests for the hexagonal structure modeled tensile samples were tested in a universal tensile testing machine (Make: Bluestar, India). The samples are prepared as per the ASTM D638 standard. 46 The machine has a cable for testing the maximum loading capacity of 50 kN. The dog bone-shaped tensile sample was loaded in the anvil (or) gripper for conducting the tensile test. An experiment such as the tensile test was carried out with a 5 mm/min feed rate. The ten samples are tested for each test condition, and the average values are considered for the optimization process. From the recorded results, the ultimate strength for each parameter was considered for the optimization process.
Dimensional area error is calculated to measure the variation or deviation that occurred during the printing of the samples is required dimensions such as structures like hexagons. It was calculated using a video measurement system (Model: Video measurement system (VMS 2010)) with a various magnification range of 4.5 X. By using the video measurement system, the length and width of each cell wall are measured. Hexagon shaped structure area was measured by using the equation (1) mentioned below, the area of the hexagonal shaped lattice structure is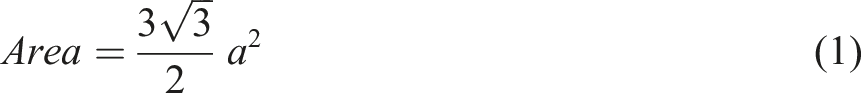
An average of 10–15 hexagon structures was measured, and the average is considered the dimensional area error.
Taguchi experimental design and analysis
The Taguchi experiment is used to optimize maximum tensile strength/density and minimum dimensional area error concerning reliable process parameters. 47
The analysis of variance is performed to find out the most significant printing process parameter for printing the hexagonal lattice structure on the PLA polymeric materials. Based on the experimental results and process parameters, the mathematical model is developed. The percentage contribution of each individual printing parameter was evaluated by using the regression equation. The percentage error was measured by plotting against the experimental and the predicted values. The maximum tensile strength/density and the minimum dimensional area error, considered the resilience parameter to obtain maximum strength, is the output requirement without affecting the quality of the specimens. The experimental results, such as the tensile strength/density and dimensional area error, are converted into an S/N ratio for the Taguchi analysis.
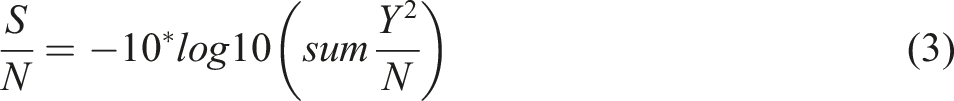
The maximum tensile strength/density and minimum dimensional area error are considered the output response parameter for optimizing the incorporation of the hexagonal lattice structure in the PLA material using the 3D printing method. For optimizing the tensile strength/density, the larger the best condition is followed, and the dimensional area error, the smaller the best condition is observed. The expression for the respective response is shown in equations (2) and (3) mentioned below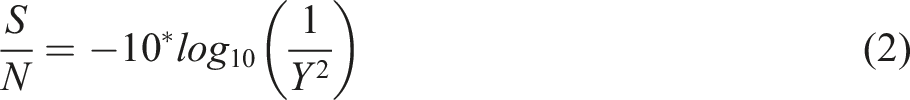
The statistical analysis was conducted in the Minitab 2020 statistical software tool. 48 Analysis of variance technique is followed to find out the most influencing factor with respect to the various experimental conditions. In the current 3D printing process, the 95% confidence level and 5% significance level were set to determine the interaction of each parameter for printing lattice structure in the components. The experimental results, depicts the most influencing factors for obtaining the maximum tensile strength/density and minimal dimensional area error. Furthermore, the regression equation and model for the best fit were predicted with independent factors such as infill density, layer thickness, and printing temperature and dependent variables such as tensile strength/density and dimensional area error.
Results and discussion
General analysis of the signal to noise ratio for tensile strength/density
Process parameter and results of orthogonal array for the optimization experiment.
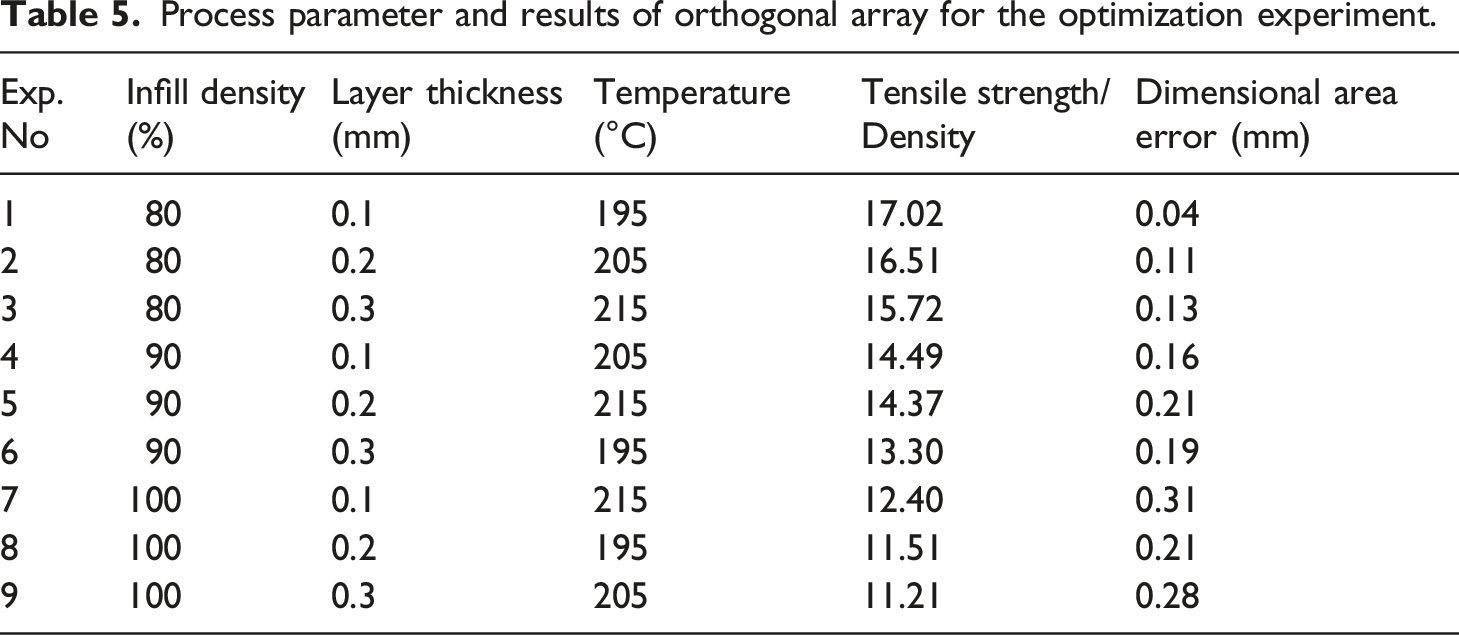
Figure 3 shows the signal-to-noise ratio for the tensile strength/density of the hexagonal lattice structure of the PLA samples by varying the process parameters such as infill density, layer thickness, and temperature. Signal to Noise ratio plot for the tensile strength/density of the printed PLA sample.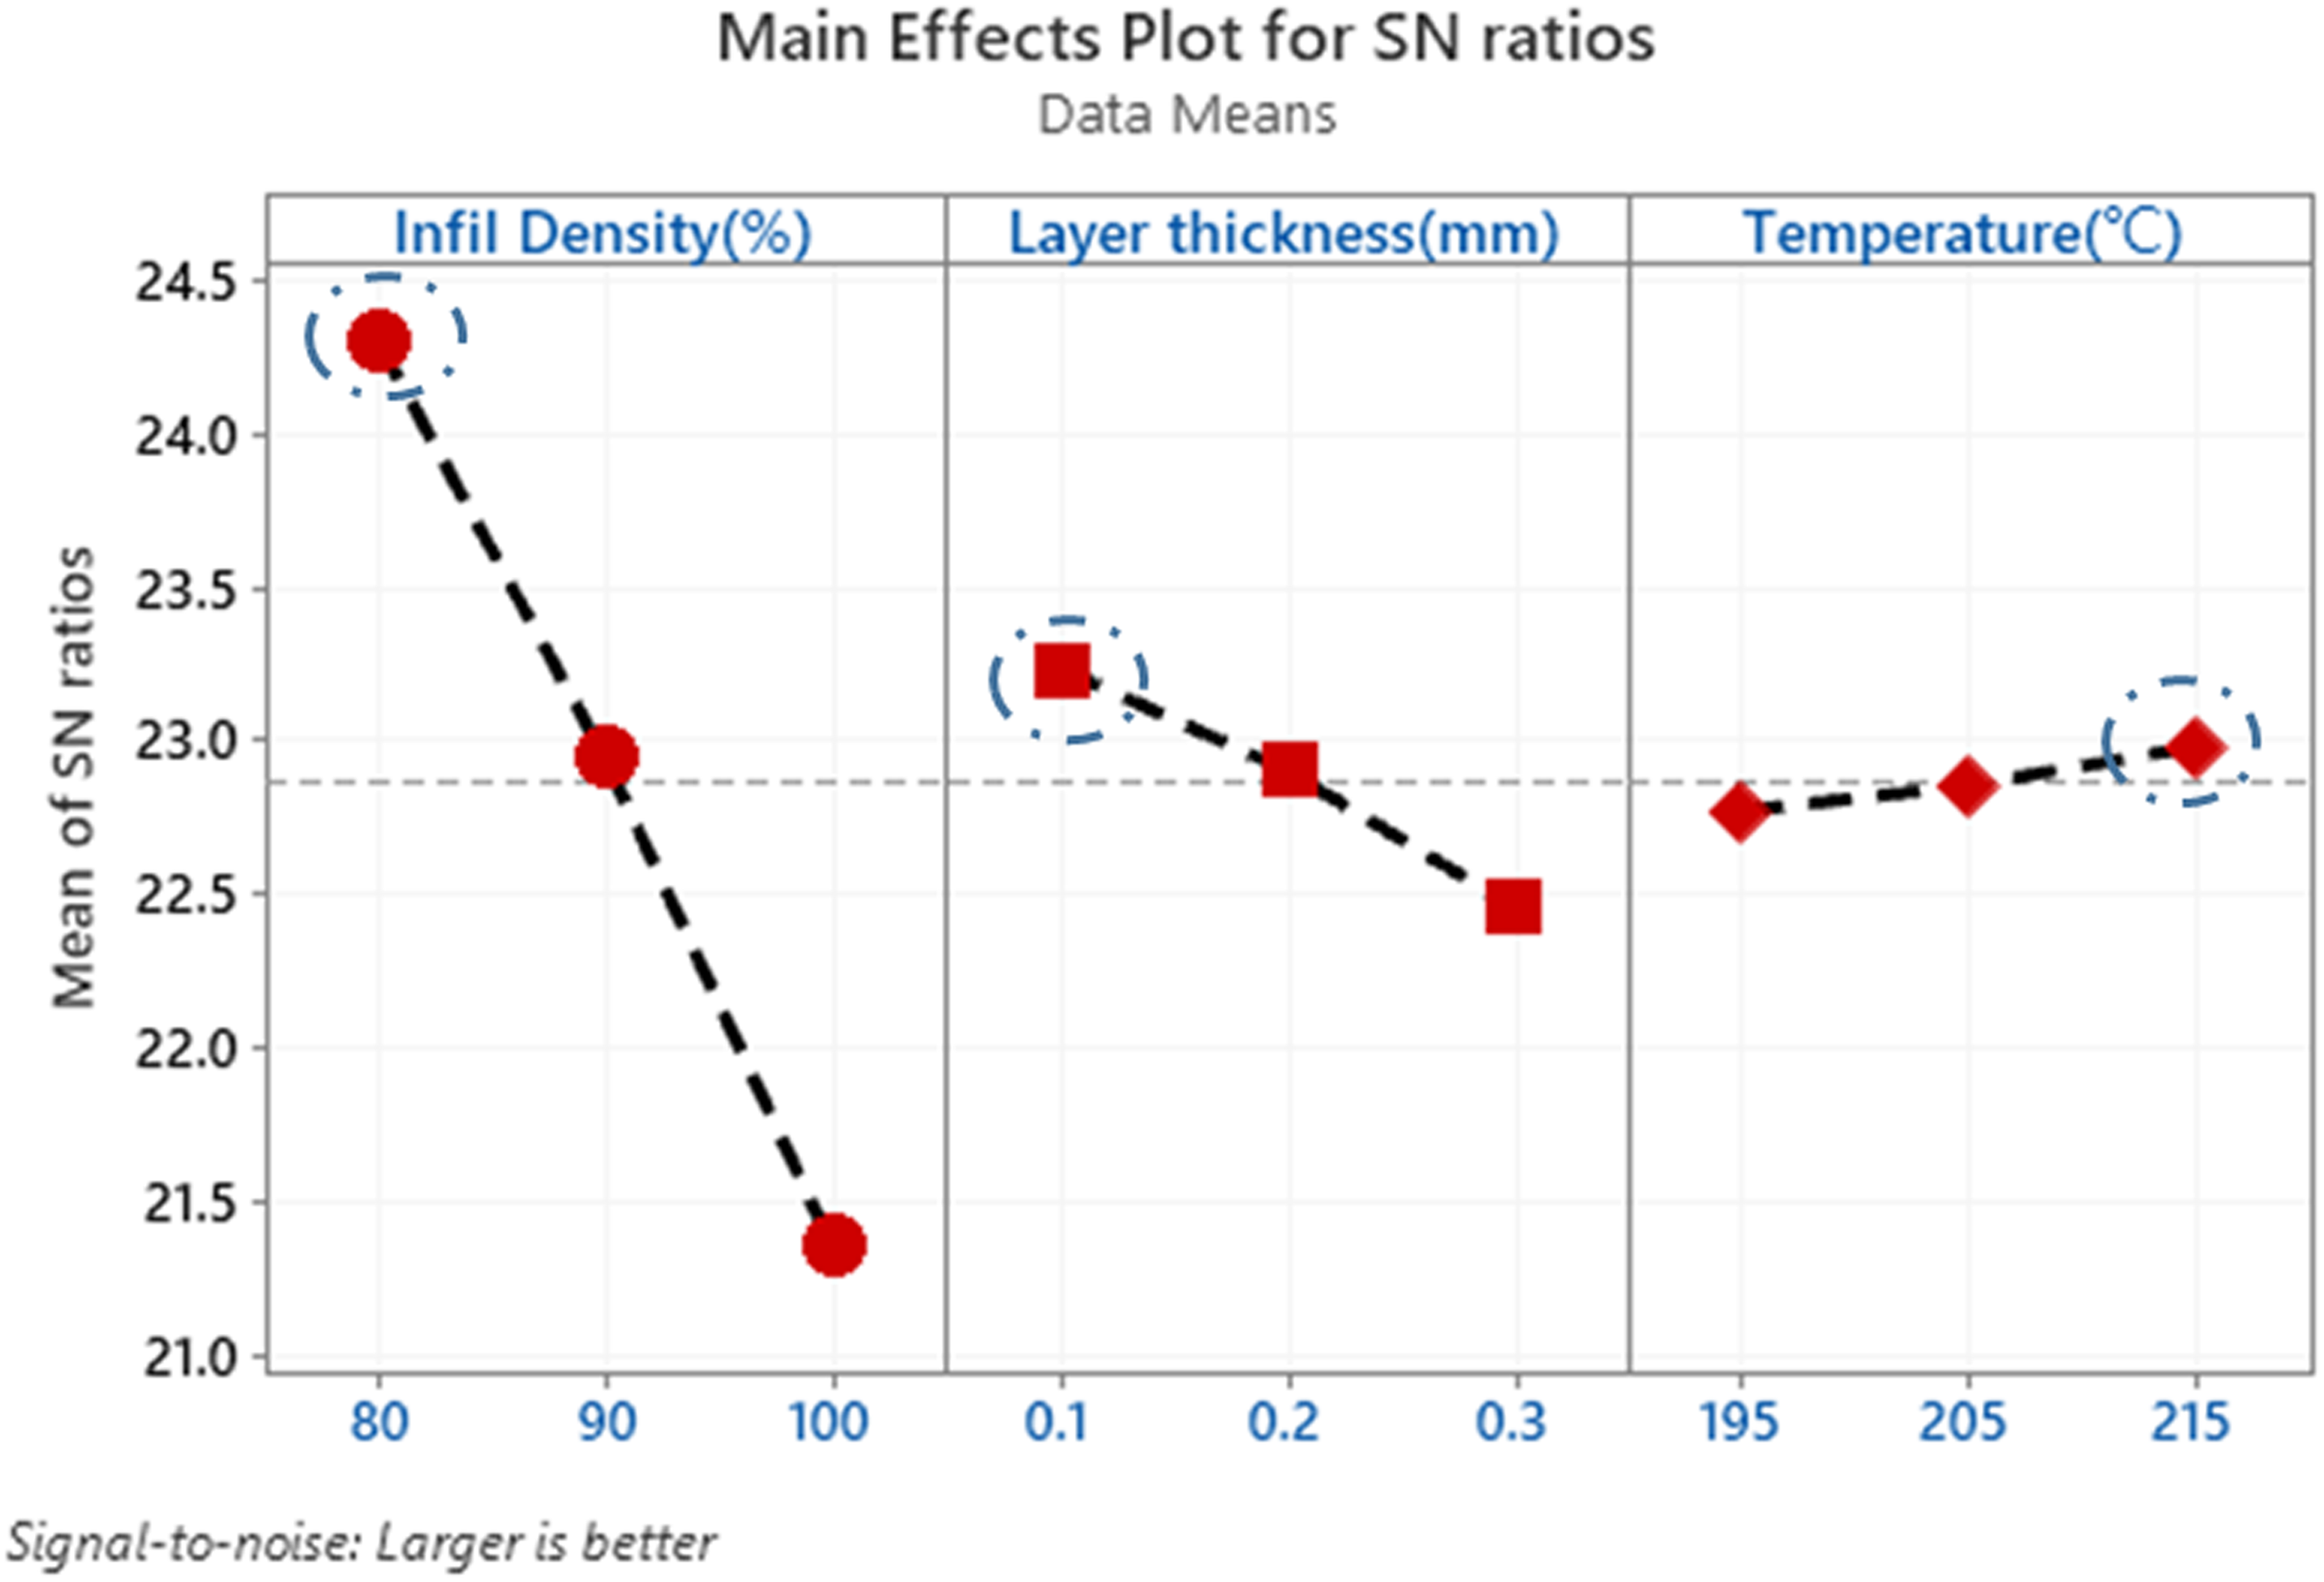
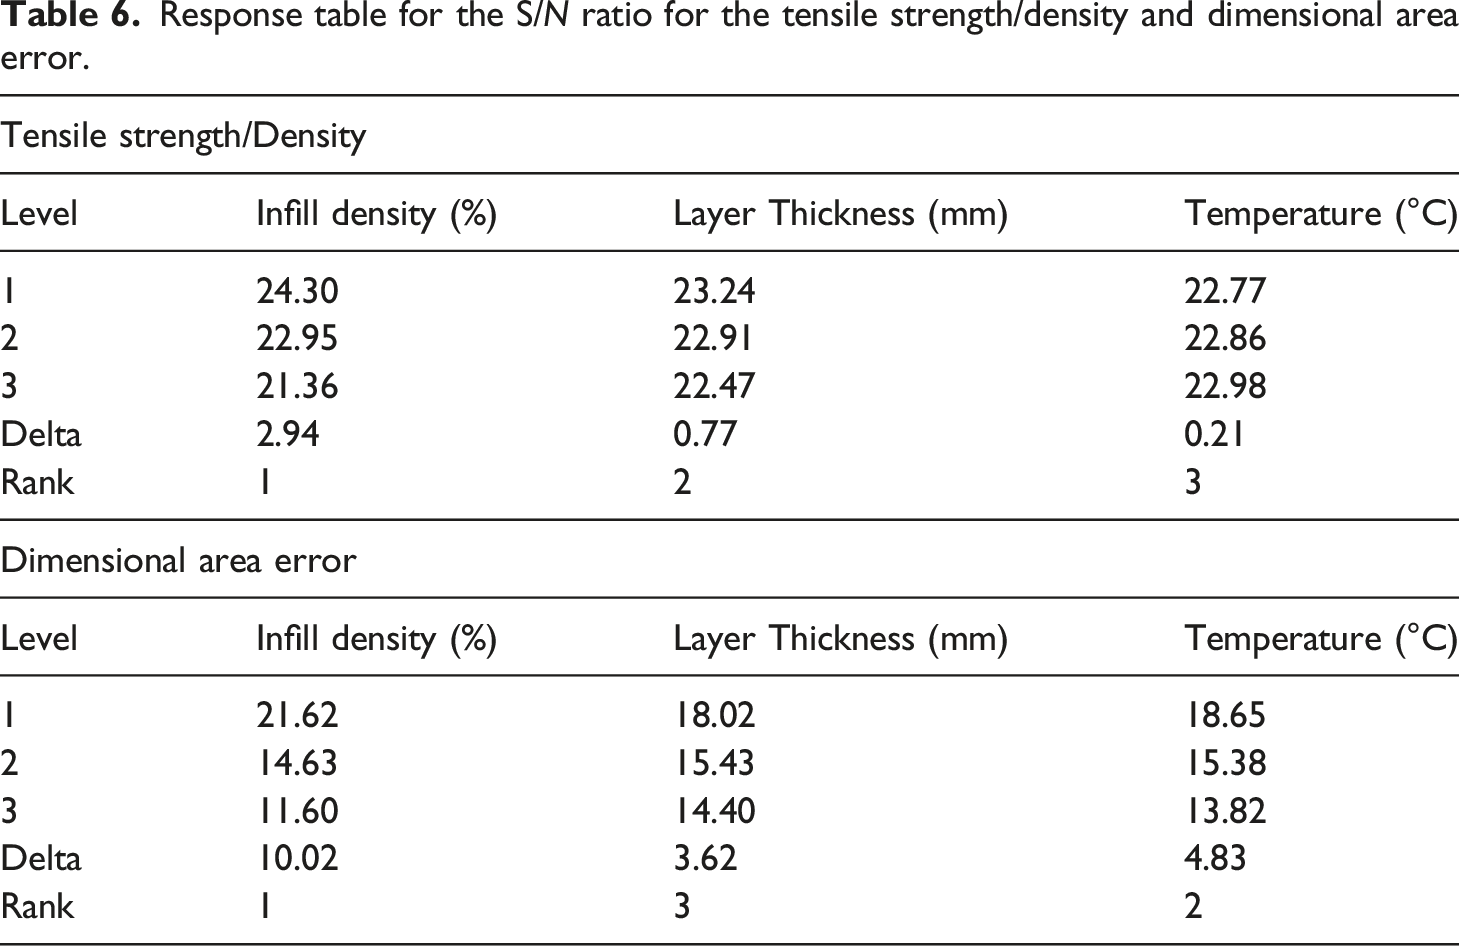
Figure 3(a) shows the factor such as infill density with various levels such as 80%, 90%, and 100% for the tensile strength/density response. The maximum signal-to-noise ratio value of 24.30 was obtained on the lower infill density of 80%. A lower infill density of 80% shows the maximum tensile strength/density response. In present case, without considering the density of the printed sample, the maximum tensile strength was observed on the highest infill density. This is due to higher infill density, there is no gap between each layer; bonding between the next layer was good at higher infill density. This results in a continuous layer of resin that absorbs more energy and withstands stress before breaking for a higher load than the lower infill density conditions. By considering the density of the printed component, the S/N ratio was higher for the lowest infill density of 80%. This is due to the fact that, at lower infill density condition the density of the component gets reduced at the same time, the material which has withstand for certain similar load value for the 100% infill density samples. This clearly shows that considering the density of the component, the infill density has a major impact on the output response of the polymer samples. Aw et al. 49 have observed similar results, that the infill density has a most influential parameter on the strength of ABS/ZnO composite.
Figure 3(b). shows the factor such as layer thickness with various process conditions such as 0.1 mm, 0.2 mm, and 0.3 mm, for the tensile strength/density response. The maximum signal-to-noise ratio value for the layer thickness parameter concerning the tensile strength/density of hexagonal lattice structure designed PLA polymer will be 23.24 at 0.1 mm layer thickness. The reason for decreasing the tensile strength/density is that as the layer thickness decreases, there is a chance of creating large interface gap was formed between each layer and material gets easily slide over from one layer to another layer. Likewise, there is an increase in the layer thickness, number of layers gets reduced which does not transfer the load efficiently with another layer. Compared with the 0.2 mm layer, the 0.3 mm layer has obtaining lower tensile strength/density property. Sood et al. studied the various process conditions on optimizing Fused Deposition Modeling processes. 50 These results are in line with the experimental results for the layer thickness parameter.
Figure 3(c). shows the factor such as printing temperature concerning various levels of 195°C, 205°C, and 215°C for the tensile strength/density response. The results show that the maximum signal-to-noise ratio value for the printing temperature process parameter concerning the hexagonal lattice structure designed PLA polymer will be 22.98. As the extrusion temperature increases, there is an increase in the tensile strength/density response of the prepared hexagonal lattice structure influenced by polymer samples. The reason for the improvement in the tensile strength/density response is, as the temperature increases, the fusion of each layer is high up to a specific limit. This results in increasing the stiffness of the polymer samples. A similar effect was also observed by Sanatagr et al. on the PLA polymeric samples. 51 For printing hexagonal shaped lattice structure on the PLA matrix, the printing temperature has negligible effect when compared with other two printing parameters.
From the overall experimental results, the best condition for obtaining higher tensile strength/density for incorporating hexagonal lattice structure in the PLA material will be a combination of lower infill density of 80%, a minimum layer height of 0.1 mm, and a maximum extrusion temperature of 215°C.
General analysis of the signal to noise ratio for dimensional area error
Figure 4 shows the S/N ratio plot of dimensional area error of the hexagonal lattice structure printed on the PLA polymeric samples. The process parameters such as infill density, layer thickness, and extrusion temperature were optimized to obtain the lowest dimensional area error for the hexagonal lattice structure. Figure 4(a) shows the factor infill density, which significantly influences the area error for incorporating structures in the PLA polymer materials. The maximum S/N ratio value of 21.62 was observed on the infill percentage of 80%. By increasing the infill percentage, there is a chance of increasing the dimensional error. This is due to a higher infill percentage; the number of repetitive cycles for the printing of specimens increases, resulting in a chance of obtaining dimensional area error in the printed samples. Qattawi
14
reported a similar observation on the PLA materials for incorporating various infill patterns such as linear hexagon and rectilinear. Signal to Noise ratio plot for the dimensional error of the printed PLA sample.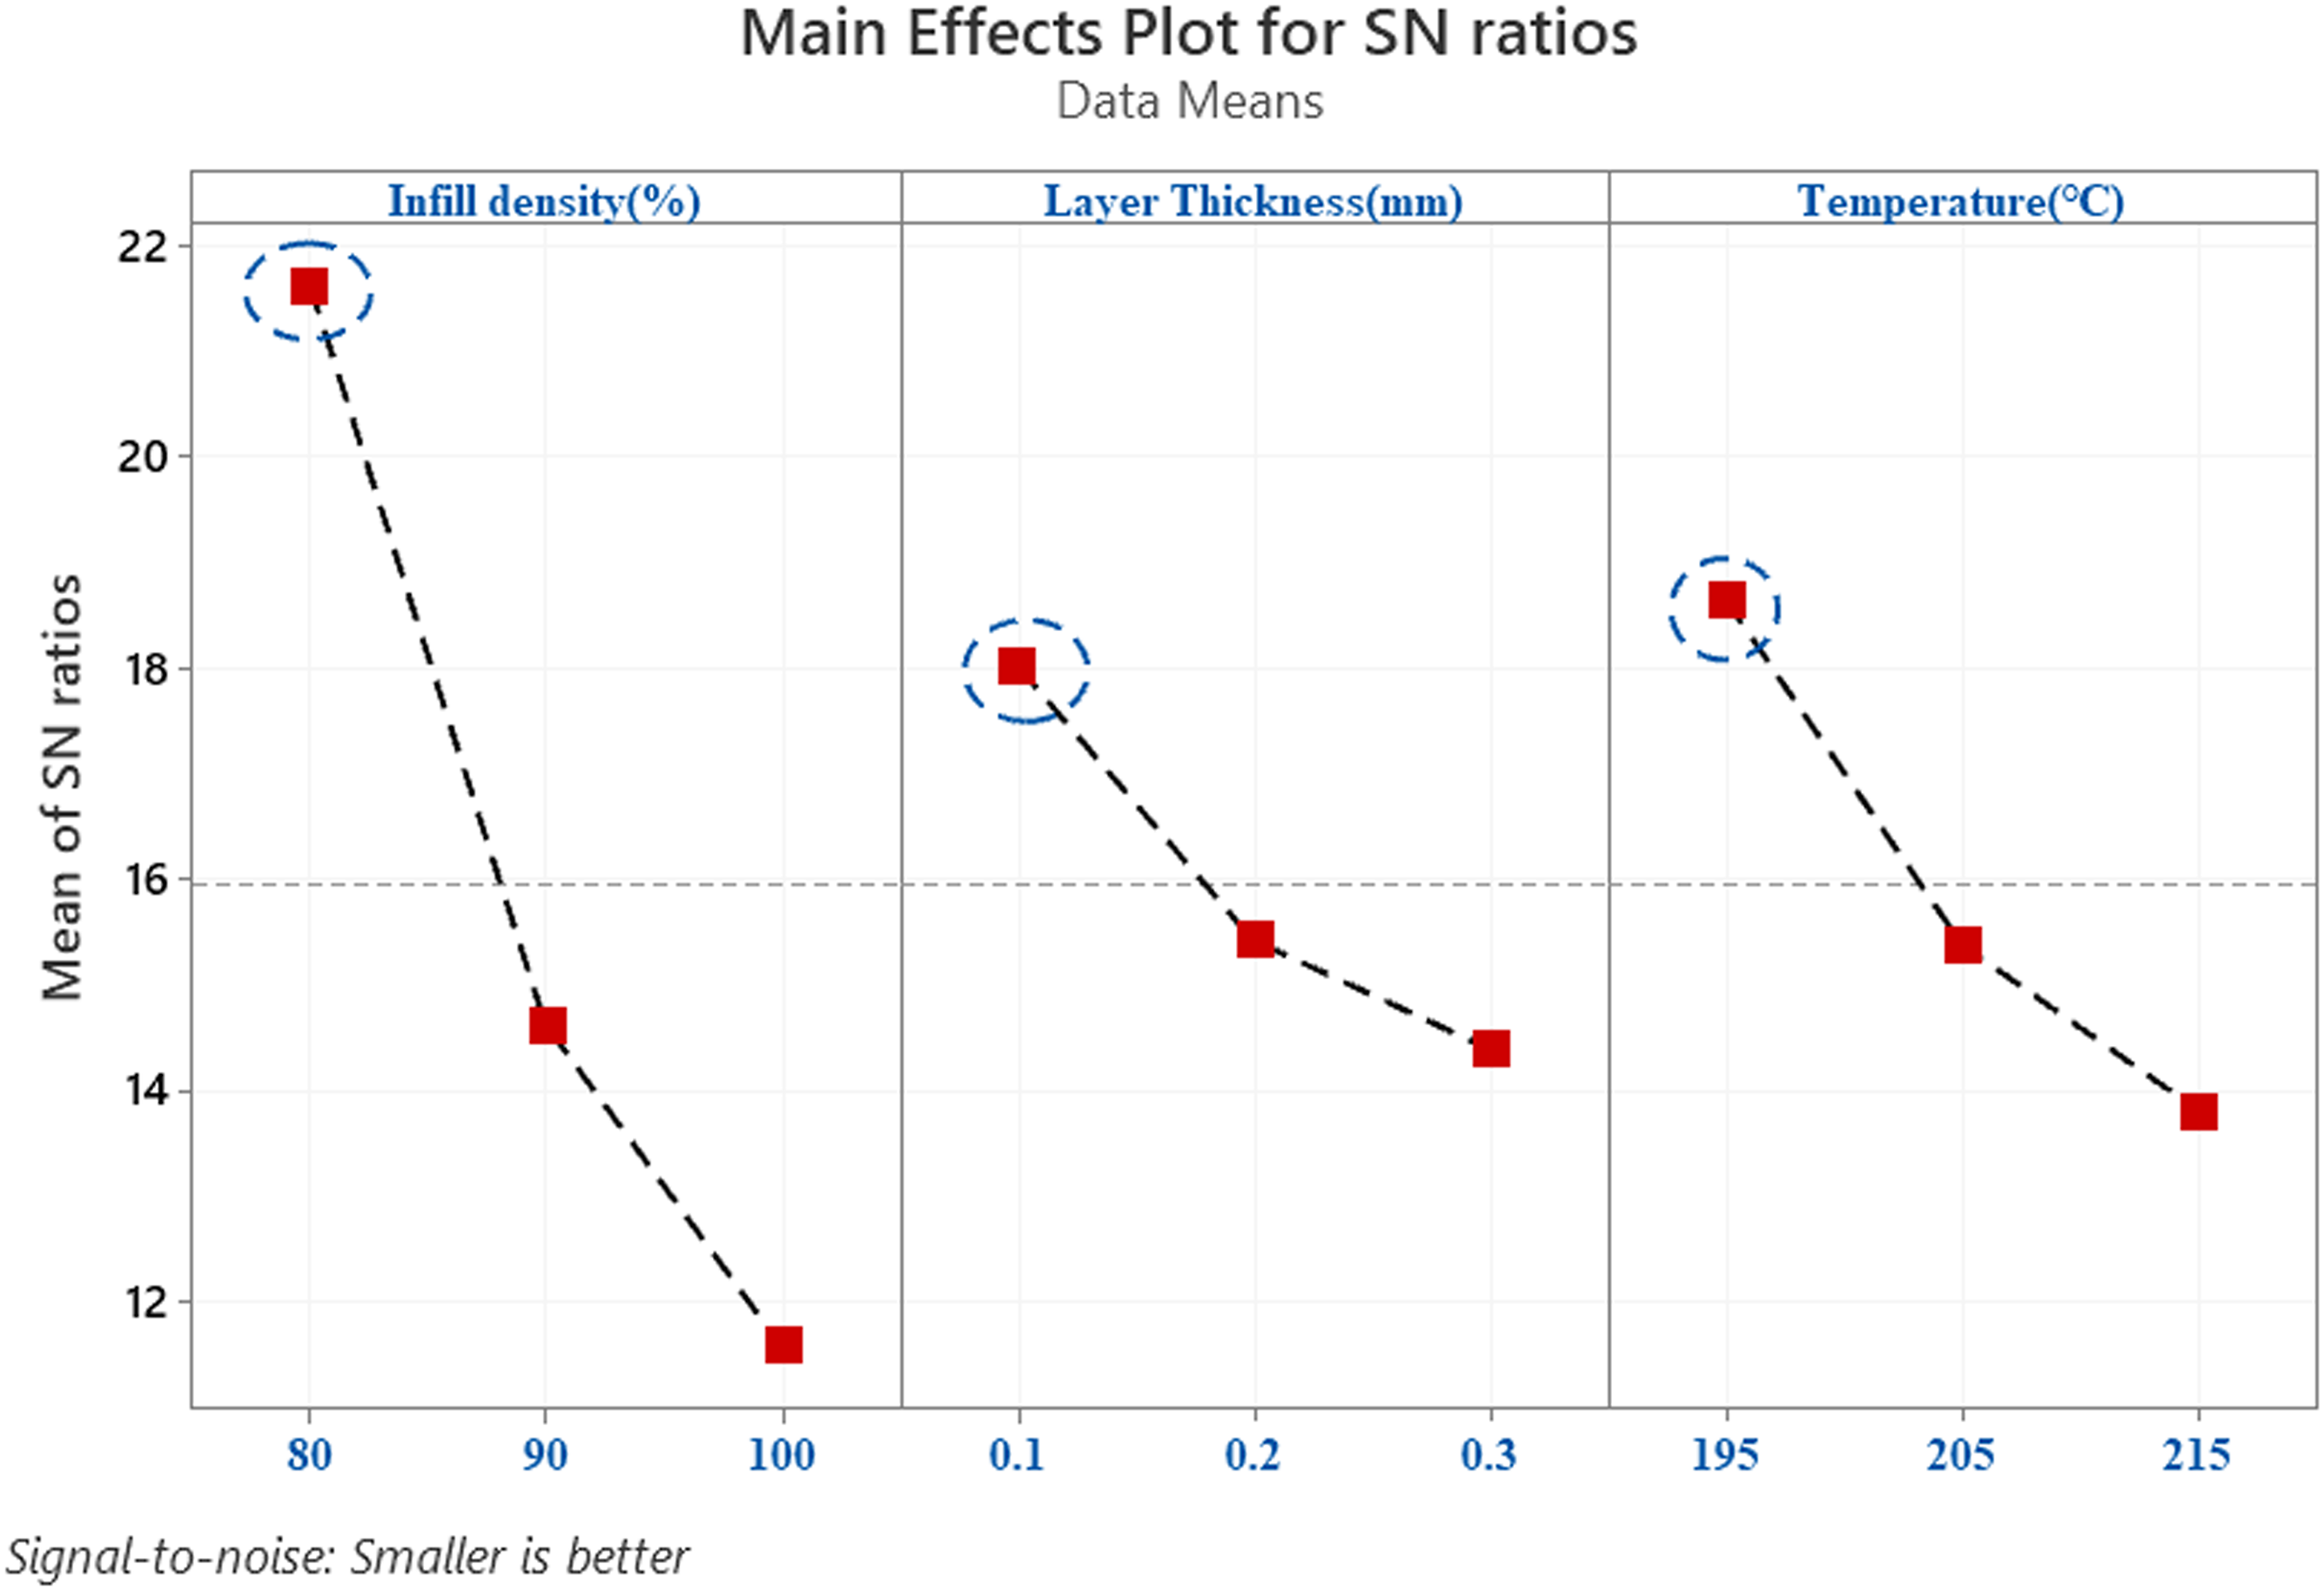
Figure 4(b) shows the factor such as layer thickness for optimizing the S/N ratio value of the converted dimensional area error response parameter. The results show that the maximum S/N ratio of 18.02 was observed on the lower layer thickness of 0.1 mm. Increasing in the layer thickness has a direct co-relation of increases in the chance of dimensional error. This is due to the larger layer thickness, which produces the more considerable interlayer distance. The formation of shrinkage decreases the accuracy of the printed structures. Tasdemir has obtained similar results on the thin-walled 3D printed parts using the fused deposition modeling technique. 52
Figure 4(c) shows the factor, such as printing temperature, for optimizing the S/N ratio value of the converted dimensional error response parameter. The experimental results show that the maximum S/N ratio of 18.65 was observed at the lowest printing temperature of 195°C. As the temperature increases, there is an increase in the dimensional area error. Increasing this dimensional error is that at lower printing temperature, the chance for over-melting is rare, and there is no chance for spalling and shrinking after curing. But in the case of higher temperature, the viscosity of the resin was increased, and PLA material can easily flow over the bed. There is a variation in the accuracy of the final desired component. Valerga et al.
53
have a similar observation on the increasing the printing temperature causes the variation in the dimension stability of the FDM components. The optimal combination for obtaining the lowest dimensional area error will be the lowest infill density of 80%, the lowest layer thickness of 0.1 mm, and the lowest printing temperature of 195°C. Figure 5 shows the measured dimensional area error for all the tested samples. Measured dimensional error using video measurement system.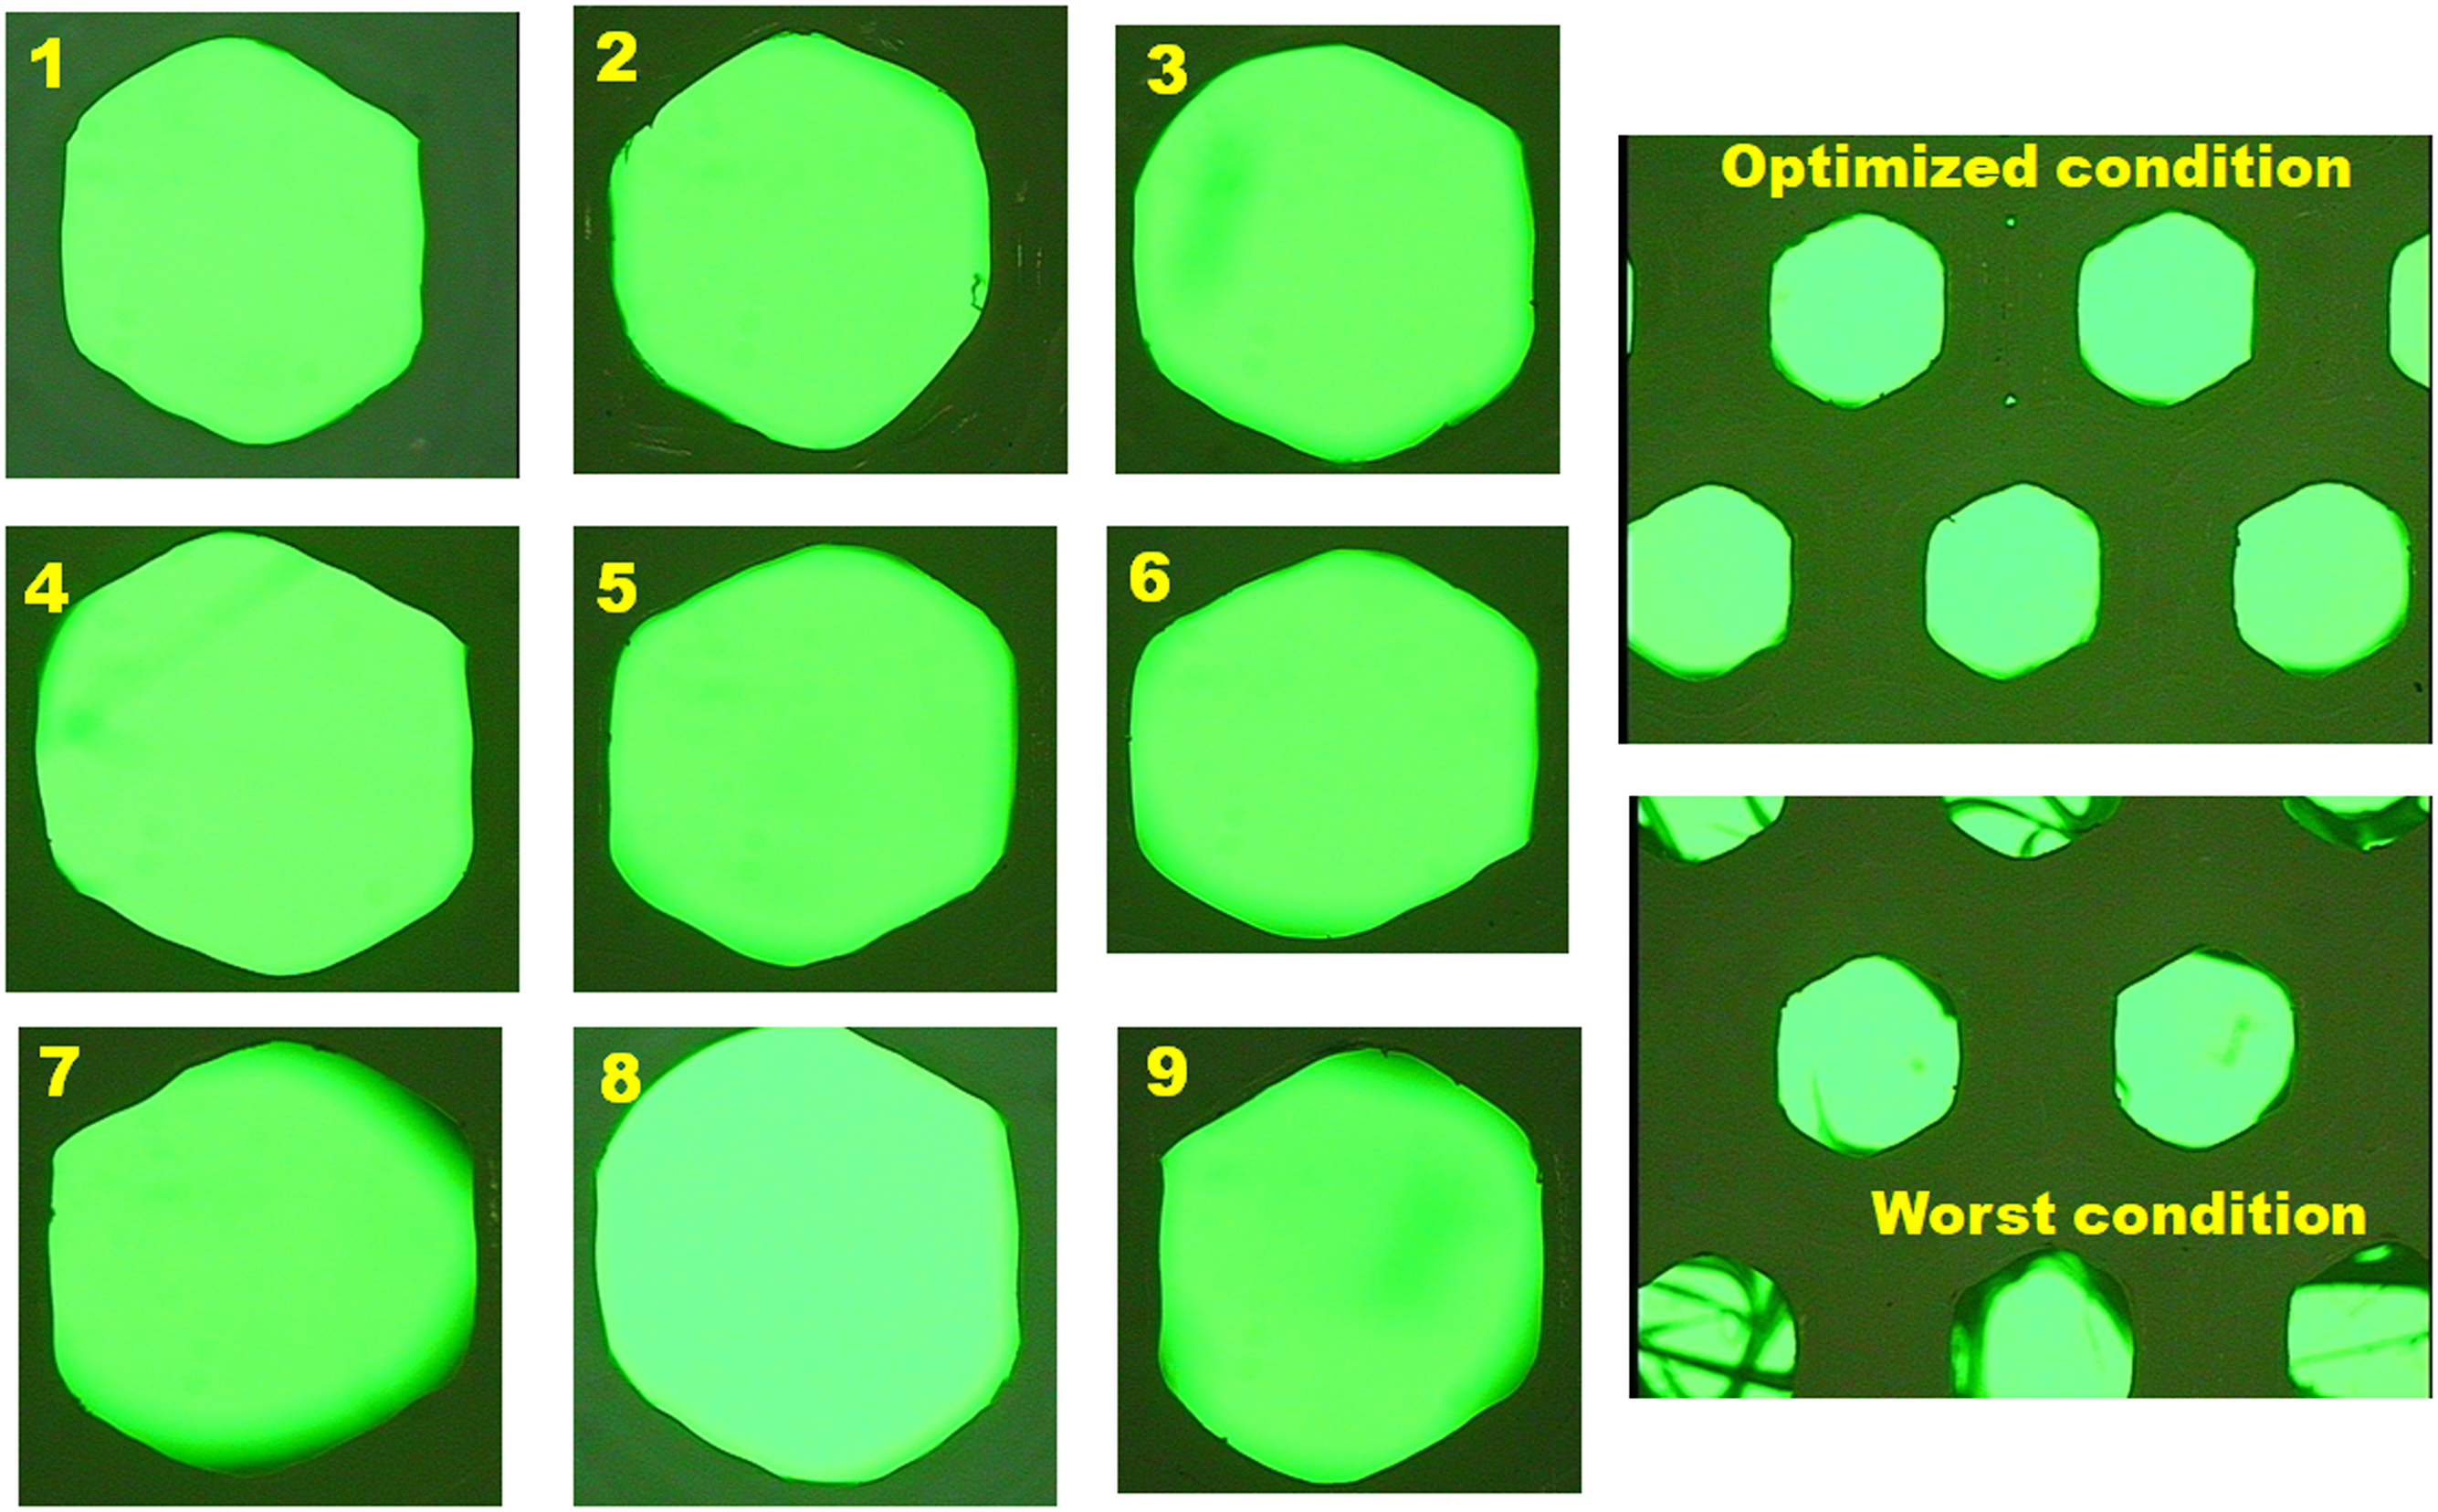
Response table for the S/N ratio for the tensile strength/density and dimensional area error.
Analysis of variance of the produced hexagonal lattice structure
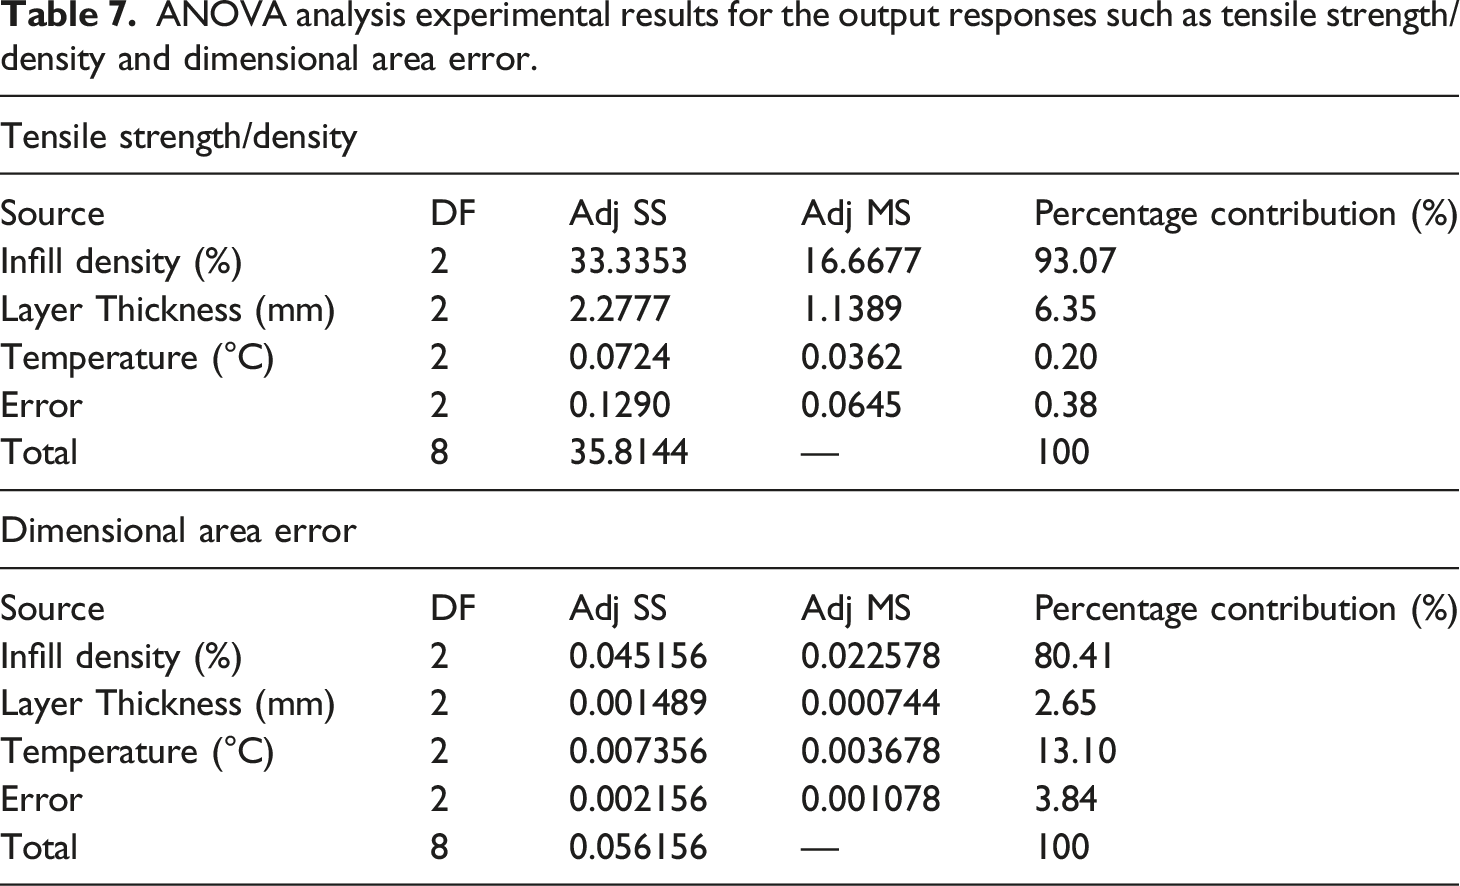
Analysis of variance experiment was conducted to find out the most influencing parameter and contribution of each parameter for the respective experiments. For the present case, the tensile strength/density and dimensional area error are considered as output responses for the prepared hexagonal lattice structure. The investigation for 3D printing of hexagonal lattice structure with various printing parameters was conducted with a 95% confidence limit and 5% significant level. 54
ANOVA analysis experimental results for the output responses such as tensile strength/density and dimensional area error.
Regression analysis
The regression equation was established from the experimental results by varying the input parameters such as infill density, layer thickness, and printing temperature concerning the output responses such as tensile strength/density and dimensional area error. Using MINITAB statistical software,
49
the mathematical models were developed for the output responses, such as tensile strength/density and dimensional area error of the fused deposition modeling process of incorporating the hexagonal lattice structure in the PLA polymeric materials. By using the regression equation, the R square value was found by plotting against the predicted and experimental values of the response parameters such as tensile strength/density and dimensional area error. Figure 6 shows the R square value of the tensile strength/density and dimensional area error of the fused deposition modeling process of incorporating the hexagonal lattice structure in the PLA polymeric materials. R-square fit (a) Tensile strength/density and (b) Dimensional area error.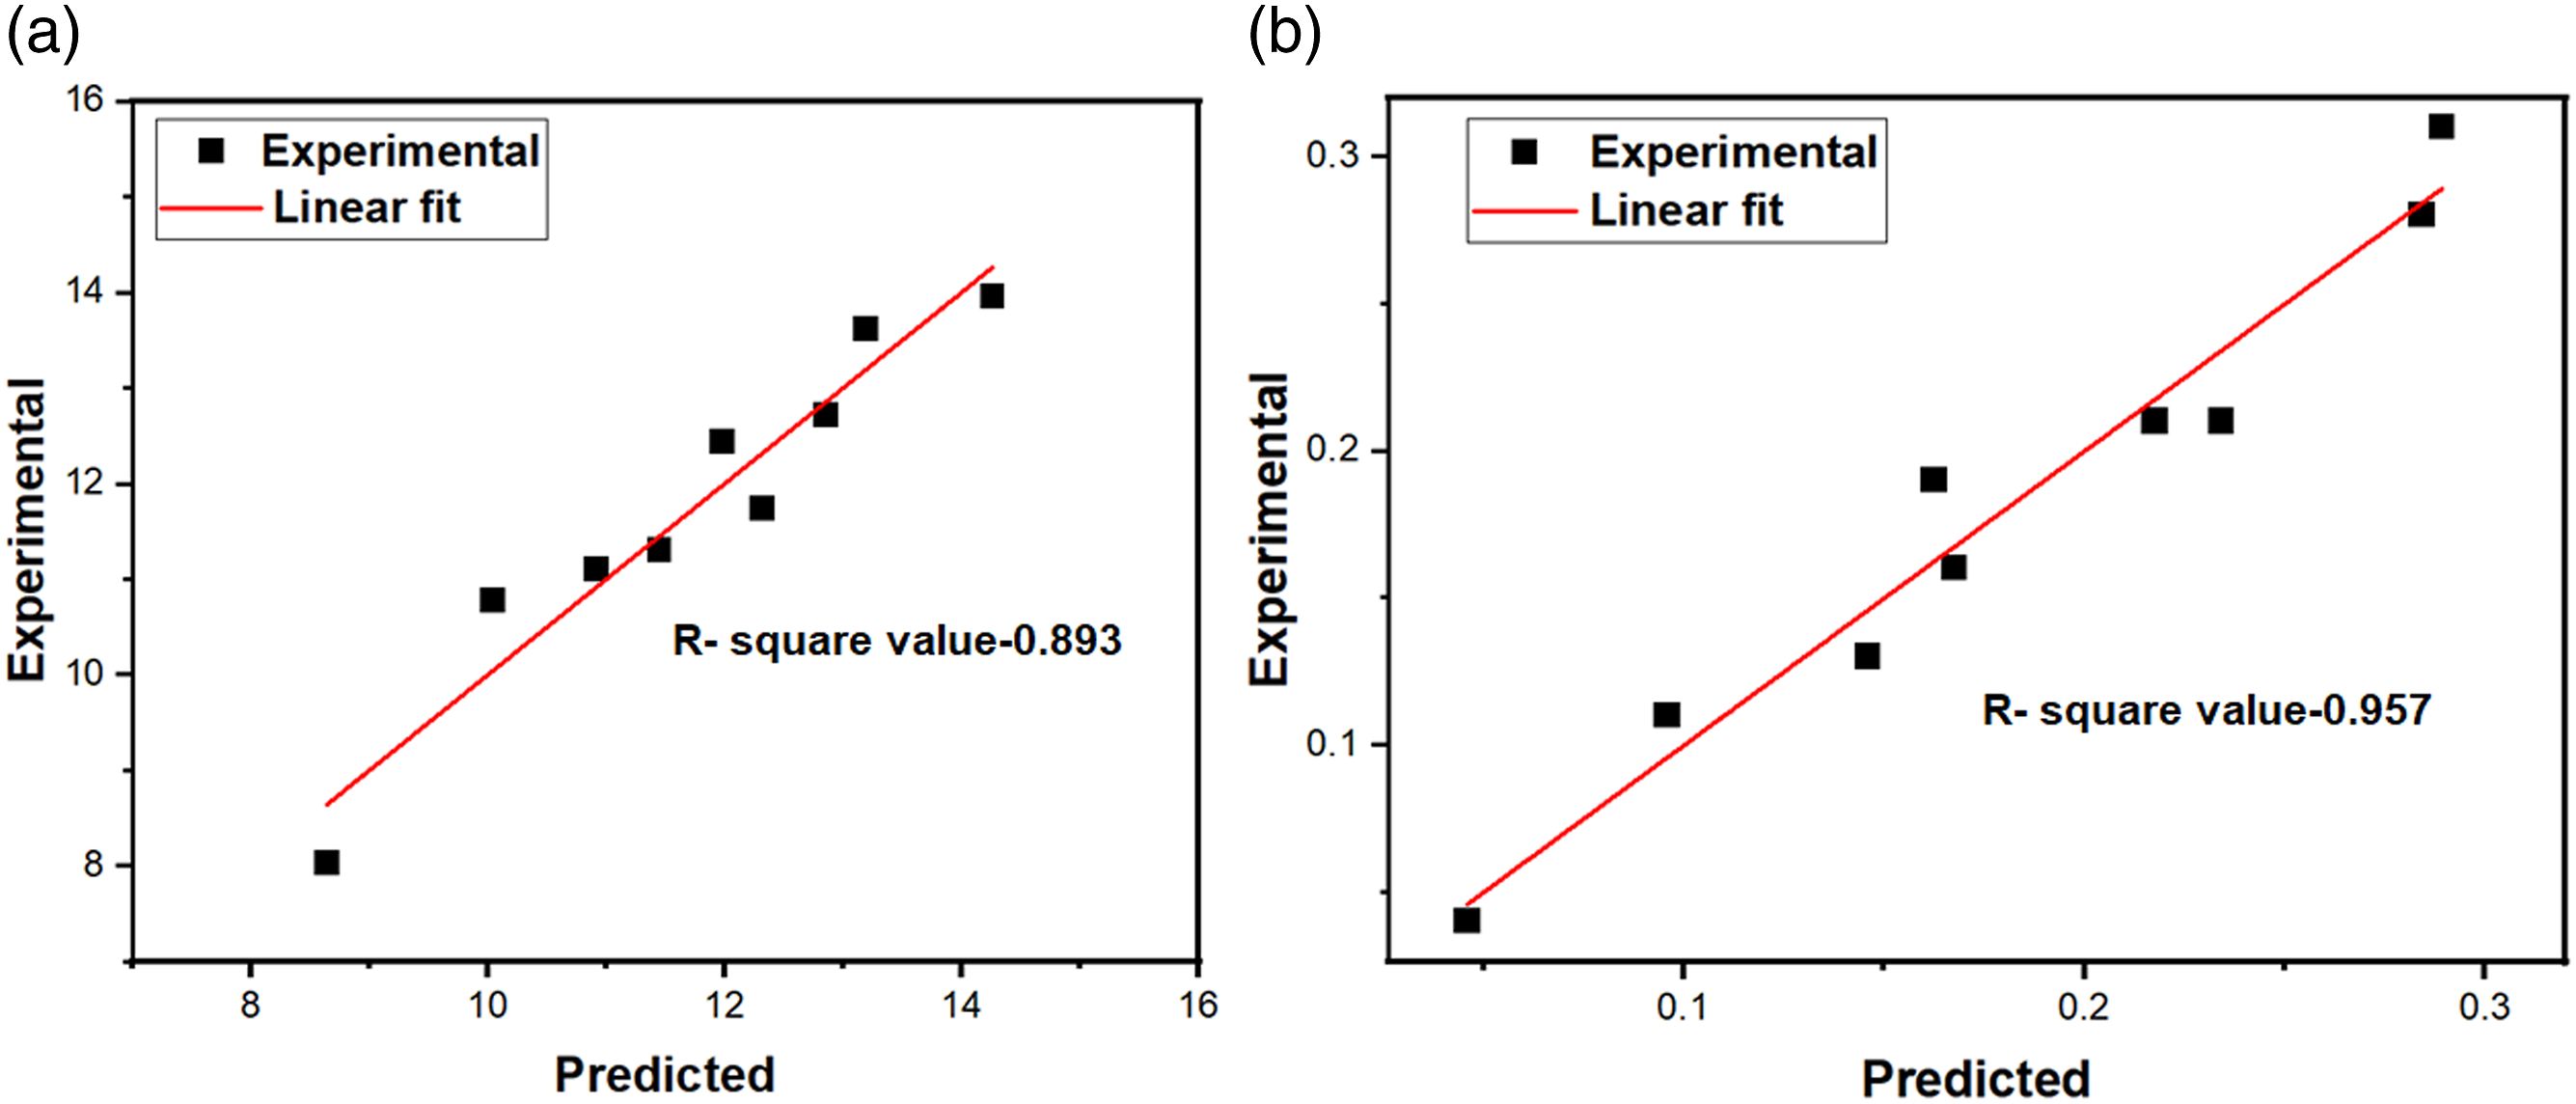
The experimental results clearly show that the R square value concerning the output response such as tensile strength/density will be 0.893. Regression analysis for the tensile strength/density and best-fit equation for the tensile strength/density will be shown in equation (3)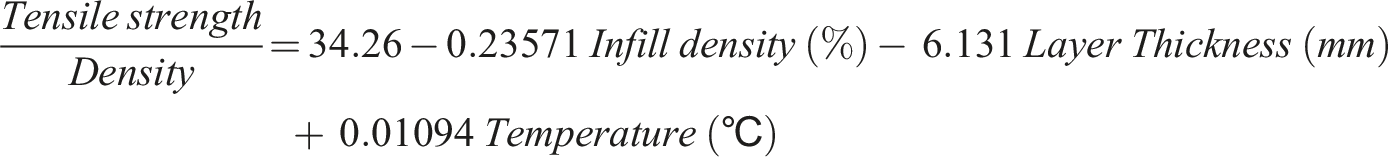
Likewise, the R square value concerning the output response such as dimensional area error will be 0.957. Regression analysis for the dimensional area error and best-fit equation for the dimensional area error will be shown in equation (4)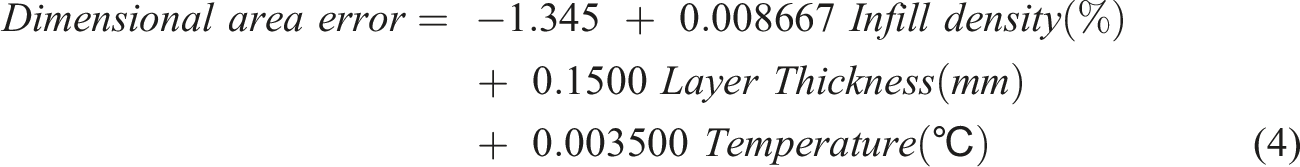
Confirmation experiment for the optimal combinations
Predicted and experimental results of the optimized condition for the printed hexagonal lattice structure.
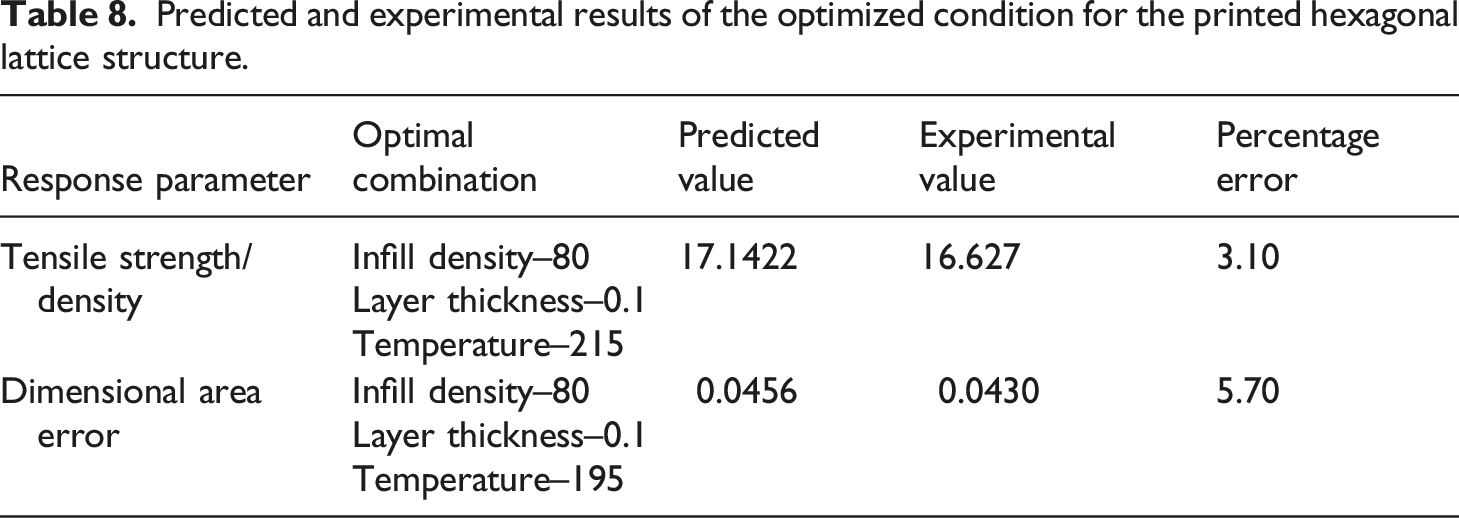
The experimental and predicted results for the output response parameter such as tensile strength/density were 17.142 MPa and 16.627 MPa, respectively. The error percentage was calculated based on the experimental and predicted results. For tensile strength/density, the error percentage was within the acceptable range of 3.10%. Likewise, for other output responses such as dimensional area error, experimental and predicted results based on the mathematical model were 0.0456 and 0.0430, respectively. Based on the observed results, the error percentage for the dimensional area error was 5.70%.
The mathematical model and the experimental results for the optimal combination of the printed hexagonal-shaped lattice structure are measured, and the stress-strain curve for the optimized experimental condition is shown in Figure 7. Stress-strain curve of the specimen with the optimized condition.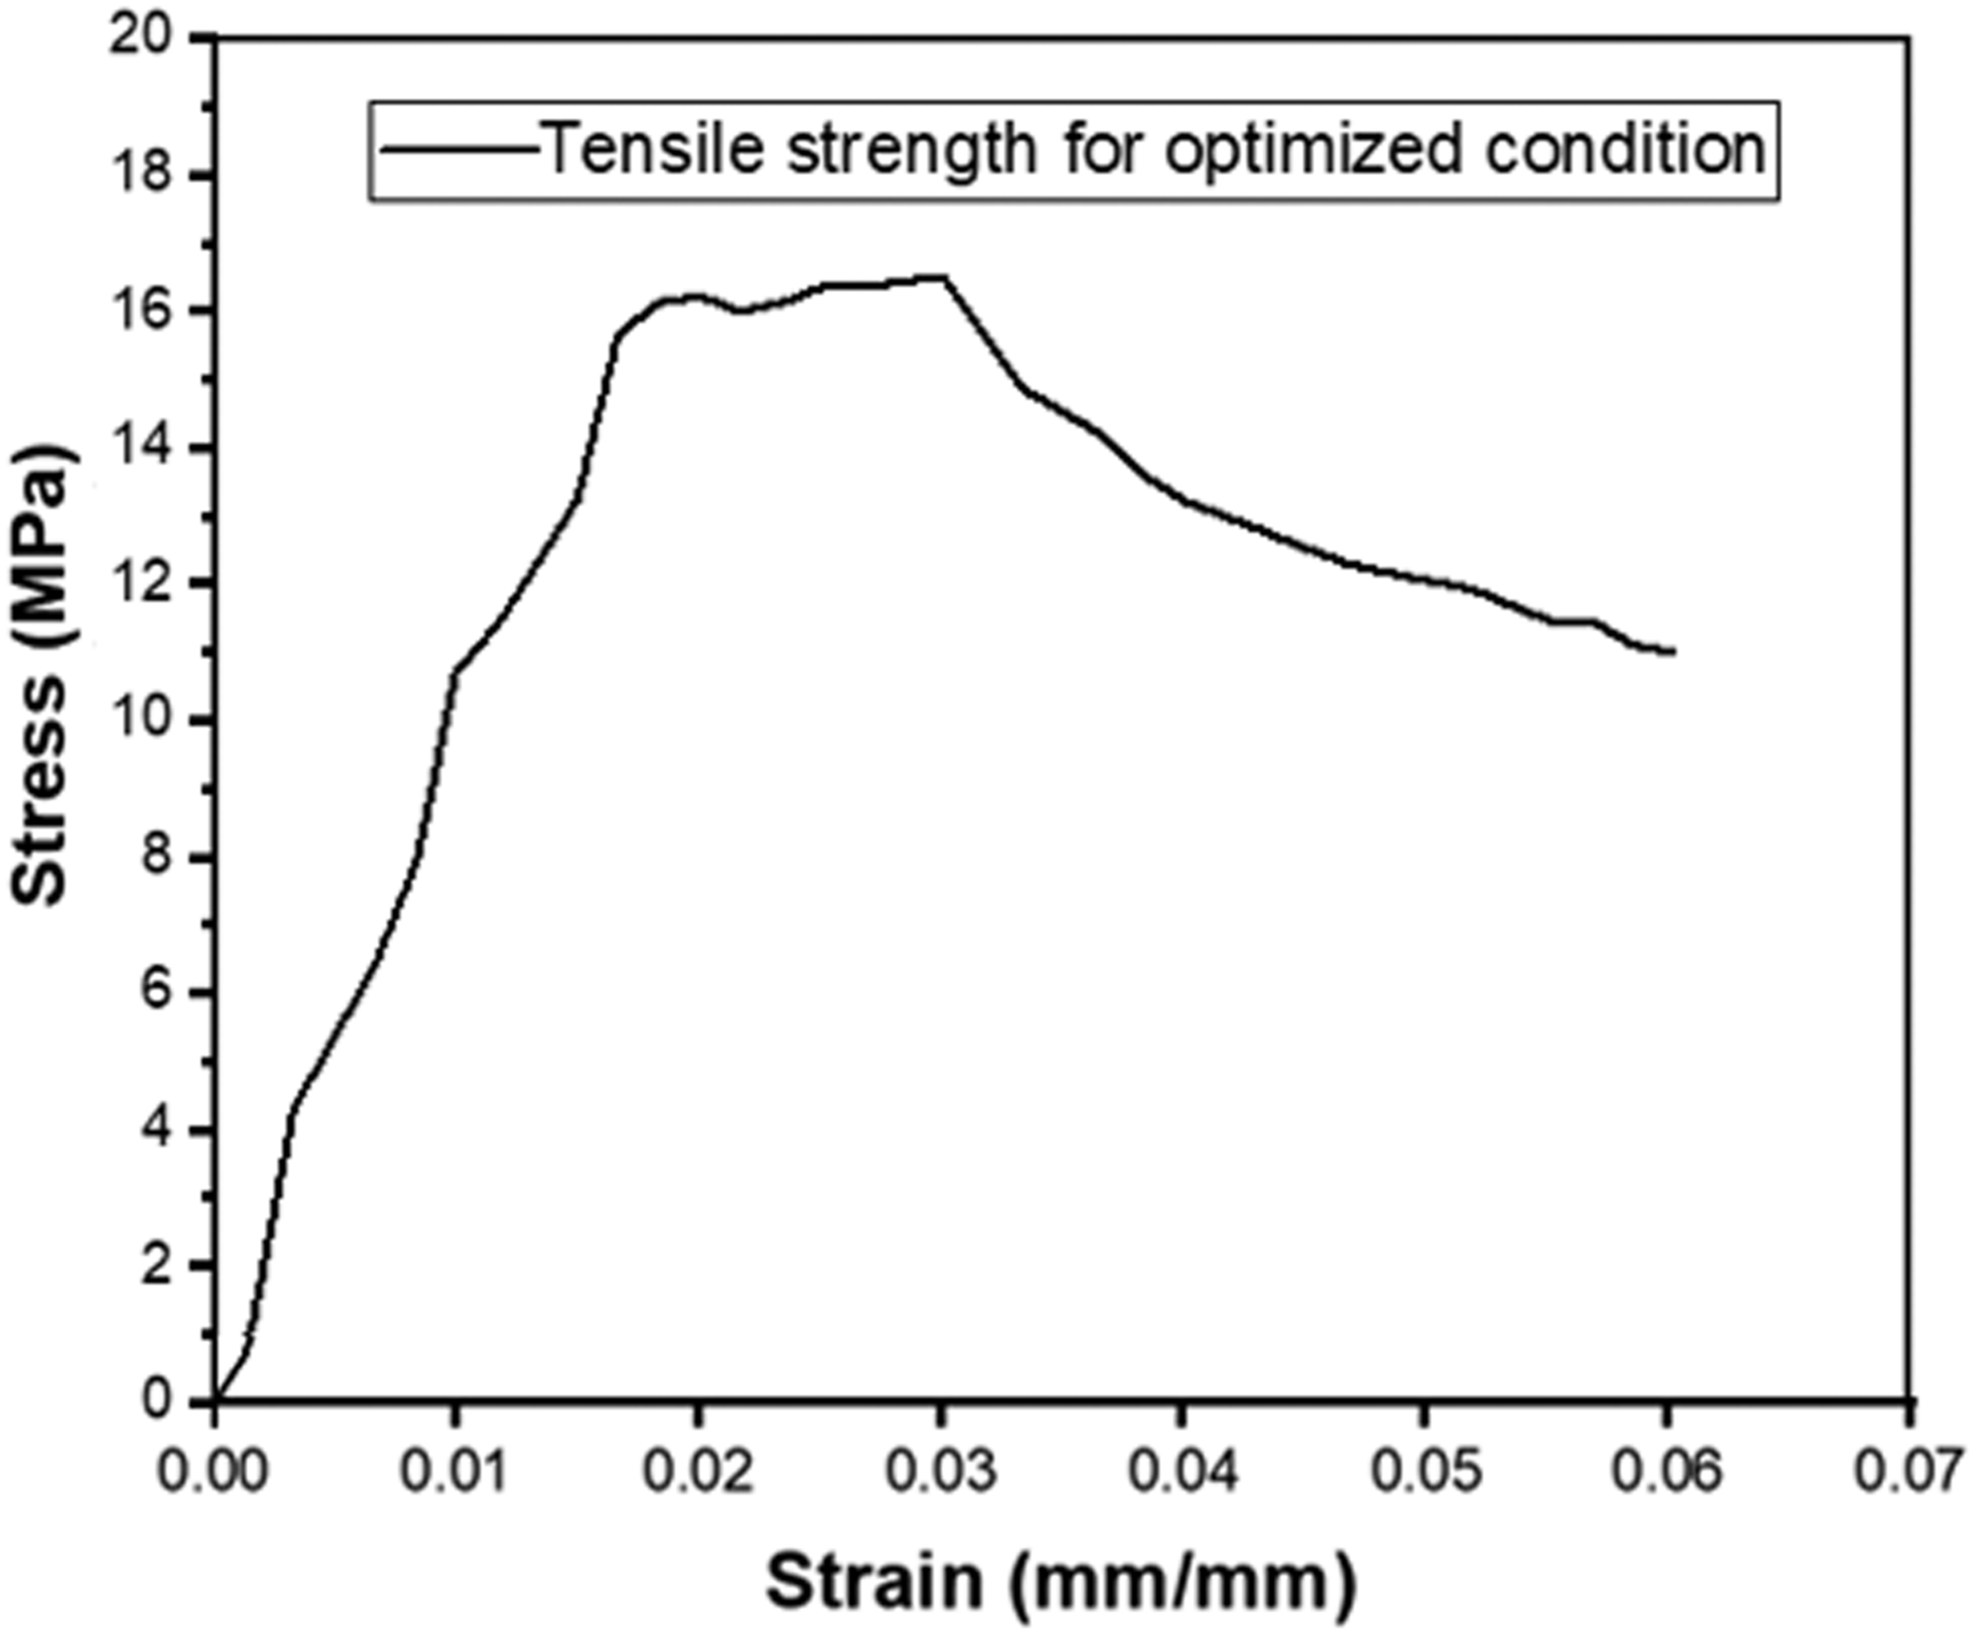
Macroscopic fracture analysis of the tested samples
Figure 8 shows the fractured tensile samples concerning various experimental process parameters. In all the cases, the failure mode of the sample started from the outer walls of the tensile sample. The component’s failure mode was observed based upon the imperfections and fracture of the internal structure concerning lattice structure. The experimental parameters have a major impact on the failure modes of the tensile samples. During applied tensile load, the material starts to elongate in the loading direction. At this stage, the structure gets stretched along the loading direction and begins to fail. The experimental parameters such as lower layer thickness and infill density have more chance of fracture at the perimeter of the wall in the hexagonal lattice structure. So, this results in material fracture at lower tensile loading conditions. But in the case of samples prepared with higher printing temperature and layer thickness, the samples can be stretched to a quasi-rectangular shape, and failure occurs at higher loading conditions. There is a chance of imperfections in the hexagonal lattice structure for lower printing parameters, which automatically affect the tensile properties of the structure-induced PLA samples. Fractured samples of the different process conditions.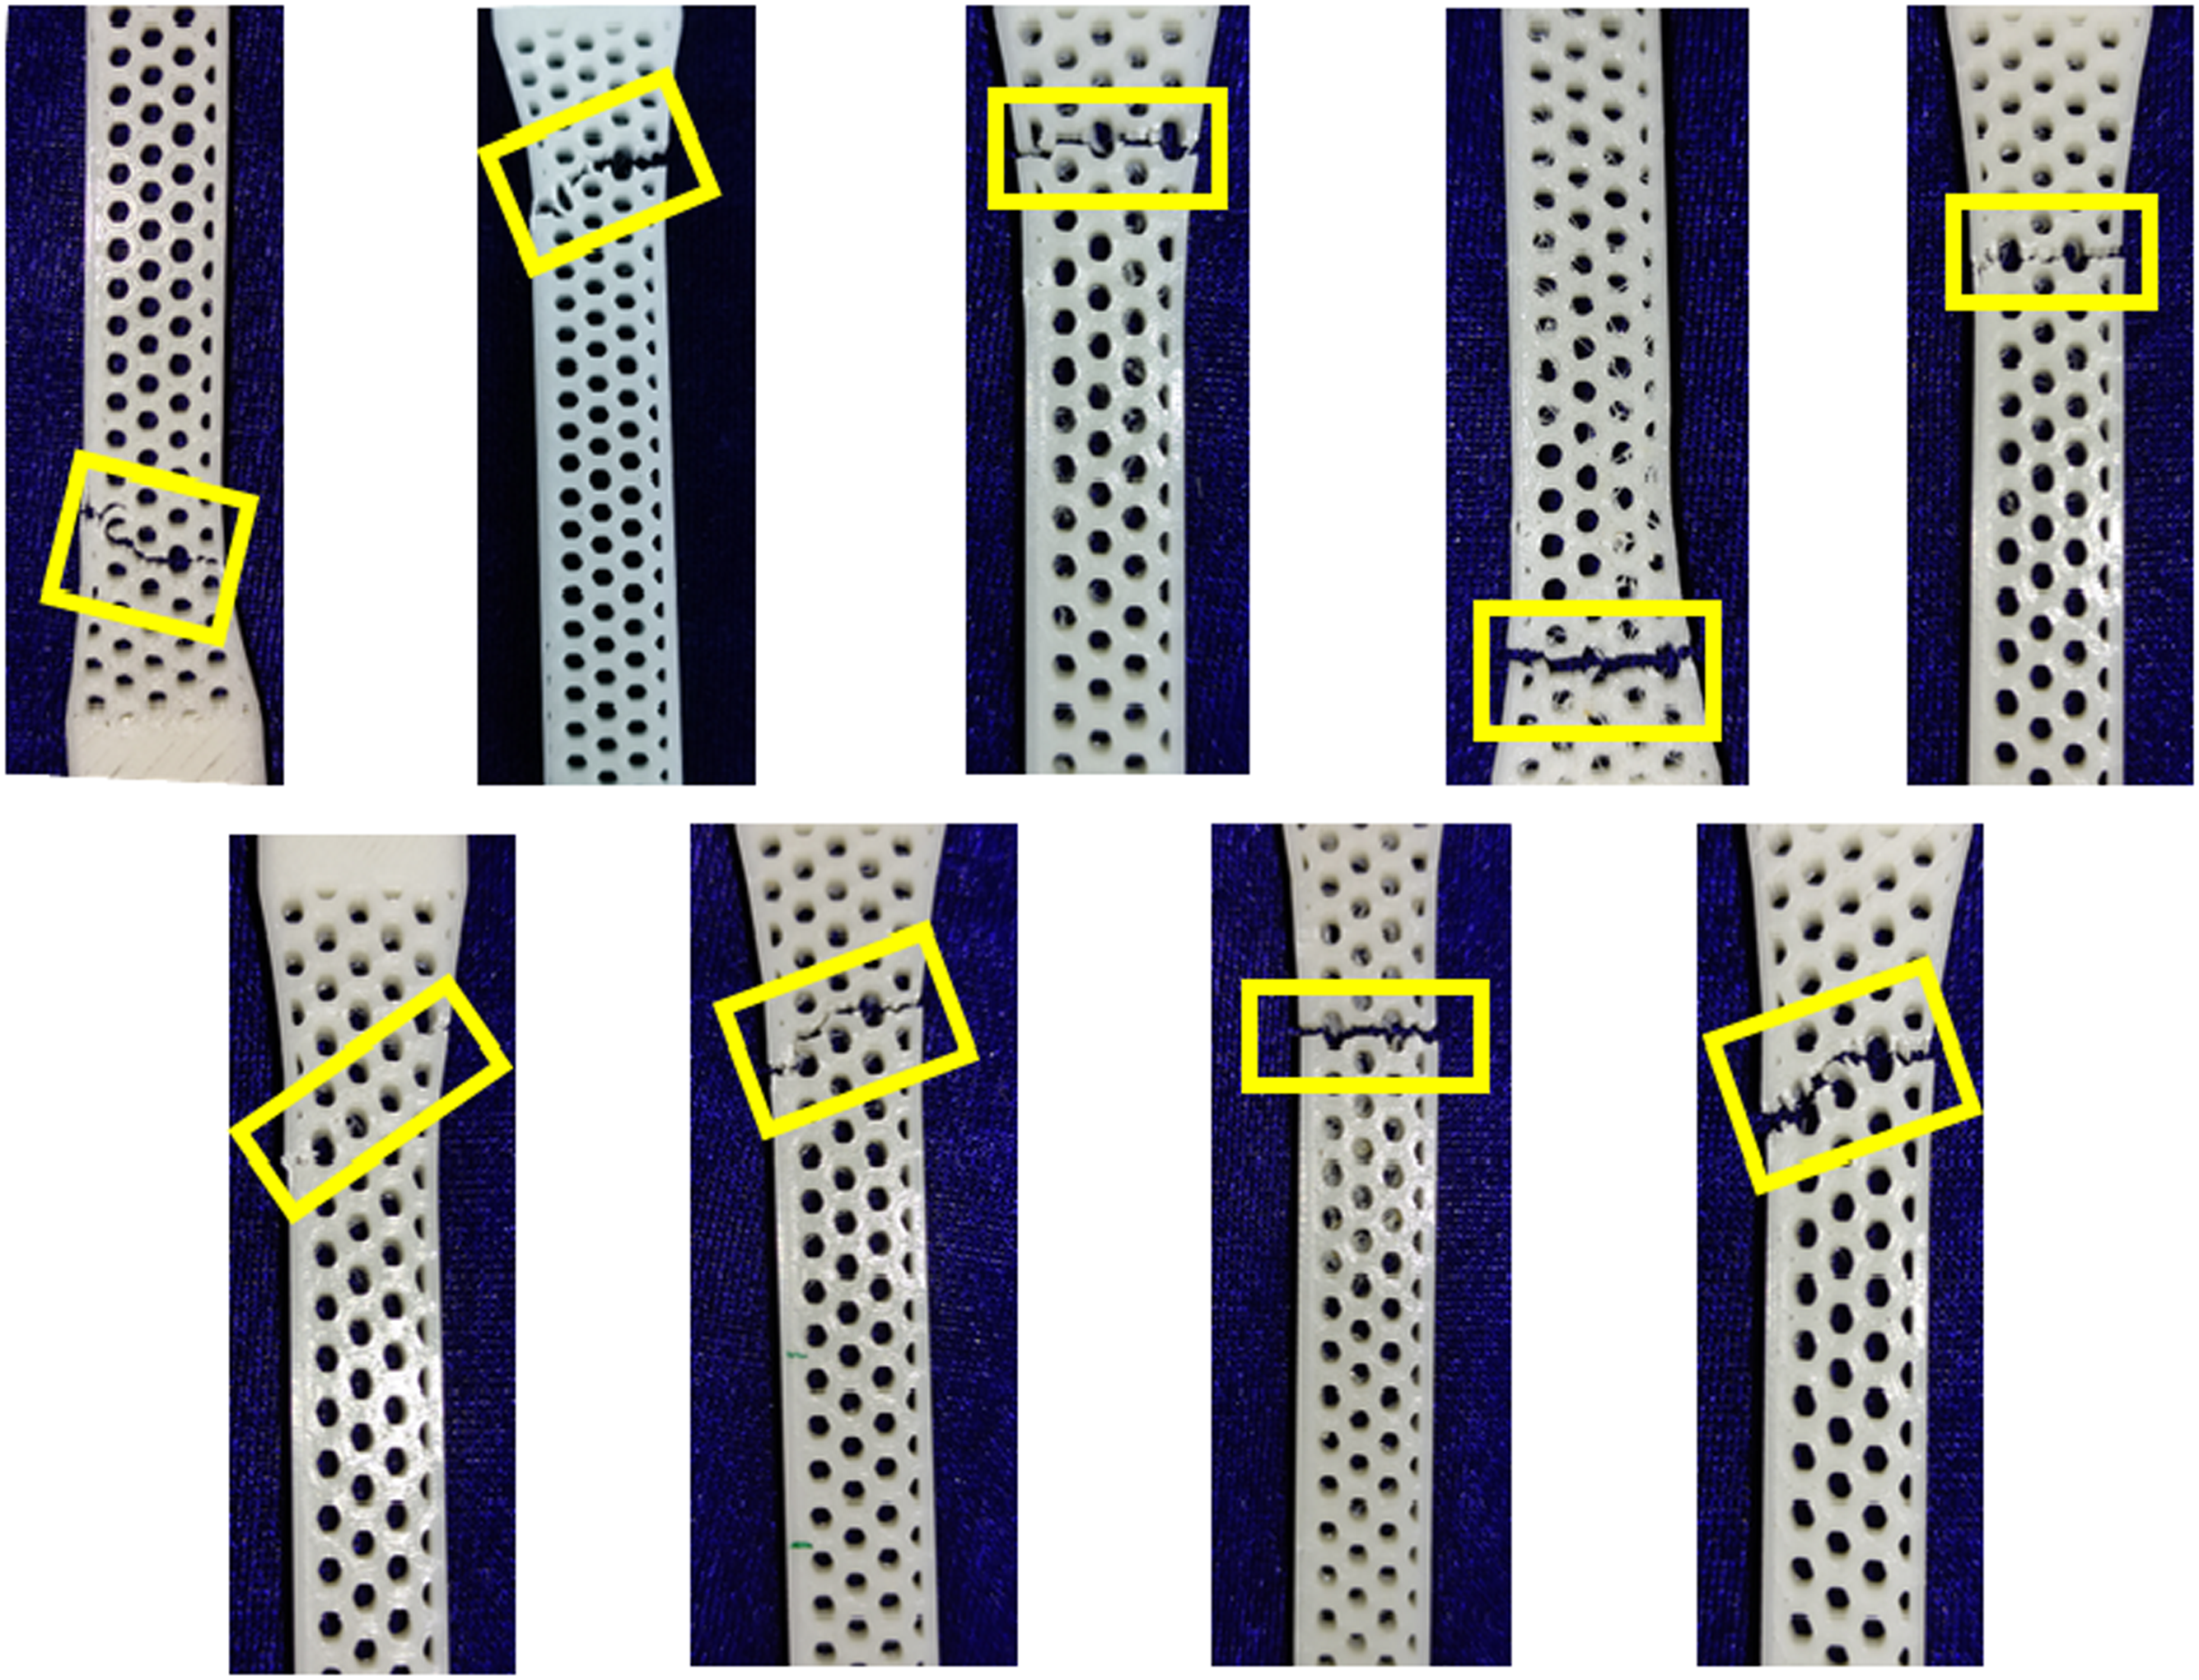
Conclusions
A compendious study of impregnating the hexagonal shaped lattice structure concerning various process parameters such as infill density, layer thickness, and printing temperature on the 3D printed PLA polymeric material. The manufacturers are keen in producing light-weight components without affecting the quality, cost, and time. So, there is a need to understand printing process parameters and be known for the optimized printing condition with good quality. The observations obtained from this experimental work were as follows: (1) From the S/N ratio curve, the optimal condition for obtaining higher tensile strength/density will be 80% infill density, 0.1 mm layer thickness, and 215°C printing temperature and for obtaining lower dimensional area error will be 80% infill density, 195°C printing temperature, 0.1 mm layer thickness. (2) The ANOVA analysis results shows that 2.825 error percentage observed for the tensile strength/density response and 5.70 was observed on the dimensional error response. (3) The major contribution for obtaining the higher tensile strength/density and lowest dimensional error will be infill density, and the remaining parameters follow the minor contribution for the respective results. (4) In the case of lower infill density and lower printing temperature, the crack was initiated in the cell walls of the lattice structure. And for lower layer thickness, the complete fracture propagation occurred in the vertical direction. (5) The accuracy of the predicted mathematical model was good, and the experiments with various conditions were predicted by using the mathematical model. (6) From the overall results, the hexagonal shaped lattice structure incorporation in the PLA polymeric material possess an optimal result and it can be used as replacement material in the shelves, cupboards, and household medium strength applications.
Footnotes
Acknowledgment
The authors wish to thank the Chennai Institute of Technology management for providing the facility establishment of 3D printer in Centre for Additive manufacturing. The Centre for Additive Manufacturing at Chennai Institute of Technology has contributed to this research; vide funding number- [CIT/CAR/2021/003].
Declaration of conflicting interests
The author(s) declared no potential conflicts of interest with respect to the research, authorship, and/or publication of this article.
Funding
The author disclosed receipt of the following financial support for the research, authorship, and/or publication of this article: This work was supported by the Chennai Institute of Technology has contributed to this research; vide funding number-(CIT/CAR/2021/003).