
Abstract
This research article reports the mechanical and surface properties of 3D printed electro-active polymer (EAP) matrix-based functionally graded prototypes with fused deposition modeling. The standard tensile specimens (per ASTM D-638-type IV) have been 3D printed using in-house developed feedstock filament. The EAP, polyvinyl diene fluoride (PVDF)-based matrix, has been used with the reinforcement of barium titanate (BT) and graphene (Gr) in this study. The fixed proportion of the polymer matrix composite comprising PVDF (78 wt%) + Gr (2 wt%) + BT (20 wt%) has been selected for 3D printing of smart polymer matrix. The results of mechanical testing suggested that the 3D printing of parts performed at 50 mm/s infill speed; infill angle of 45° at maximum density level (100%) has shown better mechanical strength (peak strength 42.98 MPa and break strength 40.70 MPa). The result of surface hardness has shown strong correlation with observed tensile properties. The microphotographs of fractured surfaces revealed that the parts fabricated at highest density have minimum porosity, resulting into better mechanical performance as compared to parts fabricated at lower density level. Further the results of mechanical testing have been supported by 3D rendered images and surface roughness profile.
Keywords
Introduction
The fused deposition modeling (FDM) is one of the most commonly used additive manufacturing (AM) techniques for applications in manufacturing engineering, 1 medical science, 2 dentistry, 3 and so on. In AM, the parts are fabricated by addition of layers according to predefined pattern through computer-aided design file.4,5 The main benefit offered by AM is to provide the flexibility in customization of design and geometry of 3D part that can be fabricated at very low cost. 6 These days AM has been widely used for customized products, conceptual models, presurgical models, and functional prototypes.7–11 Although FDM is one of the efficient technological solutions, due to lack of compatibility of the currently available materials, some resistance is observed in its full-scale applications. Thus, to overcome this limitation, researchers are developing new composite materials having more superior characteristics than the currently available materials and their compatibility with this technology. 12 Another alternative way to improve the properties of the processed parts is adjusting the suitable process parameters of FDM.13,14 Research studies highlighted that the properties of fabricated parts are functions of process variables and can be efficiently improved with appropriate adjustment. For functional prototypes, the mechanical properties are very important, also it is essential to study the effect of process variables on the mechanical properties of the parts which can be efficiently improved by process optimization.15,16 From the last few years, 3D printing of active materials has been considered as a disruptive innovation in the field of advanced manufacturing. When these printed objects are subjected to some externally applied stimulus, then they are capable of transforming their one or more property as well functionalities with time.17,18 These types of postprocessing activities are performed by some special type of active materials such as smart materials, shape-memory polymers, and shape-memory alloys.17,19–21 The smart polymer-based matrix composites (SPMC) can be easily tailored due to their lightweight, high flexibility, easy deformation properties, and low processing cost. For all such advantages, SPMC attained great interest among the researchers community for offering wide range of innovative solutions for the fabrication of smart devices in the field of electronics, microelectronics, sensing, photonics, adhesion, and biotechnology.
A multifunctional piezoelectric material receives immense interest from both academic and industrial research scholars as a low-cost energy-harvesting material. 22 It has been reported that the piezoelectric or mechanical energy harvesting is a path toward the development of autonomous and self-powered electronic devices. 23 The demonstration of energy harvesting from the piezoelectric modules have shown in school corridors, train stations, and soccer fields. In the past decade, numerous studies have reported that low-power electronic devices and light-emitting diode have increased the energy efficiency to a significant level. 24 Earlier piezoelectric quartz and ceramics have been used in a majority of electronics applications, however, in recent years piezoelectric polymers gain such a high popularity among the researchers due to their versatile applications in the field of actuators, sensors, electronics, and biomedical engineering. The mechanical, electrical, thermal, surface, and chemical properties of piezoelectric polymers can be easily tailored by different processing techniques.25–27 The major attractive properties of the polymers such as light in weight, electrically and mechanically tough, low processing cost, and their compatibility with the organic and inorganic materials result in the development of cross-functional smart materials for a wide range of applications.28–31 Smart materials are those materials that show significant and controllable variations in its one or more than one property under the effect of external stimuli. Magnetostrictive materials, shape-memory polymers, piezoelectric materials, self-healing materials, pH-sensitive materials, thermoelectric materials, and so on are some of the types of smart materials.32–35 These piezoelectric materials are used to produce a voltage under the application of mechanical stress or vice versa and known as electro-active materials. In one of the reported studies on mechanical properties of 3D printed parts, using in-house developed material comprising carbon nanotube (CNT) and barium titanate (BT) reinforced in polyvinyl diene fluoride (PVDF) matrix showed the best mechanical toughness (24.2 MPa) at the combination of 1 wt% CNT/12 wt% BT/PVDF. 36 In another research work, 3D printing of carbon fiber-reinforced poly lactic acid was performed, and the effect of nozzle temperature and infill orientation on the mechanical properties of the FDM printed parts was studied. It was found that the maximum tensile strength was obtained at 230°C nozzle temperature and at a combination of 0°, 15°, and −15° of infill orientation among the multiple orientations. 37
The literature review reveals that many researchers have reported studies on the composites of polymeric-based materials with the reinforcement of different metallic/nonmetallic materials, and their effect on the mechanical, rheological, surface, and thermal properties have been widely explored.38–42 But hitherto, little has been quoted on the 3D printing of electro-active polymer (EAP) matrix-based materials for possible applications in the fields of electronics and biomedical science. In this work, the mechanical and surface properties of 3D printed EAP matrix-based functionally graded prototypes with FDM has been reported. The tensile specimens according to ASTM D-638-type IV were 3D printed using in-house developed feedstock filament. The EAP comprising the PVDF matrix has been used with the reinforcement of BT and graphene (Gr). The fixed proportion of EAP matrix comprising PVDF (78 wt%) + Gr (2 wt%) + BT (20 wt%) was selected based upon previously reported studies on parametric optimization of twin-screw extrusion (TSE) in the development of smart polymer-based feedstock filament for 3D printing applications.18,21
Experimentation
In this research study, EAP comprising PVDF matrix-based FDM filament was prepared at optimized settings of TSE (extrusion temperature 200°C and screw speed 50 r/min) according to the reported literature. 18 A piezoelectric ceramic BT and Gr were reinforced in the polymer matrix. The methodology of current research work is shown in Figure 1. The extruded feedstock filament was used to run on open-source low-cost FDM printer for 3D printing of standard tensile specimens (according to ASTM D 638 type IV). These 3D printed standard specimens were used to establish the mechanical properties (peak load (PL), break load (BL), peak strength (PS), break strength (BS), etc.) and surface properties.

Methodology of research work.
In this work, the selected proportion/composition 18 has been taken for the preparation of feedstock filament for 3D printing of the standard specimens. The key feature while extruding the feedstock filament was to keep the diameter of the wire within the range of 1.75 ± 0.05 mm (due to the restricted nozzle size available in the existing FDM setup). The extruded filament comprising PVDF + Gr + BT was further used to run on existing open-source 3D printer (Make: Divide by Zero, Pune, India) for fabrication of dumbbell-shaped tensile specimens. For 3D printing of the parts three different controllable process parameters: infill speed (IS), infill angle (IA), and infill density (ID) were selected on the basis of pilot experimentation, whereas other process parameters were kept constant for this research work (Table 1).
Input process parameters of FDM.a
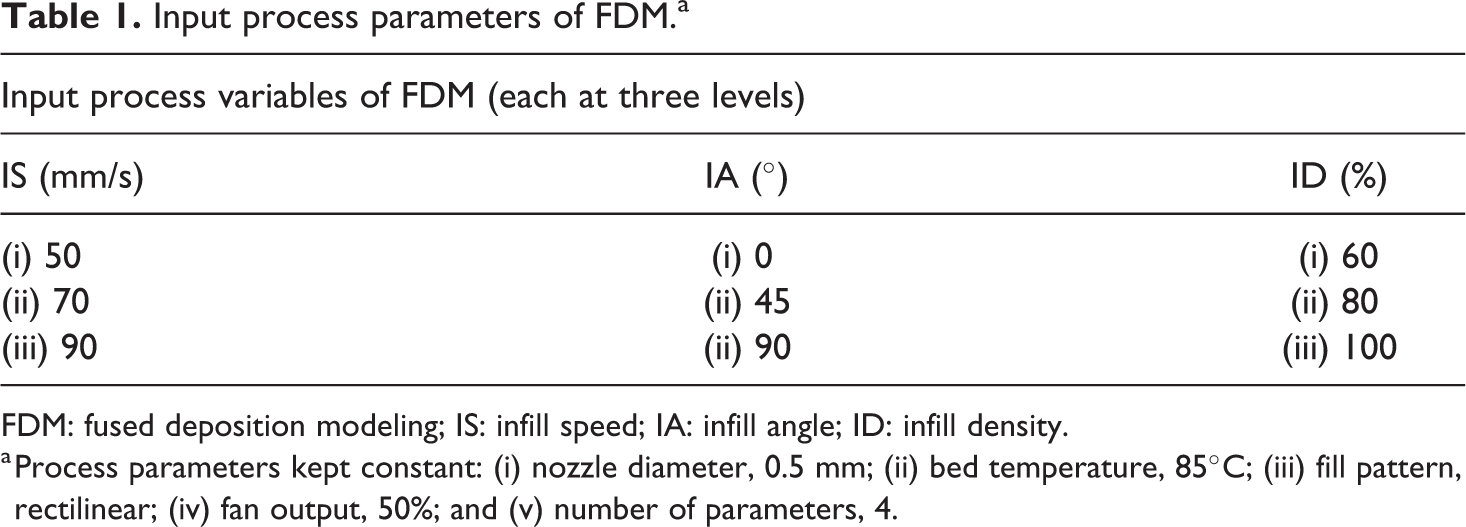
FDM: fused deposition modeling; IS: infill speed; IA: infill angle; ID: infill density.
a Process parameters kept constant: (i) nozzle diameter, 0.5 mm; (ii) bed temperature, 85°C; (iii) fill pattern, rectilinear; (iv) fan output, 50%; and (v) number of parameters, 4.
The factors for optimizing the printing parameters have been set according to the Taguchi L9 orthogonal array. The design of experiment (Table 2) was used to print the parts and evaluate the correlation between input process variables and proposed output characteristics. Mechanical testing on the fabricated parts was performed according to the ASTM D638 standard. To minimize the experimental error, three repetitions were carried out for all nine settings of selected controllable parameters.
Design of experiment based on Taguchi L9 OA.
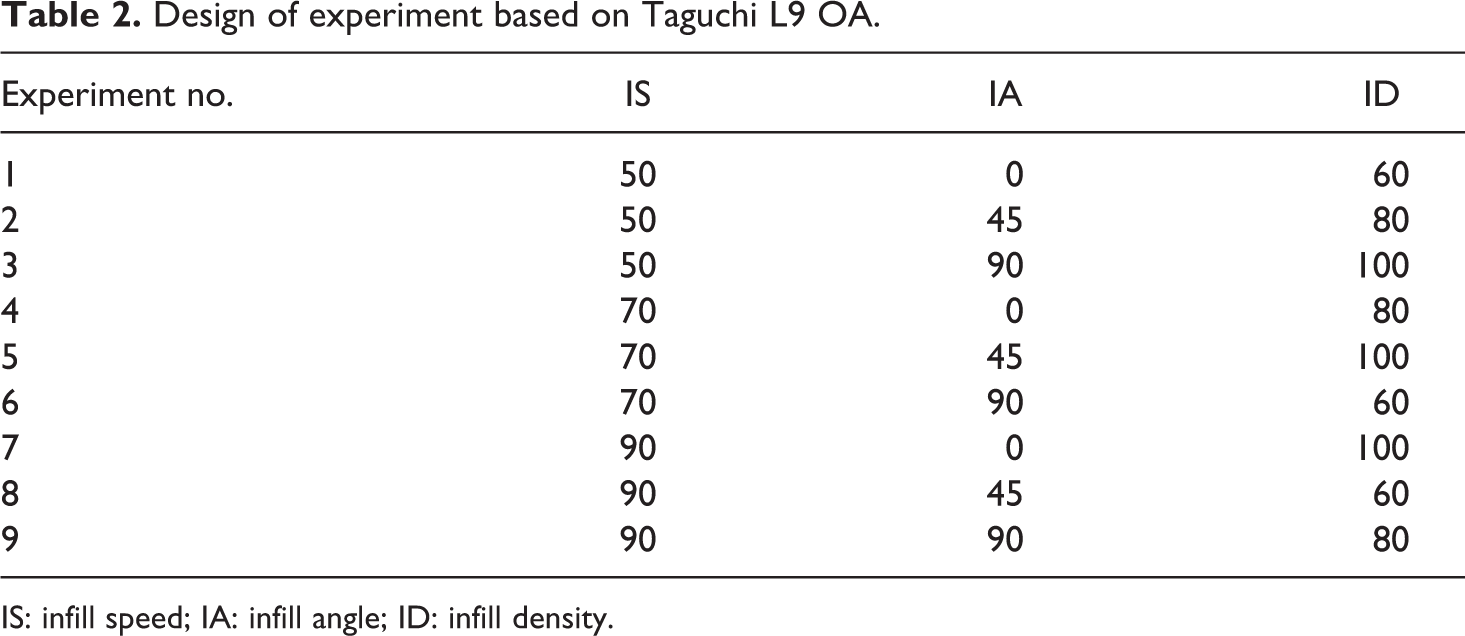
IS: infill speed; IA: infill angle; ID: infill density.
Figure 2 shows 3D printing of specimens (a), finally printed tensile samples (b), and 3D printed tensile samples to depict effect of IA (Table 2).
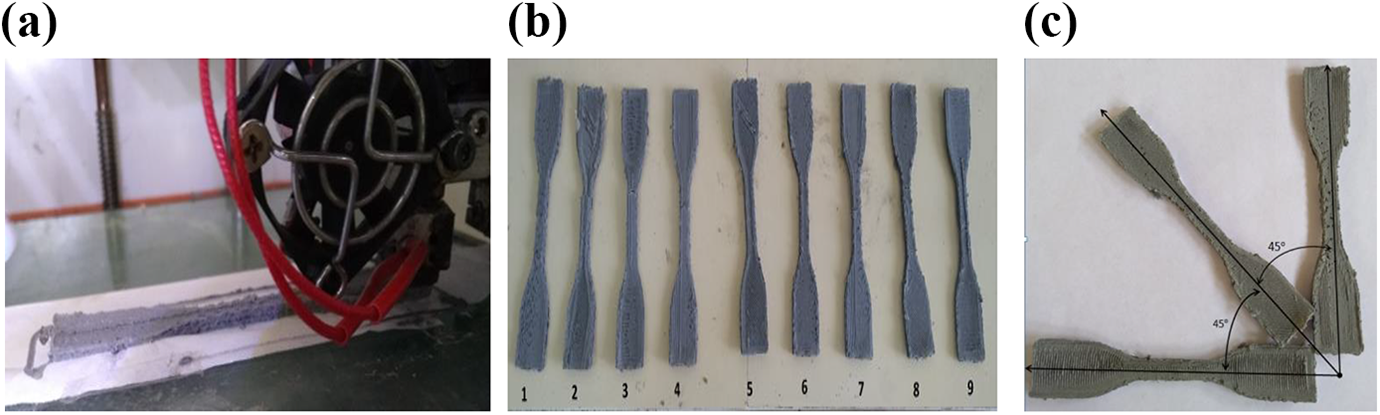
(a) 3D printing of specimens, (b) finally printed tensile samples, and (c) 3D printed tensile samples to depict effect of IA.
The parts printed as per Table 2 were further subjected to the universal tensile testing machine (Make: Shanta Engineering, Pune, India) having capacity of 5000 N for tensile testing. The output values of PS, BS, PL, and BL have been noted. Further for observed mechanical properties, signal-to-noise ratio (SN) has been calculated for larger is better type case using formula:
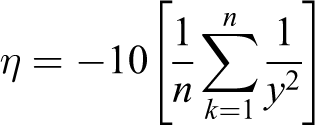
where η is SN ratio, n is the number of experiment, and y is the material properties at experiment no. k.
Also analysis of variance (ANOVA) has been performed using Minitab software. Also surface hardness values of 3D printed parts on Shore-D harness tester were noted. The tool maker microscope has been used to capture the optical photomicrographs of the fractured surface.
Results and discussion
After extrusion of feedstock filament by taking a fixed proportion of materials at optimized settings of TSE and by keeping the diameter of the wire as 1.75 ± 0.05 mm, 3D printing of the parts has been performed. The output values of PL, BL, PS, and BS and corresponding SN values are presented in Table 3.
Tensile properties of printed 3D parts.
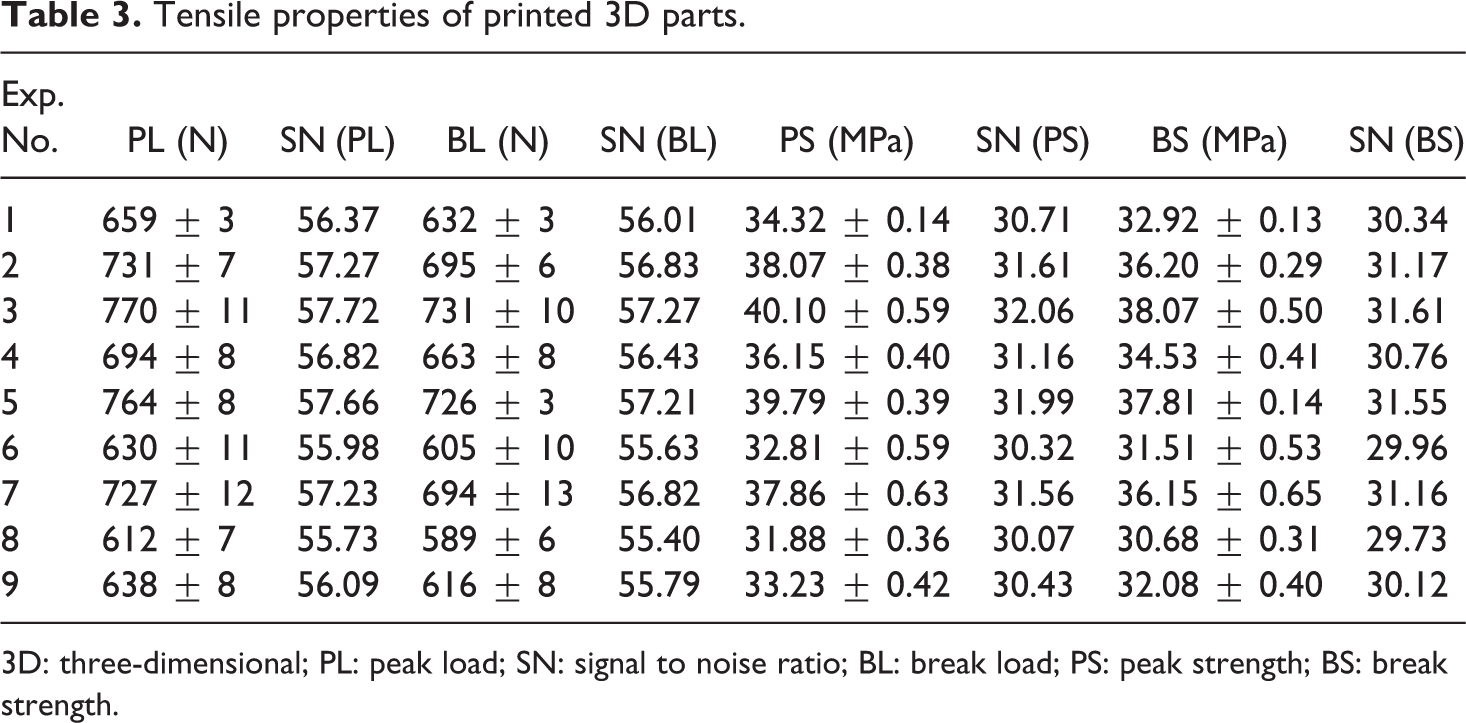
3D: three-dimensional; PL: peak load; SN: signal to noise ratio; BL: break load; PS: peak strength; BS: break strength.
As observed from Table 3, maximum value of PL (770 N), BL (731 N), PS (40.10 MPa), and BS (38.07 MPa) was noted in experiment no. 3 (IS: 50 mm/s, IA: 90°, and ID 100%), whereas minimum tensile properties were obtained in experiment no. 8. This may be due to the fact that relatively fine printing was observed at very low speed (visual observation and dimensional measurement h = 3.2 ± 0.4 mm), and there might be proper bonding in between the successive layers and low void formation at 100% ID. However, experiment no. 8 was conducted at the highest IS (90 mm/s) and minimum ID (60%) among the selected level of parameters. Thus, it may have led to poor printing conditions at high speed, and less strength at low density level was observed.
From the results of Table 3, stress–strain curve obtained from the tensile testing is shown in Figure 3. From the stress–strain curve, the area under the curve was calculated to express the fracture toughness. The calculated values of fracture toughness are presented in Table 4. It has been observed that the maximum value of fracture toughness is 4.706 MPa for experiment no. 2, thus ensuing it as better candidate for crash applications (among the rest of the samples).
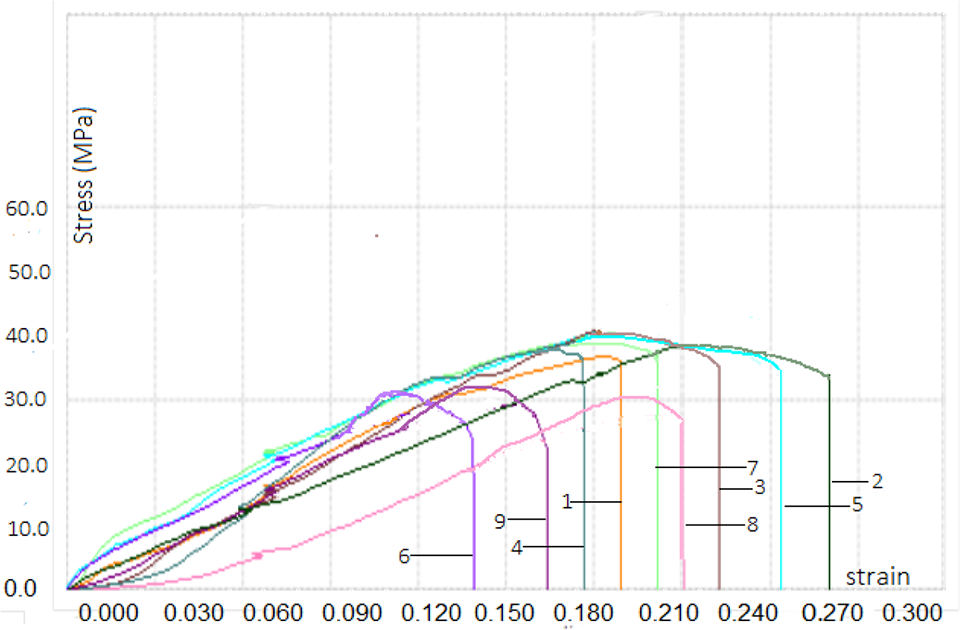
Stress–strain curve of 3D printed parts (per Table 2).
Fracture toughness of printed parts.
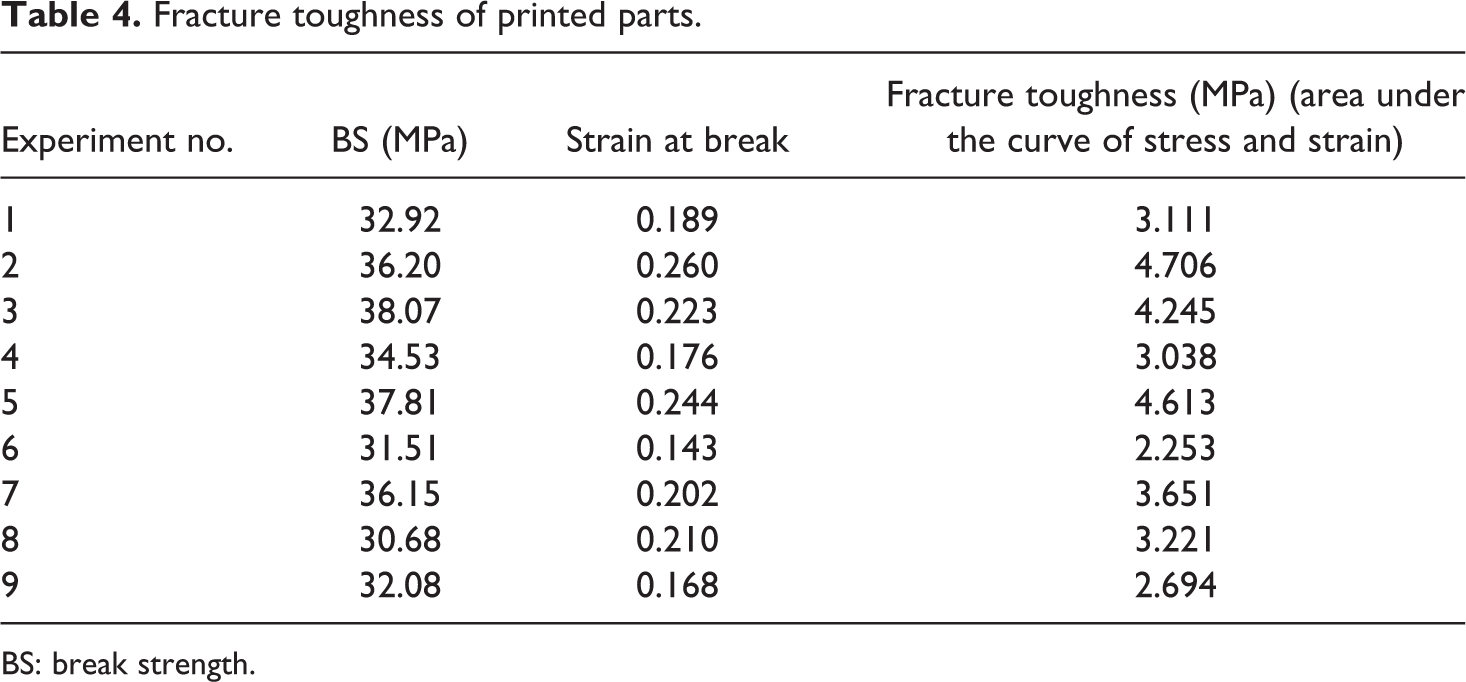
BS: break strength.
To optimize the process parameters of FDM for mechanical properties (PS, BS, PL, and BL) ANOVA has been used. Based upon Table 3, ANOVA table for PS is presented in Table 5. As observed from Table 5, there are two significant parameters: IS and ID having probability (p) value less than 0.05, whereas in case of IA the p value is more than 0.05 so it is not found significant at 95% confidence level. The value of residual error is found to be only 0.49% of the total value which supports that model used for optimization is significant.
ANOVA table for PS.
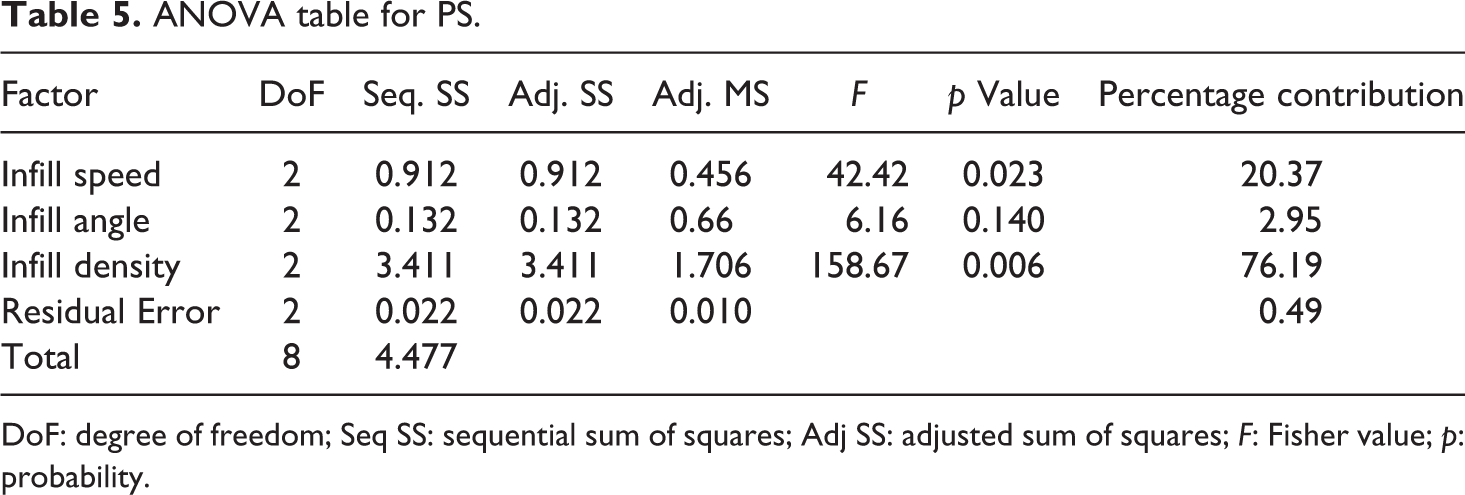
DoF: degree of freedom; Seq SS: sequential sum of squares; Adj SS: adjusted sum of squares; F: Fisher value; p: probability.
Based upon Table 5, Table 6 lists the rank of input parameters at larger the better type condition for SN values of PS. The main graph of SN responses (Figure 4) for PS shows that the first level of IS (50 mm/s), second level of IA (45°), and third level of ID (100%) are best settings of FDM setup for 3D printing of parts of selected composition/proportion.
Rank table of input parameters (larger the better).
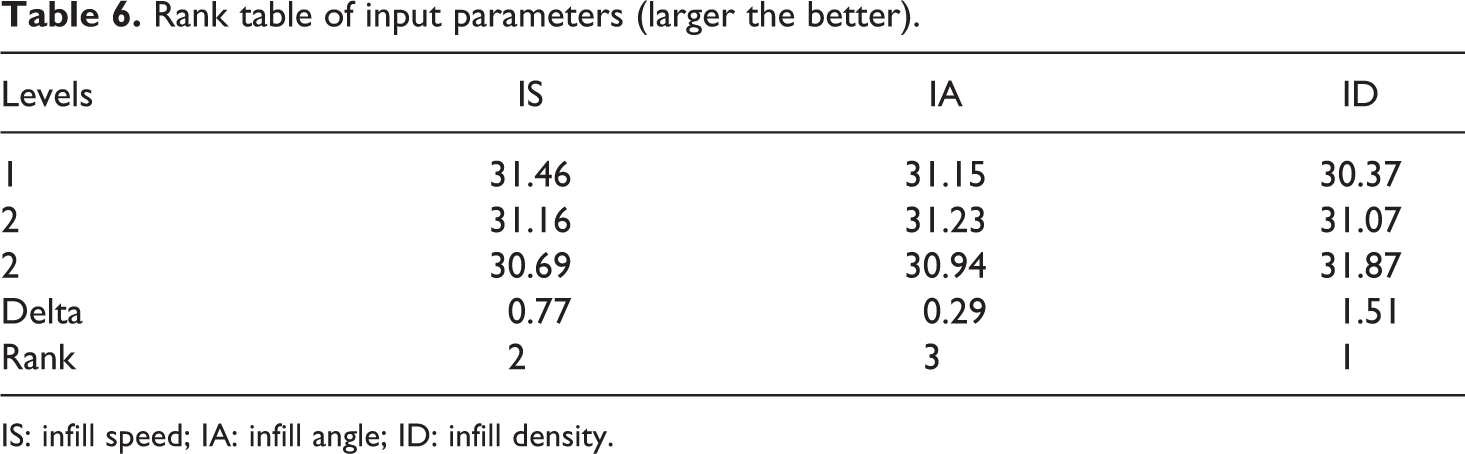
IS: infill speed; IA: infill angle; ID: infill density.
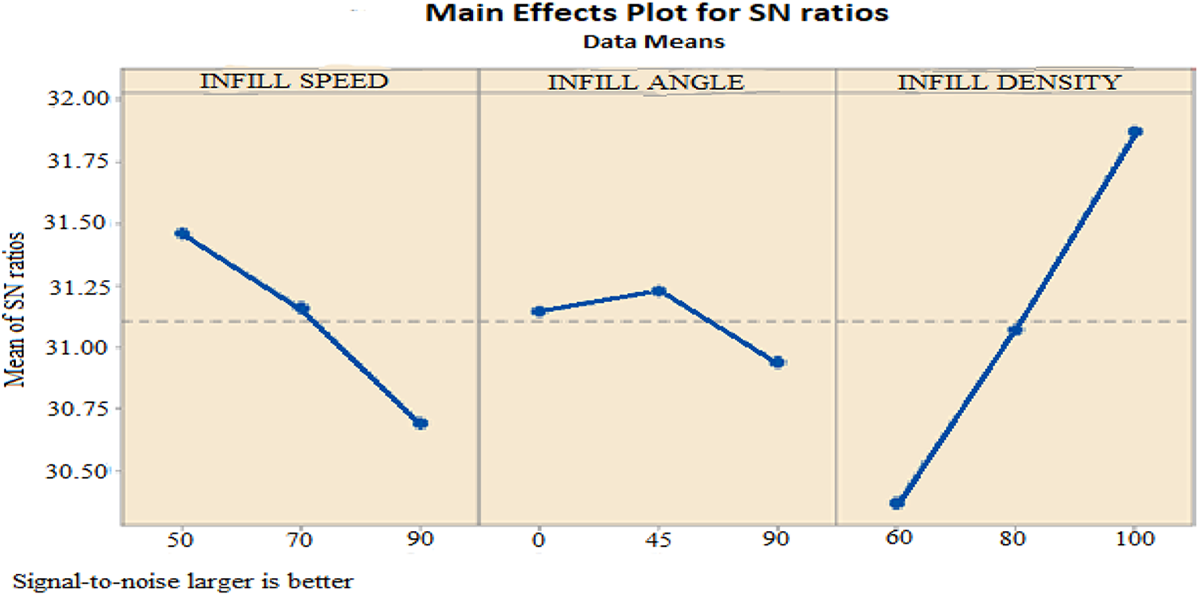
Main effects plot for SN ratios.
The SN responses obtained from Minitab software has been further used to predict the optimized values of PS at larger the better status using the following equations.

where P is mean of SN for PS = 31.10; PA is Max IS from rank table (Table 6) = 31.46; PB is Max IA from rank table (Table 6) = 31.23; PC is Max ID from rank table (Table 6) = 31.87; ηopt = 31.10 + (31.46 – 31.10) + (31.23 – 31.10) + (31.87 – 31.10); ηopt = 32.36.
Now

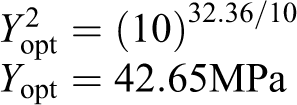
The predicted value of PS is 42.65 MPa. A confirmatory experiment was performed at the best parametric settings suggested (Figure 4), that is IS 50 mm/s, IA 45°, and ID 100%, and the observed output value of peak strength was 42.98 MPa, which was found to be very close to the calculated value.
The contour graphs of PS, BS, PL, and BL are shown in Figure 5. The contour graphs were drawn by taking the IA constant, that is, 45°. The IS was taken along Y-axis and ID was put along X-axis. As observed from Figure 5 for PS, BS, PL, and BL the best settings are IS 50 mm/s and 100% ID.
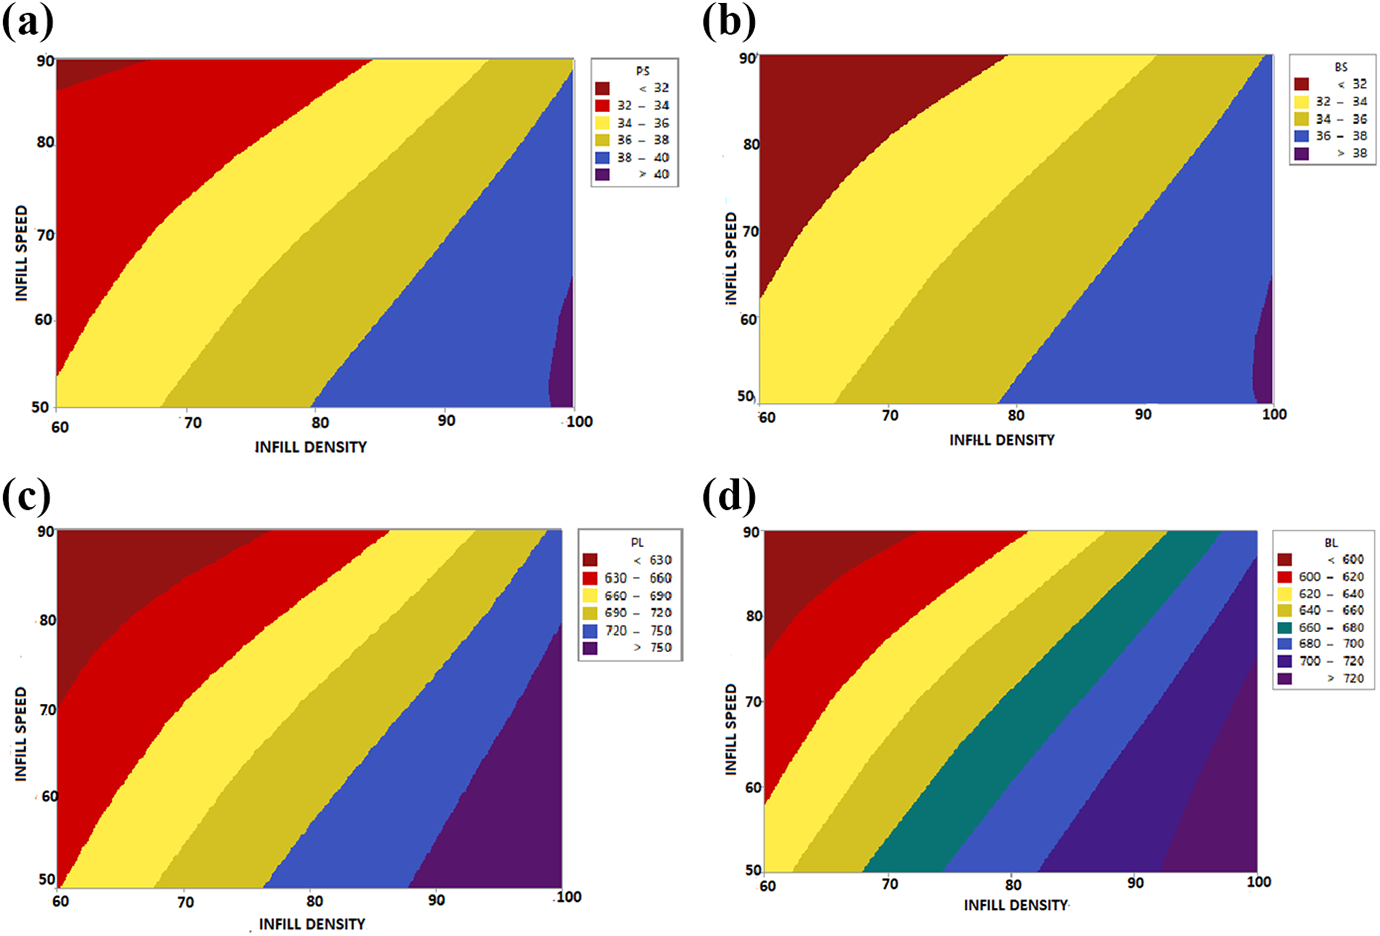
(a to d) Contour graphs of mechanical properties.
The resulted output values of mechanical testing of each property were further used to fit in regression model at three level of interaction. The regression equations of PS, BS, PL, and BL are listed in Table 7.
Regression equations of mechanical properties.
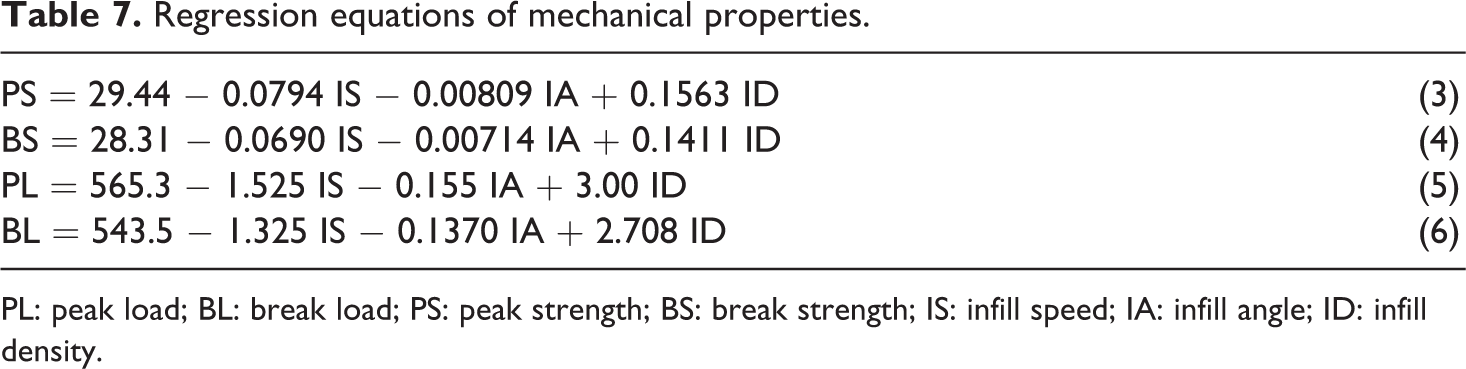
PL: peak load; BL: break load; PS: peak strength; BS: break strength; IS: infill speed; IA: infill angle; ID: infill density.
To measure the surface hardness values of the 3D printed parts, Shore D hardness tester was used (Table 8). The observed surface hardness values are in line with the tensile properties (Table 3), that is, best for experiment no. 3 and poor for experiment no. 8.
Surface hardness values of 3D printed parts.
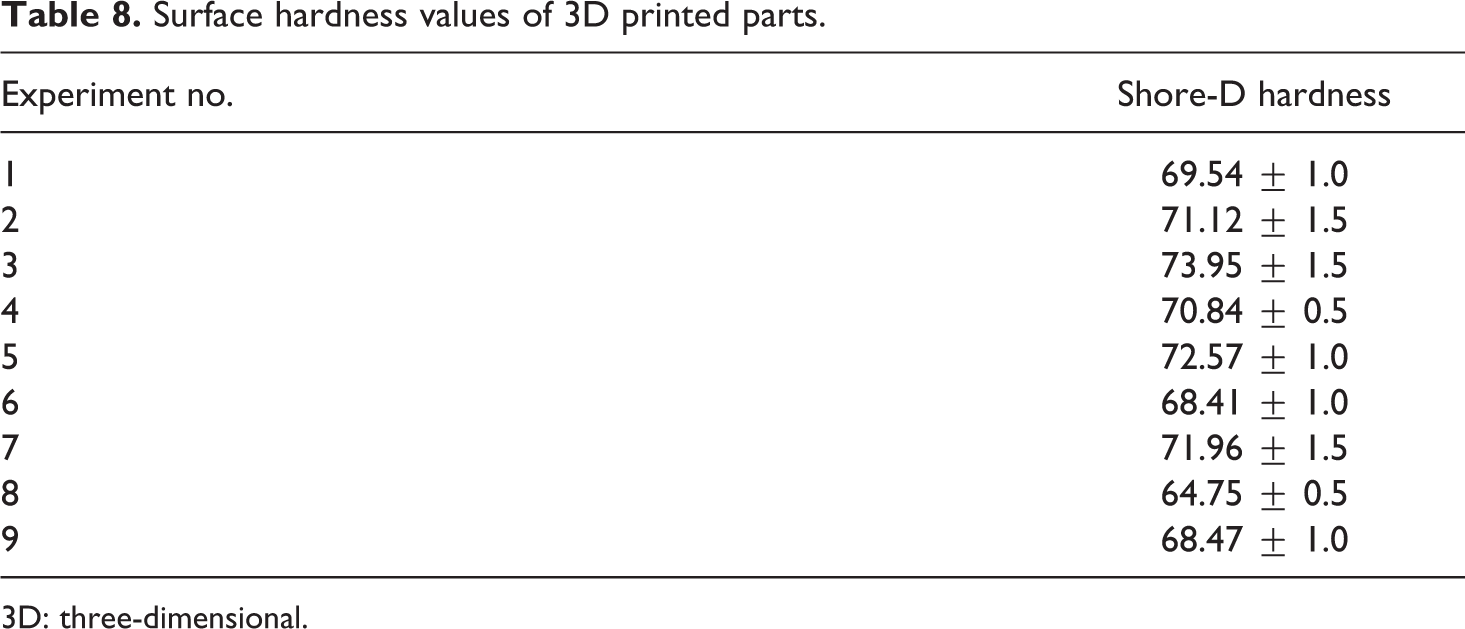
3D: three-dimensional.
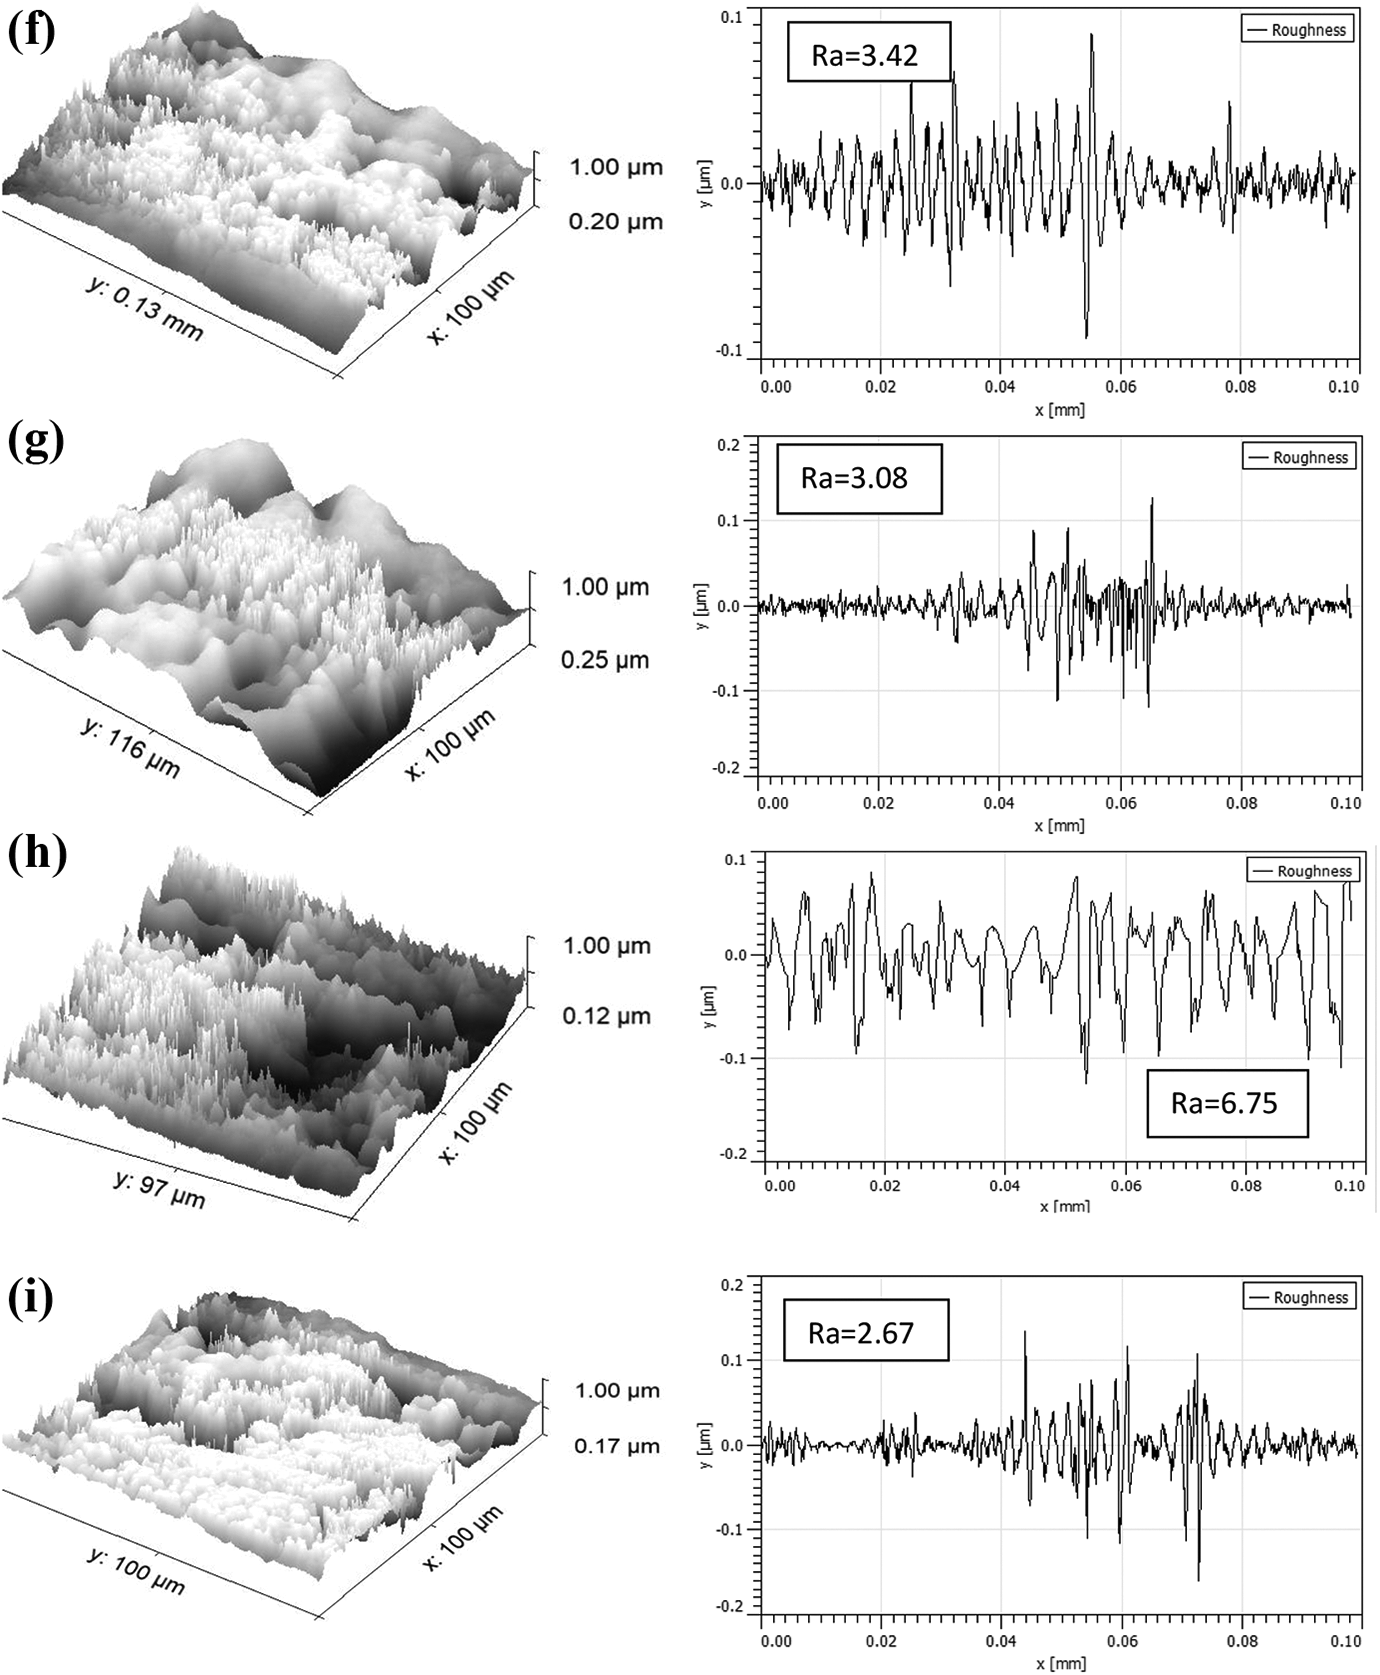
Finally, optical microphotographs of the fractured surfaces (of the 3D printed samples as per Table 3) were captured using Tool maker’s microscope at 30× magnification (Figure 6). It should be noted that the results of mechanically testing shown that the parts fabricated as per experiments setting no. 8 shows least tensile strength (Table 3). The microphotographs of the fractured surface reflect that high porosity/voids were present in successive layers of printed parts. However, the part showing best tensile properties has shown less porosity on the fractured surface. Further microphotographs of the fractured surfaces were subjected to 3D surface rendering using image processing software. The surface roughness of the fractured surfaces has been investigated through this image analysis software tool. The trends obtained from the surface analysis have shown that the parts built at high infill density level show minimum surface roughness, whereas parts built at high infill speed show more surface roughness as compared to parts built at low infill speed. Higher surface roughness reflects more gaps between peaks and valleys of the adjacent layers, which means the specimen printed at higher layer thickness is having more gap between the peak and the valley that may be due to poor binding capabilities (because of high amplitude). However, in case of tensile strength, it has been observed that better tensile properties were found for parts fabricated at low layer thickness, hence higher surface roughness resulted into poor tensile properties. In other words, the 3D printed parts showing better tensile strength also shows minimum surface roughness (Figure 7).
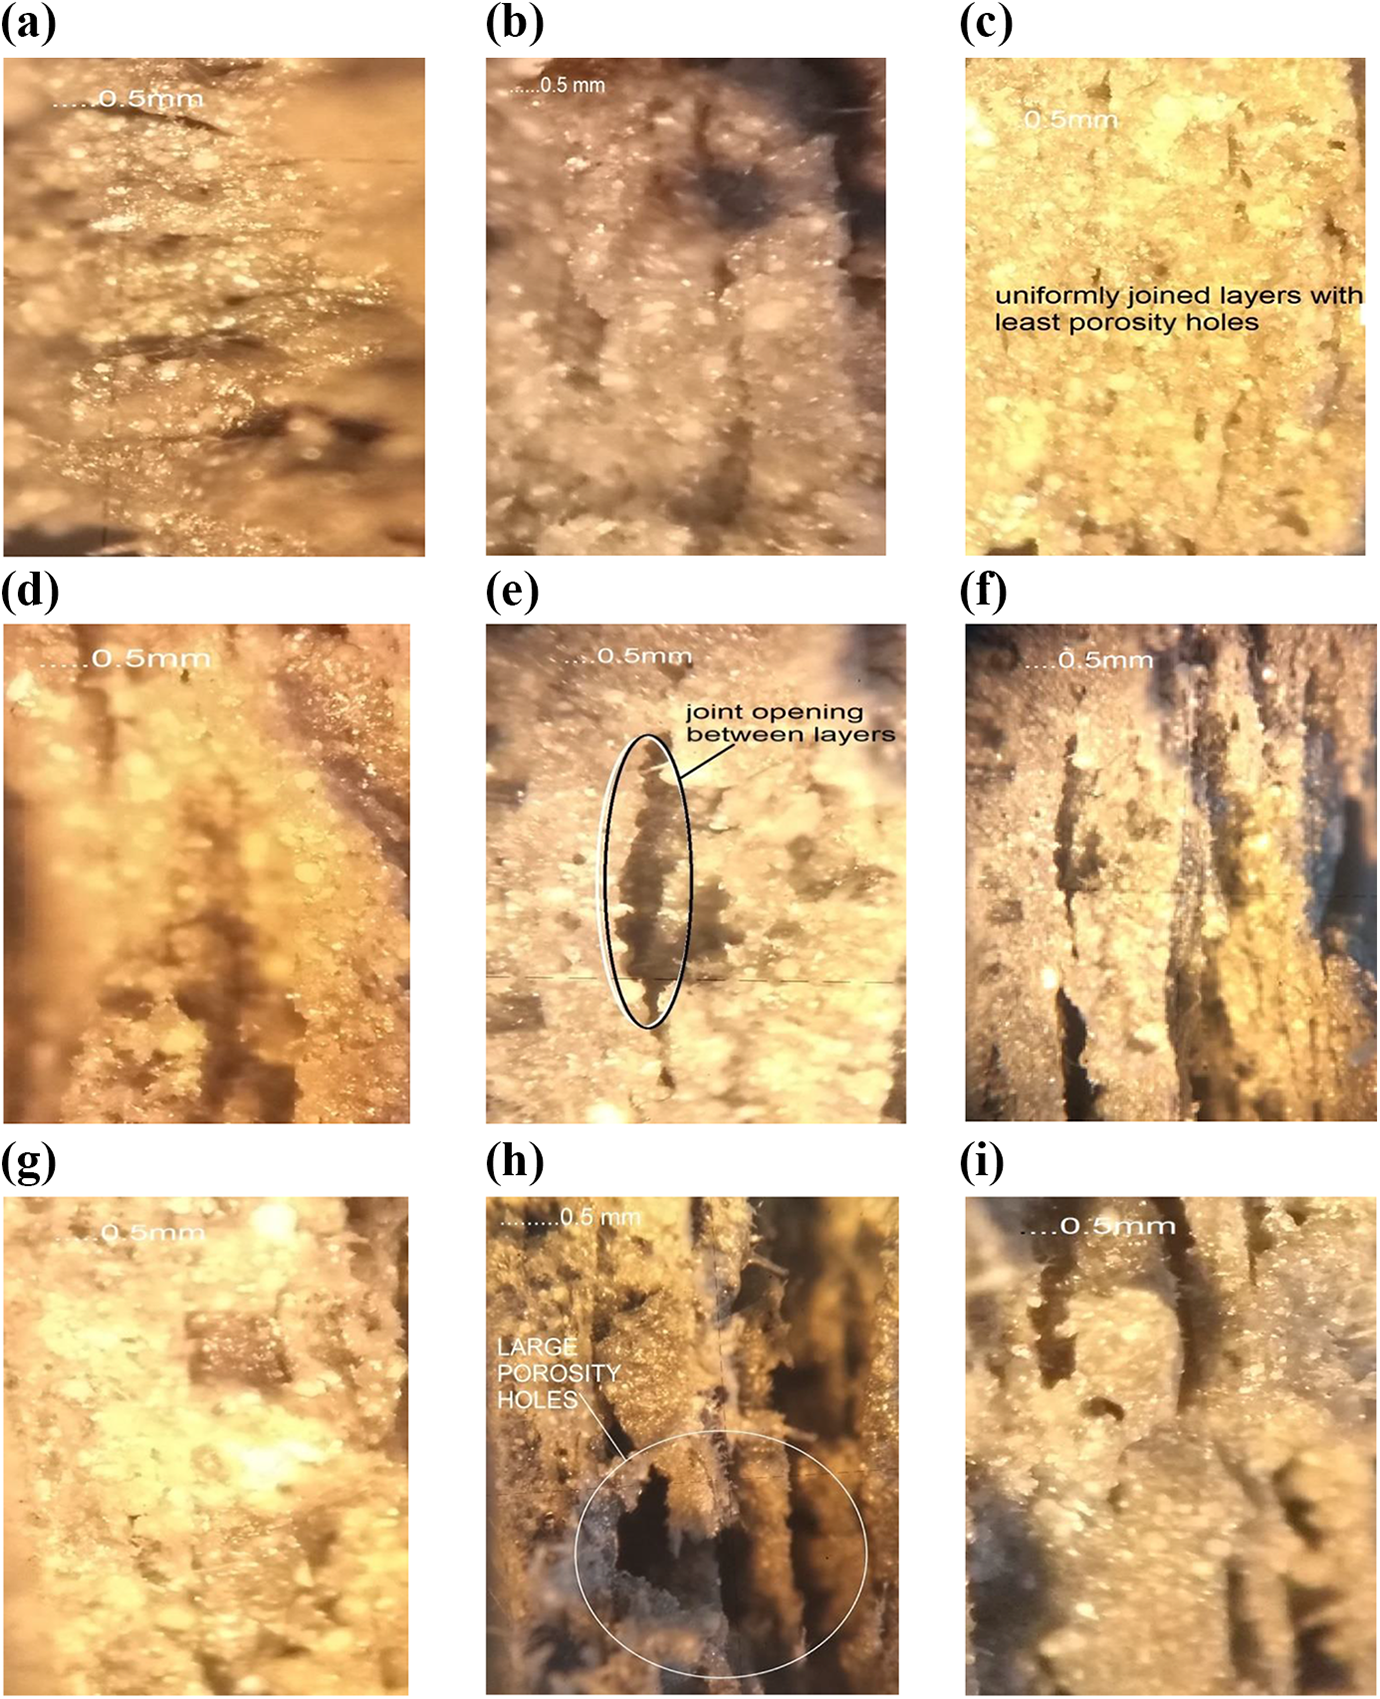
(a to i) Optical photomicrographs of fractured samples (per Table 3).
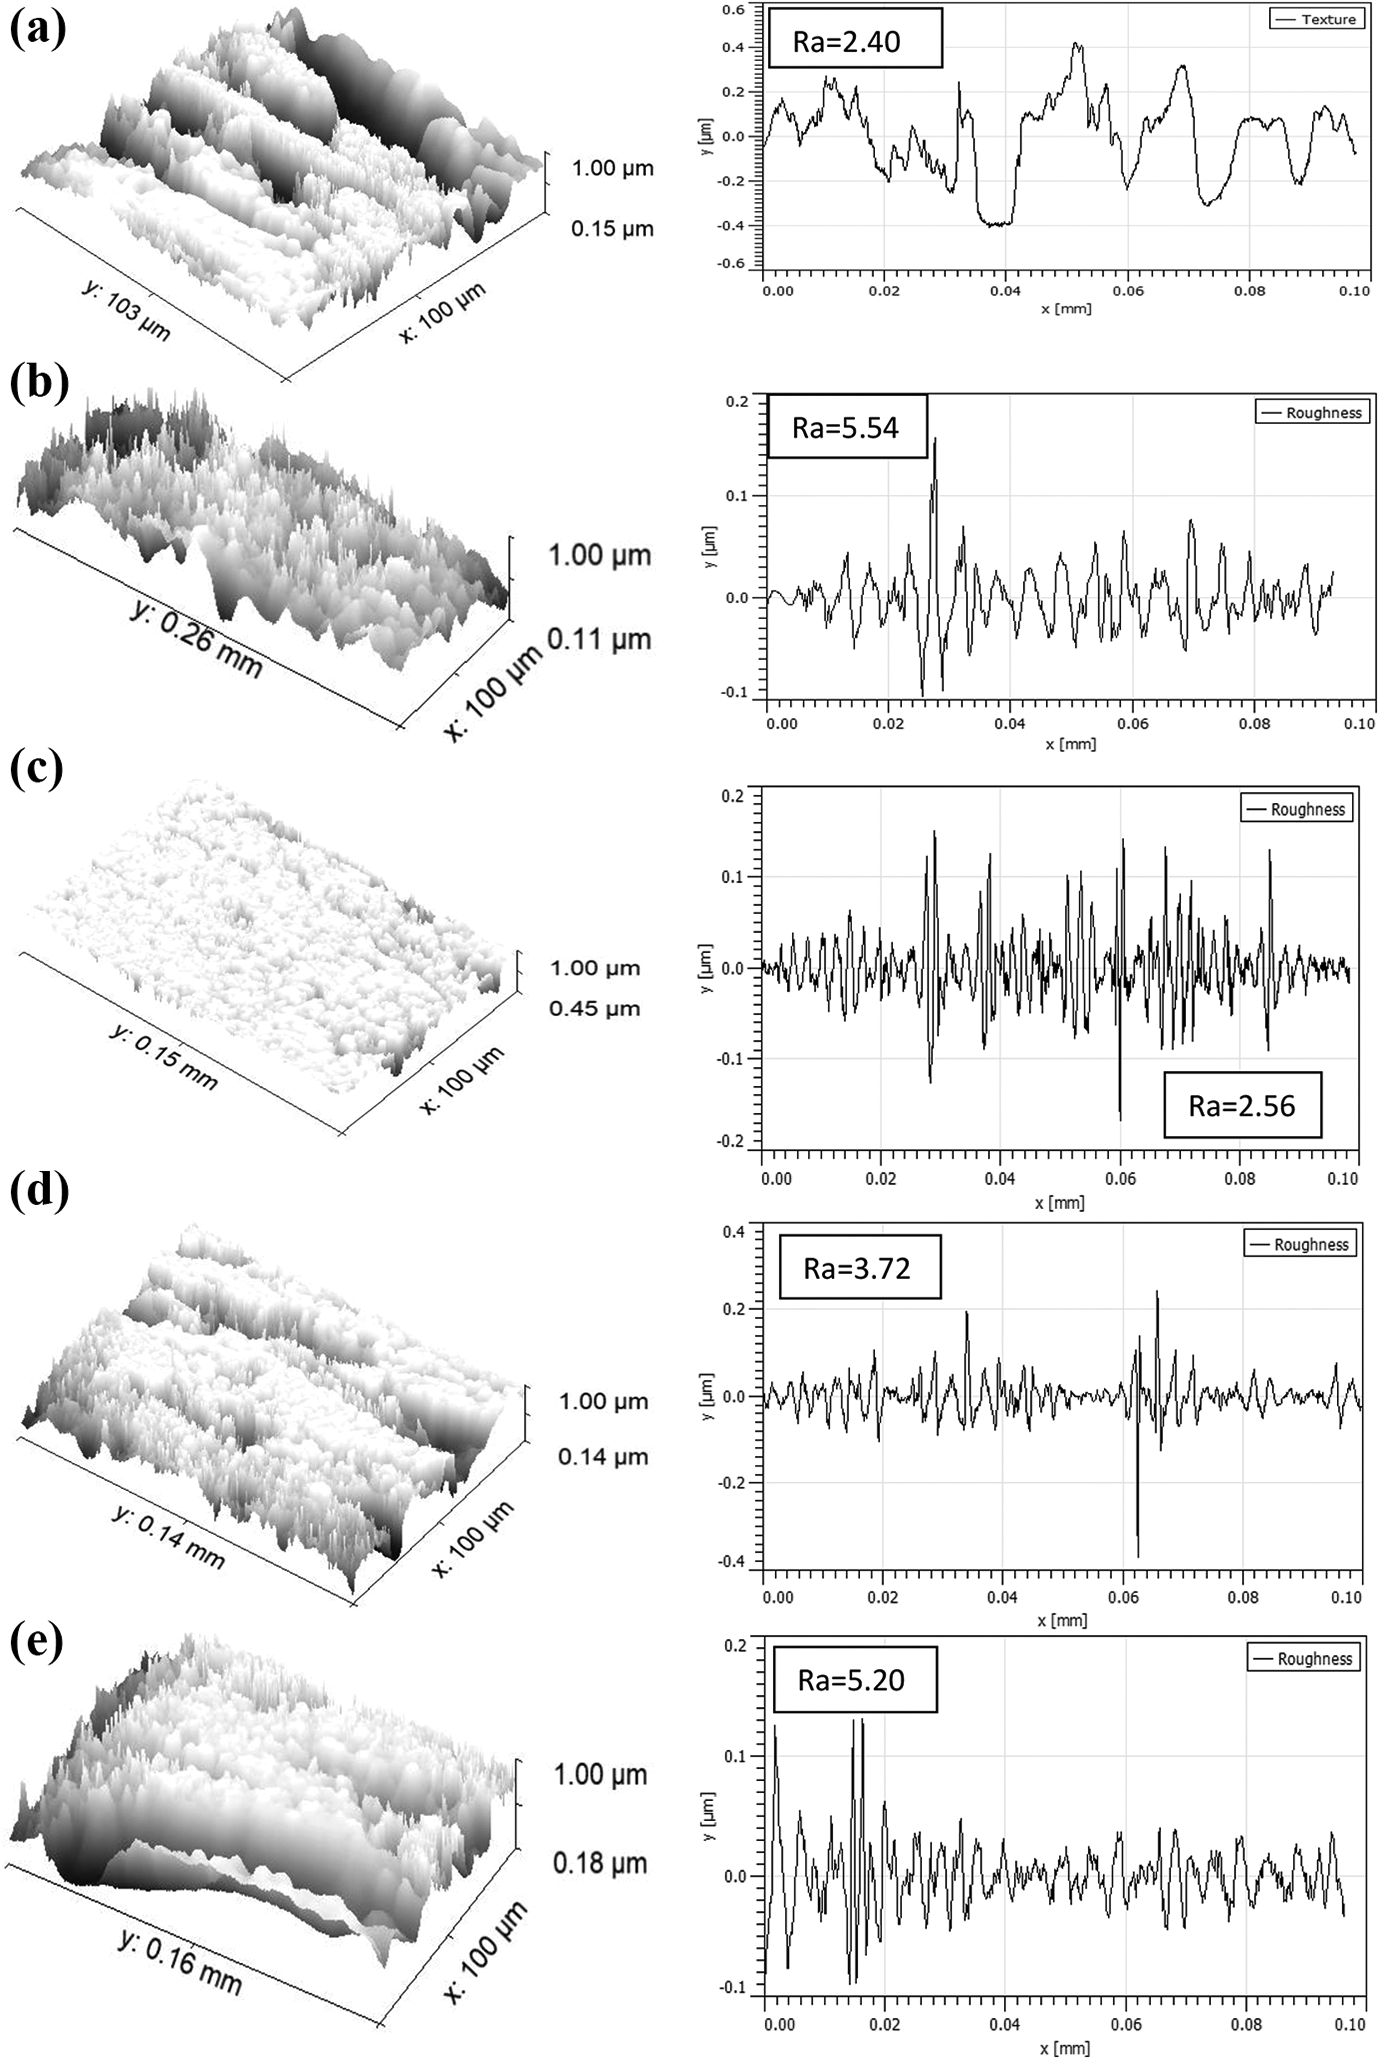
(a to i) 3D rendered image and Ra profile at cutoff length of 0.04 mm.
Conclusion
In this research work, 3D printing of functionally graded prototypes have been successfully performed from in-house developed filament comprising EAP matrix of PVDF with reinforcement of BT and Gr. The 3D printed parts were subjected to mechanical testing (for tensile properties). It has been ascertained from the mechanical testing that 3D specimens printed at infill speed of 50 mm/s and infill angle of 45° at 100% infill density provides better tensile strength. Also the regression equations for predicting various mechanical properties have been developed. The observed values for mechanical properties were observed near to the predicted values at 95% confidence level.
The 3D printed specimens were used for surface hardness and fractured surface characterization through microscopic image analysis. The surface hardness observations of printed prototypes measured using Shore-D hardness tester revealed that value of hardness were in line with tensile properties.
Photomicrographs of the fractured surfaces revealed that the parts fabricated at high density level shows less porosity/void formation which contributed for better mechanical performance as compared to parts fabricated at low density level.
Footnotes
Author's Note
Rupinder Singh is also affiliated with Department of Mechanical Engineering, National Institute of Technical Teachers Training and Research, Chandigarh, India.
Acknowledgments
The authors are thankful for Manufacturing Research Lab at Guru Nanak Dev Engineering College, Ludhiana, Punjab, India, for performing experimentation and TIET, Patiala, Punjab, India, for providing financial support in this research.
Funding
The author(s) received no financial support for the research, authorship, and/or publication of this article.