
Abstract
This article reports the experimental investigations of polyvinylidene fluoride (PVDF) matrix-based composite feedstock filament (reinforced with barium titanate (BTO) and graphene (Gr) for possible 4-D printing applications) using fused deposition modeling (FDM). The mechanical, rheological, thermal, and morphological properties of in-house prepared FDM filament are also reported. The FDM feedstock filament was prepared with a twin-screw extruder (TSE). The process parameters of TSE for preparation of smart material-based filament with uniform dispersion of reinforcement (BTO and Gr) in the PVDF matrix have also been explored. Finally, the prepared filament has been used on FDM setup (without any change in hardware/software) for printing piezoelectric sensor with 4-D capabilities. The results of the study suggest that BTO and Gr have significant effect on the melt flow index of PVDF. The composite prepared with reinforcement of BTO and Gr shows a continuous flow, along with better thermal stability (based upon differential scanning calorimetry analysis), when 10–20 wt% BTO was added to the PVDF matrix. The observed maximum peak and break strength of the PVDF composite was 29.57 MPa and 26.50 MPa, respectively. The scanning electron microscopy and energy-dispersive X-ray analysis results reveal that the filament prepared with 20% BTO and extruded at 200°C with a screw speed of 40 r/min has better dispersion of reinforcement among the selected parametric settings. Finally, a piezoelectric response of 20 pC/N has been measured on the FDM-printed thermally stable sample suitable for 4-D applications.
Keywords
Introduction
Additive manufacturing (AM) is a vastly growing manufacturing technique with numerous applications in different fields such as medical implants, especially in dentistry for the fabrication of dentures, 1 –3 bridges, and crowns; tissue engineering for 3-D tissue fabrication; electronics for fabrication of sensors; and jewelry of complex design. 4 –6 In the last two decades, large numbers of innovations with respect to printers, raw materials, and types of processes have been made in this sector. 7 The 4-D printing or smart manufacturing is also an innovative technique in this context. 8 –10 The concept of 4-D printing is similar to the 3-D printing with the addition of the fourth dimension, that is, transformation in printed object over time. 11 Hence 4-D printing makes the 3-D printed structures capable to alter its properties and shape with respect to time under some external stimuli such as temperature, water, pressure, light, or wind. 12 In other words, 4-D printing is the integration of time with the existing 3-D fabrication technique. The structures fabricated by the 3-D printing process are commonly fabricated by plastics, ceramics, and metals/alloys. 13 –15 However, most of these materials are not eligible for 4-D printing due to their nonreactive nature with applied stimuli. Therefore, the materials incorporated in 4-D printing process are programmable materials, or also known as smart materials. 16,17 These smart materials are flexible, expandable, and deformable in response to external stimuli. 18,19
Recently, two types of smart materials are generally introduced for 4-D printing: (i) autonomic and (ii) non-autonomic. Autonomic smart materials do not require any external triggering to react with stimuli. They change the material properties over a certain period of time after fabrication. However, non-autonomic smart materials require human intervention to respond to external stimuli. The type of stimuli and its application depend upon the functional properties of the smart material. 20 –22 Another important type of smart material is piezoelectric material, which is capable of producing voltage when it comes under external pressure, and vice versa. 23 Piezoelectric materials have been widely used for fabrication of electronic sensors. Mostly the sensors are made up of piezoelectric ceramics that are rigid enough to respond to less applied stress. 24 For 4-D printing applications, piezoelectric materials (polymers, ceramics, etc.) can be integrated with the existing 3-D printing techniques such as fused deposition modeling (FDM) and electrospinning.
FDM is a low-cost rapid prototyping technique, which works on the principle of AM in which materials are deposited in layered manner. In FDM, thermoplastic filament is extruded in semi-molten form through the heated nozzle. 25,26 Electromechanical drives have been used to feed the filament wire. The vertical and horizontal movement of extrusion head is totally controlled by computer software. 27 Even after three decades of invention of AM, most of its prominent processes like FDM are still facing the problem of material availability. On the flip side, the cost of commercially available and patented materials is very high. Thus, the increase in material cost is a major obstacle in the path of commercializing these advanced manufacturing processes at small-scale industries. 28 To overcome this problem, researchers are constantly working on methods to develop FDM-based feedstock filament by incorporating numerous polymers, powders, ceramics metals, and so on.
Some studies have been reported on FDM filament of thermoplastic composites consisting of ferrous particles in the nylon/acrylonitrile butadiene styrene matrix for direct rapid tooling. 29 In another study, mechanical properties and integrity of printed prototypes in relation to extrusion conditions of filament were determined. It has been quoted that the process parameter of screw extrusion affects the mechanical strength of the fabricated filament. 29 It has also been reported that the mechanical properties of alternatively developed filaments depend majorly upon the selected processing parameters of screw extruder worked for the fabrication of feedstock filament comprising of smart materials for piezoelectric applications. 30 –33
The literature review reveals that significant studies have been reported on in-house prepared feedstock filament for different AM processes. But hitherto, little work has been reported on polyvinylidene fluoride (PVDF) reinforced with barium titanate (BTO) and graphene (Gr) feedstock filament of FDM, especially for 4-D applications. In this study, an effort has been made to prepare a smart material filament in a cost-effective way for the existing FDM setup. Both BTO and Gr powder have been reinforced into the smart polymer matrix of PVDF. The proportion of material was selected on the basis of the melt flow index (MFI). Taguchi approach has been used to optimize the process parameters of a twin-screw extruder (TSE) for studying the mechanical properties (peak strength and break strength) of the filament.
Experimentation
Methodology
The methodology used in this study is classified into main four steps, which is shown in Figure 1. PVDF was selected as the base polymer matrix because to its outstanding piezoelectric properties. In addition, it has several advantages, such as lightweight, good flexibility, and high sensitivity to applied mechanical loads, over piezo-ceramics. Thus its applications domain has been extended in transducers, sensors, and now in 4-D printing. PVDF is a semicrystalline long polymeric compound wherein repeated chains of–CF2–CH2– units can be added (see Figure 2), where both fluorine and hydrogen are positively and negatively charged with carbon atoms, respectively. Although the PVDF is inherently polar, its randomly oriented crystalline structure is responsible for its zero net polar moment in its original state. In this research work, Solef PVDF 6008/0001 grade was used. The material was procured from local market (Deval Enterprises, Vadodara, Gujarat, India).
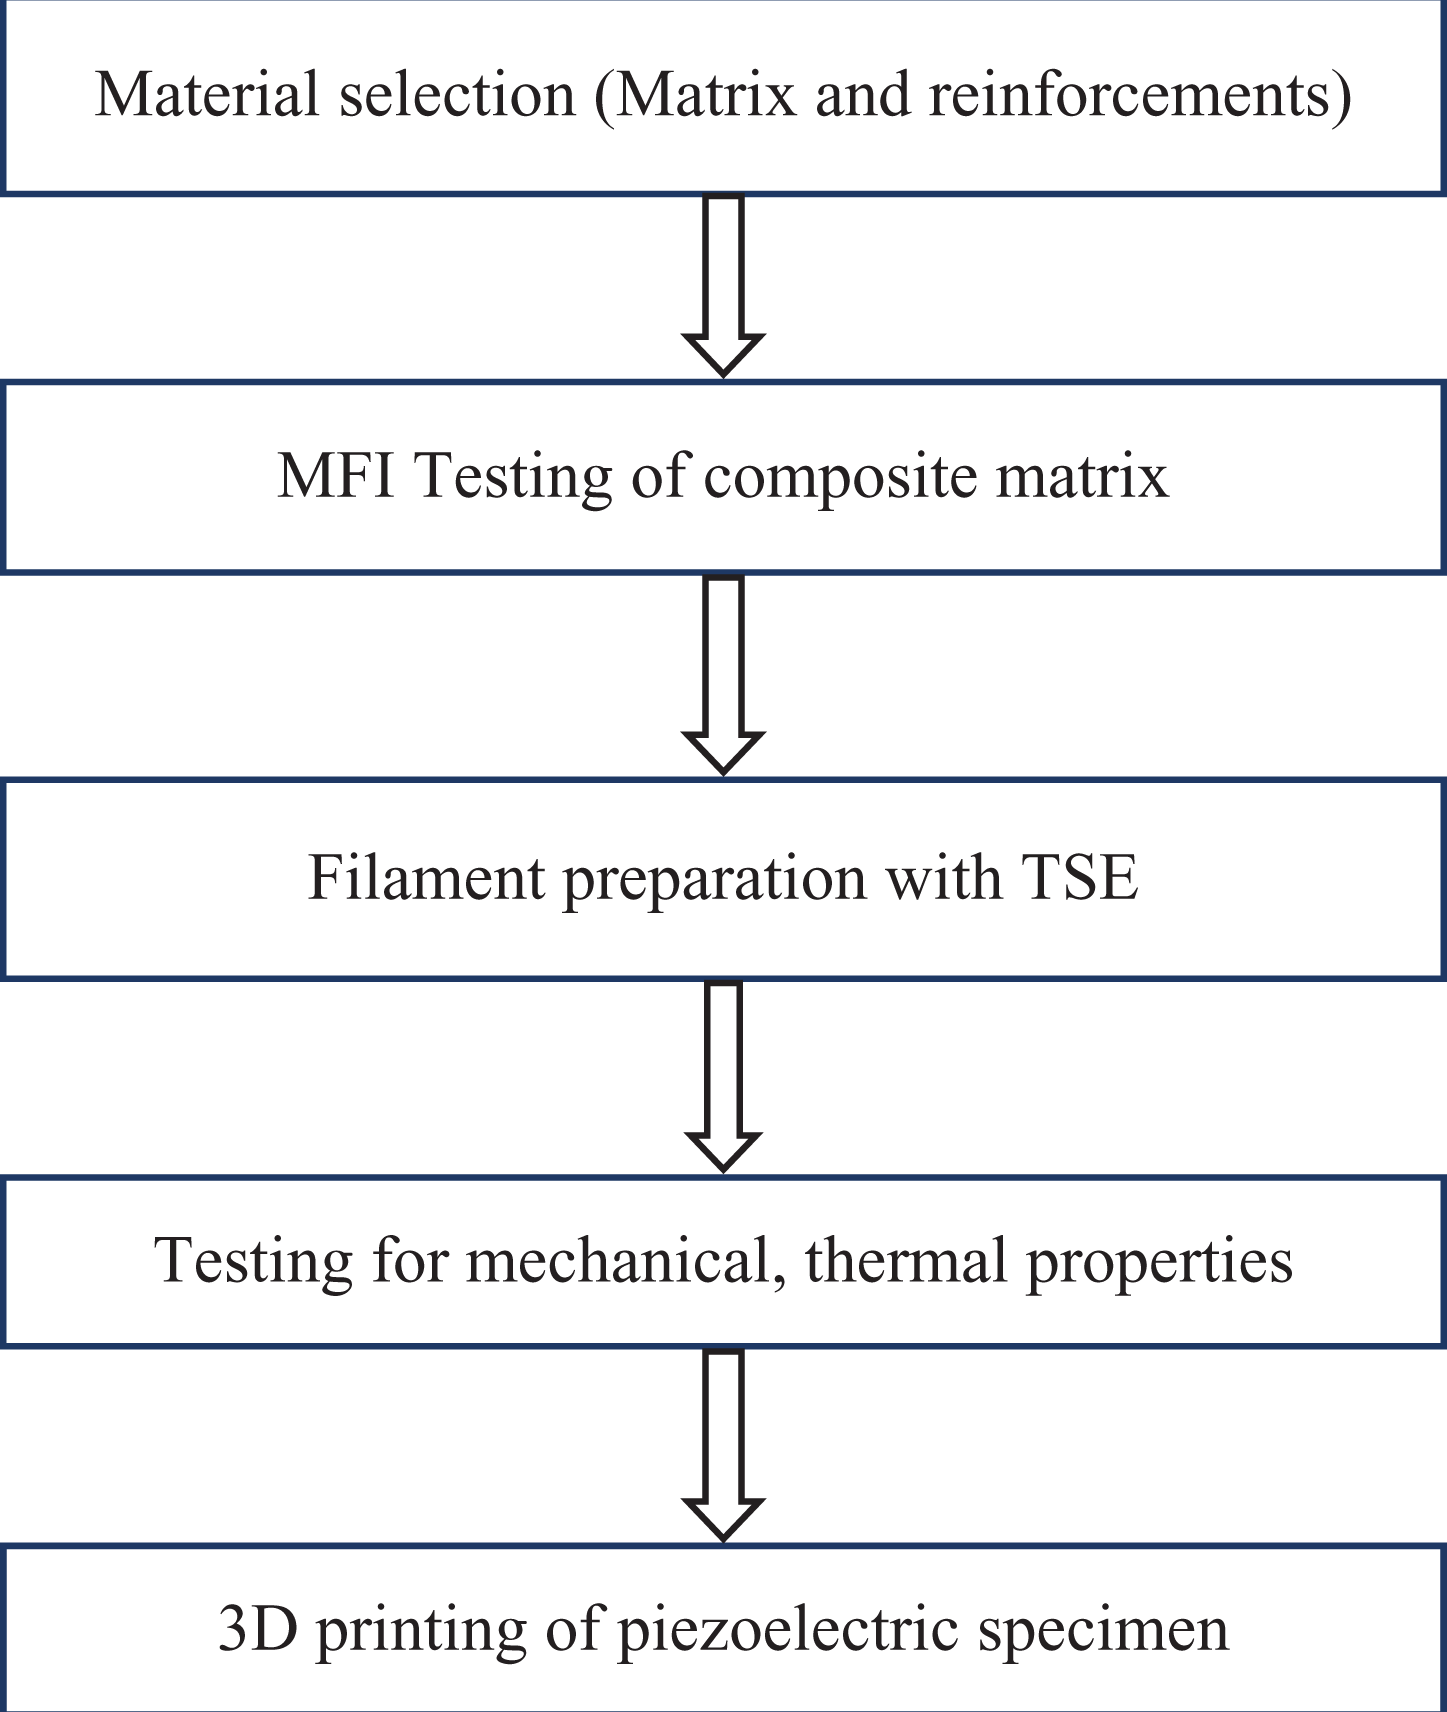
Methodology adopted.
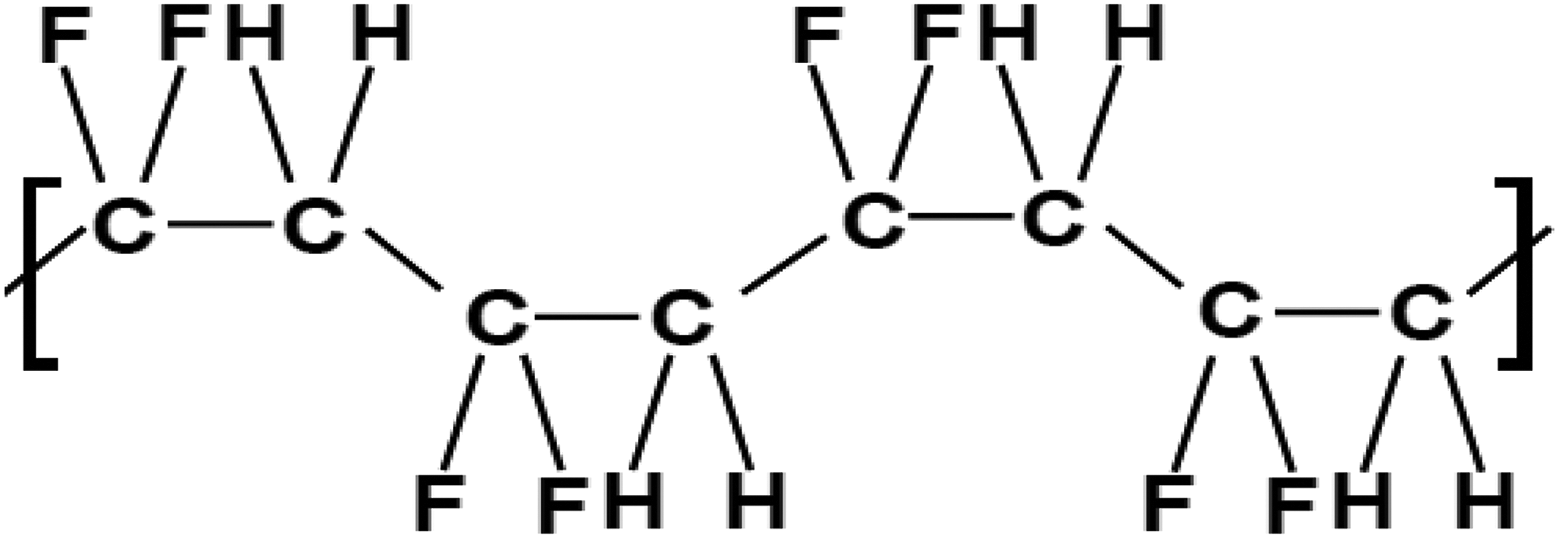
Chemical structure of PVDF.
BTO is a ceramic material having excellent piezoelectric properties. Its large dipole moment can be used to reinforce in the polymer matrix to enhance its piezoelectric properties. BTO is inorganic and is a suitable lead-free filler among the other piezoelectric ceramics. BTO (particle size: 100 nm, purity: 99.9%, specific surface area: 10.42 m2/g, color: white, morphology: spherical, true density: 5.85 g/cm3) was also procured from local market (Ultra Nanotech Pvt. Ltd, Bengaluru, Karnataka, India). Figure 3(a) and (b) shows transmission electron microscopy image of BTO and X-ray diffraction (XRD) analysis (according to the supplier data), respectively. Along with BTO, Gr was selected as the filler in the polymer matrix. Gr is a highly conductive material. A study conducted by a group of researchers highlighted that Gr is helpful in improving the thermal, electrical, and mechanical properties of the polymer matrix. 34 For this study, Gr (physical form: fluffy, color: gray–black, thermal conductivity: 3000 W/mK, tensile modulus: 1000 GPa, electrical conductivity: 107 Siemens/m, purity: 99%, thickness: 5–10 nm, length: 5–10 µm, density: 3.1 g/cm3, number of layers: 4–8, surface area: 200–210 m2/g) was also procured from local market (Platonic Nanotech Pvt. Ltd, Mahagama, Godda, Jharkhand, India). Figure 4(a) and (b) shows scanning electron microscopy (SEM) image of Gr and XRD (according to the supplier data), respectively.
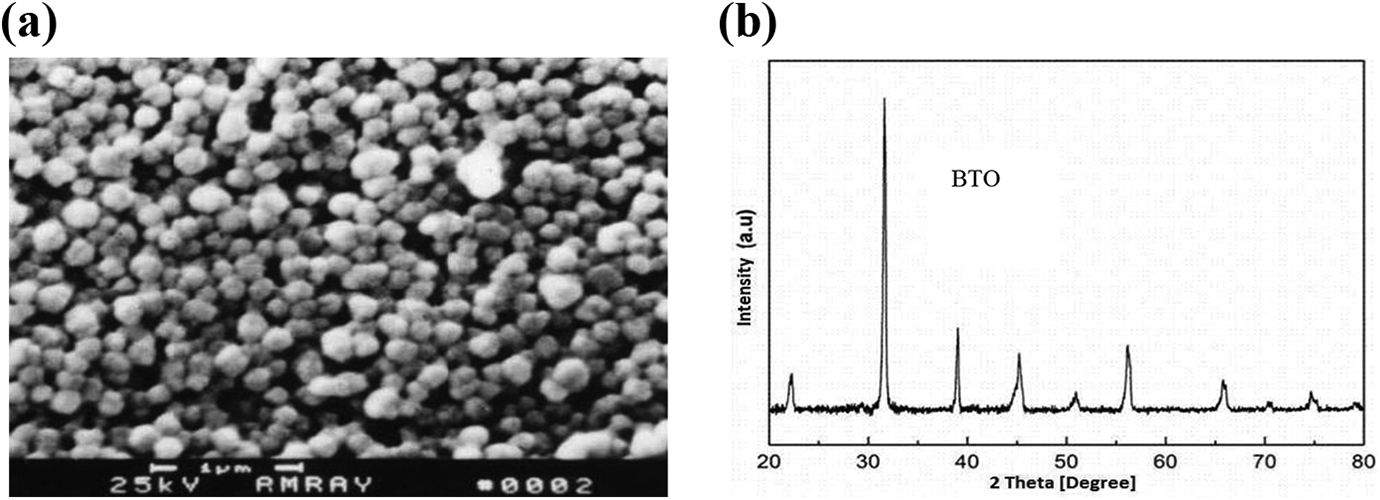
(a) TEM image and (b) XRD of BTO nanoparticles (per supplier data).
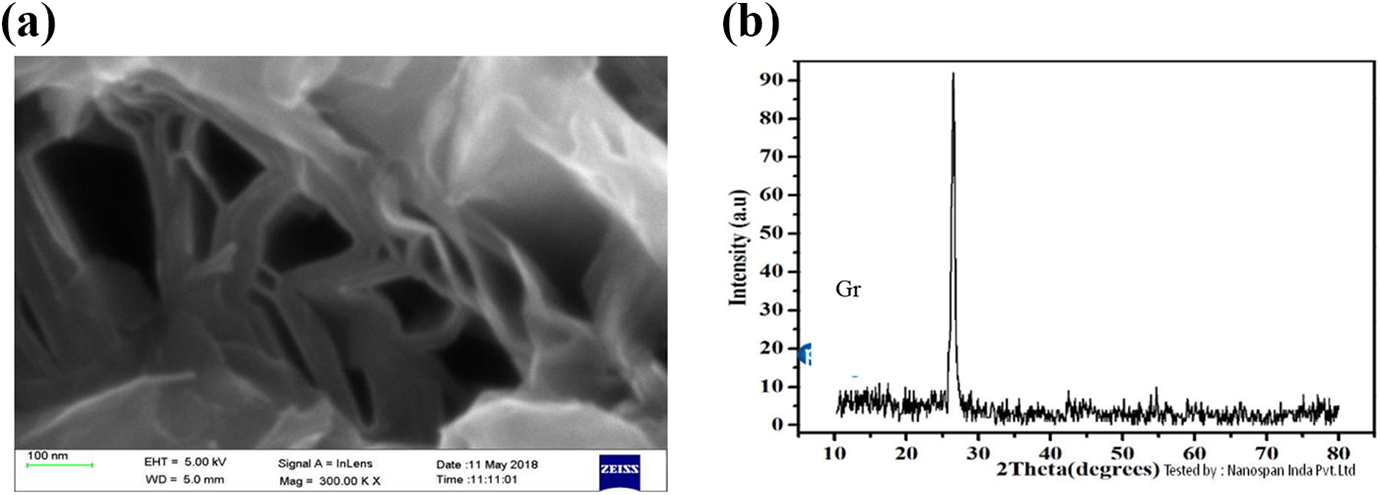
(a) SEM image and (b) XRD of Gr nanoparticles (as per supplier data).
Rheological properties
The successful running of extruded filament in the existing FDM setup depends upon the stiffness and consistent diameter of the feedstock filament, and it can be achieved only by appropriate selection of proportion of ceramics or other reinforcements in the polymer matrix. Therefore, the behavior of the composite under processing conditions can be specified by rheological properties. The MFI has been used to measure the flow behavior of the material under specified conditions according to ASTM D1238 standard. Generally, the polymers having MFI near to 2.4 g/10 min runs smoothly in the available FDM setup. In this experimental work, the MFI was conducted at 230°C cylinder temperature with 5 kg applied weight. Figure 5(a) and (b) shows the effect of BTO and Gr, respectively, on the MFI of the PVDF composite matrix (with single reinforcement).
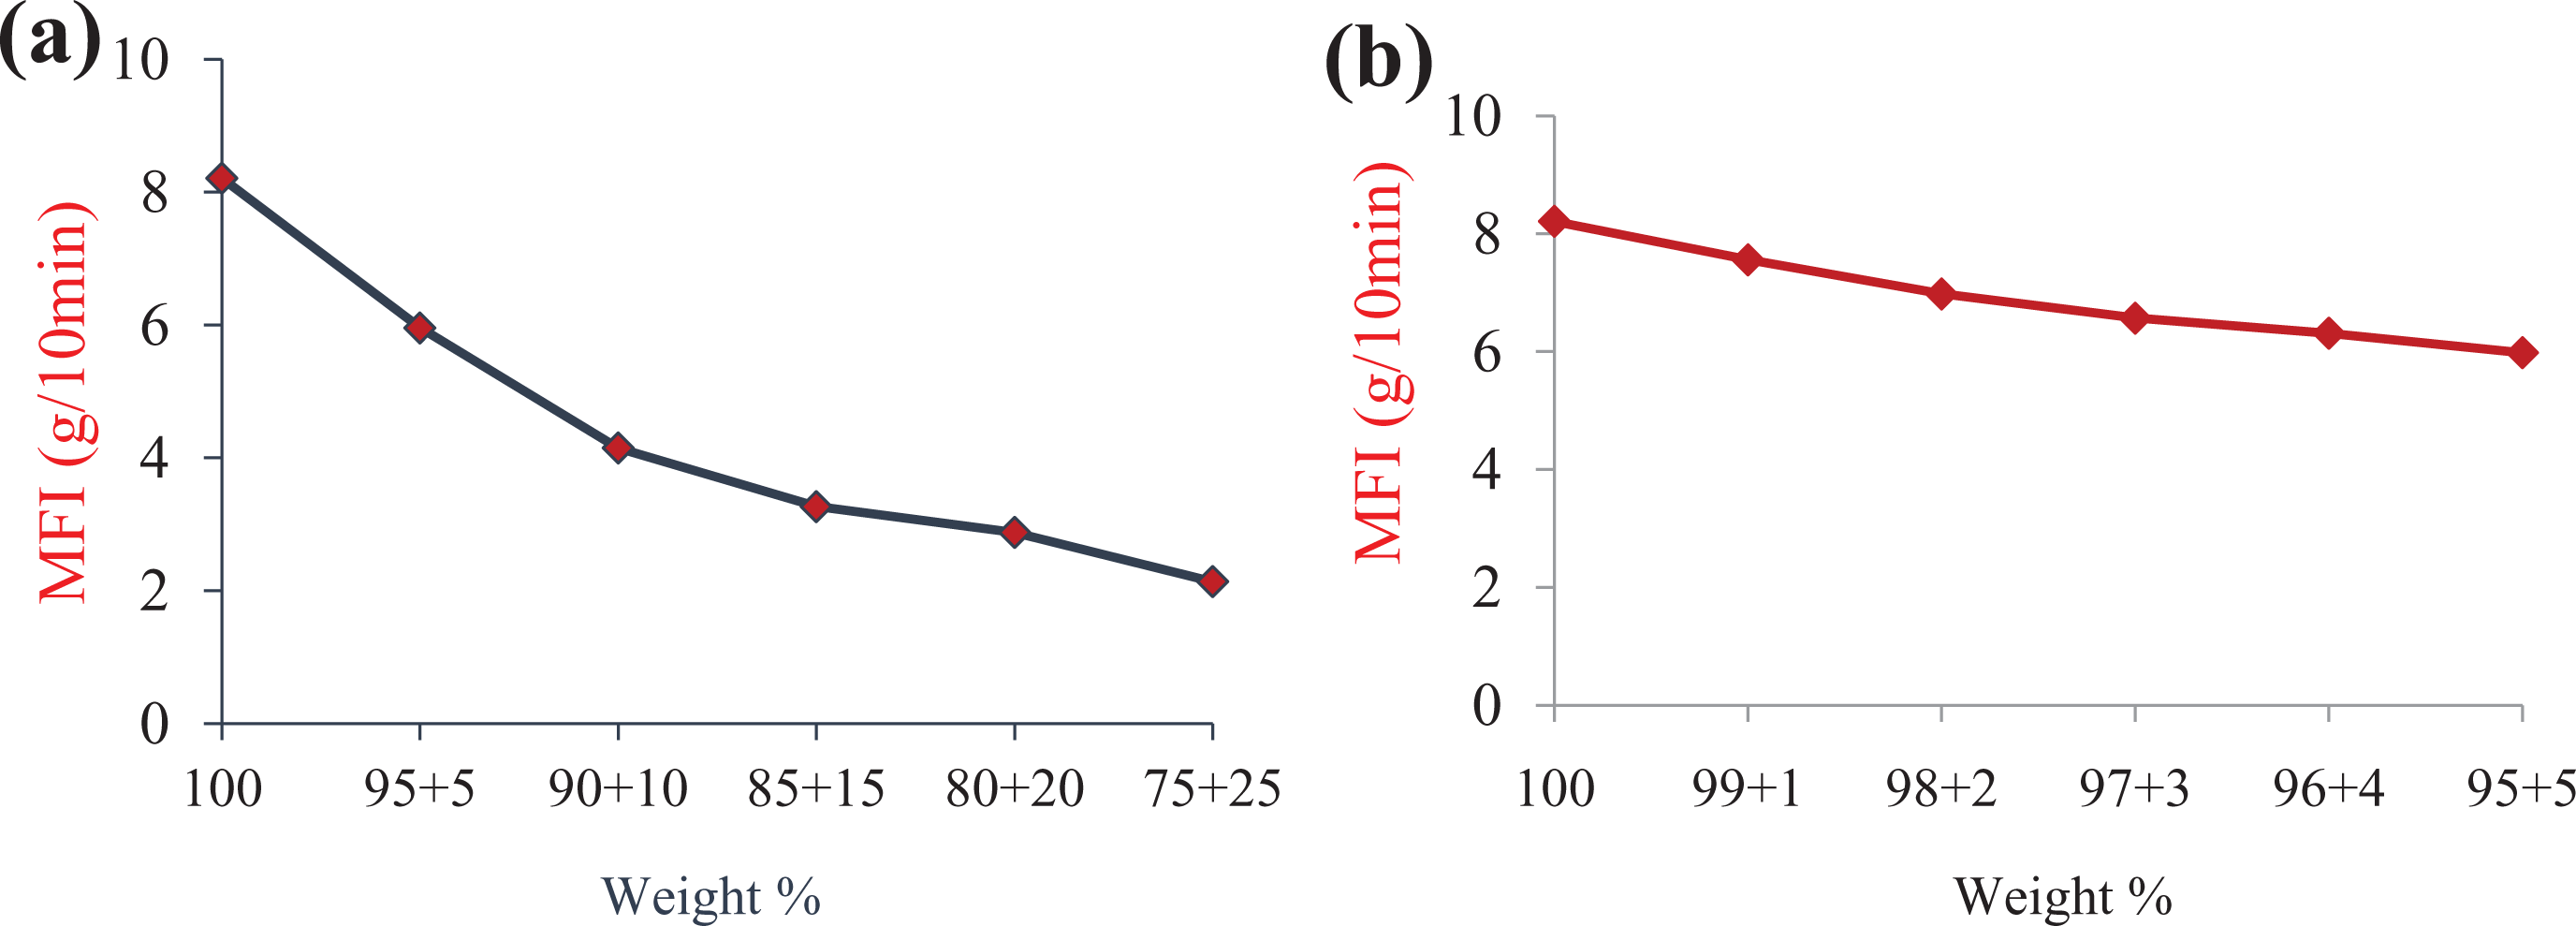
Effect of reinforcement on MFI of (a) PVDF + BTO and (b) PVDF + Gr.
Based upon the results of MFI (Figure 5), 2 wt% Gr was added to the PVDF matrix, whereas up to 20 wt% BTO was reinforced in the PVDF + Gr + BTO composite matrix. It has been observed that as BTO proportion is increased from 10 to 20, the MFI value of the PVDF composite matrix was decreased. Table 1 lists the proportion/composition by weight percentage and their respective MFI values.
MFI at different proportion of materials.
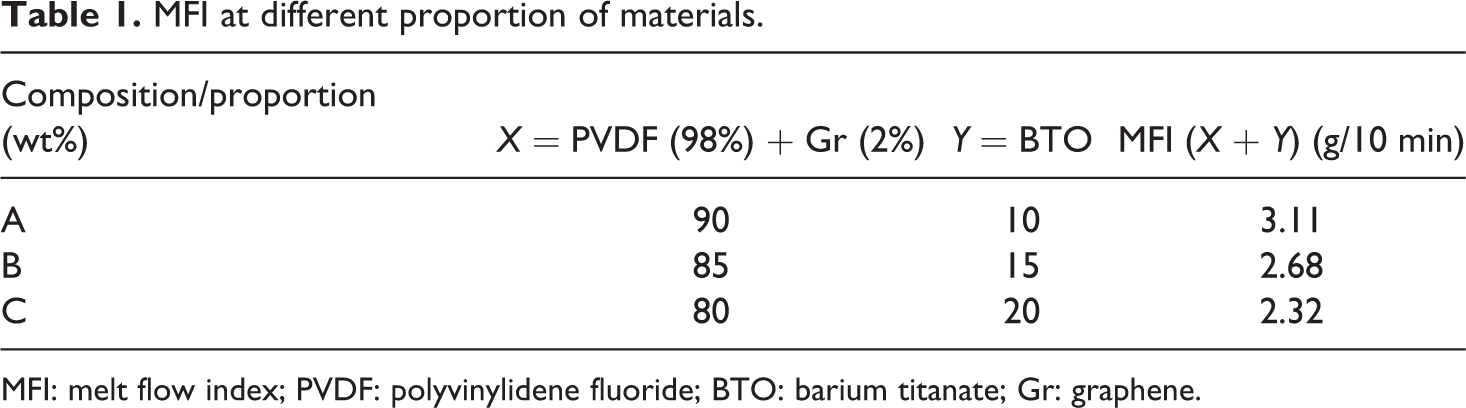
MFI: melt flow index; PVDF: polyvinylidene fluoride; BTO: barium titanate; Gr: graphene.
Extrusion process
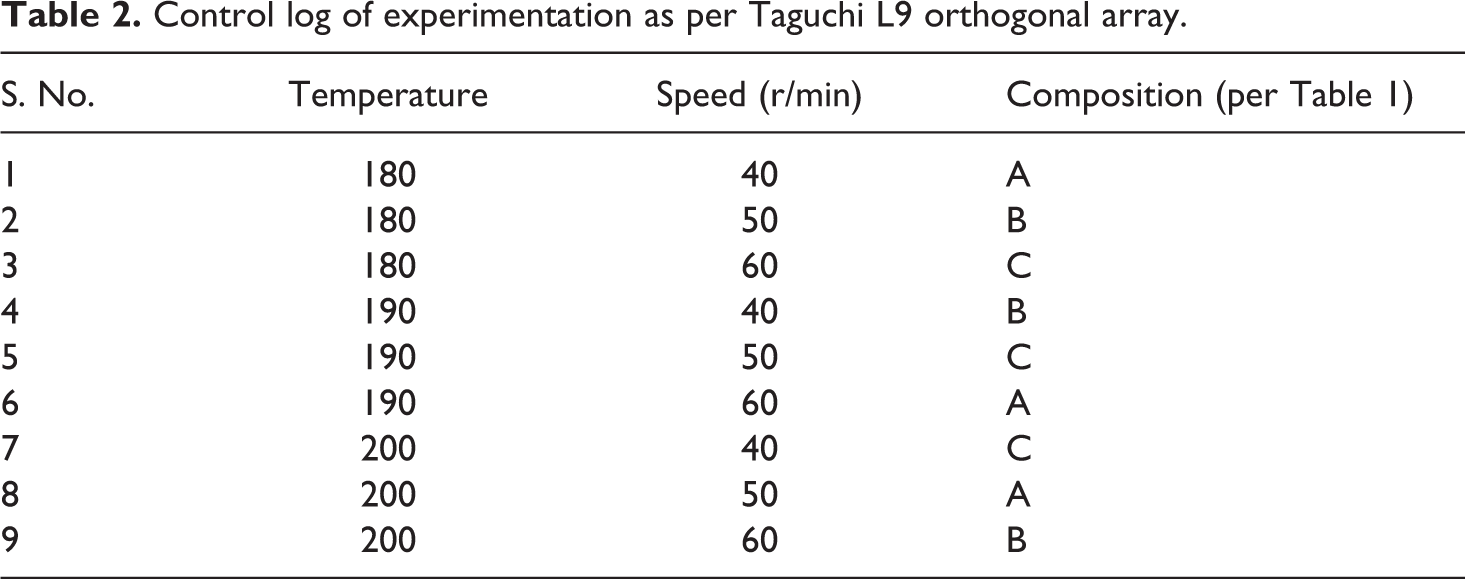
A Thermo Scientific (HAAKE, Germany) TSE was used to fabricate the feedstock filament. The TSE has two corotating screws. It is operated by a computer software. Commercial TSE is well-known for providing high degree of dispersion, so it has been used for compounding two or more materials. Temperature of the extruder depends upon the melting point of the material. It has a small opening, and the diameter of the opening can be changed by changing the diameter of the die. To obtain high degree of dispersion, the die opening was chocked for 10 min while the screws were continuously rotating at a predefined speed. The process parameters of the extruder (temperature and r/min) affect the dimensional accuracy as well as mechanical and thermal properties of the filament. To select the level of processing parameters, a pilot study was performed by taking the levels on the basis of literature and melting point of the polymer matrix. It has been experimentally observed that the mixture was not extruded in continuous form below 175°C temperature and 30 r/min, respectively. As the temperature was raised above 210°C with 70 r/min, the molten material is getting extruded at a very fast rate by compromising the dimensional stability (visual observations). Therefore, to achieve good mechanical and thermal properties with consistent diameter of wire, the barrel temperature may be put in the range of 180–200°C and the speed of twin screws within the range of 40–60 r/min. A blend of Gr, BTO, and PVDF as listed in Table 1 was fed into a 7-ml TSE at the preselected temperature and allowed to get mixed for 10 min. Initially during mixing, the speed of the extruder was set as 100 r/min. After 10 min of mixing, the screw speed was set as per control log (see Table 2). After this, the composite was extruded in the form of filament.
Control log of experimentation as per Taguchi L9 orthogonal array.
Results and discussion
Tensile testing
The tensile testing was performed on a universal tensile testing machine (Shanta Engineering, Thane, Maharashtra, India) according to ASTM D-638 standards by using a load cell of 10 kN, and accuracy of the load cell was 0.5 N. The output values of tensile testing in the form of peak strength, break strength, and modulus of toughness/energy absorbed are listed in Table 3.
Observations for tensile properties.
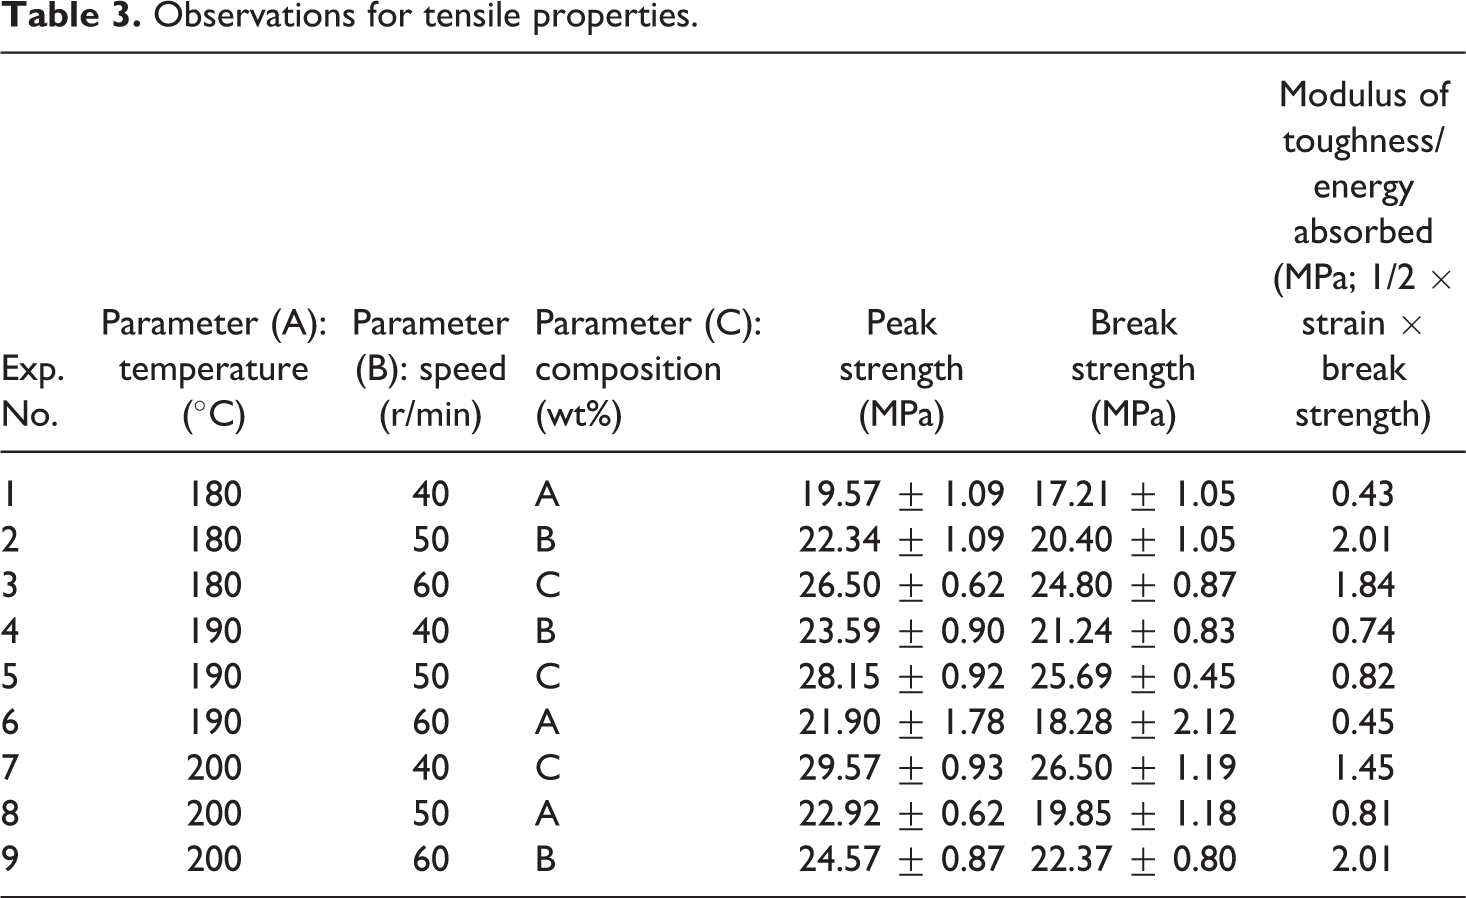
As observed from Table 3, maximum values for peak strength and break strength were observed for experiment number 7 and experiment number 1, respectively, whereas maximum and minimum modulus of toughness/energy absorbed were observed for experiment number 9 and experiment number 1, respectively. Hence the processing conditions mentioned in experiment number 1 can be outrightly rejected. Now based upon the customer requirement for maximum peak/break strength/energy absorption capacity, one can select the set of processing conditions. Based on the observations in Table 3, Figure 6 shows the stress–strain curve for feedstock filaments prepared under different processing conditions. Further to optimize the values of peak strength and break strength, commercially available MINITAB-17 software package has been used, and the effect of input process parameters on the tensile strength has been investigated by analyzing the signal–to-noise (SN) response for “larger is better” type case.
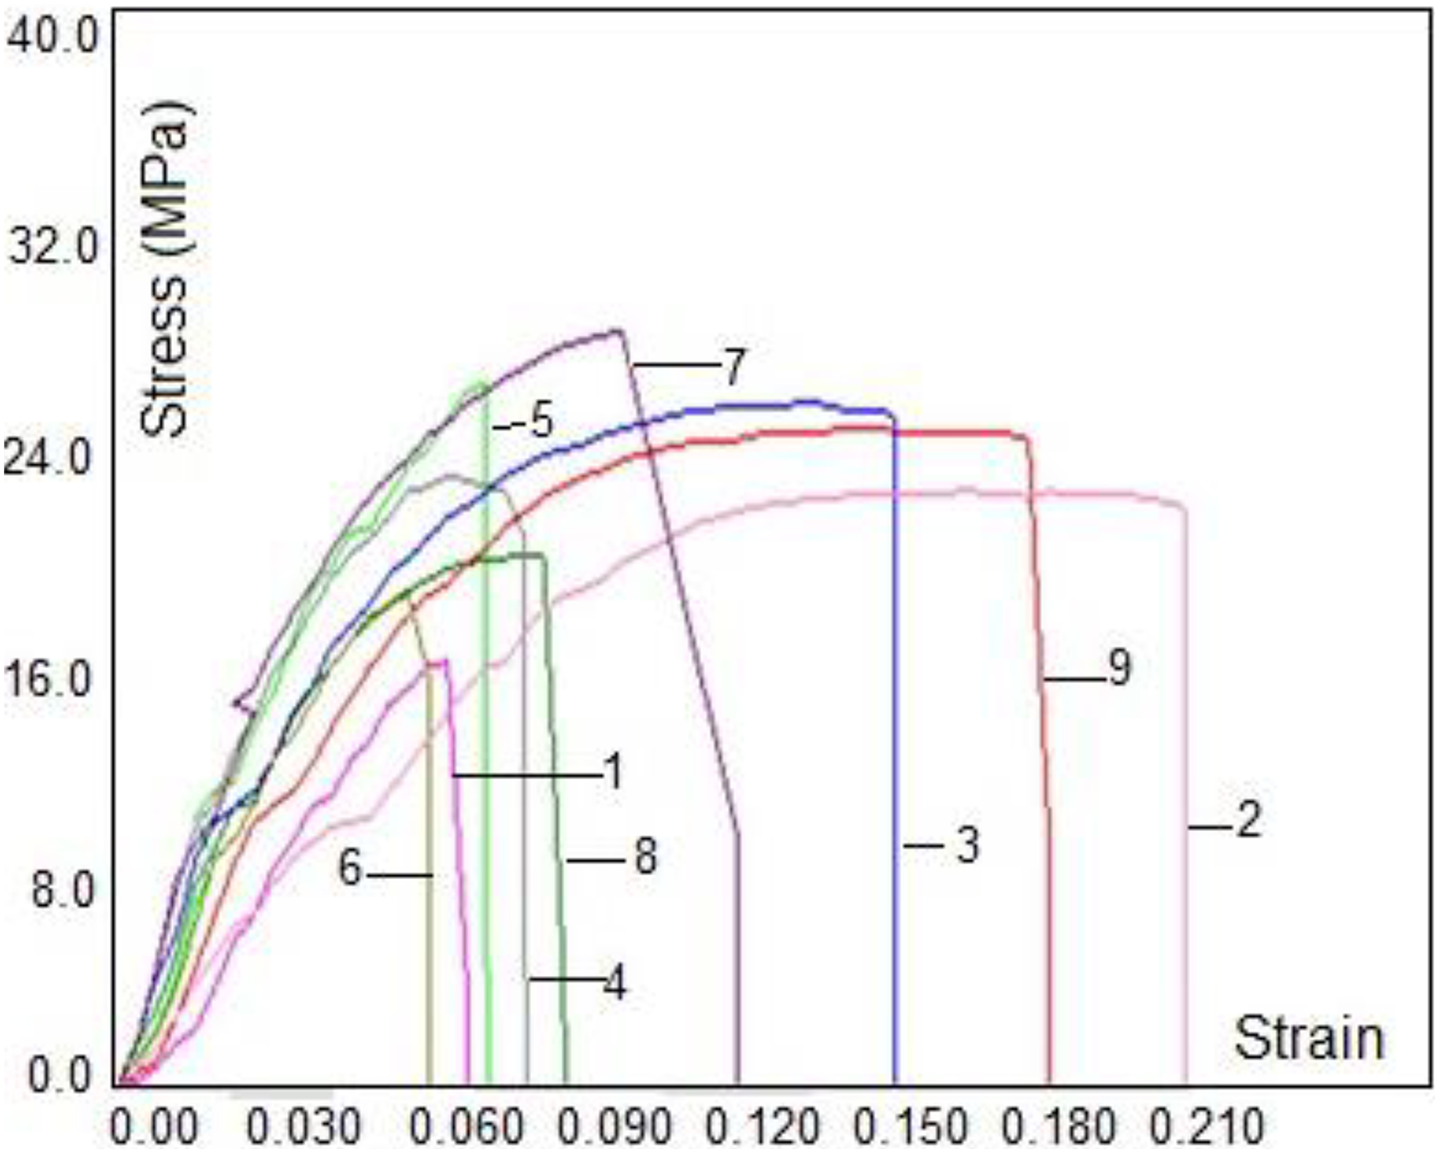
Stress versus strain curves for the prepared feedstock filament.
Peak strength
From Table 3 parameters, Figure 7 shows the SN response for peak strength. The SN graph represents that the given proportion of materials shows remarkable effect when changed from level 1 to level 3. Two parameters of TSE were selected, and from the SN graph it has been found that only one of the two parameters put significant effect on the peak strength of the specimen. As the weight percentage of BTO in the PVDF and Gr was increased from 10 to 20, the peak strength also increases. In case of temperature, when it was raised from 180°C to 200°C, the peak strength also increased, which may be due to uniform mixing of the fillers in the polymer matrix at high temperature. The speed of the screws remains near to the mean value and shows no major effect on the strength at peak of the specimen.
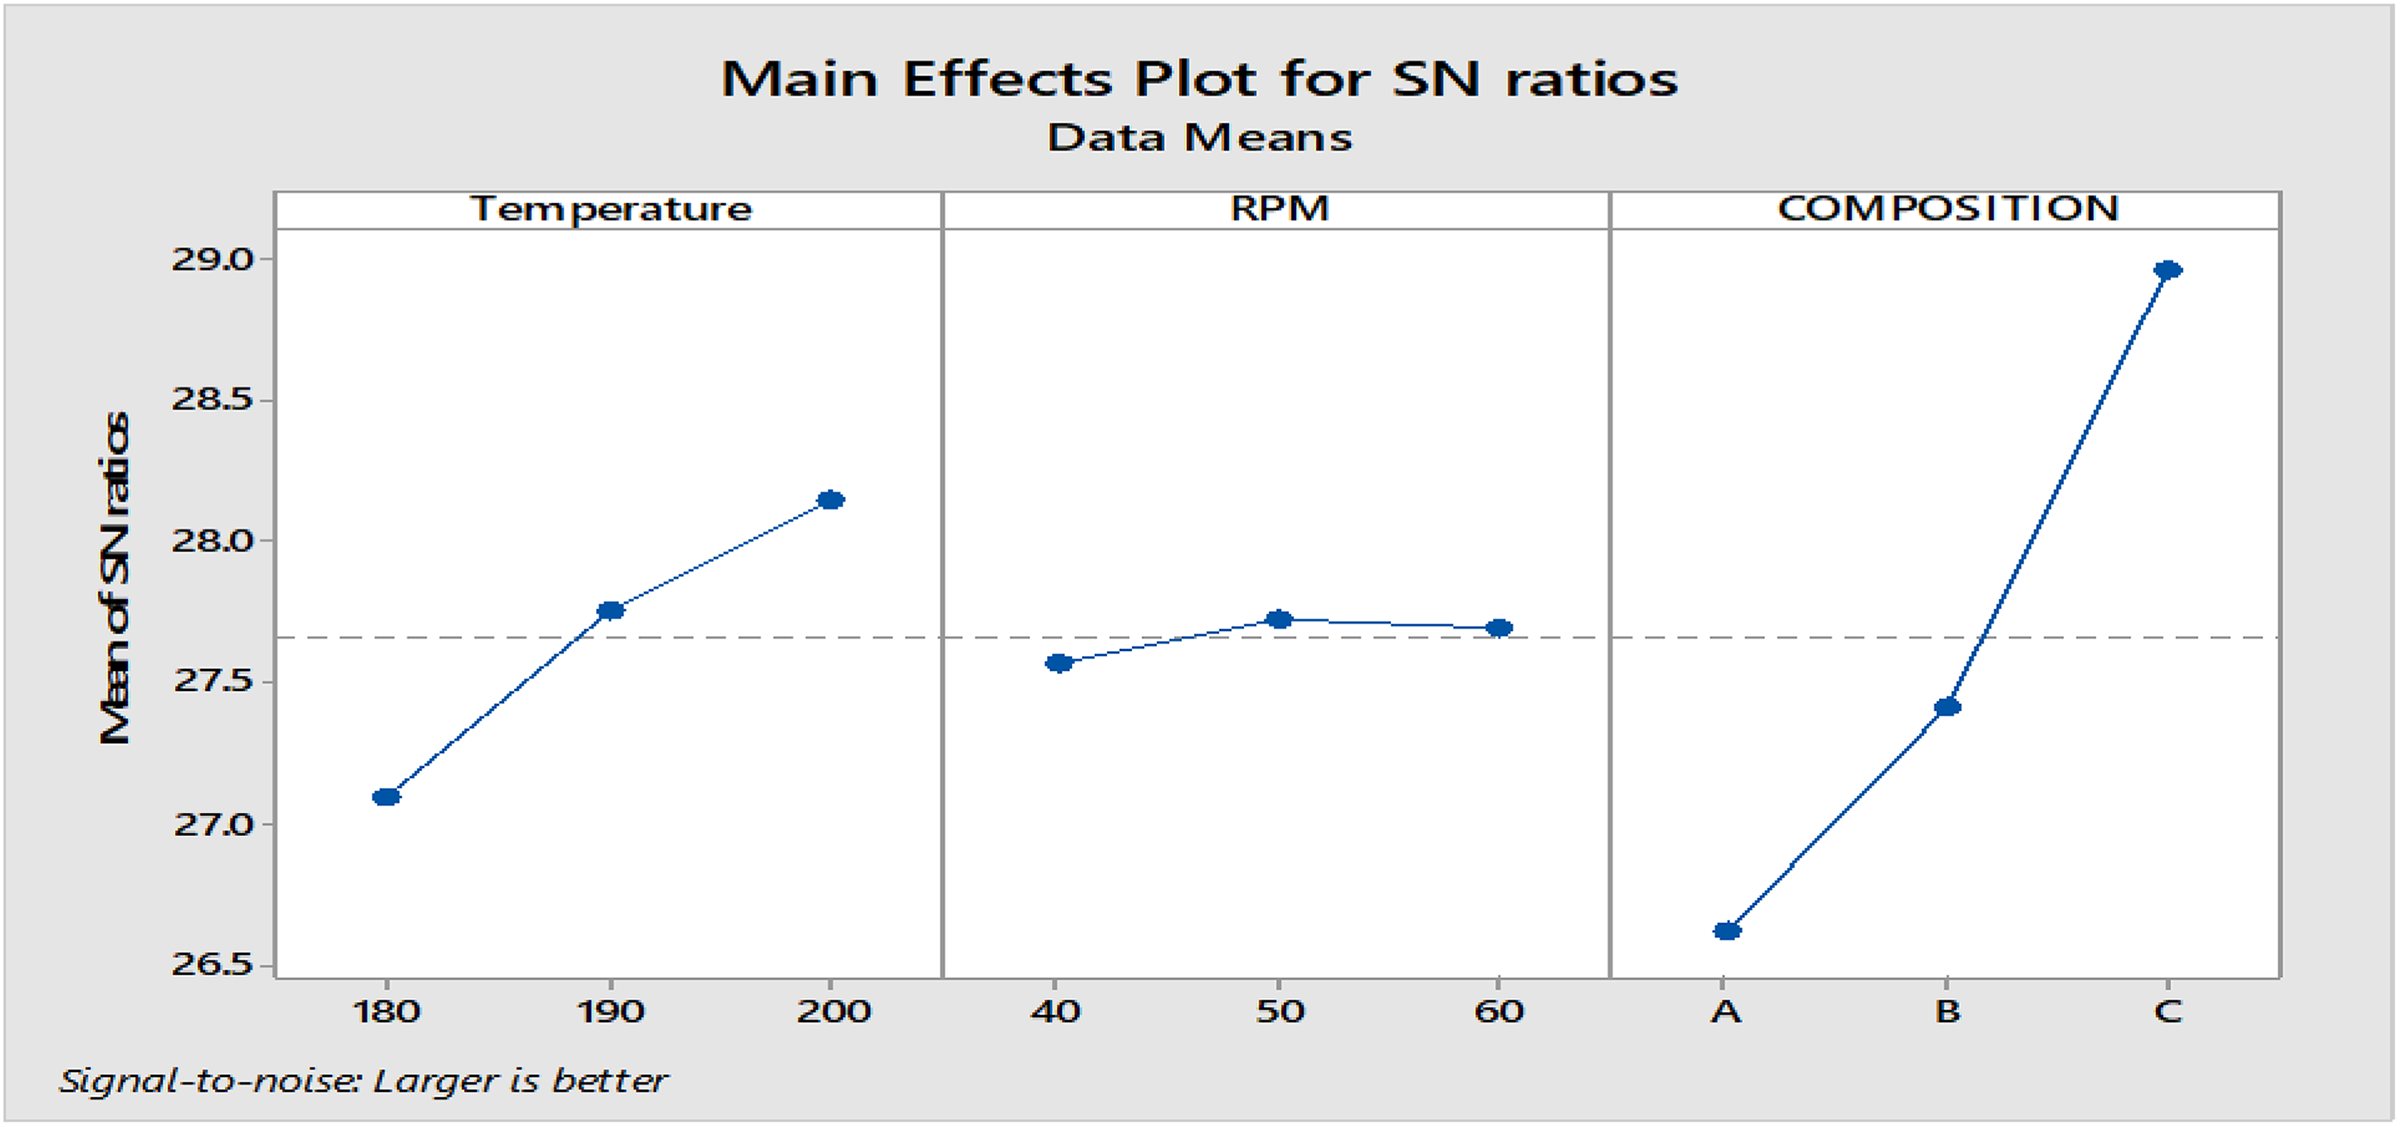
SN responses for peak strength.
The analysis for SN values was carried out at 95% confidence level. The value of Fisher’s value at 95% (F-0.05) is 19 at 5% from the standard table. It means that the parameters having F-value more than 19 is significant, while otherwise insignificant. Analysis of variance (ANOVA) of SN ratios for peak strength (Table 4) shows that two parameters, that is, composition and temperature, are significant at 95% confidence level. Composition has major contribution toward the peak strength, that is, more than 82%, whereas temperature has 16% contribution. The screw speed is found to be insignificant, and the total percentage error was only 0.63%, which represents the higher level of accuracy in this model.
ANOVA for SN ratios (peak strength).
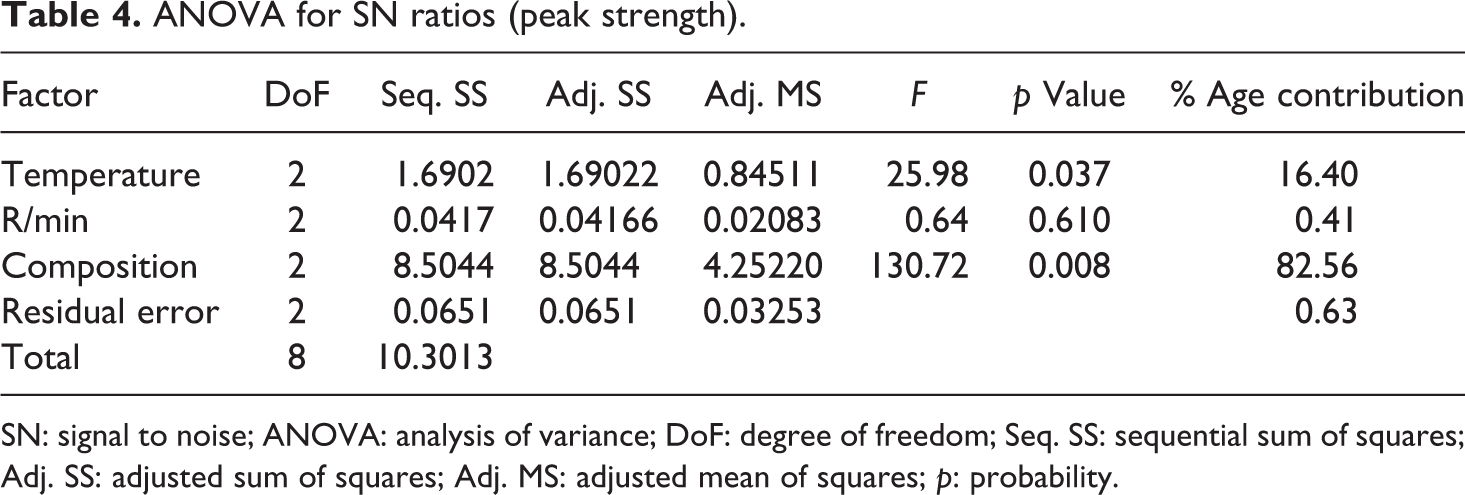
SN: signal to noise; ANOVA: analysis of variance; DoF: degree of freedom; Seq. SS: sequential sum of squares; Adj. SS: adjusted sum of squares; Adj. MS: adjusted mean of squares; p: probability.
Table 5 displays the ranks of input process parameters on the basis of SN ratio for peak strength. The observed results show that composition primarily affects the peak strength of the filament.
Response table for SN ratios at larger the best.
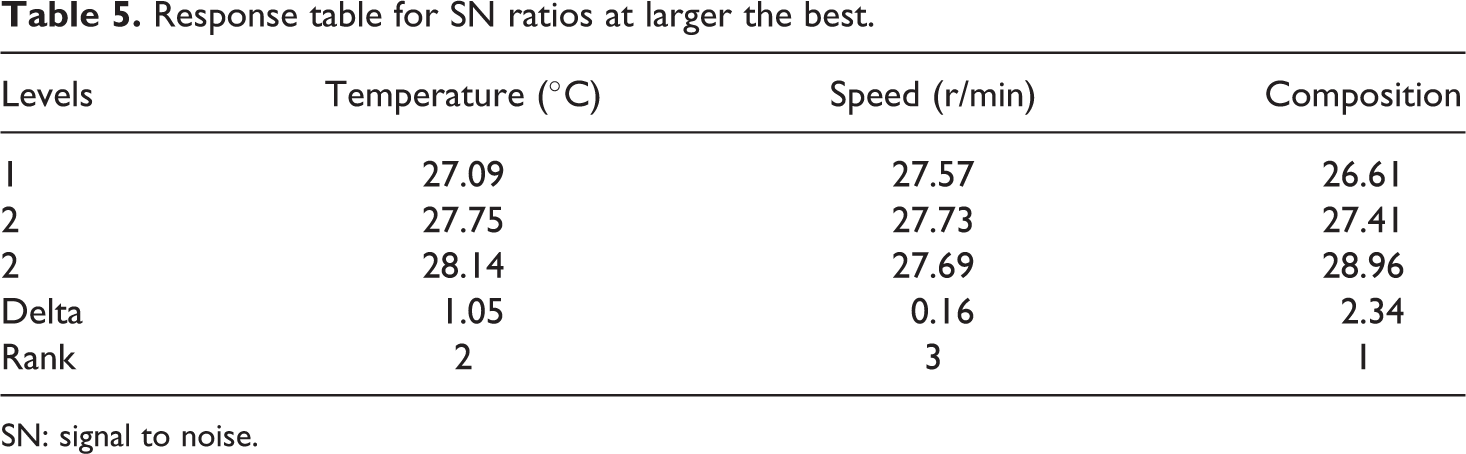
SN: signal to noise.
Prediction of peak strength
To calculate the optimized value, the following equation has been used

where the overall mean value of SN ratios is “m,” MINITAB has been used to obtain the value of “m.” m A3 is the mean of SN values for temperature at level 3 and m B2 and m C3 are mean of SN values for speed and composition at levels 2 and 3, respectively.
Now from Table 5, m A3 = 28.14, m B2 = 27.73, and m C3 = 28.96.

Now
The calculated value for strength at peak is 29.88 MPa. The confirmatory experiment was conducted at best setting suggested (Figure 5), that is, 200°C processing temperature, 50 r/min, and composition/proportion “C” (per Table 2), and the observed value is 29.92 MPa, which is very close to the calculated value.
Break strength
The SN response graph for break strength (based upon Table 3) is shown in Figure 8. The results are similar to the previous case of peak strength.
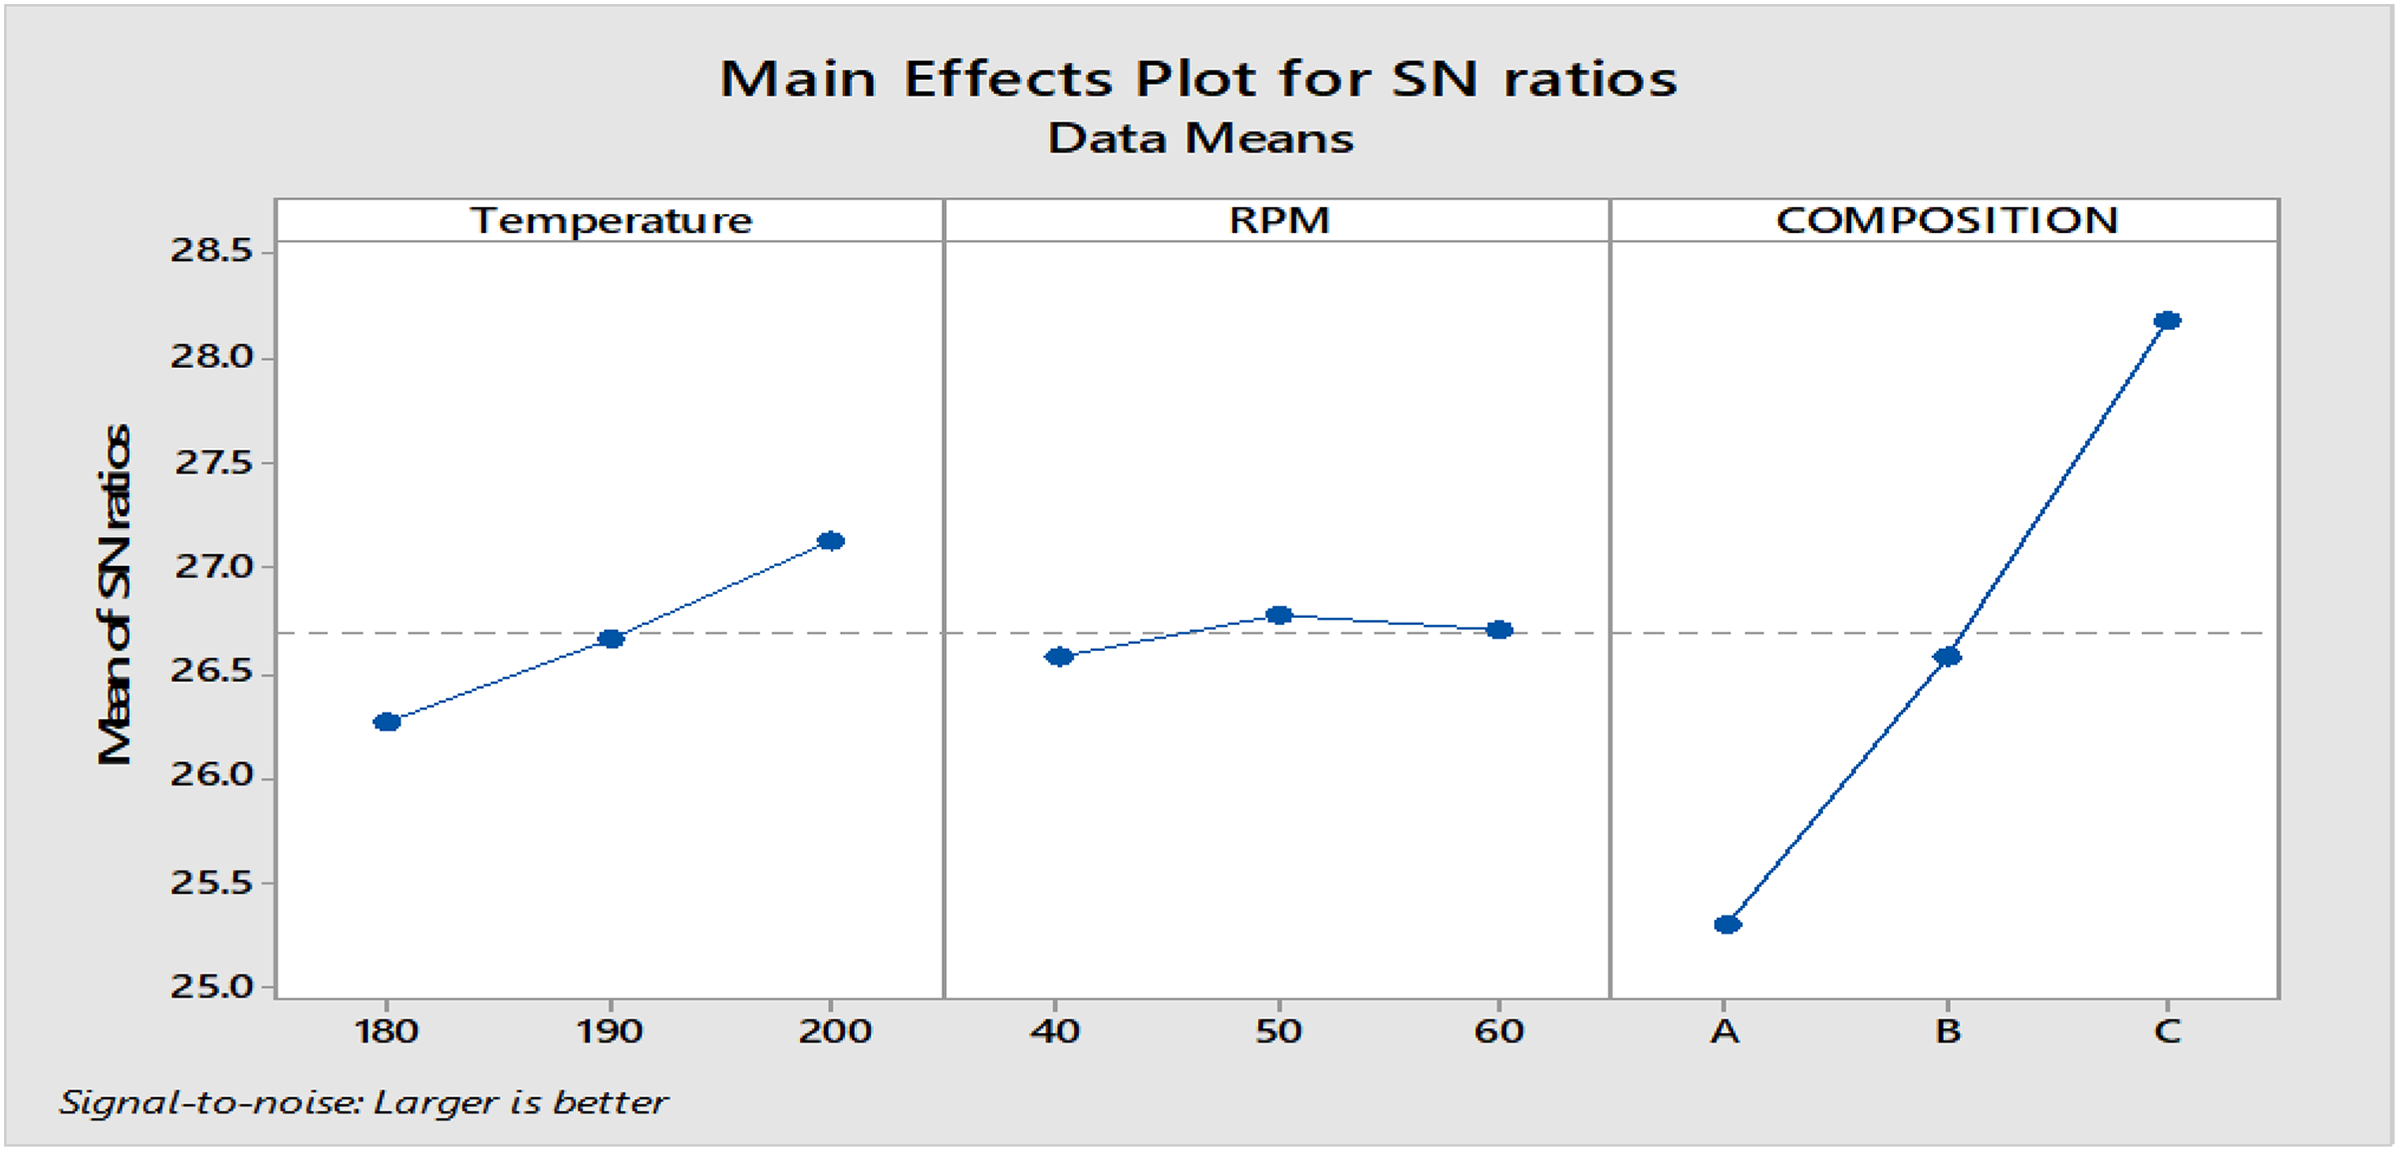
SN responses for break strength.
The ANOVA at 95% confidence level for SN response is presented in Table 6.
ANOVA for SN ratios (break strength.).
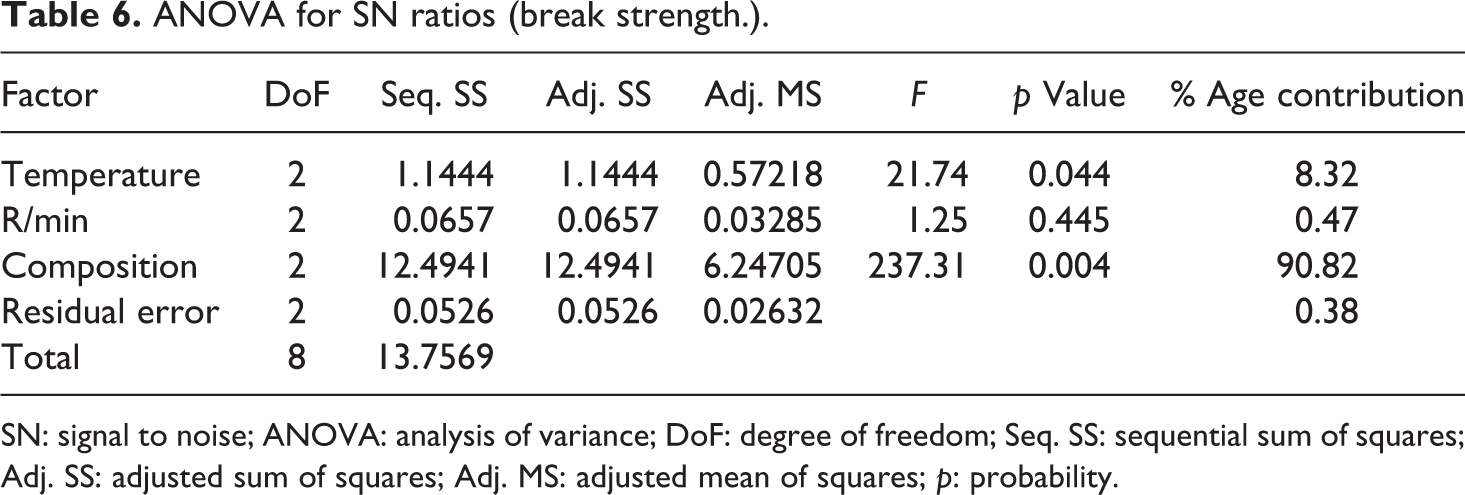
SN: signal to noise; ANOVA: analysis of variance; DoF: degree of freedom; Seq. SS: sequential sum of squares; Adj. SS: adjusted sum of squares; Adj. MS: adjusted mean of squares; p: probability.
Table 7 shows the rank of process parameters per SN ratios of break strength. Table values suggest that composition puts major effect on the break strength with rank 1, whereas temperature stood second followed speed with least effect.
Response table for SN ratios at larger the best.
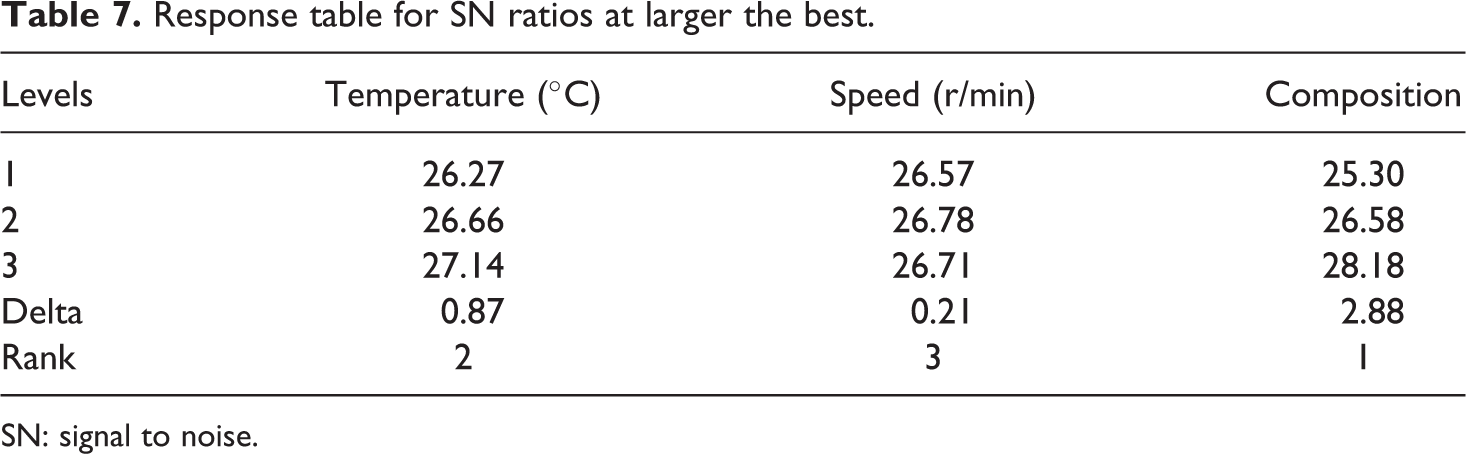
SN: signal to noise.
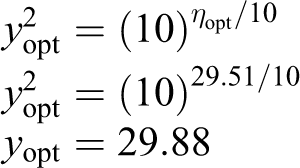
Prediction of break strength
To calculate the optimized value, the following equation has been used

where the overall mean value of SN ratios is “m,” MINITAB has been used to obtain the value of “m.” m A3 is mean of SN values for temperature at level 3 and m B2 and m C3 are mean of SN values for speed and composition at levels 2 and 3, respectively.
Now from Table 7, m A3 = 27.14, m B2 = 26.78, and m C3 = 28.18.

Now
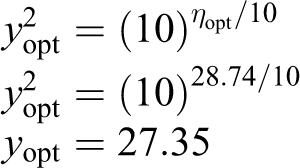
The calculated value for break strength is 27.35 MPa, which is very close to the observed value of 27.42 MPa.
Thermal analysis
Thermal behavior also plays a dominant role in the selection of material for particular applications. After optimization of mechanical strength of the extruded filament wire, it has been observed that the filament extruded per the settings suggested that 200°C processing temperature, 50 r/min, and composition/proportion “C” show best mechanical strength. As PVDF is well-known for its high thermal resistance properties, further investigations are needed to find the effect of reinforcement on the thermal properties of the PVDF.
To establish the thermal properties of the pure PVDF, feedstock filament comprisingPVDF, BTO, and Gr were subjected to differential scanning calorimetry (DSC) analysis. In this research work, a total of three samples were prepared; the first sample was taken from the virgin PVDF, and the second and third samples were taken from the filament possessing the best and worst mechanical strength, respectively. To measure the thermal transition, DSC (METTLER TOLEDO, Switzerland) operated with A STARe (SW 14.00) software has been used.
Figure 9 compares the thermal graphs of all three different samples; curve 1 is of pure PVDF, whereas curve 2 and curve 3 are for filament having best mechanical properties (prepared at 200°C processing temperature, 50 r/min, and composition/proportion “C”) and worst mechanical properties (prepared per settings suggested in Table 2, S. No. 1), respectively. Thermal analyses were performed at two successive heating–cooling cycles, having temperature range of 30–250°C and heating rate was set at 10 K/min. The whole experimentation was performed under controlled nitrogen gas environment. In the first thermal cycle of curve 1 (virgin PVDF), it has been observed that there is a valley that starts at 164°C and ends at 177°C; the melting point of the PVDF is at 174°C. During cooling, the solidification starts at 146°C and ends at 140°C. The same trend has been observed in the second cycle of the treatment and a negligible change in melting of the material has been observed. Therefore, the DSC results for virgin PVDF supports that it is thermally stable. The DSC curves of sample 2 (prepared at 200°C processing temperature, 50 r/min, and composition/proportion “C”), best sample from mechanical properties viewpoint, and sample 3 (poor sample from mechanical properties viewpoint) clearly represent that the melting and solidification temperature of the prepared composite are almost similar to the corresponding temperatures of virgin PVDF. This means that the addition of BTO and Gr does not affect the liquefying and freezing temperature of the PVDF. Thus it has been indicated that even after two repeated cycles, behavior of the material has shown remarkable consistency.
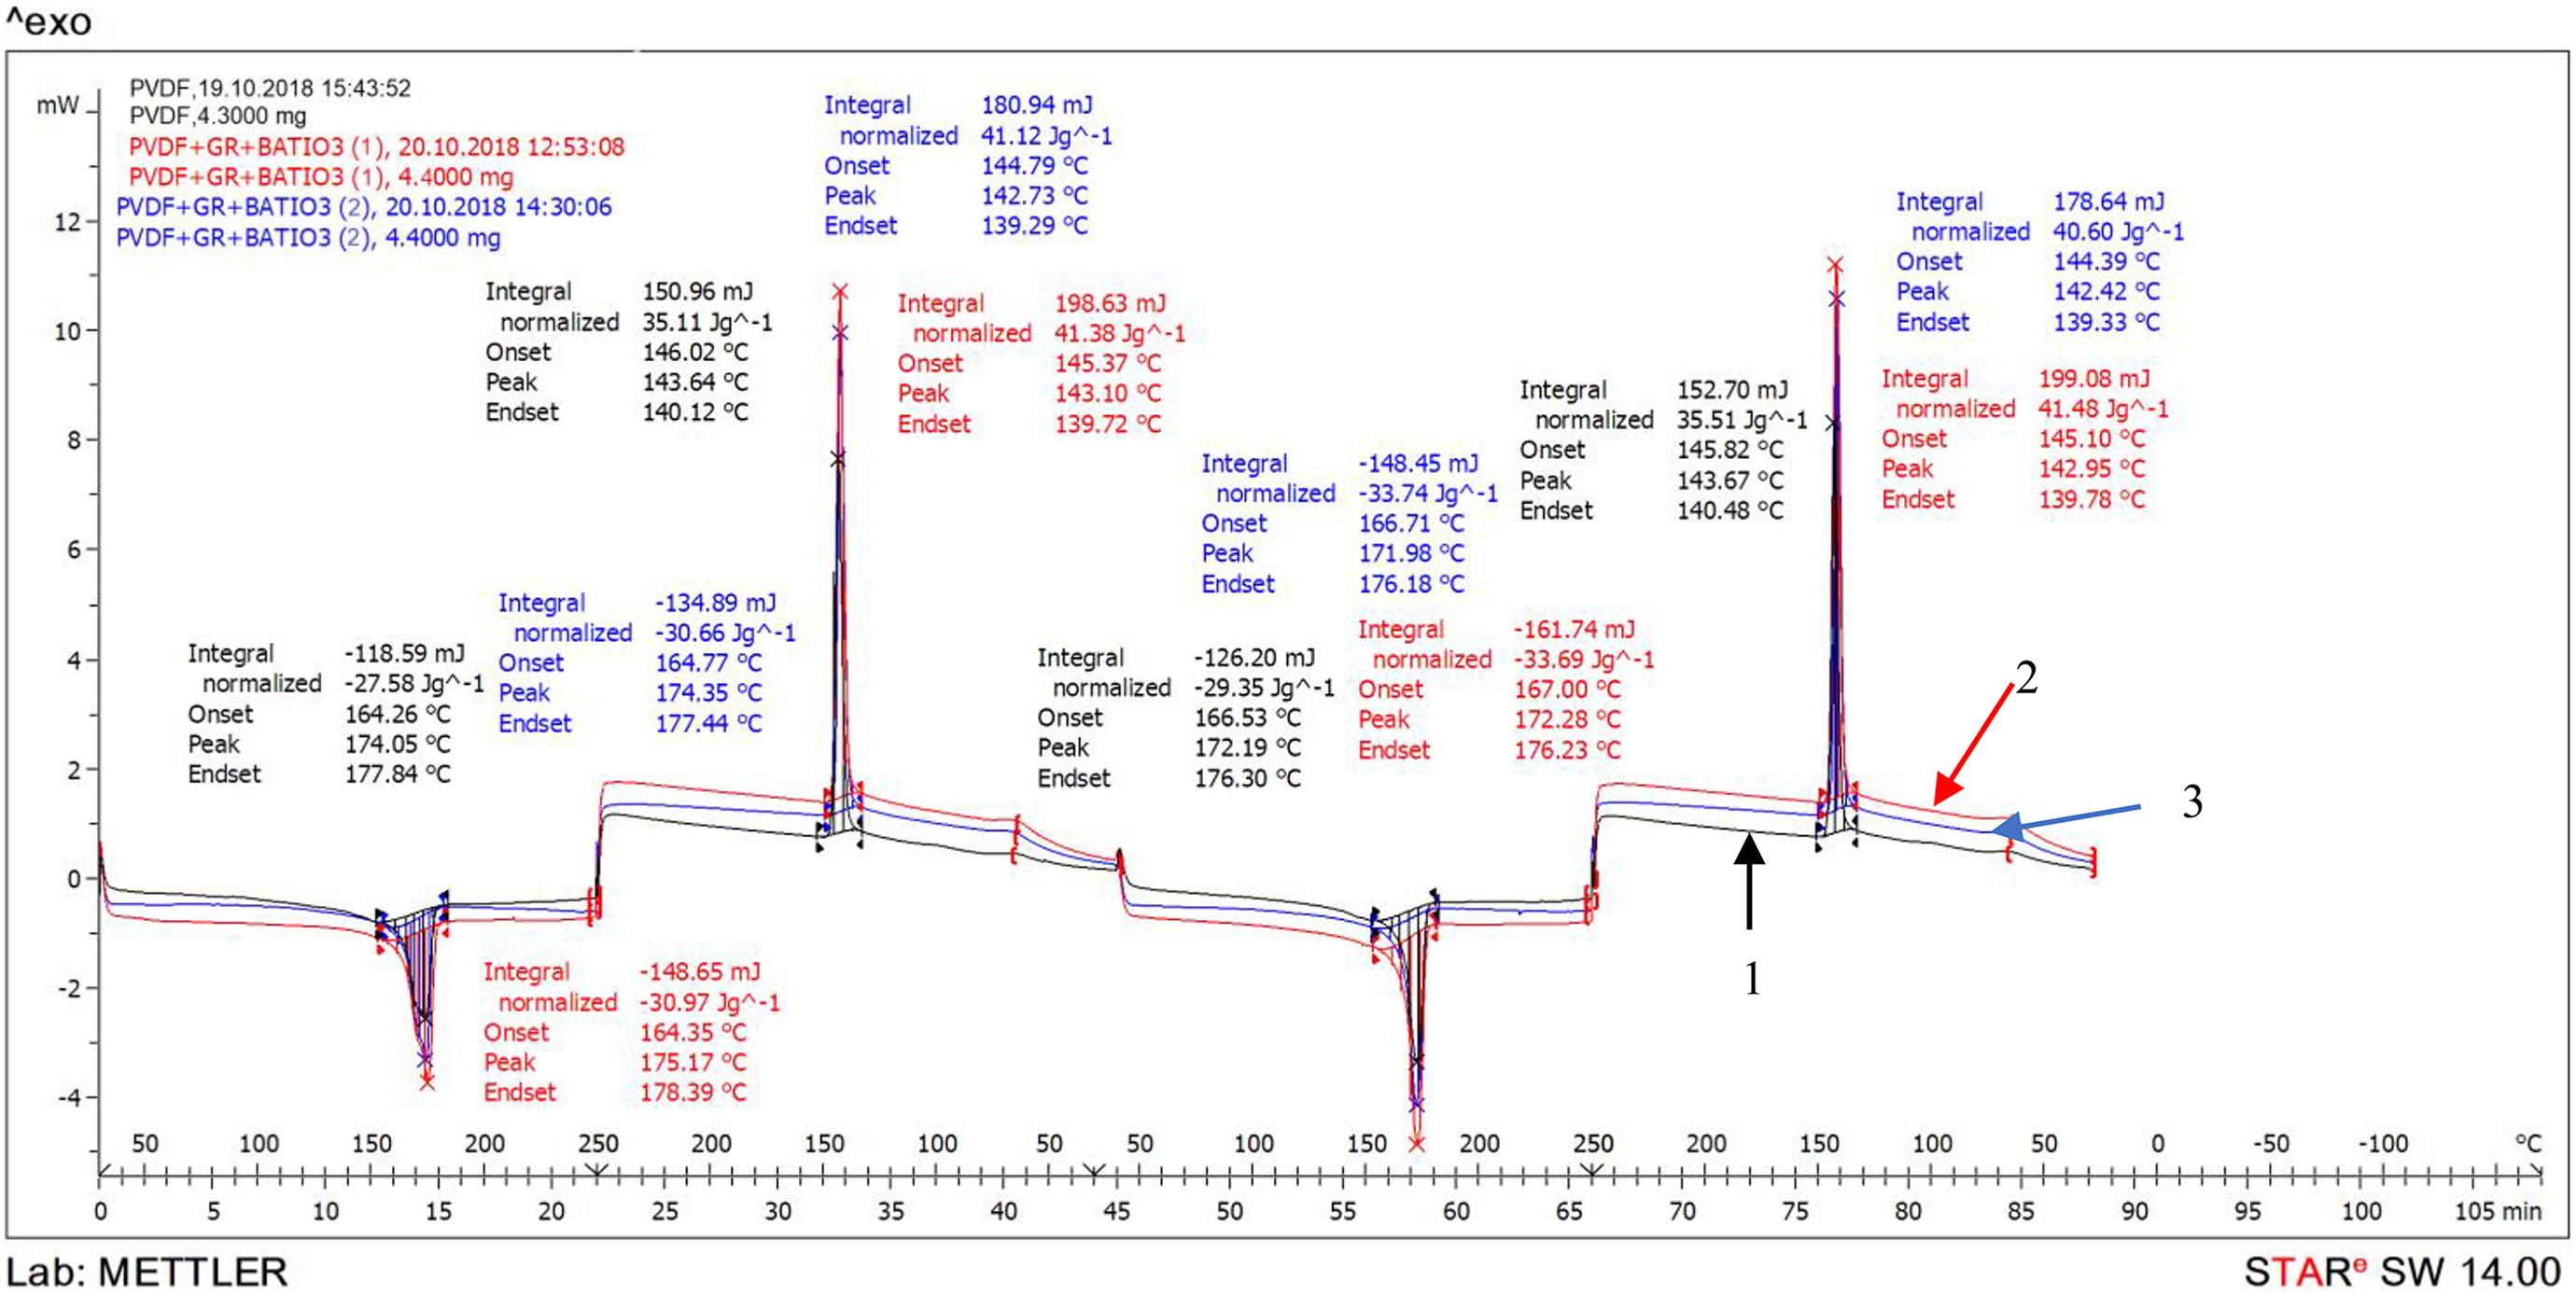
DSC graphs of virgin PVDF and composites developed by reinforcement of BTO and Gr in PVDF at different proportions.
In case of energy absorption rate, in the first thermal cycle, the virgin PVDF absorbed only 27.59 J/g energy, whereas the sample having more proportion of BTO absorbed maximum energy of 30.97 J/g. Moreover, the energy absorption rate in all three samples has been increased in the second thermal cycle. Thus it highlights that the developed composite not only supports the reusability, but in fact it acts as a thermodynamic sink.
Microscopic analysis
After successful investigations of mechanical and thermal properties, the specimen of the in-house developed feedstock filament comprising PVDF, BTO, and Gr, having best and worst mechanical strength, was subject to a microscopic analysis. The microphotographs of the samples were taken on the JEOL JSM-6510LV SEM (Japan) at different magnification levels. As the samples were made up of nonconductive polymer, a coating of gold layer has been made over its surface. SEM images taken at magnification level 50×, 150×, 300×, and 500× are shown in Figure 10 for sample having poor mechanical properties (prepared per settings suggested in Table 2, S. No. 1) and best mechanical properties (prepared at 200°C processing temperature, 50 r/min, and composition/proportion “C”). Micrographs clearly represent that the filament extruded per the settings suggested, that is, 200°C processing temperature, 50 r/min, and composition/proportion “C,” has fine surface finish as compared to the specimen extruded per experiment number 1. It has been observed that the sample extruded at 200°C, 50 r/min, and having 20% BTO shows better dispersion (at different magnification).
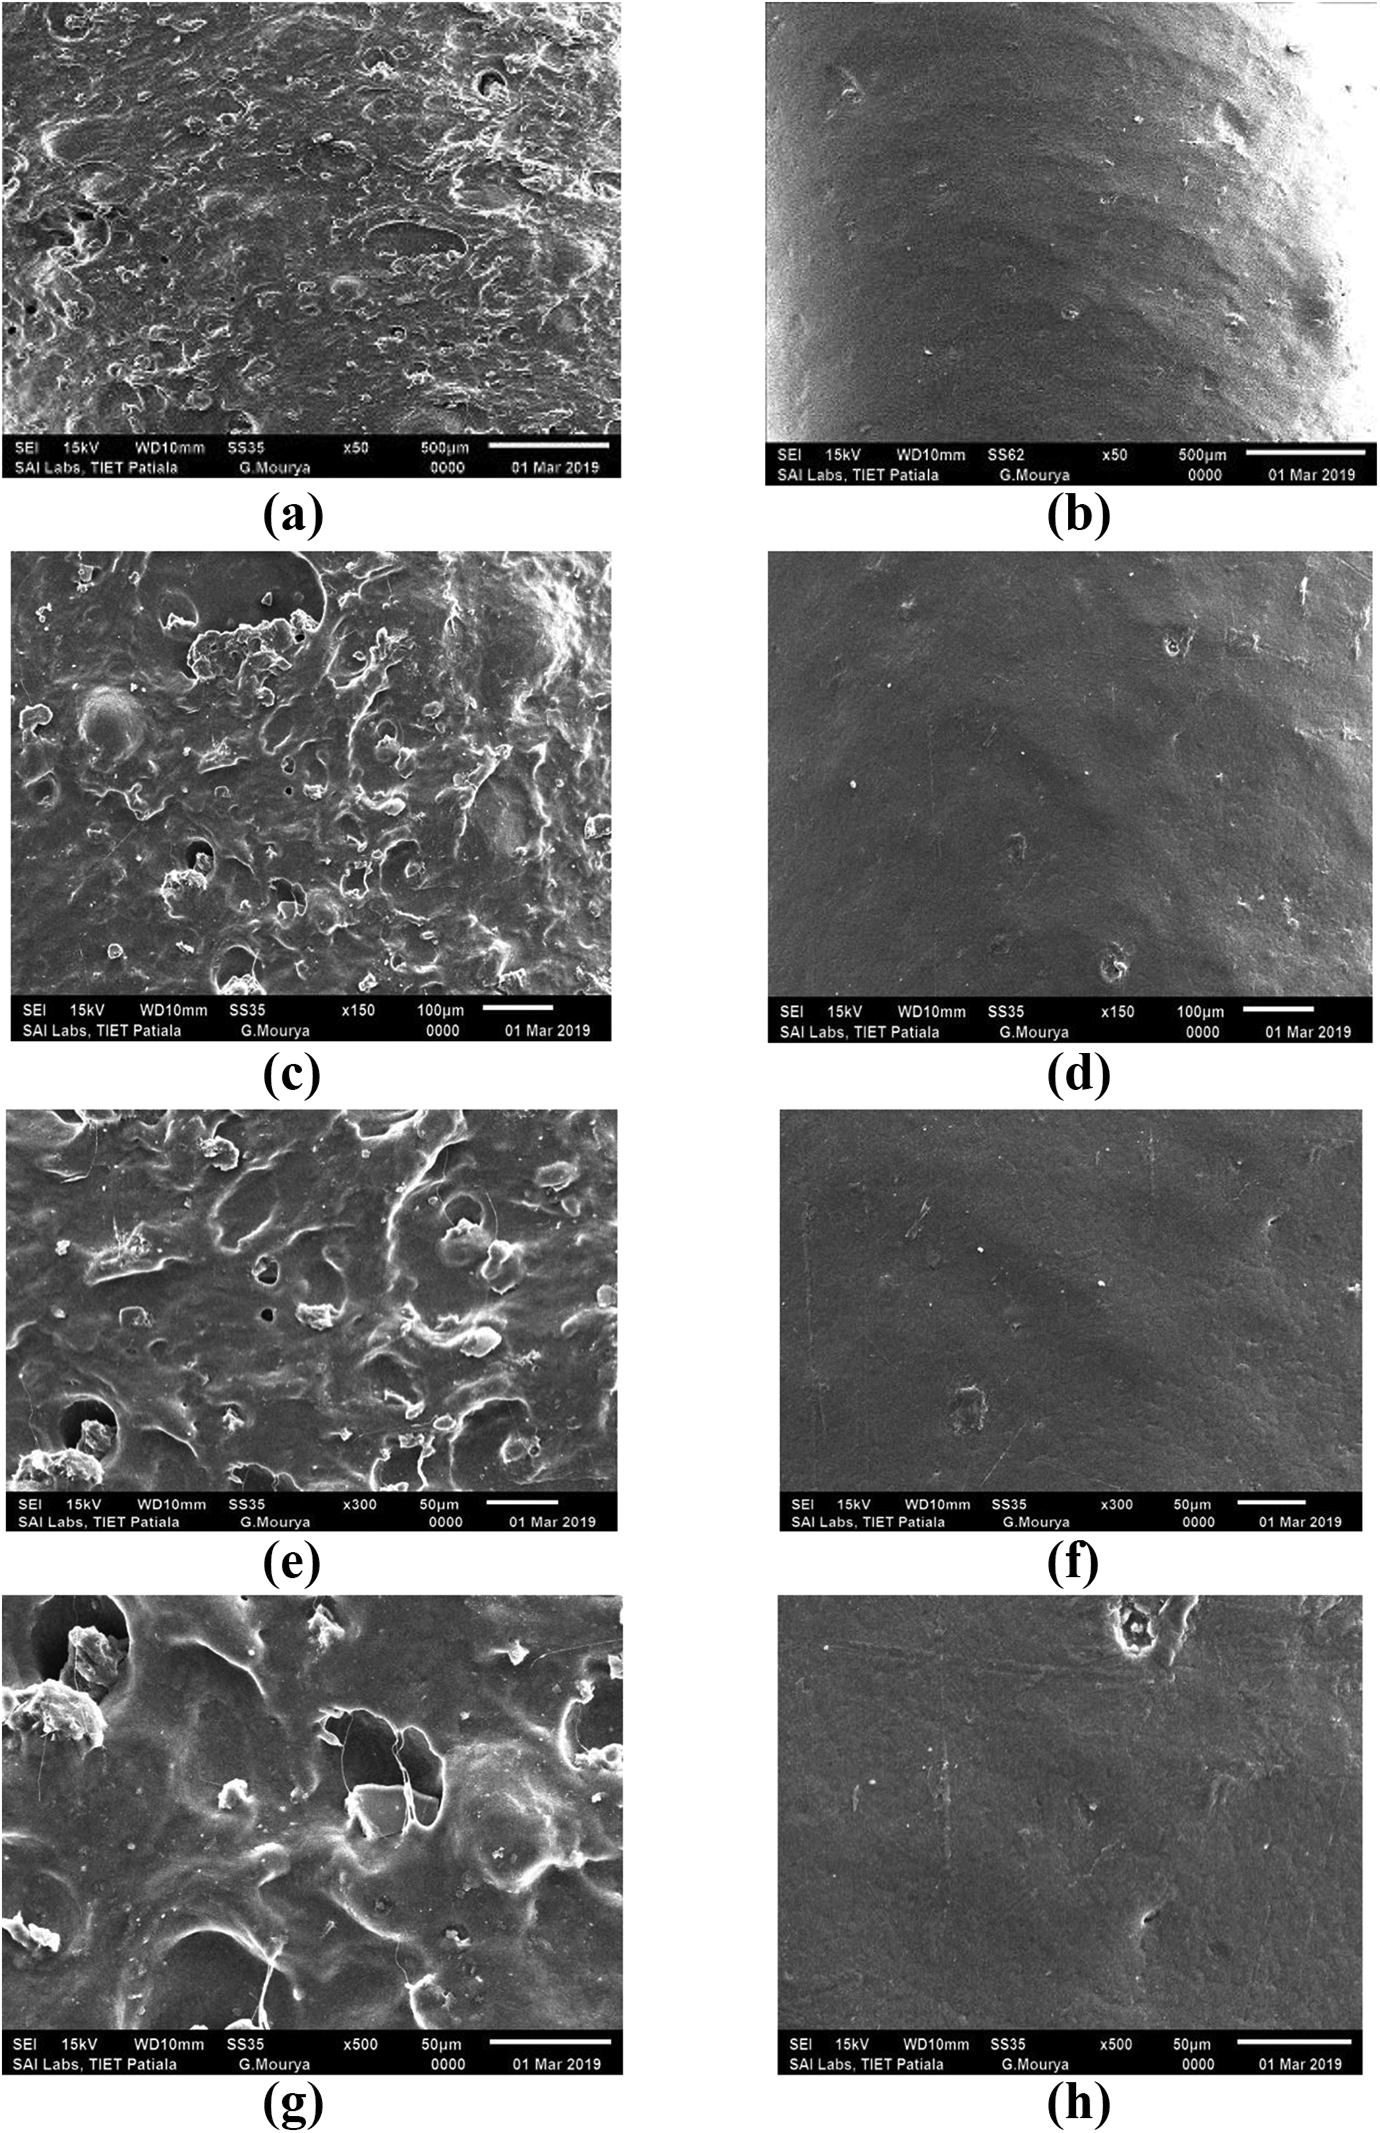
SEM images of sample having poor/best mechanical properties at four different magnification levels: (a and b) at ×50, (c and d) at ×150, (e and f) at ×300, and (g and h) at ×500.
The rendered images of the SEM at 500× magnification have been used to measure the surface roughness (Ra) of the extruded samples (as shown in Figure 11). It has been found that the Ra value of the sample extruded at settings having poor mechanical properties is more than the Ra value of sample extruded at settings having best mechanical properties, which may be because of better dispersion of reinforcements in the PVDF matrix. Figure 12(a) and (b) shows the energy-dispersive X-ray (EDAX) analysis of composite filaments at different proportions of PVDF, BTO, and Gr. The element analysis for the filament having poor mechanical strength shown in Figure 12(a) represents that it contains majority of carbon and fluoride, whereas it contains very less amount of barium, oxygen, and titanium. On the flip side, the element analysis of the filament having best required properties (Figure 12(b)) shows that it has more amount of carbon, barium, titanium, and oxygen as compared to the previous one. Thus it has been clearly indicated by the EDAX analysis that the addition of BTO and Gr is directly responsible for the enhancement of mechanical and thermal properties of the developed composite.
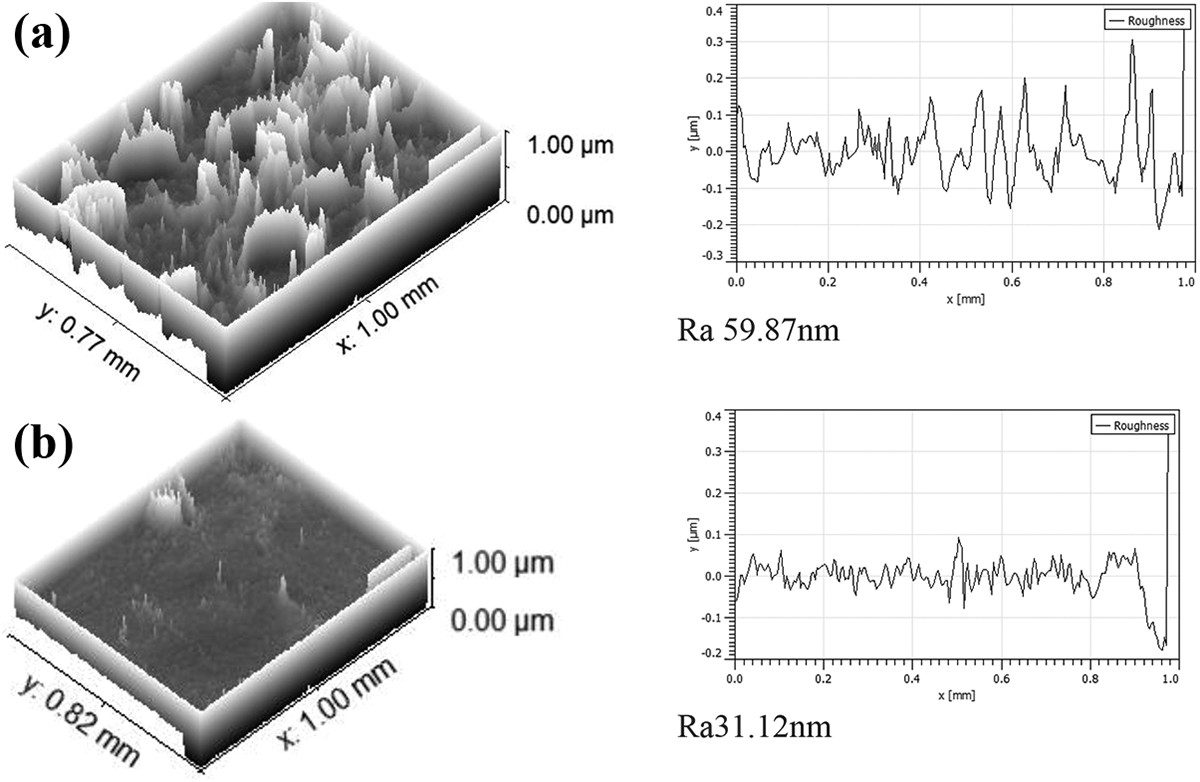
Rendered SEM images of the extruded samples at worst (a) and best (b) parametric settings.
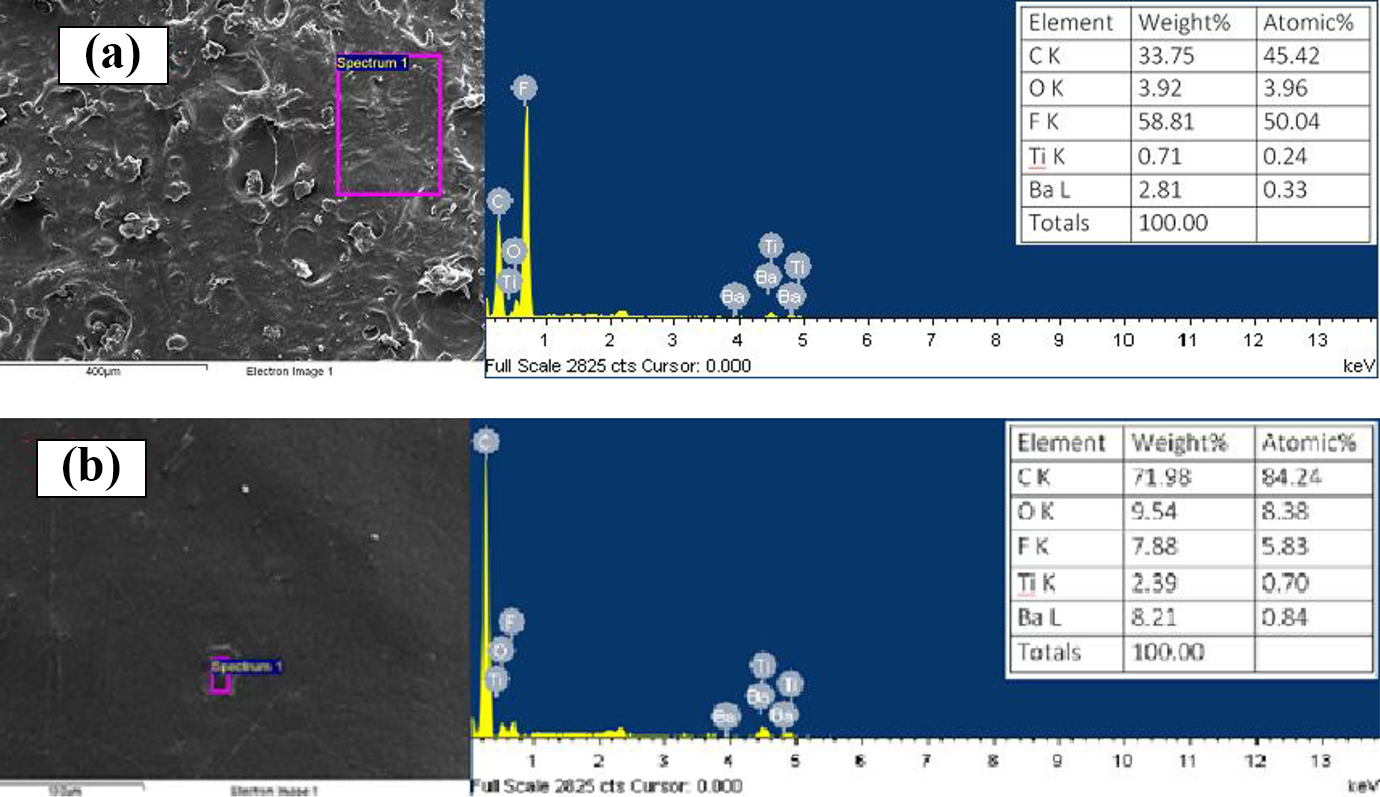
EDAX analysis of sample having worst (a) and best (b) mechanical and thermal properties.
3-D printing
The filament having best mechanical and thermal properties was used to run on an open-source 3-D printer (Divide By Zero, Navi Mumbai, Maharashtra, India) for fabrication of cylindrical disc. The temperature of the extruder head and the bed was kept at 230°C and 80°C, respectively. Initially, a CAD model of the disc has been created in the SolidWorks software. Then this file was saved in .STL format. K-slicer software has been used to slice the .STL files into layers and generate the G-Codes for machine processing. Further, this sliced file has been sent to FDM setup to fabricate a cylindrical disc. Figure 13(a) and (b) shows the 3-D printing process and printed disc, respectively.
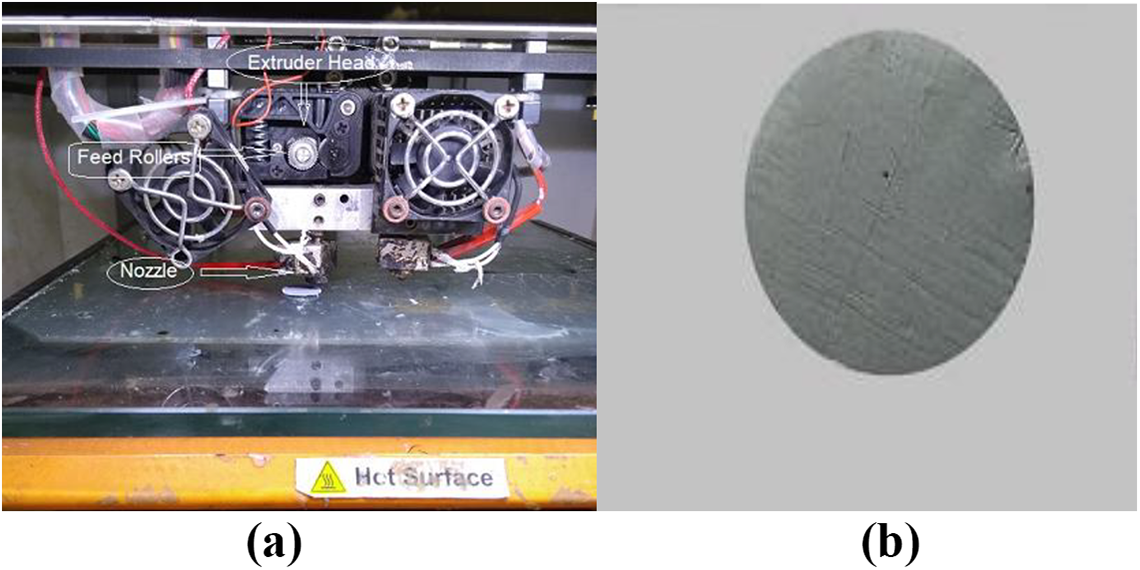
(a) 3-D printing of a cylindrical disc and (b) 3-D printed disc.
Piezoelectric constant measurement
The piezoelectric property of BTO/Gr/PVDF-based 3-D printed films can be characterized by measuring the piezoelectric constant (d33) using a two-probe method. A d33 meter (Model YE2730A D33, Marine India, Delhi, India) has been used with high degree of resolution, that is, 0.1 pC/N. This meter is capable of directly measuring the piezoelectric constant of piezoelectric crystals, ceramics, and polymers. Although any type of sample can be easily used to measure piezoelectric constant, the disc type sample is more preferable. In this study, 3-D printed cylindrical disc having a diameter of 10 mm and a thickness of 0.4 mm was used for testing. To make the 3-D printed specimen a good conductor of electricity, a layer of conductive silver paint has been coated on both sides of the cylindrical disc. The prepared disc has been placed under the probes, and then knob has been rotated until it tightens the disc properly. After that, switch on the meter that displays the digital value of d33 in pC/N. The piezoelectric constant (d33) value of the cylindrical disc is 20 pC/N, which is close to the solvent-casted film of PVDF + BTO. Figure 14 shows the d33 meter that is used to measure piezoelectric constant and silver-coated 3-D printed disc.
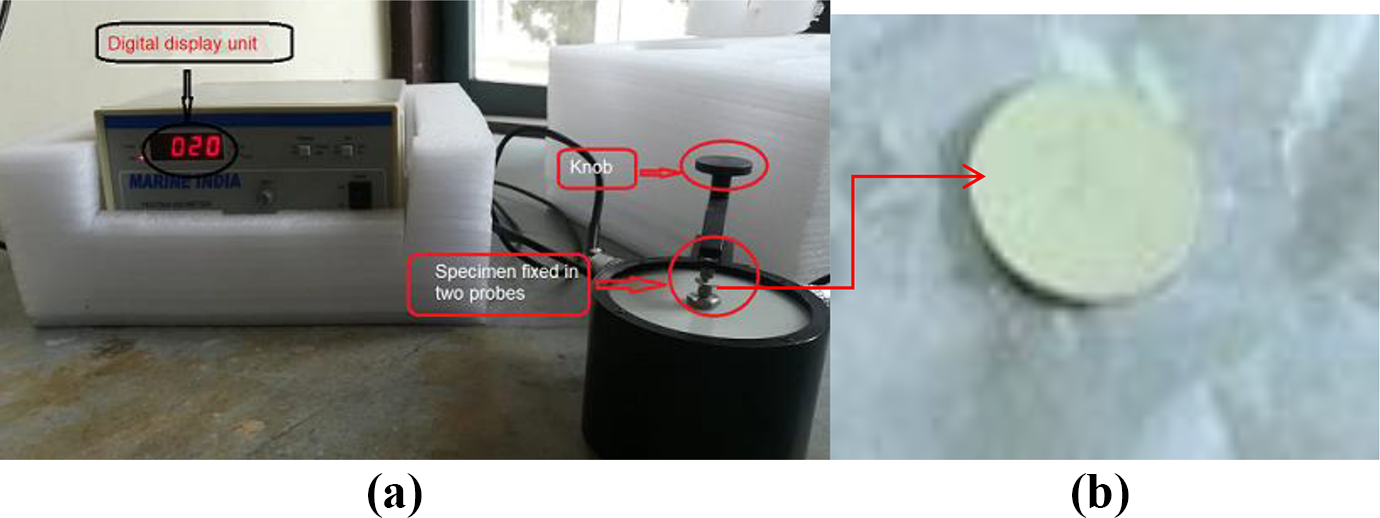
(a) D33 meter used to measure piezoelectric constant value and (b) silver-coated disc.
It has been reported that with the help of poling unit, α phase of PVDF can be converted into β phase, and with higher temperature processing, β phase of PVDF can be transformed to α phase. 35 Hence the proposed PVDF matrix can be used for 4-D applications in which the applied stimulus is temperature/high voltage electric field.
Conclusions
In this research work, PVDF, BTO, and Gr-based composite has been developed for the fabrication of feedstock filament for 4-D printing applications. Following are the outcomes of the present study on the basis of experimental results. From the MFI testing, it has been found that the composite material flows continuously only when BTO is added from 10% to 20% by weight in the PVDF matrix, whereas the proportion of Gr was fixed at 2% by weight of PVDF. The results of ANOVA outlines that composition has maximum contribution (90% and 82%), followed by extruder temperature (16% and 8%) toward the break strength and peak strength, respectively, whereas screw speed has been found insignificant. The feedstock filament having composition PVDF (78%) + Gr (2%) + BTO (20%) and extruded at temperature 200°C at 50 r/min has shown maximum peak strength and break strength, that is 29.92 MPa and 27.42 MPa, respectively. The graphs obtained from thermal analysis illustrated that the composite mixture has shown same consistency over two thermal cycles. The addition of Gr and BTO has no effect on the processing conditions of the PVDF matrix. The developed wire at the aforementioned parametric settings can be easily used without any hardware change. Based upon the micrographs obtained from the SEM analysis, it can be concluded that the filament having best mechanical properties and extruded per suggested settings (composition PVDF (78%) + Gr (2%) + BTO (20%) and extruded at temperature 200°C, at 50 r/min) has high surface finish with uniform mixing of fillers in the polymer matrix. Piezoelectric constant (d33) of 3-D printed specimen has been found to be 20 pC/N, which clearly supports that the developed material may be used for sensor with 4-D capabilities.
As the process relies on improving the inherent piezoelectric properties of the polymer, printing factors such as temperature, print directions, speed, and layer thickness may have a strong effect on the 4-D properties of the printed parts. Thus, further efforts are required to optimize these process parameters.
Footnotes
Acknowledgements
The authors are thankful to Manufacturing Research Lab, Department of Production Engineering, Guru Nanak Dev Engineering College, Ludhiana, Punjab, India, and Thapar Institute of Engineering and Technology, Patiala, Punjab, India, for technical and financial support.
Funding
The author(s) disclosed receipt of the following financial support for the research, authorship and/or publication of this article: The authors received financial support from Manufacturing Research Lab, Department of Production Engineering, Guru Nanak Dev Engineering College, Ludhiana, Punjab, India, and Thapar Institute of Engineering and Technology, Patiala, Punjab, India.