
Abstract
The polyvinylidene difluoride + barium titanate (BaTiO3) +graphene composite (PBGC) is one of the widely explored thermoplastic matrix due to its 4D capabilities. The number of studies has been reported on the process parameters of twin-screw extruder (TSE) setup (as mechanical blending technique) for the development of PBGC in 3D printing applications. But, hitherto, little has been reported on chemical-assisted mechanical blending (CAMB) as solution mixing and melt mixing technique combination for preparation of PBGC. In this work, for preparation of PBGC feedstock filaments, CAMB has been used. Also, the effect of process parameters of TSE on the mechanical, dimensional, morphological, and thermal properties of prepared filament of PBGC have been explored followed by 3D printing. Further, a comparative study has been reported for the properties of prepared filaments with mechanically blended composites. Similarly, the mechanical properties of 3D printed parts of chemically and mechanically blended composites have been compared. The results of tensile testing for CAMB of PBGC show that the filament prepared with 15% BaTiO3 is having maximum peak strength 43.00 MPa and break strength 38.73 MPa. The optical microphotographs of the extruded filaments revealed that the samples prepared at 180°C extruder temperature and 60 r/min screw speed have minimum porosity, as compared to filaments prepared at high extruder temperature. Further, the results of the comparative study revealed that the filaments of CAMB composites show better mechanical properties as compared to the filaments of mechanically mixed composites. However, the dimensional properties were almost similar in both cases. It was also found that the CAMB composites have better properties at low processing temperature, whereas mechanically blended composites show better results at a higher temperature. While comparing 3D printed parts, tensile strength of specimens fabricated from CAMB was more than the mechanically blended PBGC.
Keywords
Introduction
Additive manufacturing (AM)/3D printing is based on the principle of layer manufacturing.1–3 The 3D printing started with the creation of a 3D model on a computer using computer-aided design software. This 3D model is saved in standard tessellation language file format, which is further sliced in the layers by slicing software.4–6 It has been widely reported that AM has numerous applications in the field of biomedical engineering, aeronautics, automotive industries, food technology, dentistry, jewelry electronics, robotics, and pharmaceuticals.7–10 Some studies reveal that as compared to traditional manufacturing techniques, 3D printing produces complex shapes very easily. The generation of complex structures with multimaterials helps to enhance the application domain of 3D printing. 11
Commercially smart materials like shape memory material, electroactive polymer material (EAP) has become an interest at global level for various applications in the field of textiles, nanotechnology, biomedical and electronic sensors.12–16 Shape memory alloys (SMA), shape memory polymers (SMP), and EAP are from the family of smart materials. The shape memory effect of SMA and SMP shows the unique capability of smart materials to remain in the desired shape and retains their original shape when triggered by external stimuli from environment. 17 This functional property of SMA and SMP enhances their role in the field of AM, such as automatic assembly and disassembly (where the fasteners made up of such materials can perform auto disassembly under the effect of external stimuli). 18 On the basis of active disassembly, a comparative study was performed on the SMP and SMP composites using finite-element analysis. The results of simulation conducted by considering mechanical and thermal testing show that SMP composite gave a better performance than the SMP. 19 The high amount of flexibility, light in weight, low cost of processing, and ease of deformation makes these polymers highly useful for various innovative applications, such as smart devices in the sector of microelectronics, robotics, and biotechnology.20,21
These cross-functional smart material-based devices show significant variations in a controllable manner when triggered artificially or environmentally. Similarly, piezoelectric materials produce a voltage when comes under the effect of some mechanical stress known as direct piezoelectric effect (DPE), whereas the reverse of this process is known as converse piezoelectric effect (CPE). 22 The DPE plays a vital role in the pressure sensors, vibrational energy scavenging, structural health monitoring, and energy harvesting. 23 On the flip side, CPE is used in shape control, actuation, and ultrasonic motors. The piezoelectric devices-based energy harvesting techniques open the doors to develop autonomous and self-actuated electronic devices. 24 Piezoelectric ceramics and quartz have been extensively used in electronic applications from a long time. The zinc oxide (ZnO) and lead zirconate titanate (PZT) are majorly used piezoelectric materials in electromechanical systems and transducers.25,26 Among the above said piezoelectric materials, PZT attained much attention for its high value of piezoelectric coefficient. Nevertheless, the brittleness and toxicity become a constraint in application domain of PZT. 27 Thus, to minimize their impact on environment and health, researchers made intensive efforts to develop lead-free piezoelectric materials. 28 But the problem faced was to control the composition of the layer precisely. Some researchers have developed nanowires of ZnO to generate a sufficient amount of power to lighten a light-emitting diode. However, the length of these nanowires was up to few micrometers only which restricts their energy generation capacity. 29 From the past two decades, the researchers are trying to employ piezoelectric polymers as sensors, actuators, and many more applications in the field of electronics and biomedical engineering. The major advantages of using piezoelectric polymers are their thermal, mechanical, electrical, chemical, and surface properties that can be easily tailored by applying different processing conditions.30,31 Moreover, polymer-based piezoelectric materials offer nontoxic, nonbrittle, lower stiffness, and high tensile strength, which could be another possible approach for energy harvesting. 32 The piezoelectric property of polyvinylidene difluoride (PVDF) was found in 1969, which opened the possibility for the creation of relatively a new class of elastic polymers with low dielectric constant. 33 The piezoelectric properties of the EAP receive an acute interest from the industrial research to produce low-cost energy harvesting devices. But low actuation and low power generation capacity of EAP restrict their applications. Therefore, to get better results, ceramic fillers, such as lead titanate, barium titanate (BaTiO3), and PZT, have been reinforced in the PVDF polymer matrix. 34 However, the addition of ceramics put worse effects on the flexibility of the base polymer matrix. 35 Some researchers worked on the addition of carbon powders (carbon nanotubes (CNT) and graphene (Gr)) in the polymer matrix to improve the mechanical and electrical properties with relatively low filler to base material ratio.36,37 Few studies have been reported on the use of PVDF-based composite reinforced with CNT and BaTiO3 for 3D printing via fused deposition modeling (FDM). It has been observed that 1% of CNT and 12% BaTiO3 as filler provide better mechanical toughness in the 3D printed parts. 38 Thus, the use of FDM with the smart polymer-based composites for possible 4D applications is one of the acceptable solutions. FDM is one of the low-cost 3D printing processes in which a thermoplastic filament is extruded and deposited in semimolten form to print a 3D object. In FDM, size, strength, and other properties of the filament play a prominent role in successful printing of 3D parts. 39 After three decades of its invention, it is still one of the highly acceptable AM processes and continuous studies are being reported on the development of different polymers-based FDM feedstock filaments (by reinforcement of metallic and ceramic powders). 40 The addition of fillers in the polymer matrix plays a prominent role to improve the properties of the base material. Earlier, a single screw extruder was used for the fabrication of feedstock filament, but it does not provide proper mixing of fillers in the base material. 41 Thus, researchers started working on twin-screw extruder (TSE) for blending and extrusion process. TSE is mainly known for providing a high degree of dispersion of fillers in the polymer matrix. In one of the reported studies, TSE was used for the development of filament acrylonitrile butadiene styrene reinforced with 10% ferrous particles to improve its mechanical properties. 42 In one of similar research works, ferrous particles were reinforced in the nylon matrix with the TSE for the development of filament. 43 It has been reported that the process parameters, such as temperature and screw speed, affect the properties of extruded filaments.44–47
In the past one decade, significant work has been reported on preparation of smart/electroactive polymer matrix (EAPM)-based feedstock filament with mechanical extrusion process for FDM setup followed by its 3D printing. The PVDF + BaTiO3 + Gr composite (PBGC) is one of the widely explored thermoplastic matrixes due to its 4D capabilities. The reported literature reveals that some researchers have optimized the process parameters of TSE setup (as conventional mechanical blending technique) for the development of filaments by blending/compounding of BaTiO3 and Gr in the PVDF matrix for FDM applications. But, hitherto, little has been reported on CAMB of PBGC. In this research work, for the preparation of feedstock filaments, EAPM comprising of PBGC has been developed by CAMB. The study has been performed in two stages. Initially, the effect of process parameters of TSE on the mechanical, dimensional, morphological, and thermal properties of the prepared filament of PBGC has been explored. The filament with better mechanical and thermal properties has been used on the FDM setup for 3D printing of standard tensile specimens. The process parameters of FDM for mechanical properties of 3D printed parts have been optimized in the second stage. Further, a comparative study has been reported for the properties of these prepared filaments with feedstock filaments developed from mechanically mixed composites. Similarly, the mechanical properties of 3D printed parts of chemically and mechanically blended composites have been compared.
Experimentation
The polymer composites have been prepared by chemical mixing of the materials. Thin films of composites in different proportions have been prepared by mixing the BaTiO3 and Gr in the PVDF matrix in the presence of N-N-dimethylformamide (DMF) and dimethyl sulfoxide (DMSO) solvent. The developed composite has been processed and extruded in the form of filament on TSE. Further, to study and optimize the process parameters of TSE for mechanical, dimensional, thermal, and morphological properties of the filament, Taguchi approach has been used. The developed filament was used to run on open-source FDM to print the standard tensile specimens. Further process parameters of FDM for mechanical properties of 3D printed parts have been optimized. Finally, a study was conducted to compare the properties of these prepared filaments with the properties of feedstock filaments developed from mechanically mixed composites as an extension of previous studies.23,30 Similarly, the mechanical properties of 3D printed parts of chemically and mechanically blended composites have been also compared.
PVDF is semicrystalline in nature and developed by polymerizing vinylidene fluoride. It consists of repeatedly added long polymeric chain of [–CF2–CH2] n (Figure 1). A PVDF 6008/0001 grade procured from Deval Enterprises (Vadodara, India) was used in this research work. The physical and mechanical properties of the selected grade of PVDF (as per supplier data) are provided in Table 1.
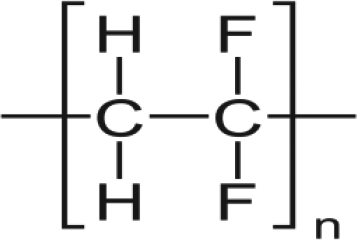
Chemical structure of PVDF.
Physical, mechanical, and thermal properties of PVDF.
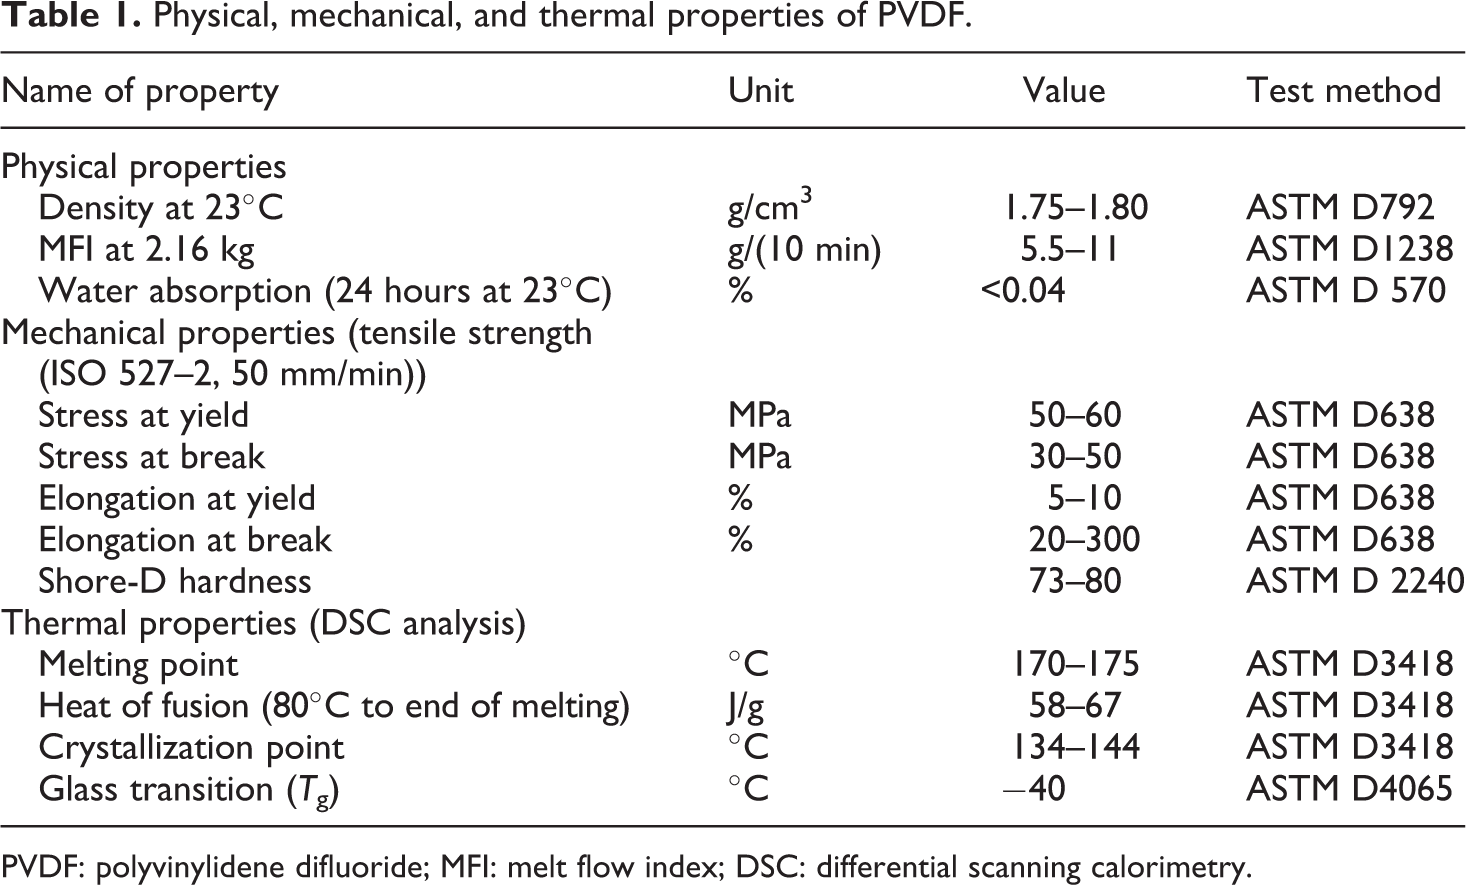
PVDF: polyvinylidene difluoride; MFI: melt flow index; DSC: differential scanning calorimetry.
The BaTiO3 is a piezoelectric ceramic and mainly known for its lead free and inorganic nature. Due to a large dipole moment, BaTiO3 is commonly used as a reinforcement in the EAP to increase their piezoelectric properties. For this research work, BaTiO3 was procured from Ultra Nanotech Pvt Ltd (Bengaluru, Karnataka, India). Table 2 provides the specifications of the BaTiO3 used in current research work (supplier data).
Specifications of the BaTiO3.
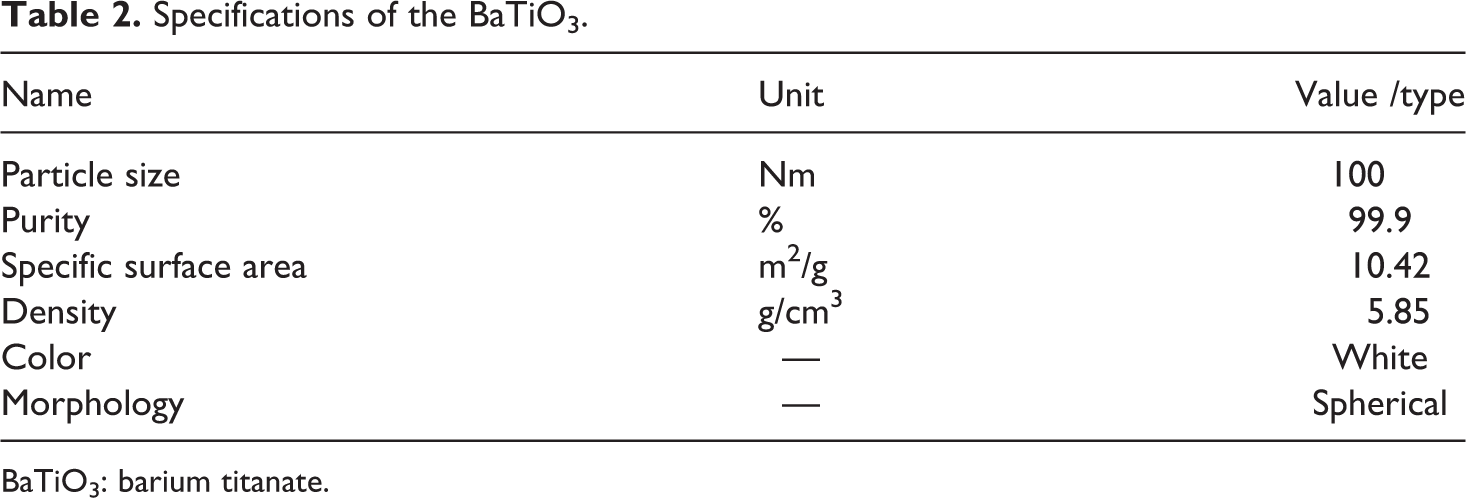
BaTiO3: barium titanate.
Gr was also used as a filler in the base polymer matrix. In this study, Gr was procured from a local vendor (Platonic Nanotech Pvt Ltd, Mahagama, Jharkhand, India). The specifications of the Gr are provided in Table 3 (supplier data).
Specifications of the Gr.
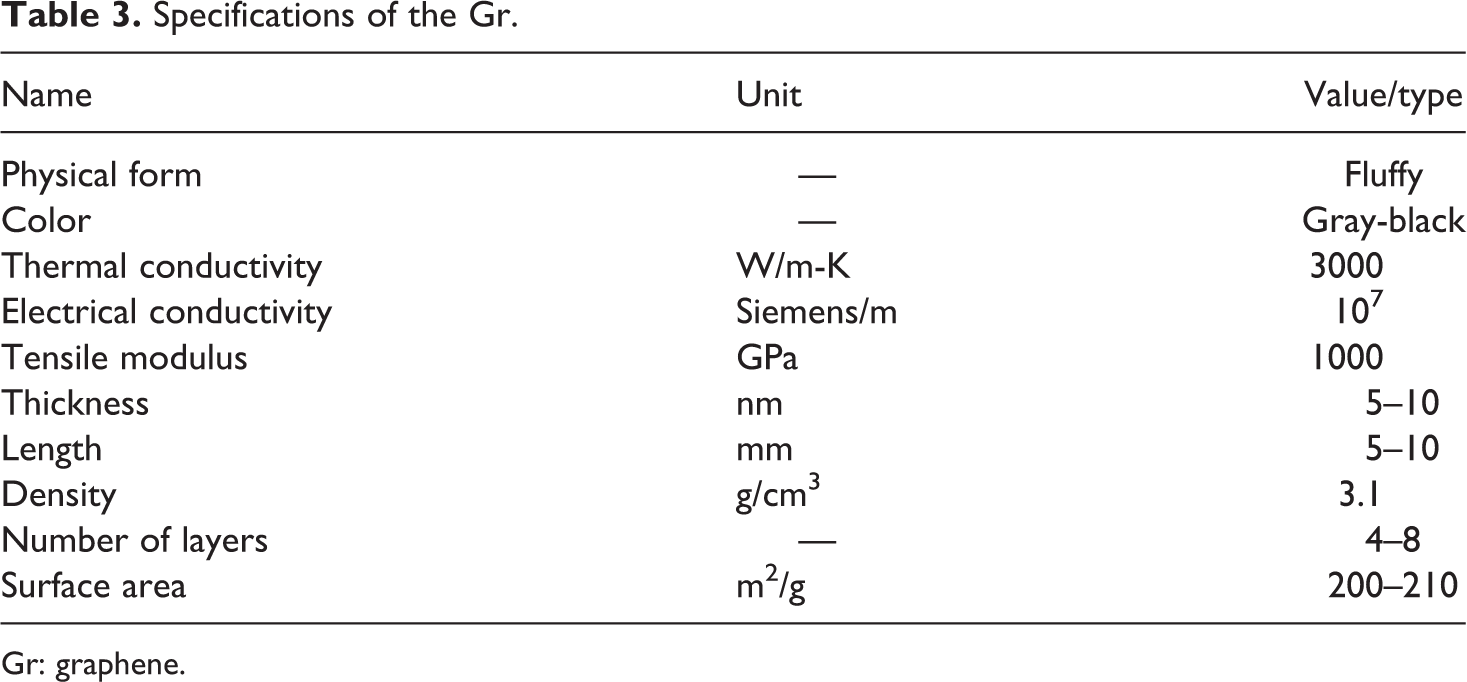
Gr: graphene.
Chemical blending of materials
Since this work is an extension of previously reported work in which both blending of materials and extrusion of filament were performed with TSE, 23 therefore, similar proportion of filler to base materials was taken to ascertain the effect of blending method on the various properties of extruded filaments and 3D printed parts. The weight percentage of Gr was kept fixed as 2% of weight of PVDF, whereas BaTiO3 was taken in the range of 10–20% of total weight. Thus, selected three proportions are provided in Table 4.
Three different proportions of materials.
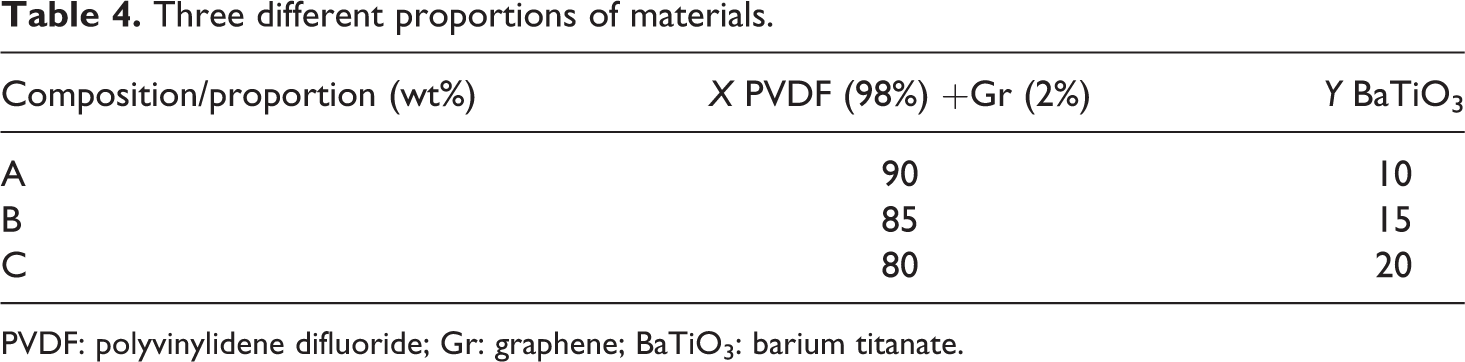
PVDF: polyvinylidene difluoride; Gr: graphene; BaTiO3: barium titanate.
The composite proportion, as given in Table 4, has been used in this research work. For 20 g of the mixture, 2 g of BaTiO3 was sonicated in DMF for 2 h for complete dispersion. The quantity of DMF was taken as 1 ml for 0.2 g of BaTiO3. Simultaneously, in another vessel, a mixture of 360 mg Gr and 17.64 g of PVDF granules were dispersed in 100 ml of DMF on a hot plate magnetic stirrer for 2 h. During the magnetic stirring, the temperature of the base plate was kept constant at 50°C. Both solutions were mixed together and 2 ml of DMSO was added in it. This nanocomposite solution of PBGC was again stirred at the same parameters for next 30 min. Some amount of Gr and BaTiO3 was settled down at the bottom of liquid slurry. Hence, the solution was again put on ultrasonication for 20 min. For complete evaporation of DMF solvent, slurry of mixture was poured over the glass substrate and heated at 100°C for next 12 h inside the oven. A thin-film PVDF/Gr/BaTiO3 nanocomposite was formed over the glass substrate and can be easily removed from the glass surface. The same procedure has been repeated by maintaining the same solute–solvent ratio for all three compositions/proportions (Table 4).
Flow ability of the material plays a prominent role for uniformity and other mechanical properties of the extruded filament. Thus, to characterize the rheological properties of the chemically blended material, melt flow index (MFI) test was performed as per the ASTM D-1238. MFI is basically the flow rate of material in grams for 10 min under some applied pressure at prefixed temperature. Initially, the prepared composite of PVDF + Gr + BaTiO3 was preheated at 230°C temperature for 3–5 min, and after that, constant pressure (2.16 kg) was applied through piston to flow the material through a standard die having a diameter of 2.0955 ± 0.0051 mm and length of 8.000 ± 0.025 mm (in some cases, different orifice is used). The output values of MFI for all three proportions are provided in Table 5. Further, these values were compared with MFI values of the mechanically blended composites having same proportions. The density of the composite provided in Table 5 was calculated by ratio proportion method by taking the values of density of materials mentioned (Table 1–3).
MFI values for different compositions/proportions.a
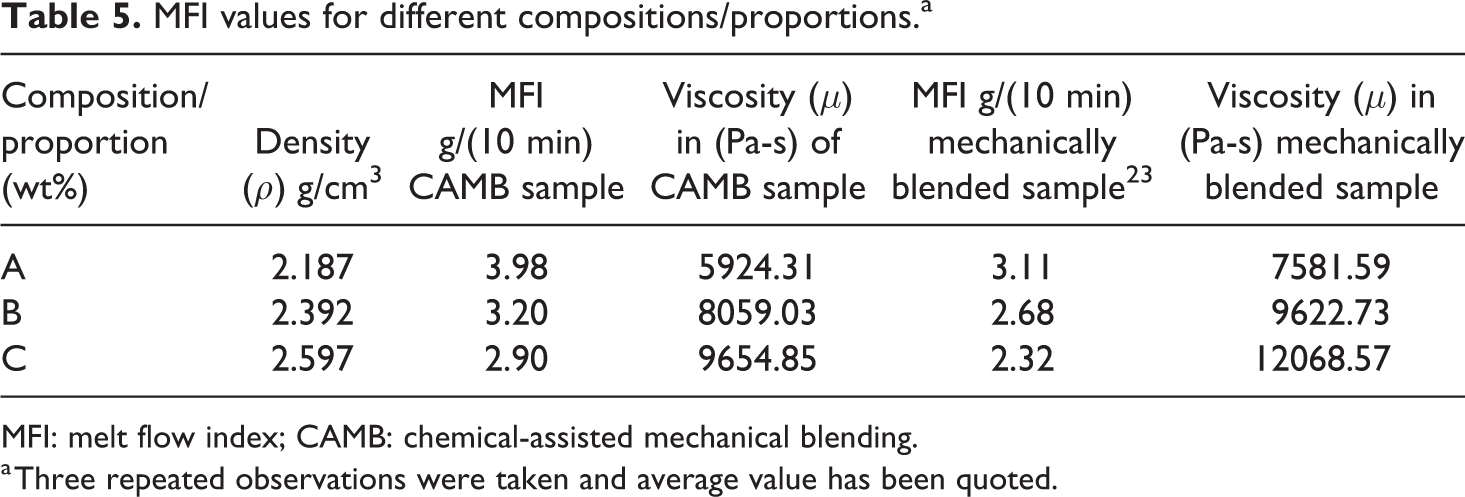
MFI: melt flow index; CAMB: chemical-assisted mechanical blending.
a Three repeated observations were taken and average value has been quoted.
As observed from Table 5, CAMB for preparation of PBGC resulted into better MFI. Further, the viscosity (μ) has been calculated from shear stress (τ) and shear rate (γ). To calculate the shear stress and shear rate, the following equations have been used48,49

where r is nozzle radius 0.105 cm, R is radius of piston 0.4737 cm, l is nozzle length 0.8 cm, F is test load L in kg × 9.807 × 10⁵ dynes (here, L is 2.16 kg).
Since the geometry of melt flow indexer is fixed, thus, after putting the values of radius of nozzle (r), test load (F), nozzle length (l), and radius of piston (R) in equation (1), then, shear stress (τ) is

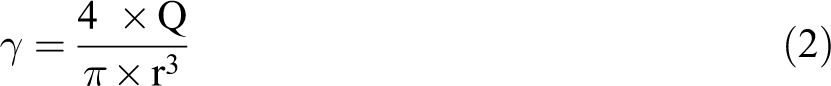
whereas shear rate γ depends on the volumetric flow rate Q (in cc/s). The volume flow rate Q can be determined by dividing the volume V extruded during the time t and Q is calculated as
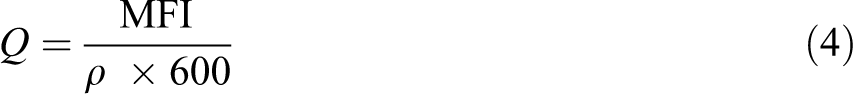
From equations (2) and (4), shear rate can be calculated as

After putting the values of MFI, radius of nozzle (r) and density (ρ) in equation (5) is as follows
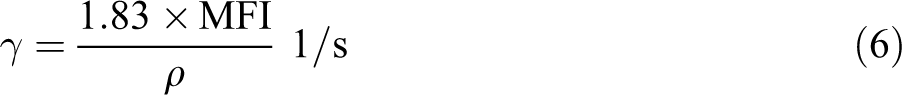
To calculate viscosity, equation (3) is divided by equation (6)

or

Equation (8) represents the viscosity in terms of MFI. After putting the values of MFI, density, and load (L) in equation (8), the viscosity of particular composition can be calculated, as given in Table 5. The graph of viscosity values at their respective compositions is shown in Figure 2.
Viscosity versus composition.
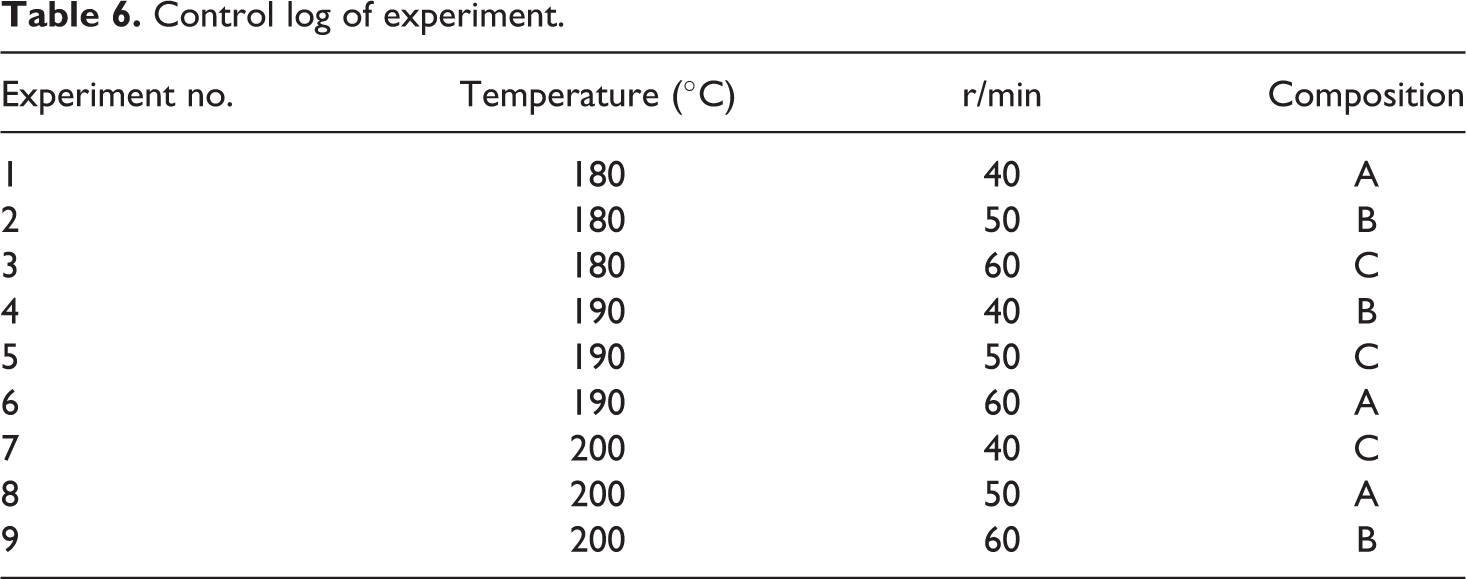
After successful synthesis of nanocomposite films of all three proportions of PVDF/Gr/BaTiO3, sheets were cleaved into small sizes. These cleaved parts of the sheets were put into the TSE for the development of feedstock filament. The commercial TSE (Make: Thermo scientific HAAKE, Germany) was used for the extrusion of filament. For available FDM setup, the required diameter of the extruded feedstock filament should be in the range of 1.75 ± 0.05 mm, as the nozzle opening of existing FDM supports only this size of filament. The temperature of the corotating screws and extruder’s barrel was set according to the melting point of the material. The diameter of small opening of TSE can be adjusted by changing its die. The process parameters of the TSE, such as r/min and temperature, directly affect the various properties (mechanical, physical, and thermal) of the extruded filament. As this study is extended part of previously conducted research work, 23 thus, to do a comparison between the output values of properties of chemically blended composite filaments with the mechanically blended composite filaments, same experiment conditions were selected. The range of barrel temperature was taken from 180°C to 200°C and rotation speed of screws was taken in the range of 40–60 r/min. To optimize the process parameters of TSE, nine set of experiments (with three repetitions) were performed at different settings of TSE, as per Taguchi L9 orthogonal array (OA) (Table 6).
Control log of experiment.
The PBGC prepared with chemical blending has been fed to TSE set up (as per Table 6). The material extruded with TSE was collected. After the extrusion process, the filaments were tested for their mechanical, dimensional, thermal, and morphological properties. For ensuring mechanical properties, tensile testing was performed on a universal testing machine (UTM) setup (Make: Shanta Engineering, Pune, Maharashtra, India), whereas, to measure the diameter of the filaments, a Mitutoyo micrometers (as per ISO-3611-1978) accurate up to three decimal places was used. To perform thermal analysis, extruded filaments were subjected to differential scanning calorimetry (DSC) testing. Further to optimize the tensile strength of filaments, MINITAB-17 software package was used. The filament shown best mechanical strength and having diameter in the range of 1.75 ± 0.05 mm was used to run on the existing open-source 3D printing machine.
The filament comprising PBGC after CAMB with maximum mechanical strength was used run on open-source FDM printer (Make: Divide by zero, Mumbai, Maharashtra, India). To study the effect of process parameters of FDM, standard tensile specimens were fabricated, as per ISO 527–2 (an International standard for tensile testing of reinforced plastics). Three process parameters—infill speed (IS), infill angle (IA), and infill density (ID)—were chosen on the basis of pilot experimentation and literature review (as these three selected parameters mainly affect the properties of printed parts). The other fixed parameters were nozzle diameter: 0.5 mm, temperature of bed: 85°C, fan output: 50%, and fill pattern: rectilinear, and so on. For optimization process, each selected process variable was further divided at three levels (Table 7).
Selected FDM parameters for parametric optimization.
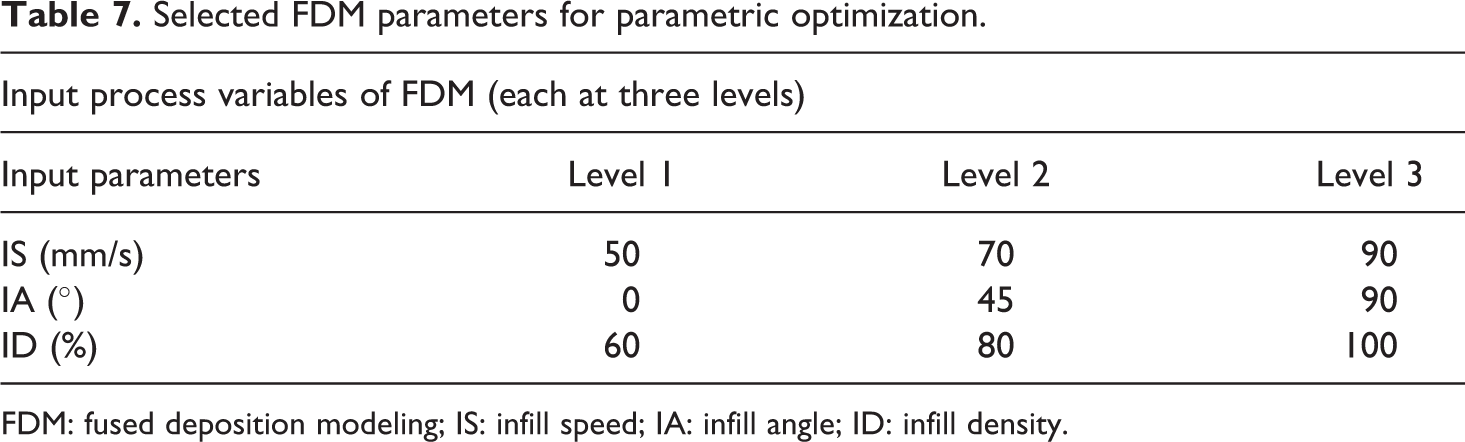
FDM: fused deposition modeling; IS: infill speed; IA: infill angle; ID: infill density.
To optimize the process parameters by performing a minimum number of experiments, again, Taguchi L9 OA was used (Table 8). For all selected nine settings, 3D printing of standard tensile specimens as per ISO 527–2 was performed with three repetitions.
A complete design of experiments.
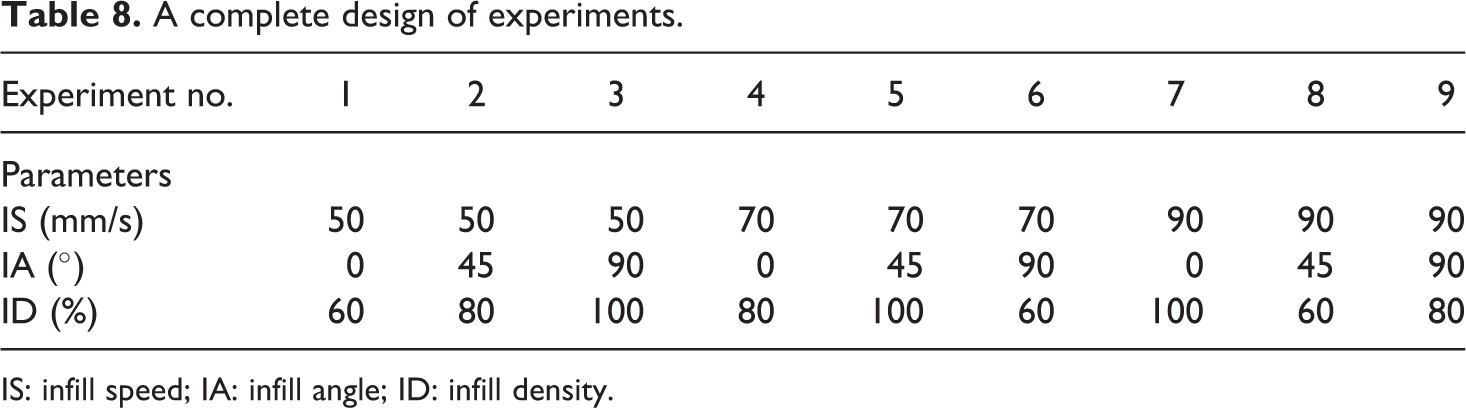
IS: infill speed; IA: infill angle; ID: infill density.
The 3D printed dumbbell-shaped specimens of PBGC were subjected to destructive tensile testing as per the ISO 527–2 (International standard for tensile testing of reinforced plastics) at room temperature. Destructive testing of the specimens was performed on UTM. The outputs peak strength (PS) and break strength (BS) were noted for tensile testing. The stress–strain curves were plotted to understand the mechanism of deformation of the material. To optimize the tensile strength of the 3D printed parts, analysis of variance (ANOVA), a statistical tool, has been used. Further, the tensile strength of standard specimens prepared from CAMB was compared with the tensile strength of parts made up of mechanically blended composites.
Results and discussion
After the extrusion process (as per Table 6), filaments were subjected to tensile testing. The results of tensile testing in the form of PS, BS, and fracture toughness (FT) (based on area under stress–strain curve, Figure 3) are provided in Table 9. Further, the values of signal-to-noise (SN) ratio have been calculated at larger the better type condition.
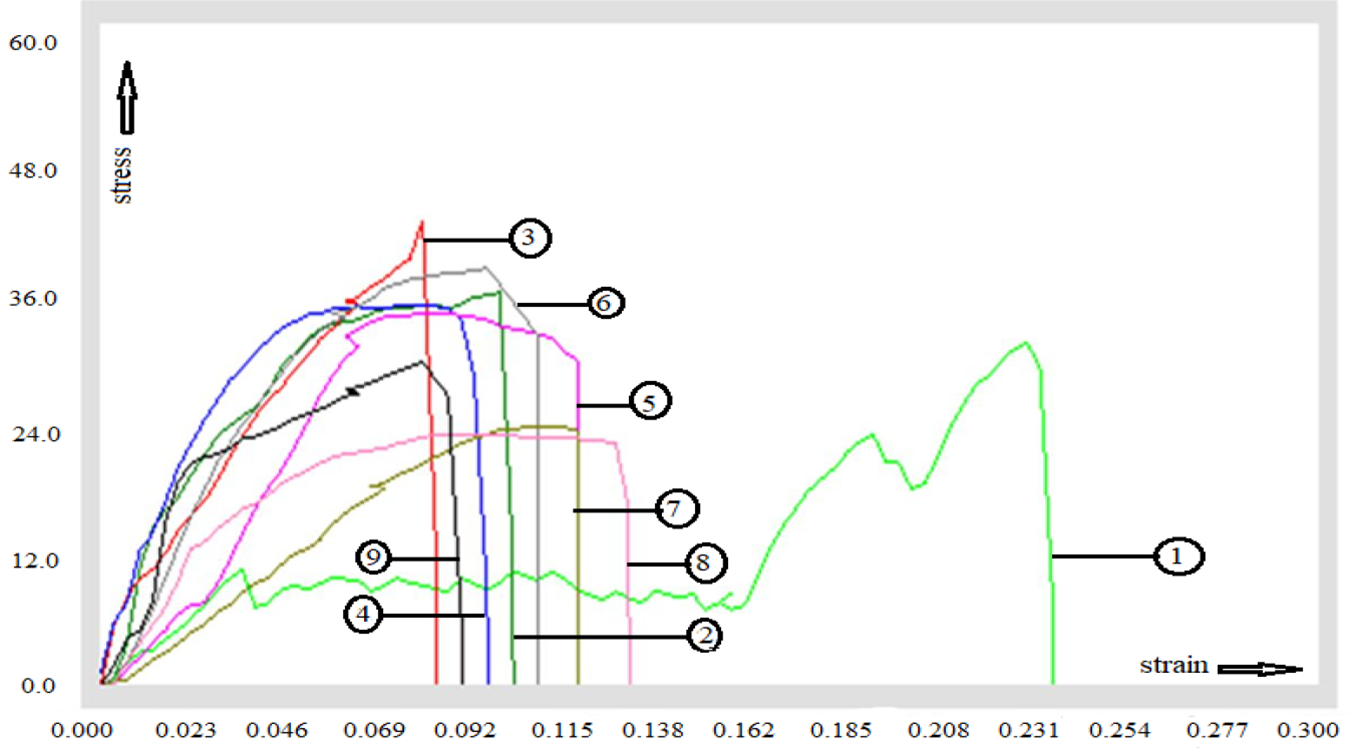
Stress–strain curve obtained from tensile testing of filaments.
Results obtained from tensile testing and their corresponding SN ratios.
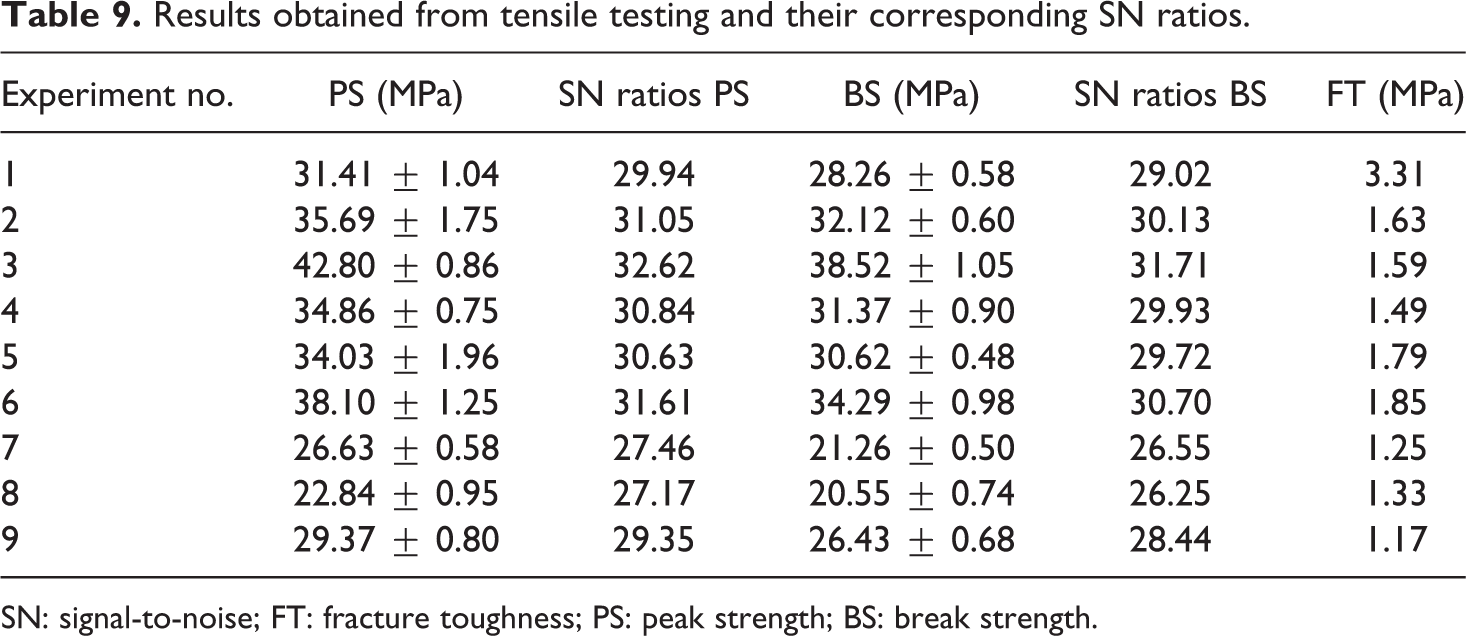
SN: signal-to-noise; FT: fracture toughness; PS: peak strength; BS: break strength.
As observed from Table 9, the maximum value of PS (42.80 MPa) and BS (38.52 MPa) was noted in experiment no. 3; however, the minimum tensile strength was found in experiment no. 8. Therefore, the processing conditions of experiment no. 8 can be rejected outrightly. Based on these observations for 3D printing, feedstock filament with maximum tensile strength (experiment no. 3) may be selected for further processing. Further, to optimize the processing condition of TSE for tensile strength (PS and BS), ANOVA was performed (Table 10). As the probability (p) value of the first two selected parameters (temperature and r/min) is less than 0.05 (Table 10), these two parameters were considered significant at 95% confidence level. However, for third parameter (composition), the value of p is not less than 0.05, thus considered as insignificant.
ANOVA for SN ratios (PS of filaments).
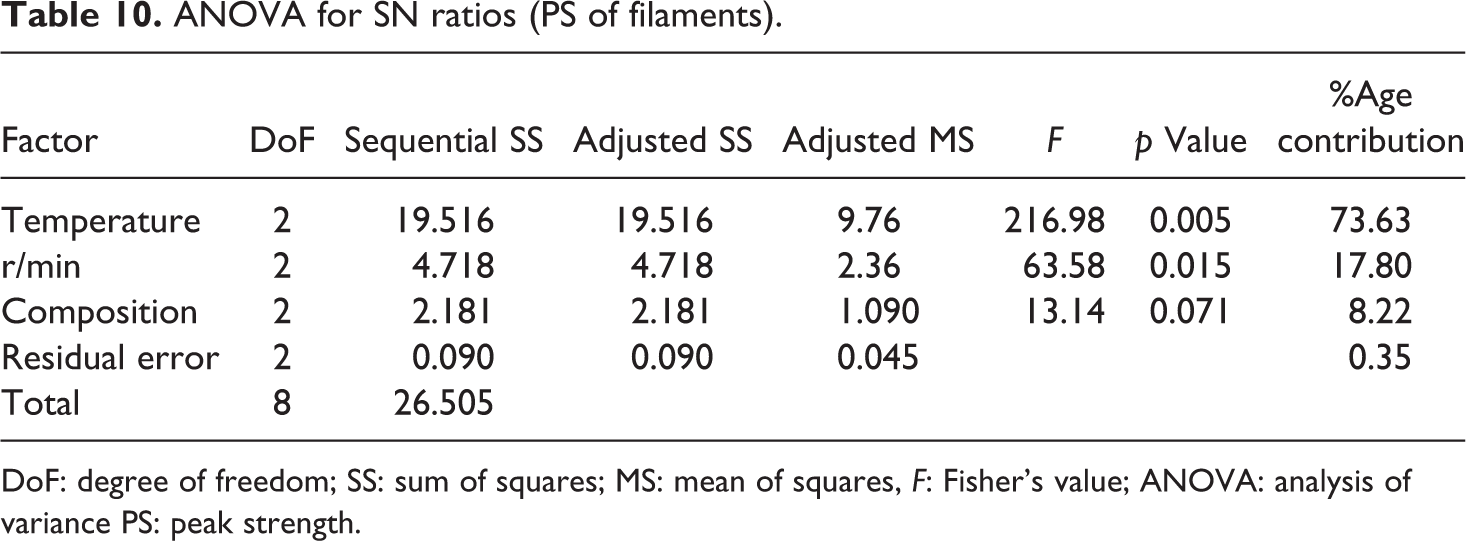
DoF: degree of freedom; SS: sum of squares; MS: mean of squares, F: Fisher’s value; ANOVA: analysis of variance PS: peak strength.
Based on Tables 9 and 10, rank table (Table 11) shows ranking of process parameters for SN values of PS. As observed from Tables 10 and 11, first parameter (temperature) has most effective role as it stood first, whereas r/min and composition of filament ranked second and third, respectively. The main effect plot for SN ratios is shown in Figure 4, which represents that the filament fabricated at 180°C of extruder temperature and speed of screw 60 r/min and intermediate level of composition will have best mechanical properties.
Response table of input parameters for PS of filaments.
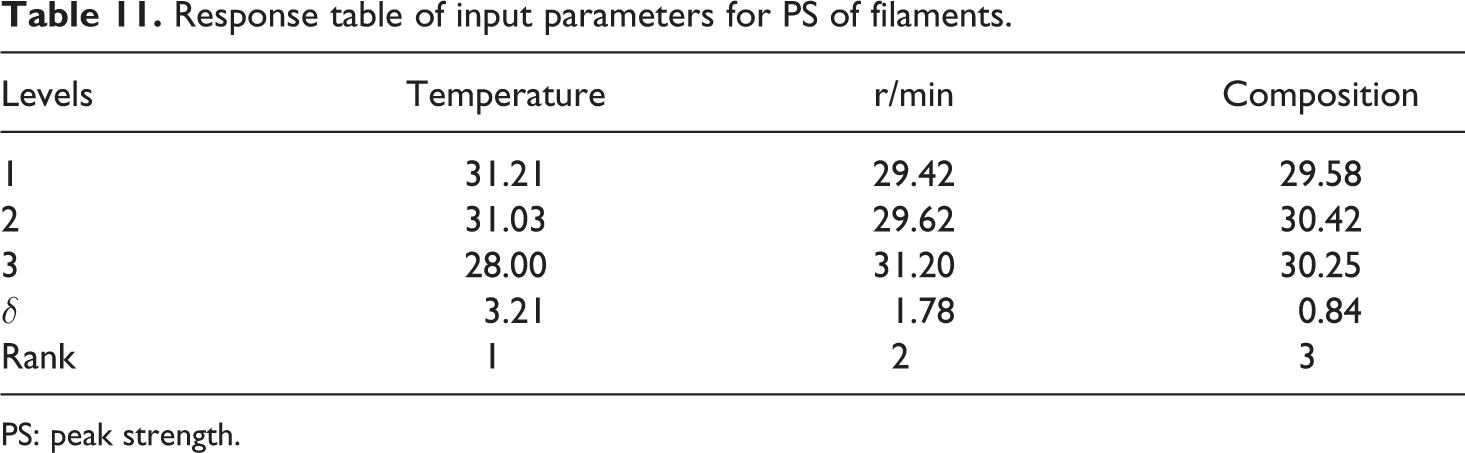
PS: peak strength.
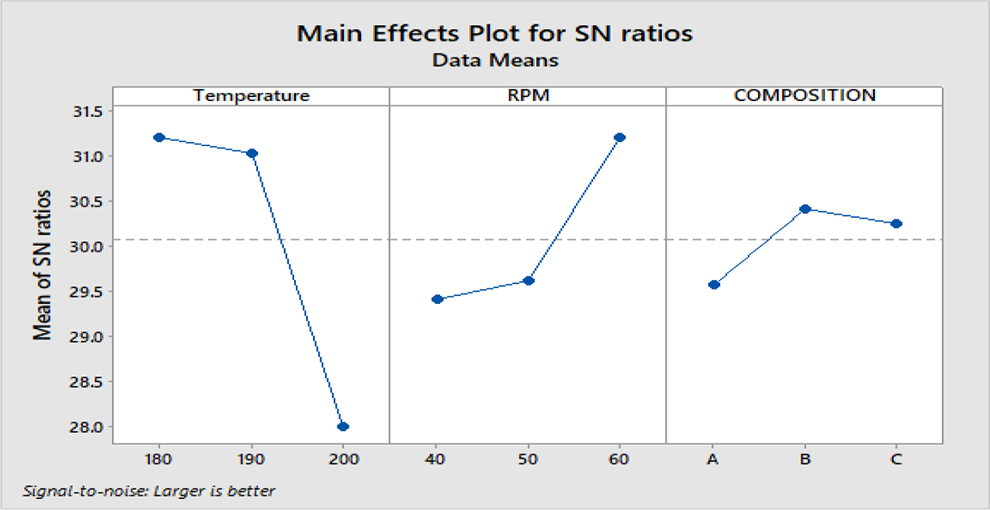
SN graph for PS of filaments.
The SN values obtained (Table 9) have been further used for the prediction of optimized value using equation (9)

where RA, RB, and RC are the maximum values of temperature, r/min, and composition from Table 10 and R is the mean of SN values for PS

After putting these values in the equation (9)
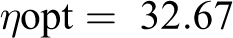
Now,
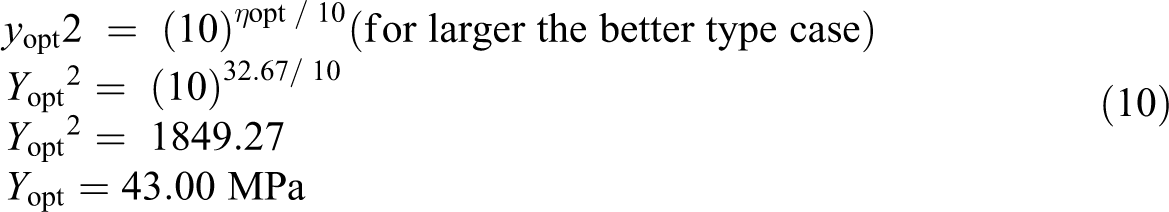
Three repetitive confirmatory experiments were conducted at proposed settings and the average value of observed PS is 43.18 MPa, which is very close to the calculated value, that is, 43.00 MPa.
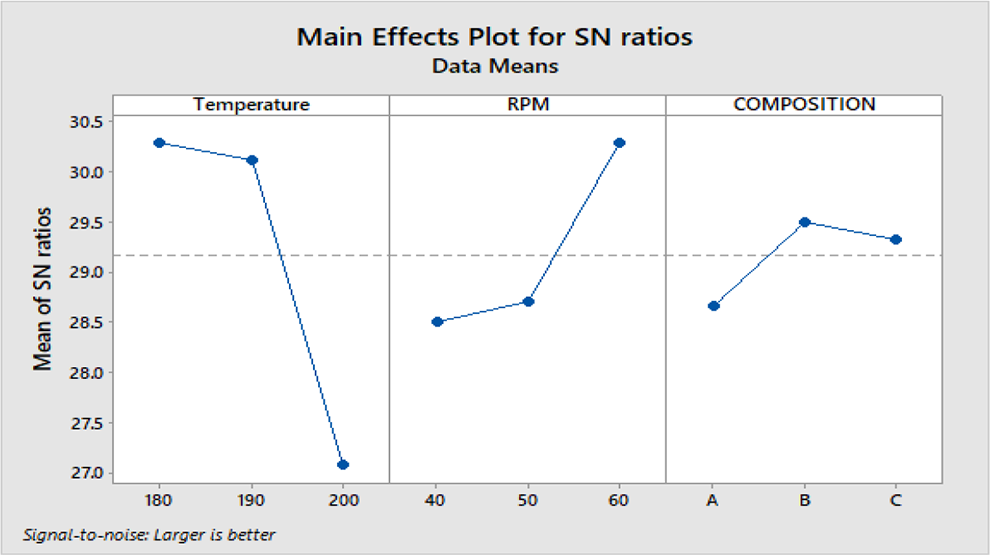
Based on the SN ratios of BS, the SN response graph at larger the better conditions is shown in Figure 5.
SN graph for BS for filament.
Based on Table 9, ANOVA table for SN values of BS at 95% confidence level is presented in Table 12.
ANOVA for SN ratios (BS for filament).
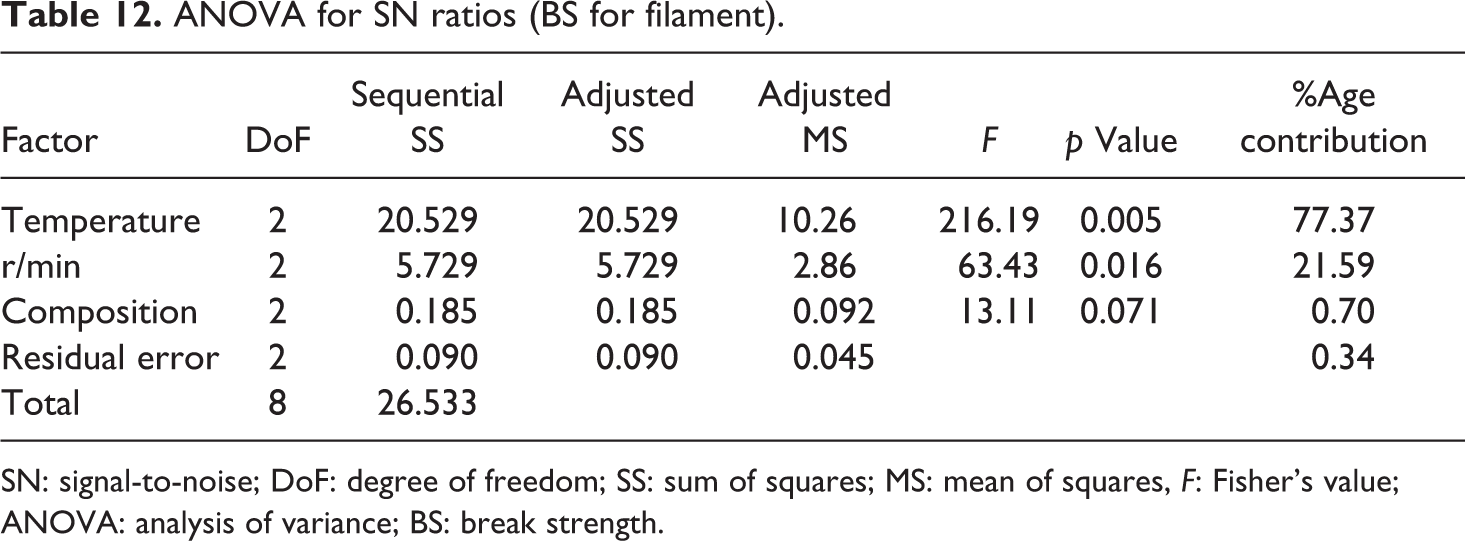
SN: signal-to-noise; DoF: degree of freedom; SS: sum of squares; MS: mean of squares, F: Fisher’s value; ANOVA: analysis of variance; BS: break strength.
Table 13 displays the rank of process parameters based on the SN ratios of BS. It has been observed that the temperature puts a major effect on the BS followed by r/min and composition with rank second and third, respectively.
Response table of input parameters for BS for filament.

BS: break strength.
The SN values of BS (Table 9) have been further used for the prediction of optimized value using equation (3)

where RA, RB, and RC are the maximum values of temperature, r/min, and composition from Table 13 and R is the mean of SN values for PS

After putting these values in equation (11)
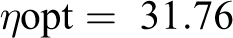
Now,
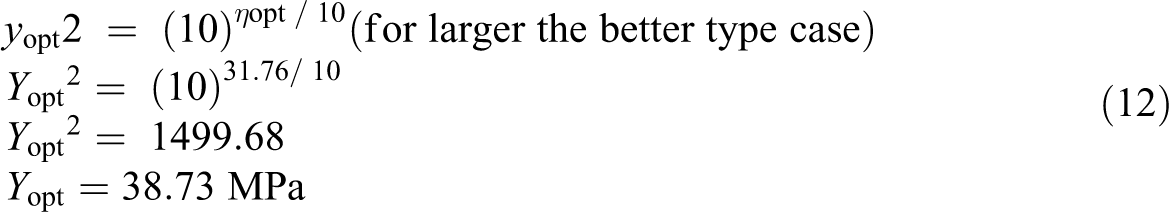
A total of three repetitive confirmatory experiments were conducted at proposed settings and the average value of observed BS was 38.80 MPa, which is very close to the calculated value, that is, 38.73 MPa.
A comparison was made between the tensile properties of extruded filaments of chemically and mechanically blended composites.
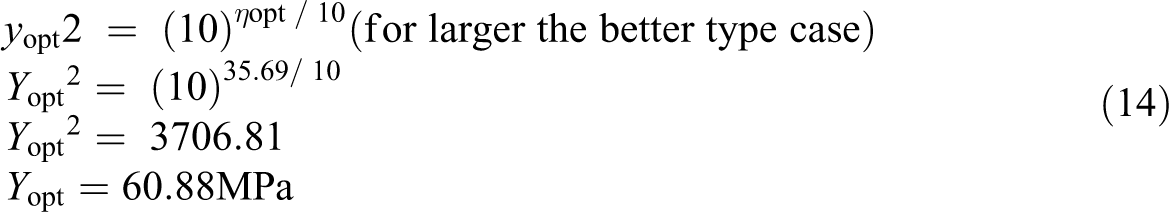
The values of PS of the filaments of mechanically blended composites (taken from previously reported study 23 ) and PS of the filaments of CAMB are shown in bar graph (Figure 6).
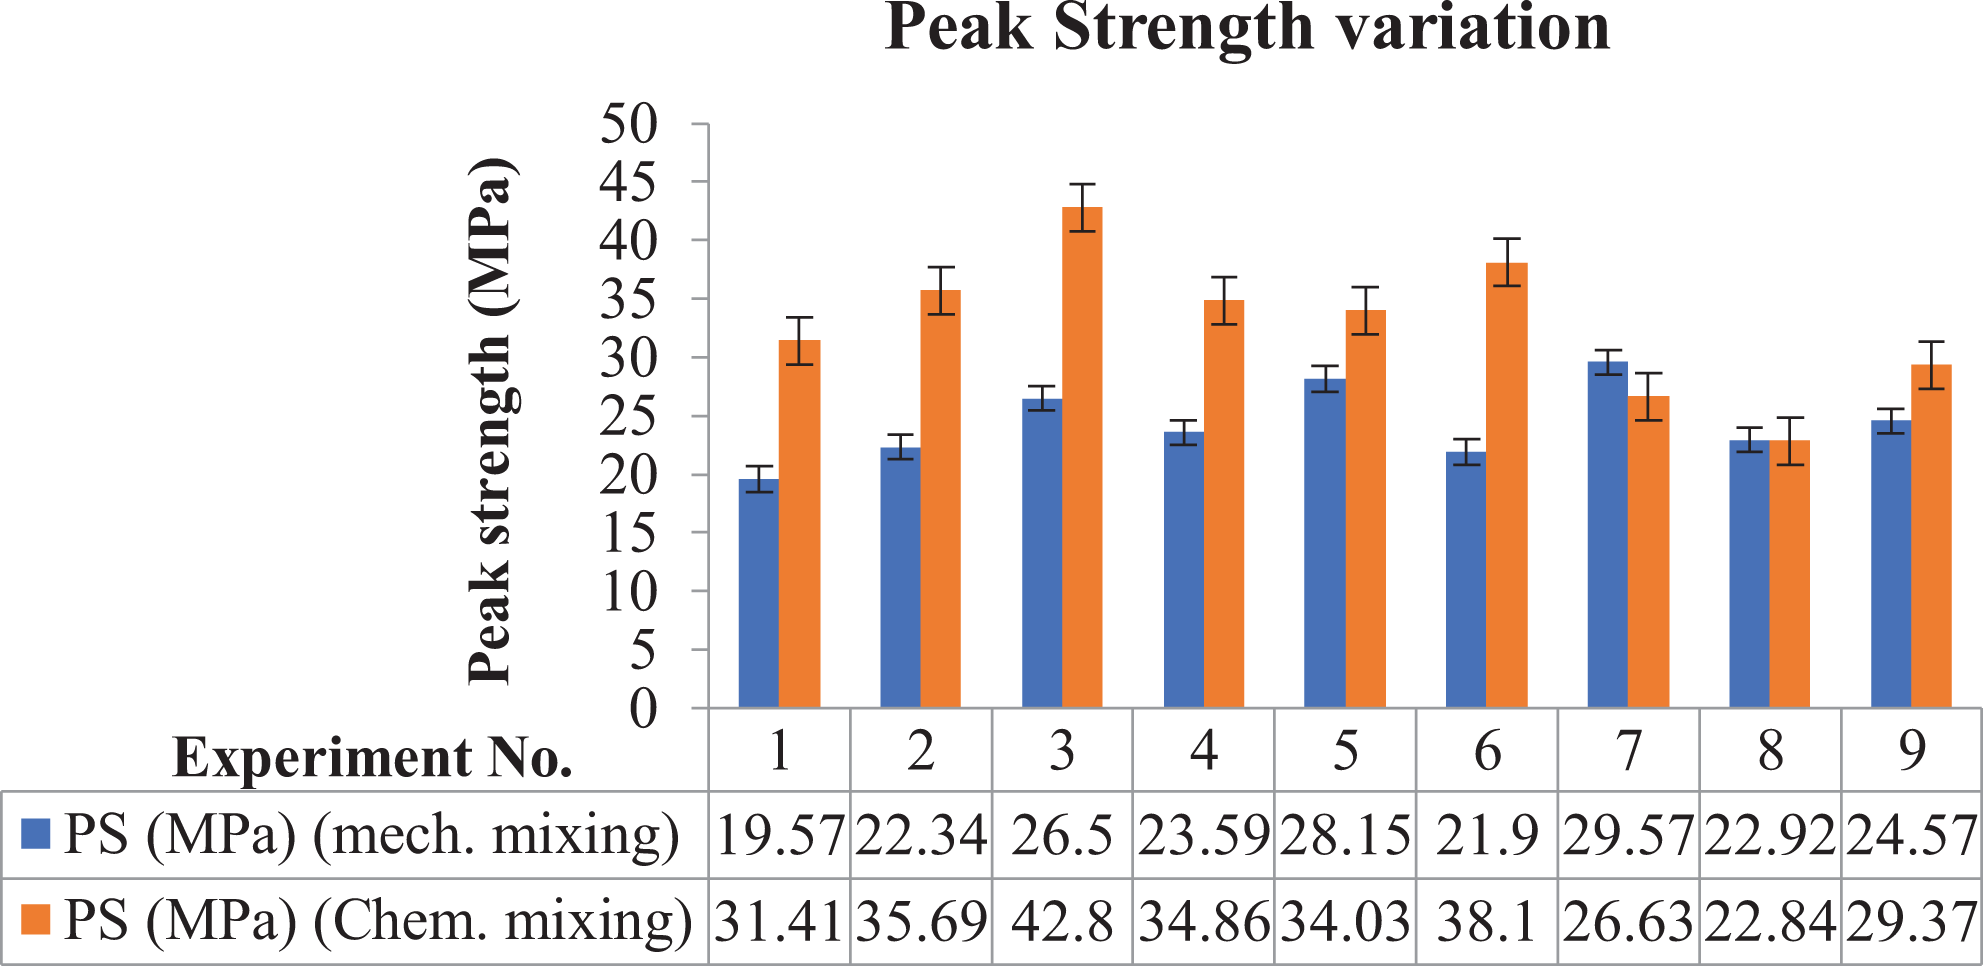
Comparison of PS for filaments (mechanically extruded and CAMB composites).
In both cases, the extrusion of filaments was performed at similar experimental condition. It should be noted that the methods of preparation of composites were different. Thus, it has been revealed from the bar graph that the filaments of chemically mixed composites have higher PS as compared to filaments of mechanically blended composites. Moreover, the best parametric settings of the TSE are also different in both cases. As in case of chemically mixed composites, the optimized settings to fabricate the filament shown in maximum tensile strength were 180°C of extruder temperature, 60 r/min screw speed, and 15% of BaTiO3. However, for mechanically mixed composites, the optimized settings are 200°C processing temperature, 50 r/min screw speed, and 20% BaTiO3.
Similar to PS, a comparison was also made between the BS of filaments prepared via chemically/mechanically mixed composites, as shown in Figure 7.
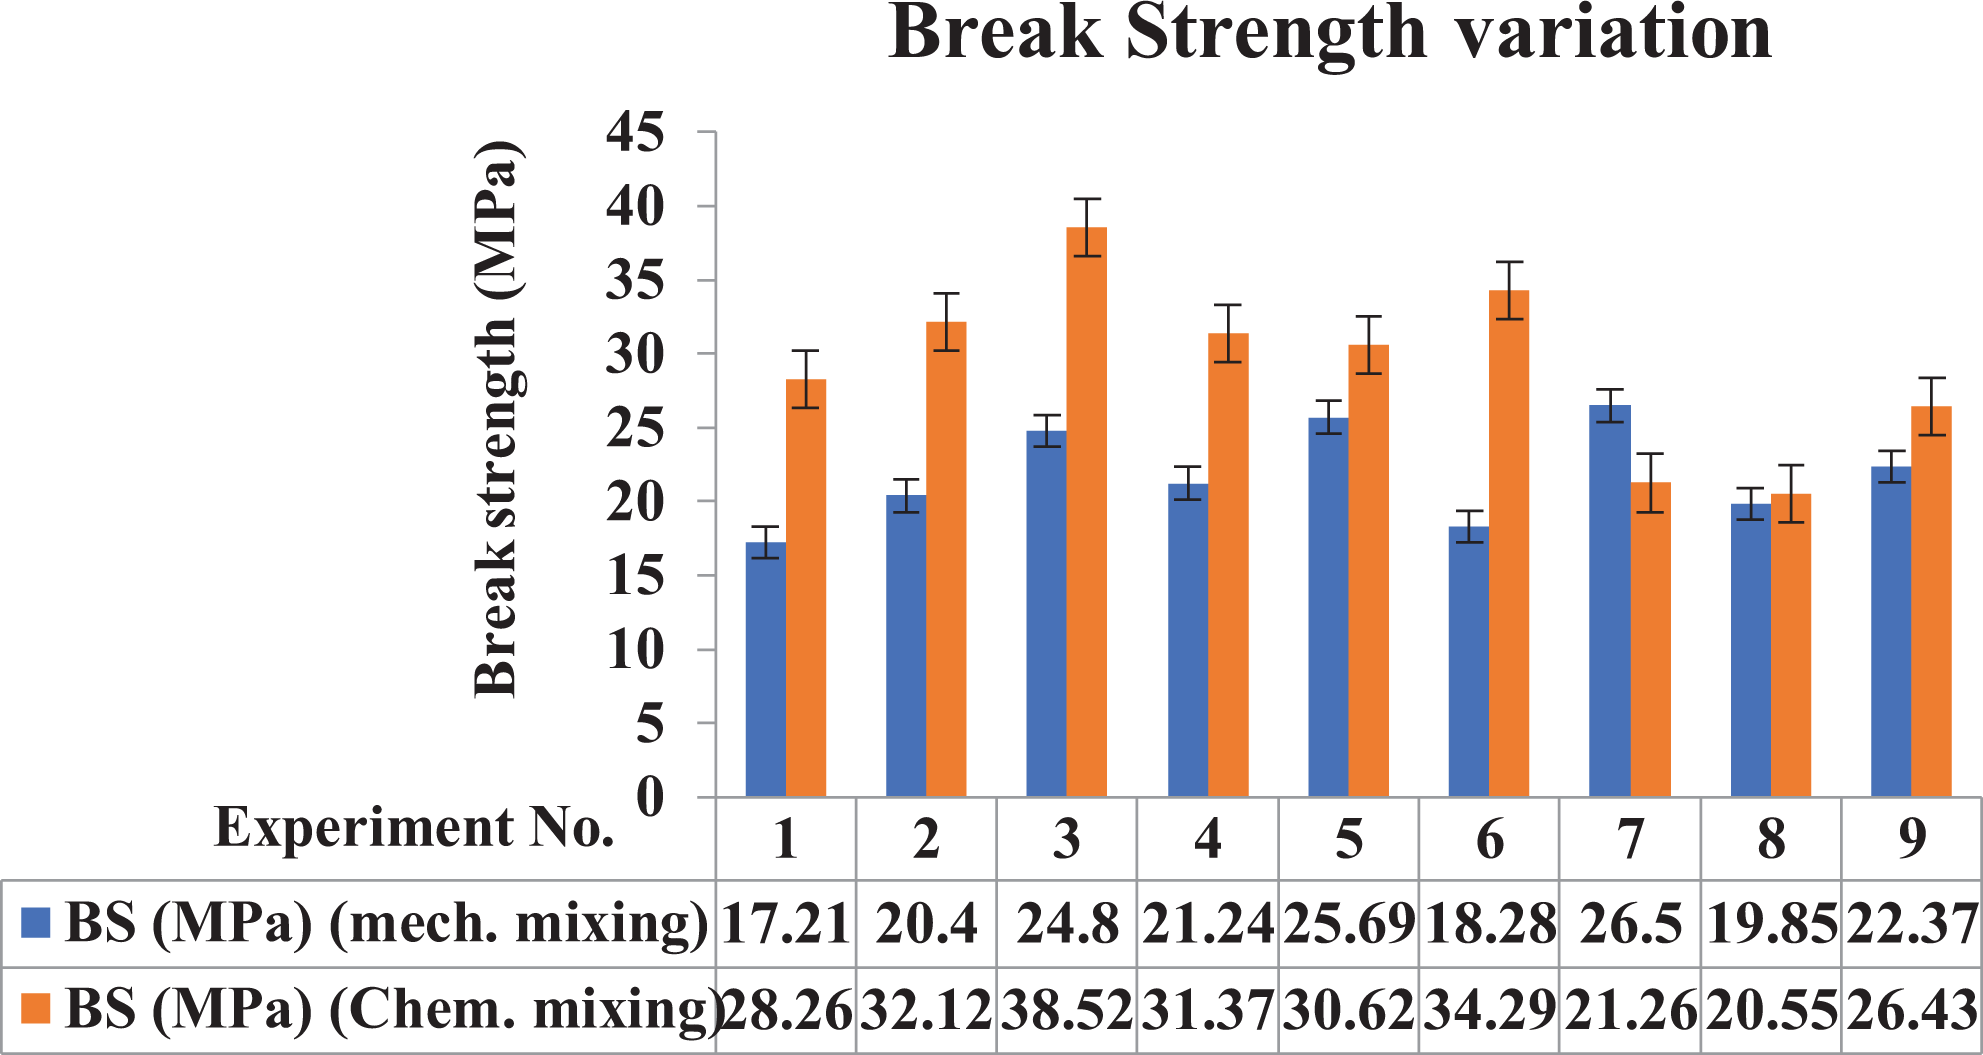
Comparison of BS for filaments of mechanically blended and CAMB composites.
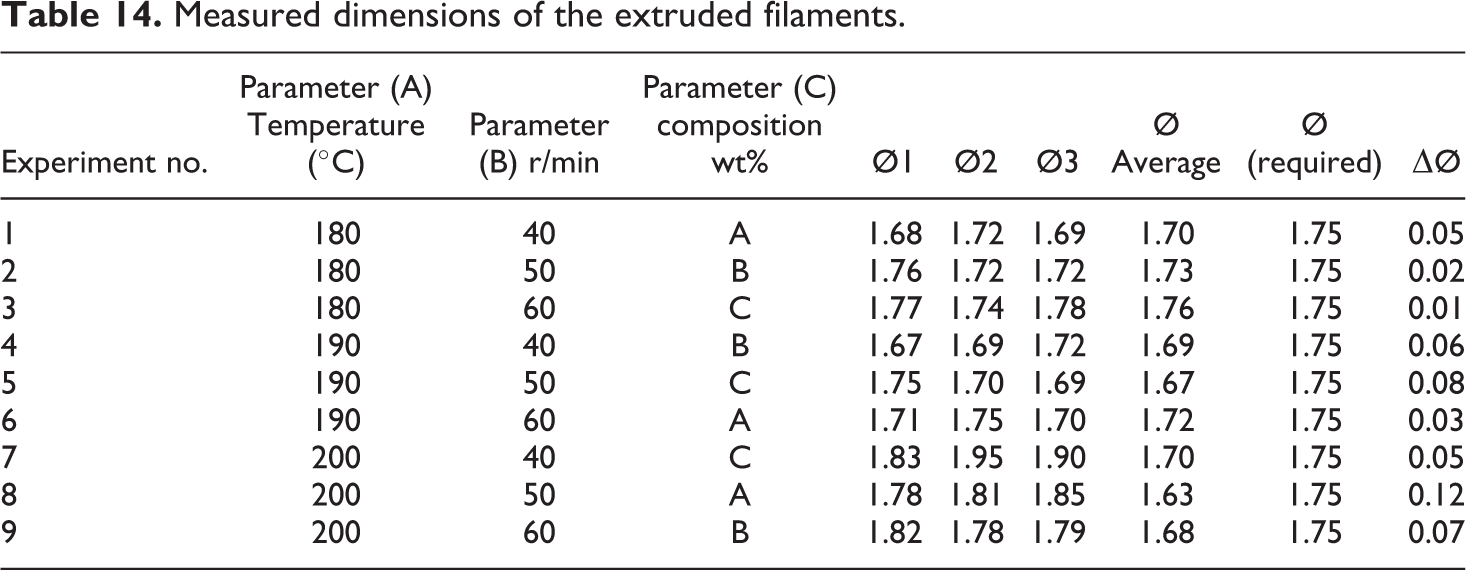
Since the main purpose of this study is to develop a smart polymer-based feedstock filament comprising PBGC for FDM process. The existing FDM setup supports only the filament having a diameter within the range of 1.75 ± 0.05 mm. Thus, it was necessary to perform the dimensional analysis of the extruded filaments. Therefore, after the extrusion of feedstock filaments as per the different processing parameters, they were subjected to dimensional measurement. To minimize the experimental error, a total of three readings were taken at three different places over the total span length of the filaments. The average diameters (Ø) of three measured dimensions were compared with the required standard diameter of the filament. Measured dimensions of the filament and their comparison with the standard dimensions are provided in Table 14. It has been observed that the filament extruded as per experiment no. 3 has a minimum deviation, whereas the filament extruded as per experiment no. 8 has a maximum deviation. These observations are in line with the results of mechanical testing.
Measured dimensions of the extruded filaments.
To make a comparison of the measured dimensions of filaments of CAMB of PBGC with the dimensions of filaments of mechanically mixed composites, line graph has been used (Figure 8).
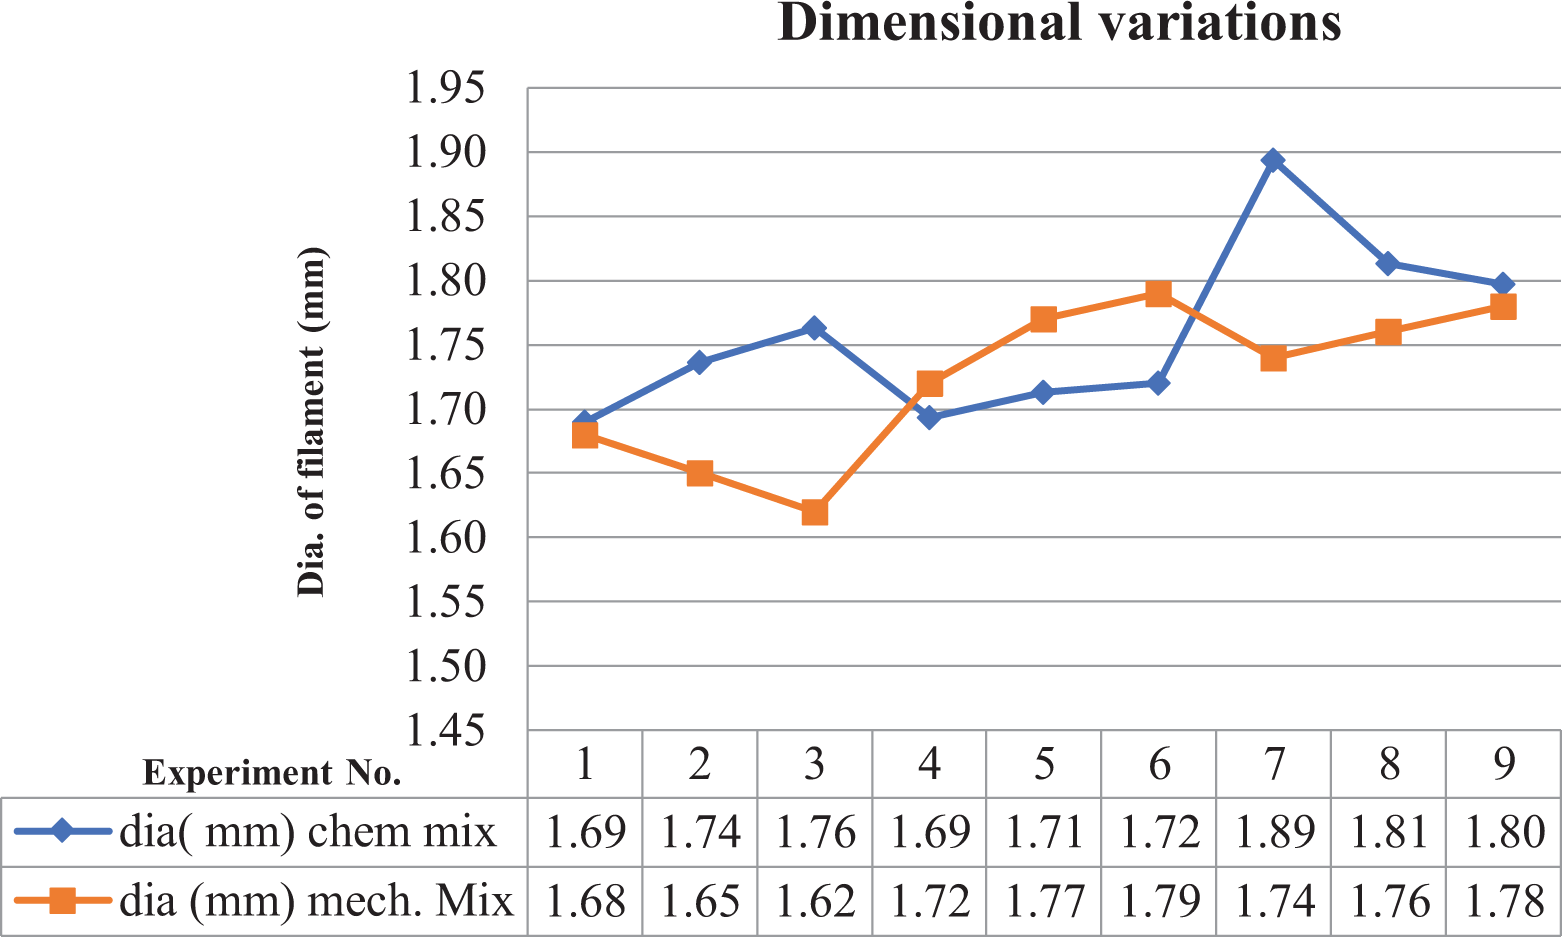
Dimensional measurements of filaments (CAMB/mechanically blended composite).
After the mechanical and dimensional testing of all fabricated filaments, it has been observed that the filament extruded as per experiment no. 3 (prepared at 180°C processing temperature, 60 r/min, and composition/proportion “B”) has shown the best mechanical properties, and filament extruded as per experiment no. 8 resulted into poor mechanical properties. Further, to ascertain the effect of processing condition on the surface properties (such as porosity/voids and surface roughness) of the extruded filaments, morphological analysis was performed. A metallurgical microscope was used to capture the photomicrographs of the samples at 100× magnification. The surface porosity (Φ) of the samples was measured as per ASTM B-276 by commercially available metallurgical image analysis software. Figure 9 shows the photomicrographs of the surfaces of the filaments with the percentage of Φ on the surface. The red zone is selected area for analysis of percentage porosity. It has been observed from the photomicrograph’s filament shown maximum tensile strength has less porosity (Φ = 1.53%) on its surface as compared to the other filaments, whereas the filament having poor mechanical properties is having maximum percentage of porosity (Φ = 5.58%) among all the samples.
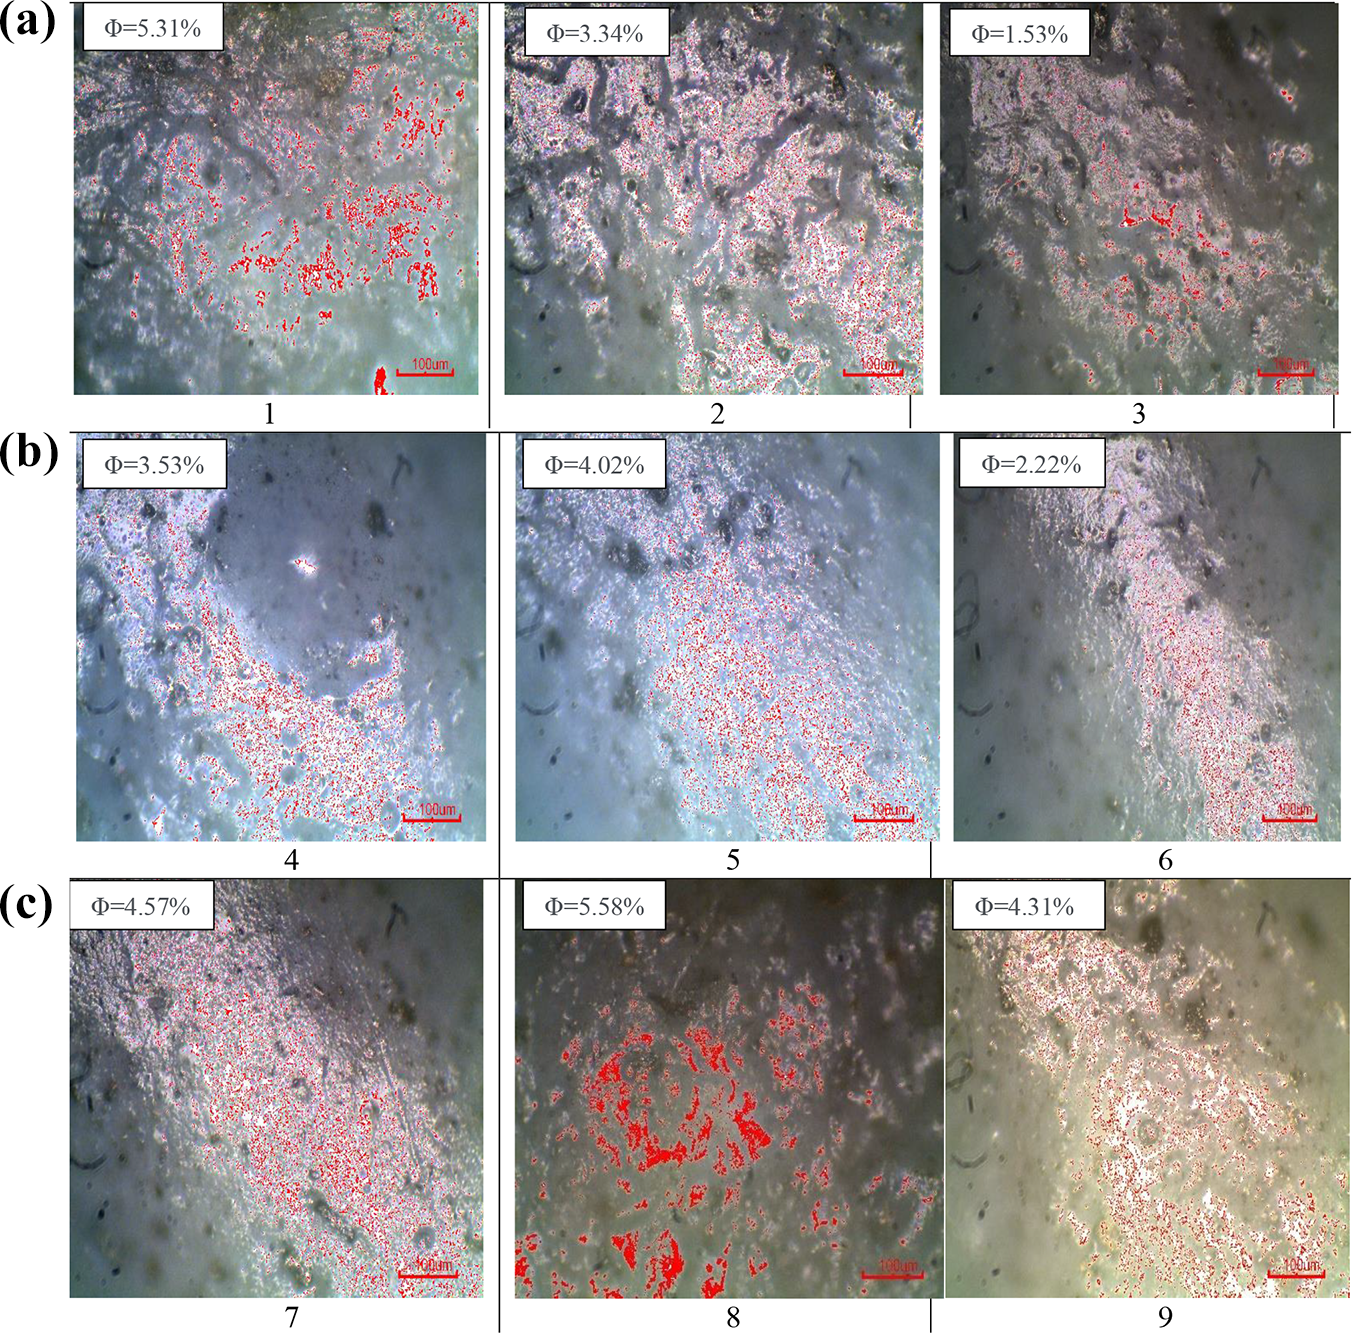
Optical photomicrographs with variation of percentage porosity (as per Table 6). (a) Φ = 4.57%, (b) Φ = 5.58%, and (c) Φ = 4.31%.
Further to ascertain the surface roughness of the extruded filaments, the photomicrographs of filaments captured at 100× were processed on image processing software to get 3D rendered images and surface roughness profile at cutoff length of 0.04 mm (Figure 10). It has been observed from the surface roughness profiles that parts with maximum tensile strength are having minimum roughness over its surface. It should be noted that the FDM setup supports the filament having a high surface finish. The results of surface roughness testing suggested that the filament having less surface roughness and more mechanical strength could be more suitable for the 3D printing process.
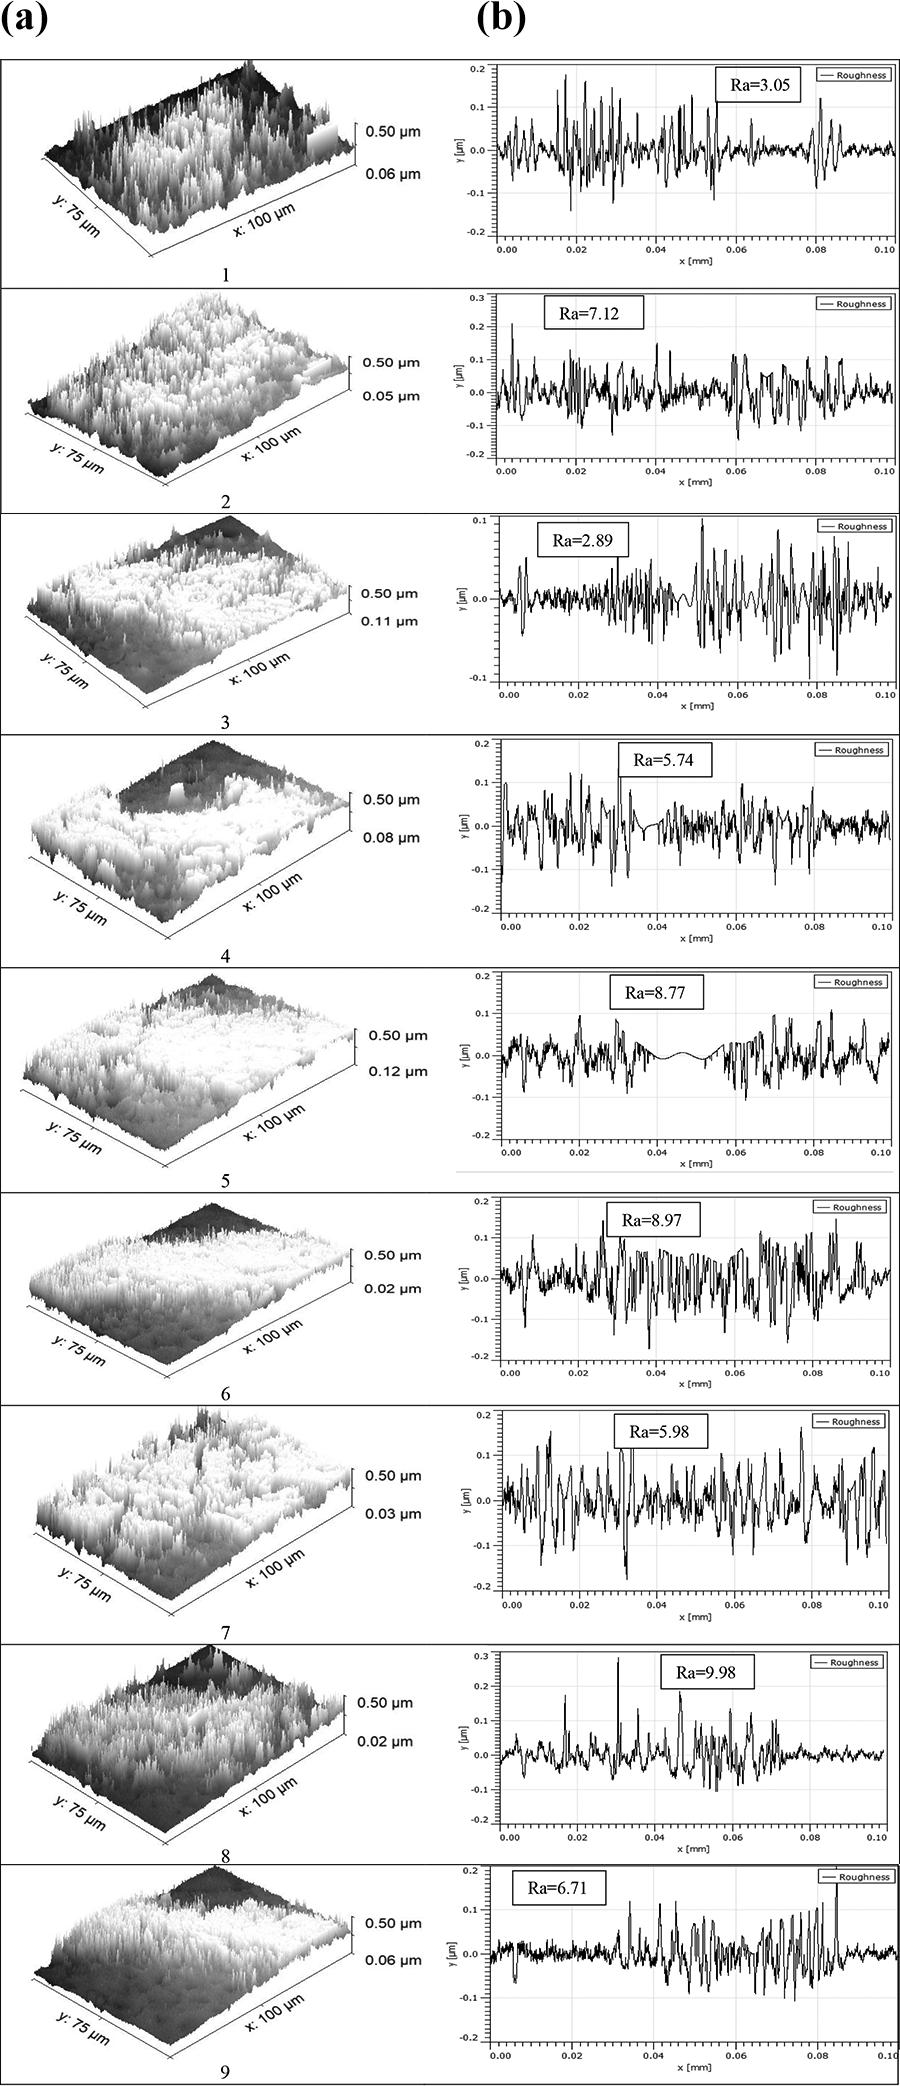
(a) 3D rendered images and (b) surface roughness profile of prepared filaments (as per Table 6).
The PVDF is known for its high thermal resistance, however, to study the effect of reinforced materials on the thermal properties of the polymer matrix, thermal analysis was performed. Thermal properties of the material play a very effective role for the use of material in a particular application. The results of mechanical testing suggested that the filament extruded at 180°C processing temperature, 60 r/min, and composition “B” has maximum tensile strength. For thermal analysis of the filaments, a DSC (Make: Mettler Toledo (Laboratory Analytical Instruments Mettler-Toledo India Private Limited, Mumbai, Maharashtra, India), Swiss with STARe (SW 14.00) software) was used. In this present study, two samples were prepared for thermal analysis; first sample was taken from the filament shown best mechanical strength, and the second sample was taken from the filament with the worst mechanical strength. Thermal analysis was performed in the presence of N2 gas.
Thermal graphs for two samples are shown in Figure 11. The curve 1 is for the filament with maximum tensile strength (prepared at 180°C processing temperature, 60 r/min and composition/proportion “B”), whereas curve 2 is of filament with poor mechanical properties (prepared as per settings suggested in Table 6). For thermal analysis, each sample faced two repetitive heating–cooling cycles by keeping the temperature range of 30°C to 250°C. The samples were heated at the rate of 10 K/min. As observed from curve 1, it clearly depicts that the melting of the material starts at 164°C and ends at 177°C. The melting point of composite material is 174°C and the solidification of the material starts at 146°C and ends at 140°C. Almost similar trend has been observed in the second cycle of heating and cooling. Thermal cycles for the curve 2 also show almost same values of the temperature for melting and solidification of the material. Hence, it is ascertained that the addition of Gr and BaTiO3 does not affect the liquification and solidification of the PVDF matrix even in CAMB. Moreover, the similar trends obtained from both cycles of thermal analysis justify the thermal consistency of the material.
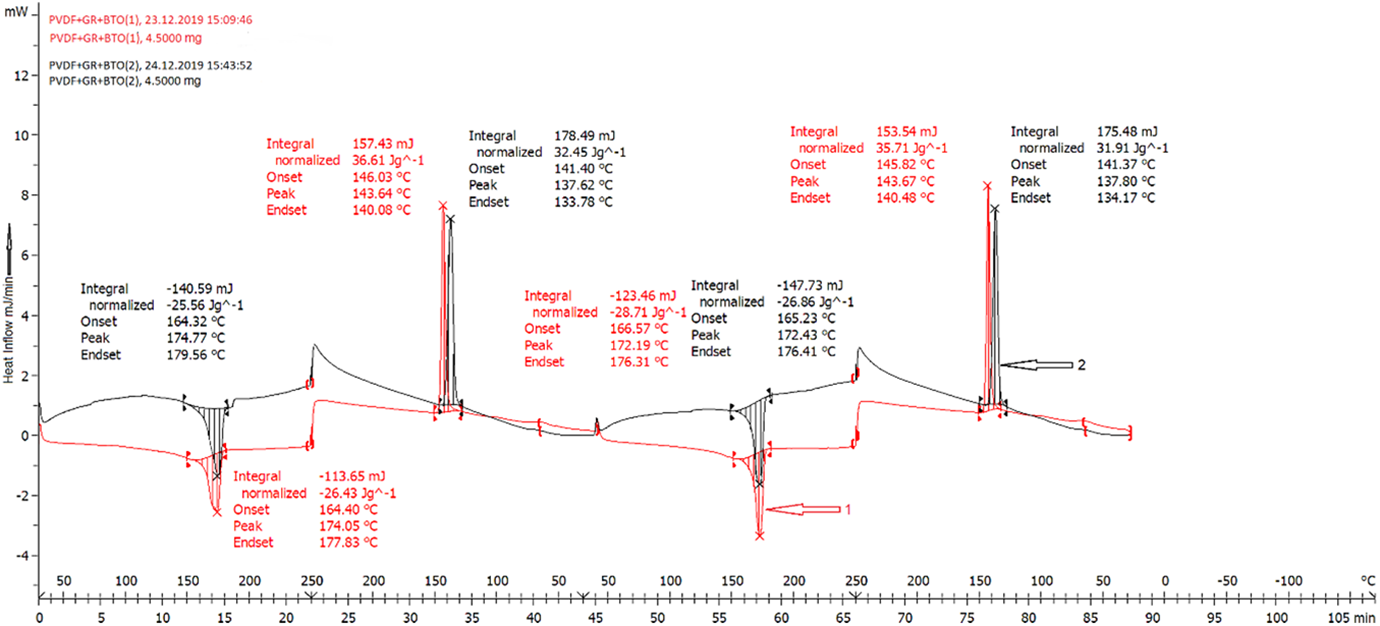
DSC graphs of composites developed as per the settings shown best and worst mechanical properties.
However, there is a difference in the energy absorption rate of both the samples. The curve 1 of the sample having more BaTiO3 absorbed 26.43 J/g energy, whereas the sample having minimum BaTiO3 absorbed less energy, that is, 25.56 J/g. However, the second thermal cycles of the samples show that both the samples absorbed more energy than their respective first thermal cycles. Thus, it represents that the developed smart polymer-based composite is not only thermally stable for its reusability but also acts as a thermodynamic sink.
Mechanical testing of 3D printed parts
To ensure whether the extruded filament runs smoothly on the low-cost open-source FDM, standard tensile specimens as per ISO 527–2 were fabricated. A total of nine specimens fabricated as parametric settings (with three repetitions) are provided in Table 8. The 3D printed parts were further subjected to destructive tensile testing on UTM. Results of tensile testing in the form of peak load (PL), break load (BL), PS, and BS are provided in Table 15. The stress–strain curves obtained from the mechanical testing of 3D printed tensile specimens are shown in Figure 12.
Output values of tensile strength of 3D printed parts.
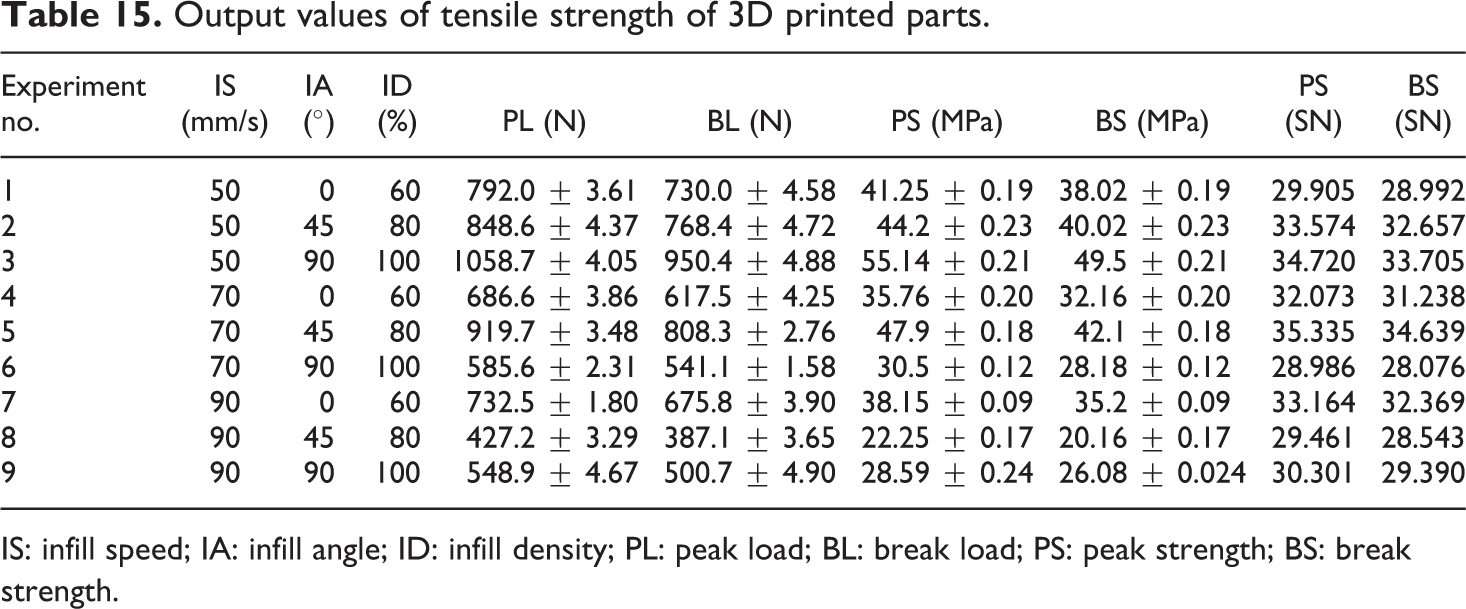
IS: infill speed; IA: infill angle; ID: infill density; PL: peak load; BL: break load; PS: peak strength; BS: break strength.
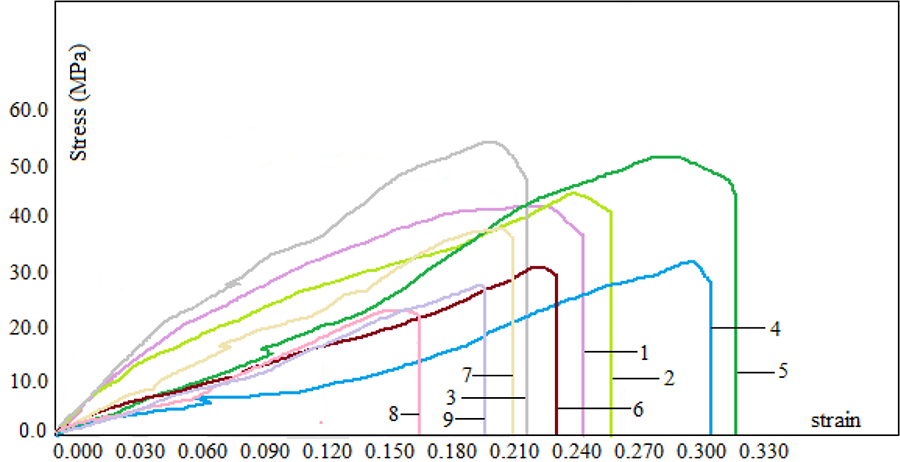
Stress–strain curves of tensile tested parts.
The output values of tensile testing show that the maximum PS was observed in the part fabricated at lowest IS (50 mm/s) and having maximum ID (100%) by depositing the material at 90° IA. It might be due to proper positioning of the material at lower speed and bonding might be also more at 100% ID. However, the part with worst mechanical properties was built as per experiment no. 8 (Table 8), in which IS was put as maximum and IA was kept 45° and having an intermediate level of ID. For these mechanical properties, the SN at larger the better type case is provided in Table 15. Further, to optimize the parametric settings of FDM for tensile strength of the printed parts, ANOVA for SN values of PS is provided in Table 16. As the probability (p) value of first and third parameter (IS and ID) is less than 0.05 (Table 16), these two parameters are significant at 95% confidence level. However, for second parameter (IA), the value of p is not less than 0.05, thus, found insignificant. Moreover, the value of residual error is only 1.71% of the total value, supporting that optimization model is significant.
Analysis of variance for SN ratios (PS).
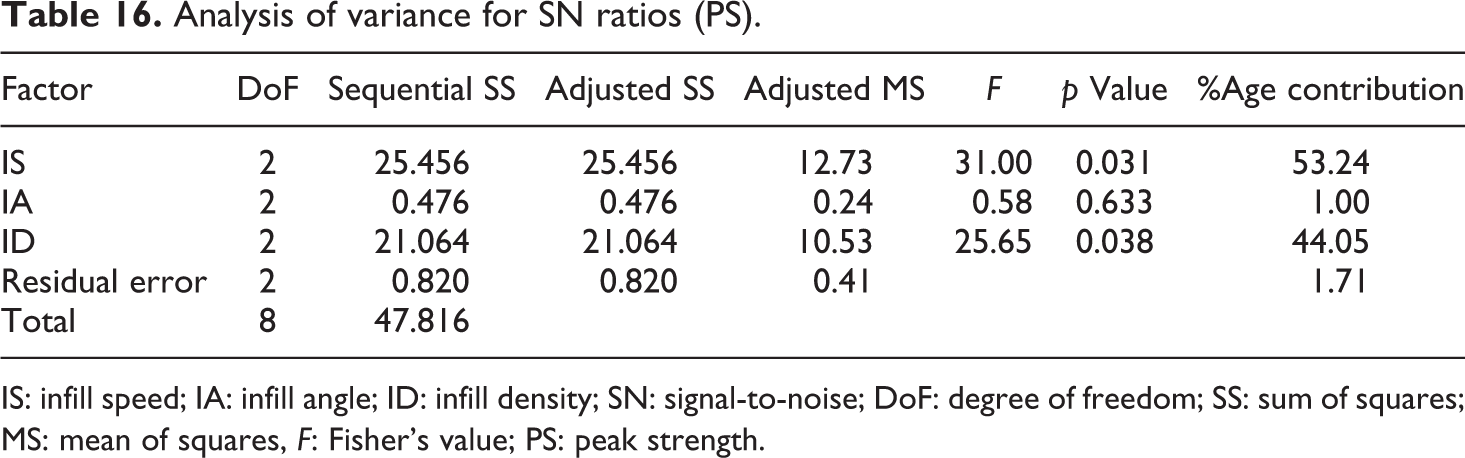
IS: infill speed; IA: infill angle; ID: infill density; SN: signal-to-noise; DoF: degree of freedom; SS: sum of squares; MS: mean of squares, F: Fisher’s value; PS: peak strength.
Based on Table 16, the rank table (Table 17) shows ranking of process parameters for SN values of PS. The main effect plot for SN is shown in Figure 13, which represents that the part printed at the first level of IS by keeping the IA 0° and 100% ID resulted into best mechanical properties.
Response table of input parameters for PS.
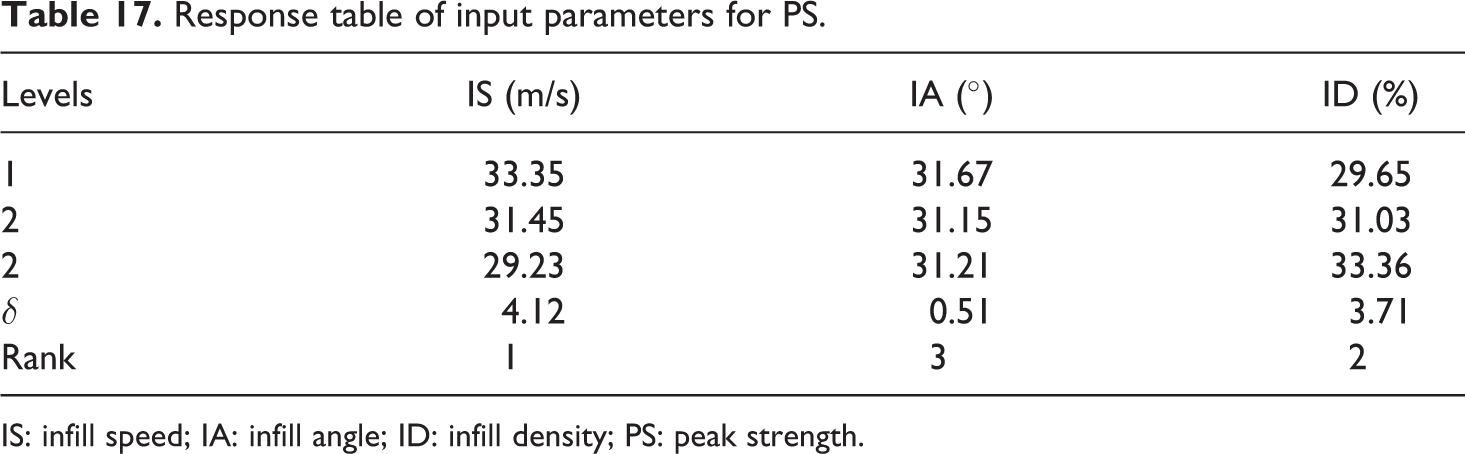
IS: infill speed; IA: infill angle; ID: infill density; PS: peak strength.
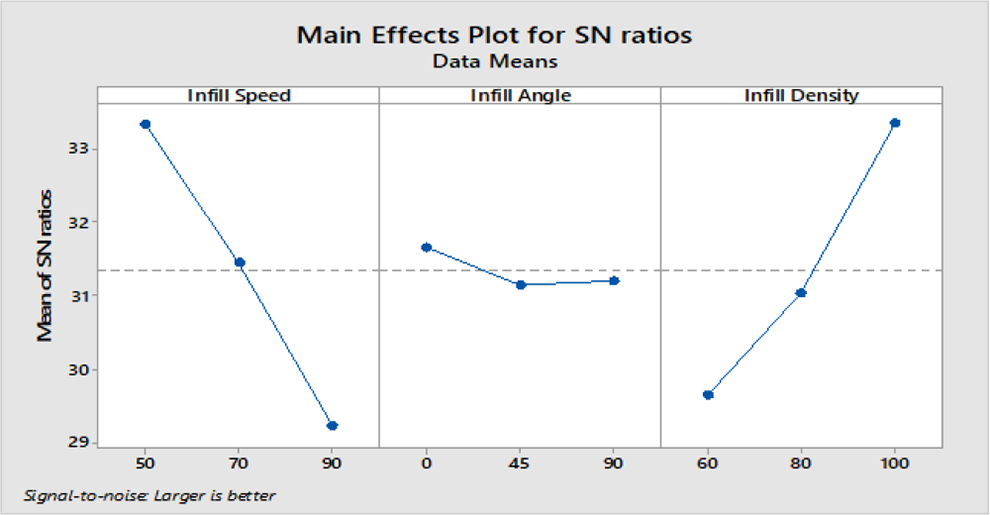
SN ratio graph for PS.
The SN values obtained (Table 17) have been further used for the prediction of optimized value using equation (5)

where RA, RB, and RC are the maximum values of IS, IA, and ID from Table 17 and R is the mean of SN values for PS.

After putting these values in equation (13)
Now,
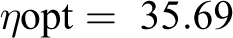
Three repetitive confirmatory experiments were conducted at proposed optimized settings, and the average value of PS was 62.78 MPa, which is very close to the calculated value, that is, 60.88 MPa.
The tensile properties of 3D printed parts of mechanically mixed composites were taken from our previously reported work 30 to compare it with the tensile properties of 3D printed parts of CAMB composites, fabricated under similar experimental conditions. From both cases, the values of PS were chosen for comparison (Figure 14).
Comparison of PS of 3D printed parts of mechanically and CAMB composites.
As observed from Figure 14 for experiment nos. 1, 2, 3, 5, and 7, PS is found more in parts made up from CAMB composites. But, for remaining experimental conditions (experiment nos. 4, 6, 8, and 9), the PS is found more in specimens of mechanically blended composites. Moreover, in both the cases, the parts printed as per experiment no. 3 has shown maximum tensile strength.
Conclusions
In this present research work, EAP-based matrix of PVDF was reinforced with BaTiO3 and Gr to prepare PBGC for the fabrication of a feedstock filament for FDM (for possible 4D applications). Based on the experimental results, followings are the outcomes of this present study: The significant improvement in rheological properties of CAMB-based PBGC was observed in comparison to mechanically blended samples. Hence, the CAMB-based PBGC can be used at higher production rate and for thin section fabrication. The results of ANOVA outline that as regards to PS and BS of feedstock filament (of CAMB based PBGC) is concerned, temperature has maximum contribution (73.63% and 77.37%) followed by screw speed (17.80% and 21.59%), whereas composition has been found insignificant. The feedstock filament having composition as PVDF (83%) + Gr (2%) + BaTiO3 (15%) and extruded at 180°C extruder temperature with screw speed 60 r/min has shown maximum PS and BS (43.00 and 38. 73 MPa, respectively). Filaments of CAMB composites show better results at low processing temperature. Further, for CAMB-based PBGC, the dimensional measurements resulted into controlled process, which was at par with the mechanically blended samples. The photomicrographs captured with metallurgical microscope concluded that the feedstock filament with best mechanical properties is also having minimum porosity (1.53%) and least surface roughness (Ra = 2.89) among all the extruded filaments. Further, thermal analysis performed on the filaments obtained from DSC analysis illustrated the thermal consistency of the developed composite over two thermal cycles. The results of ANOVA for 3D printed parts outlined that the specimen fabricated at 50 mm/s IS, 0° IA at 100% ID has better mechanical properties (PS 62.78 MPa). The IS contributed 53.24% followed by ID 44.05% and IA was found insignificant at 95% confidence level. The comparison of 3D printed CAMB-based PBGC with mechanically blended composite outlines that more tensile strength was observed for CAMB composites at best parametric settings. In the present study, no comparison has been made for piezoelectric property of CAMB-based PBGC. Further study may be conducted for the effect of piezoelectric coefficient or piezoelectric modulus, d33, to quantify the volume change when a piezoelectric material is subject to an electric field.
Footnotes
Acknowledgments
The authors are thankful to Thapar Institute of Engineering and Technology, Patiala, Guru Nanak Dev Engineering College, Ludhiana, and National Institute of Technical Teachers Training and Research, Chandigarh, for providing technical support in this research. Further, the financial support by AICTE New Delhi, File No. B-230/RIFD/RPS (POLICY-1)/2018-19, is gratefully acknowledged.
Funding
The author(s) received no financial support for the research, authorship, and/or publication of this article.