
Abstract
The zinc oxide (ZnO)-reinforced polylactic acid (PLA) matrix has established shape memory characteristics. But hitherto little has been reported on two-way programmed 3D-printed ZnO-reinforced PLA functional prototypes (prepared on commercial fused deposition modelling (FDM) set-up). This article reports the effect of 3D printing process parameters on tensile, thermal, morphological and two-way programmed shape memory characteristics of ZnO-reinforced PLA-based functional prototypes. It has been ascertained that the maximum strength at peak (14.32 MPa) and maximum strength at break (12.89 MPa) were observed for sample printed at 80% infill density, four number of perimeters with triangular pattern. Maximum Young’s modulus (233.68 MPa) was observed for samples printed at 80% infill density and three perimeters with honeycomb pattern. Also, the maximum modulus of toughness (0.883 MPa) was observed in case of sample printed at 80% infill density, five perimeters with rectilinear pattern. Further based upon thermal analysis using differential scanning calorimetry, it has been ascertained that there is no significant effect of FDM process parameters on normalized heat capacity of functional prototype. As regards to two-way programmed specimens, it has been observed that the porosity of functional prototypes increase with 30 min immersion in water as stimulus at 70°C and it again decreases (regain) after 30 min exposure at atmospheric temperature. Contrary to this, the samples’ porosity values decrease with 30 min immersion in water at 10°C and regain after 30 min exposure at atmospheric temperature. Further some effect of shape memory has been noticed on functional prototypes volume and weight at two different temperatures.
Keywords
Introduction
In the past two decades, significant improvements in additive manufacturing (AM) processes resulted into cost-effectiveness and competitiveness 3D printing in comparison with traditional manufacturing processes. Moreover, high output of AM processes enables new workflows for customized, improved as well as new product designs. The relatively low cost/temperature sustainable thermoplastics (such as acrylonitrile butadiene styrene (ABS), polylactic acid (PLA) and nylon) as well as higher cost/temperature sustaining thermoplastics (such as polycarbonate and polyphenylsulphone) are frequently used in various engineering applications.1,2 PLA is currently one of the most favourable biodegradable and biocompatible materials. PLA can be produced from renewable resources and is being used in many applications such as packaging, biomedical and tissue engineering. But PLA needs some modifications for the improvement of mechanical and thermal properties. The present scenario uses nano/microfillers as a reinforcement material in PLA and polymers in general, which helps for the improvement of mechanical as well as thermal properties.3,4 Some of the most important inorganic metal oxide nanofillers reported in literatures are aluminum oxide, titanium dioxide, silicon oxide, zinc oxide (ZnO) and so on,5,6 among which the ZnO is the subject of the present survey as reinforcement for the PLA matrix.
Some studies have reported that, with the addition of ZnO (wt%) in the form of nanofibers led to lowering the thermal stability of PLA and also causes a significant increase of overall crystallinity of the nanocomposite. 7 It has been observed that the ZnO nanoparticles possess good polarity; it is difficult to make it uniformly dispersible in organic polymeric media. So proper synthesis methods must be adopted for higher mode of dispersion and for getting superior properties. Some morphology investigations (based upon scanning electron microscopy) have been used for the understanding of characteristics in case of both nanoparticle and the nanocomposite.8,9
Commercially twin-screw extrusion (TSE) has been used in different studies for reinforcement of metallic/non-metallic/ceramic fillers in polymer matrix mainly for tailor-made applications. The commonly controlled process parameters are material composition, rotational speed of TSE, die temperature of TSE, particle grain size and applied load on TSE. The reported studies reveal that the mechanical, thermal and metallurgical properties of feedstock filaments prepared by TSE have been optimized. Finally, best feedstock filament wire (in terms of mechanical/thermal/morphological properties) for the fused deposition modelling (FDM) set-up has been prepared.10,11 Some studies outlined that process parameters of TSE have significant effect on the mechanical properties (such as tensile strength, tensile modulus, flexural strength, flexural modulus and impact strength) of reinforced polymer matrix. 12
Some researchers outlined that the FDM input parameters (such as infill pattern, density, angle and speed) play a significant role in case of printed sample/specimen of conductive ABS/ZnO for mechanical as well as electrical characteristics. It has been observed that line pattern performed better than rectilinear (while printing with FDM), especially for mechanical properties (such as tensile strength and Young’s modulus) and electrical conductivity. Also, dynamic storage modulus was reported to be improved with the increase of infill density parameter of 3D printer from 50% to 100%. 13 Optimization of the FDM process parameters has been found to be the one of the best option for improvement of mechanical properties of the 3D-printed components. 14 The ABS composite with reinforcement of ZnO composites has been fabricated with FDM and it has been observed that precoated fillers and increase of infill density improve the tensile strength, Young’s modulus and hardness of the composites. But infill pattern only affects the tensile properties significantly; it has no significant effect on the hardness of printed parts/samples. 15 The input parameters of FDM such as infill density and pattern significantly influence the mechanical properties of 3D-printed part/samples. It has been observed that change in infill density mainly affect the tensile strength. The combination of a rectilinear pattern in a 100% infill density shows the higher impact on tensile strength, with a value of 36.4 MPa, which is less than 1% from raw ABS material. 16
The mechanical properties (such as tensile strength at peak, tensile strength at break, elongation at peak, elongation at break and Young’s modulus) varied depending on the nature and proportion of ZnO in thermoplastic matrix. 17 It has been reported that the reinforcement of ZnO in polystyrene has decreased the tensile strength slightly as compared to virgin polystyrene. The main reason behind this was reported as the less interfacial adhesion of ZnO with thermoplastic matrix. But Young’s modulus increased significantly at 5 wt% of ZnO and this enhancement was explained on the basis of high resistance. 18 It has been observed that the increase of reinforcement of ZnO (wt%) in ABS helps to increase of tensile strength of 3D-fabricated specimen/samples. Also, the dynamic storage modulus of the conductive ABS-ZnO composite increases with the addition of ZnO filler and higher loss modulus was observed on samples with ZnO filler. Some study also reveals that the thermal conductivity increases from 0.2204 W/mK to 0.3508 W/mK with the increase of reinforcement concentration up to 14 wt% due to the formation of conductive network among fillers within the polymer matrix. 19 The ZnO nanoparticles reinforcement in PLA improves the mechanical properties of the composite. It has been observed that Young’s modulus has been increased from 2310 MPa to 2780 MPa for ZnO of 1 wt% in composite. Also, it has been reported that rod-shaped ZnO nanoparticles could serve as effective constraining elements reducing physical aging kinetics of PLA when is used at ambient temperatures. 20 Various input parameters (infill density, layer thickness, shell thickness, print speed, etc.) were reported to be responsible for the significant change in mechanical strength and dimensional accuracy of the printed thermoplastic specimens. 21
The ZnO-reinforced PLA matrix has established shape memory characteristics. 22 Some researchers have outlined the concept of programming (such as one way and two ways) for shape memory polymers.23–26 The studies reported that reinforcement of the metallic/non-metallic particles into the PLA matrix can modify the mechanical, thermal and morphological properties.27–29 Some of the studies have suggested that particle reinforcement can be useful in thermoplastic recycling, scaffolds preparation and repair activities.30–32 In one of the study, it has been established that ZnO reinforcement can tune the thermal, shape memory and mechanical properties of PLA thermoplastic. 33 But hitherto little has been reported on two-way programmed 3D-printed ZnO-reinforced PLA functional prototypes (prepared on commercial FDM set-up). This article reports the effect of FDM printing process parameters on tensile, thermal, morphological and two-way programmed shape memory characteristics of ZnO-reinforced PLA-based functional prototypes.
Materials and methods
In this study, feedstock filament was prepared for FDM by reinforcing ZnO nanoparticle (2.0 wt%) in PLA by using TSE (at extrusion temperature 170°C, torque 0.2 Nm and 10 kg load) at first stage followed by 3D printing of specimens for tensile testing. Figure 1 shows the process flow diagram for the present study.
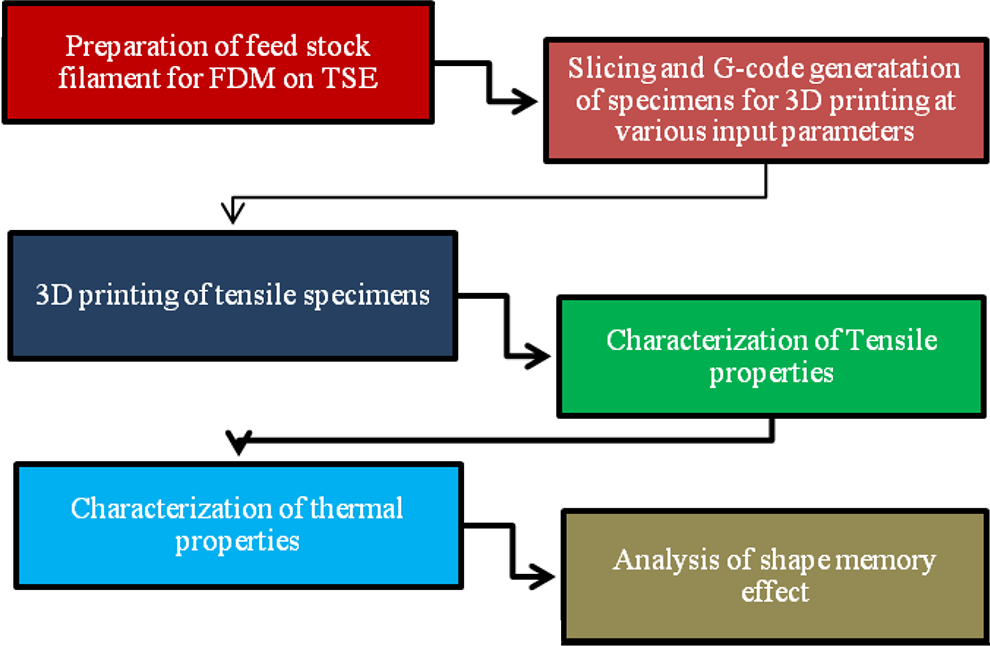
Process flow for the present study.
The TSE was used for the fabrication of feedstock filament for 3D printing of tensile specimens as per ASTM D 638 standard. 34 The 3D-printed tensile specimens were tested to understand the tensile characteristics (such as strength at peak, strength at break, peak elongation, break elongation, percentage peak elongation, percentage break elongation, modulus of toughness and Young’s modulus). Thermal analysis and shape memory analysis were performed to understand the thermal properties and effect of water as stimulus on shape memory effect of 3D-printed specimens.
Experimentation
In this study, ZnO (2.0 wt%) in PLA was used for the preparation of feedstock filament for 3D printing of tensile specimens. It should be noted feedstock filament diameter as 1.75 ± 0.05 mm was used on available FDM set-up. Figure 2 shows the extrusion of wire from TSE and a sample of prepared filament. The dimensions of tensile specimens for printing are shown in Figure 3.
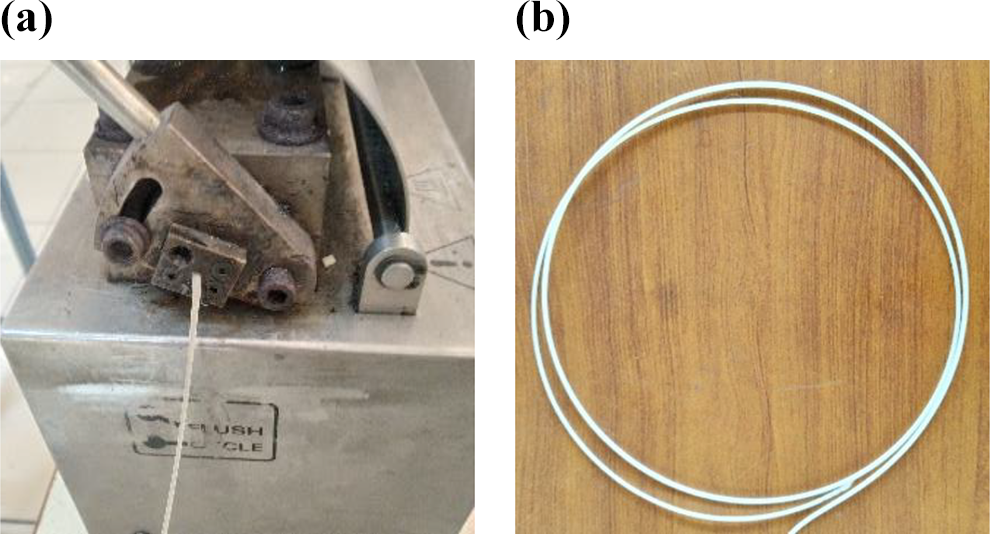
Extrusion of wire from TSE (a) and sample of FDM feedstock filament (b).
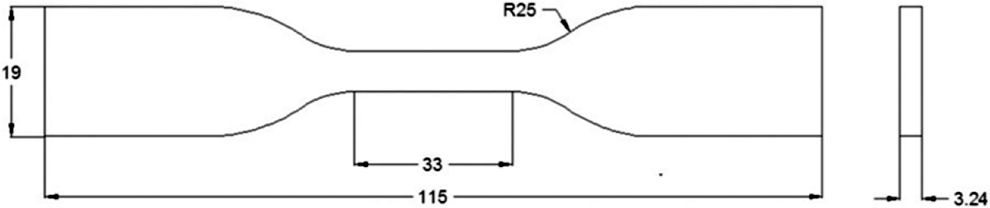
Tensile specimen dimensions (mm).
To study the tensile properties (such as strength at peak, strength at break, peak elongation, break elongation, percentage peak elongation, percentage break elongation, modulus of toughness and Young’s modulus), universal testing machine (Shanta Engineering, Pune, India) of 5000 N capacity has been used. Three-dimensional printing of specimens of tensile test was performed by varying different printing parameters (Table 1). To optimize the printing conditions for tensile properties of functionally graded printed part design of experiment based upon Taguchi L9 orthogonal array has been used as presented in Table 2.
Variable and fixed input parameters of FDM.a
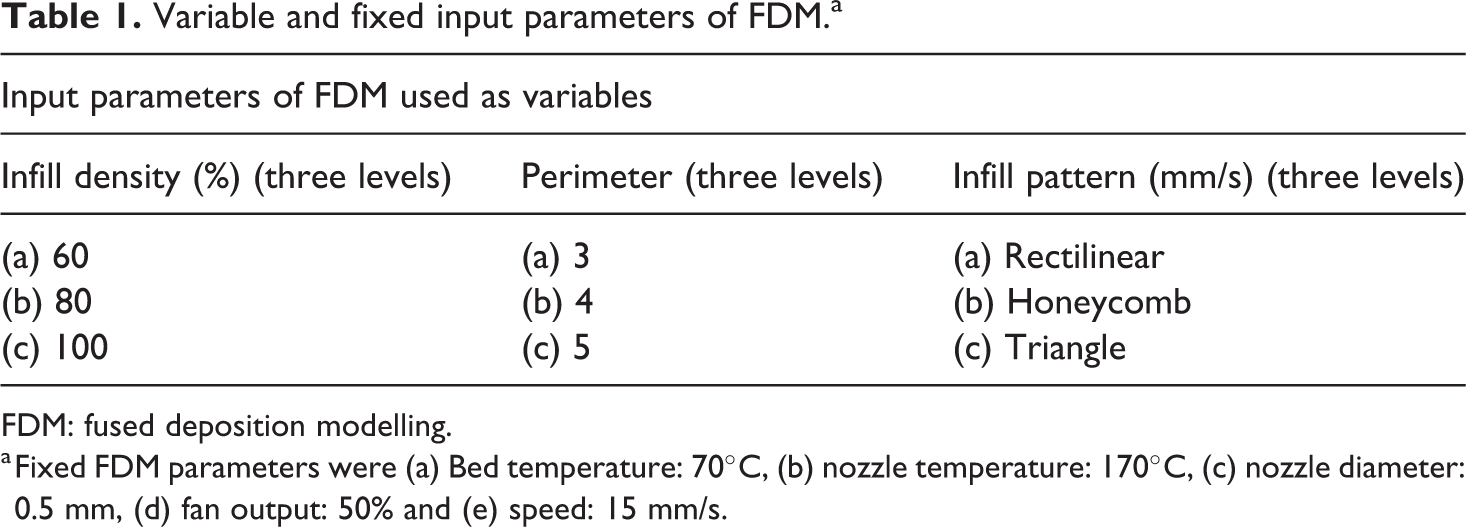
FDM: fused deposition modelling.
a Fixed FDM parameters were (a) Bed temperature: 70°C, (b) nozzle temperature: 170°C, (c) nozzle diameter: 0.5 mm, (d) fan output: 50% and (e) speed: 15 mm/s.
DOE based on Taguchi L9 OA.
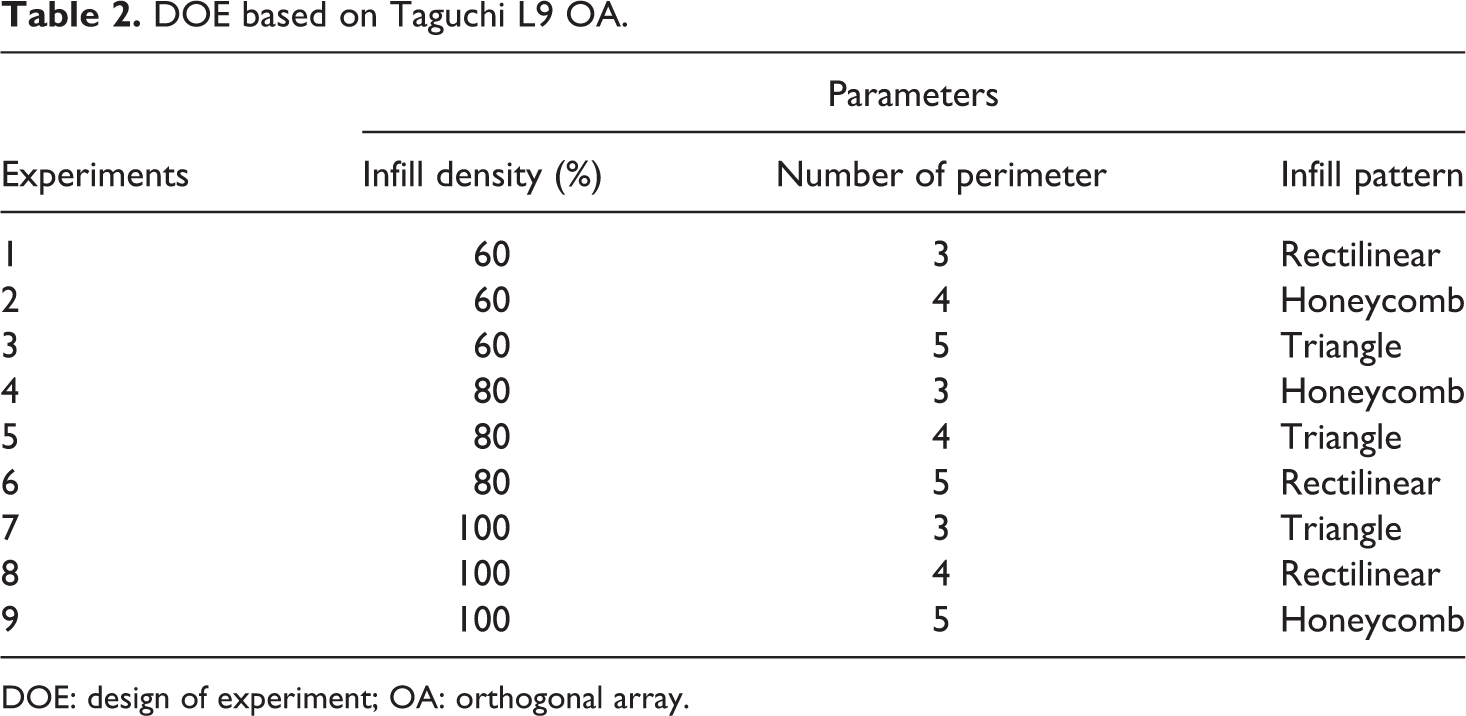
DOE: design of experiment; OA: orthogonal array.
The setting of input variables in slicing of the 3D model of tensile specimen was performed with the help of slicing software (Slicer3r). Based upon Table 2, the patterns with different parameters and infill densities are shown in Figure 4.
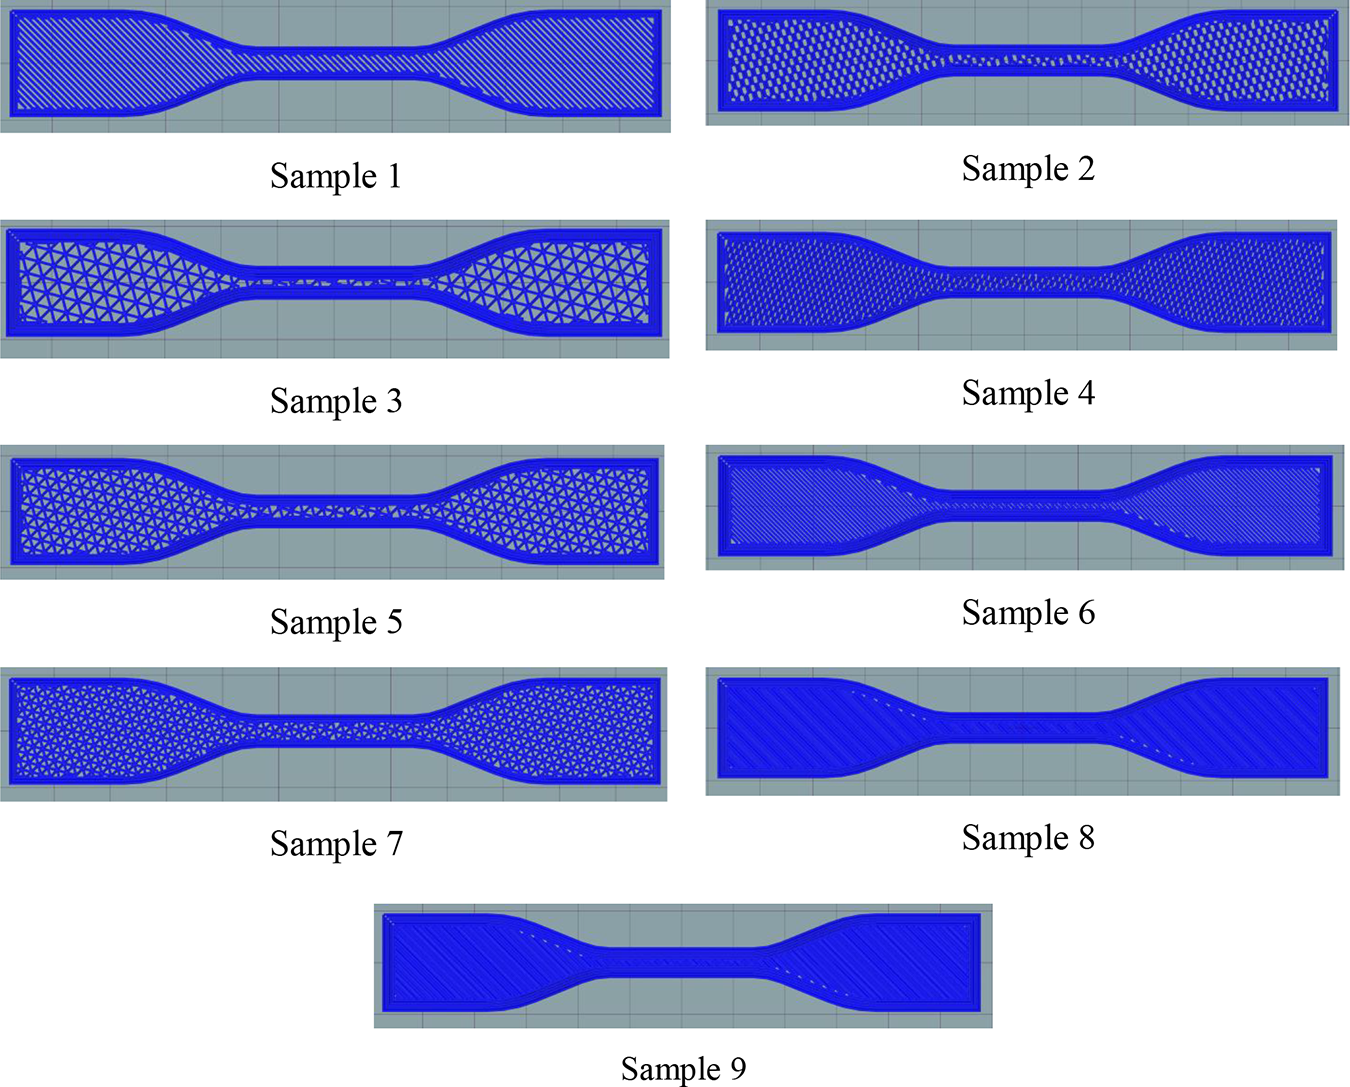
Slicing of tensile specimens (as per Table 2).
Figure 5 shows actual 3D printing of tensile specimens and finally printed specimen. The 3D-printed tensile specimens after tensile test are shown in Figure 6.
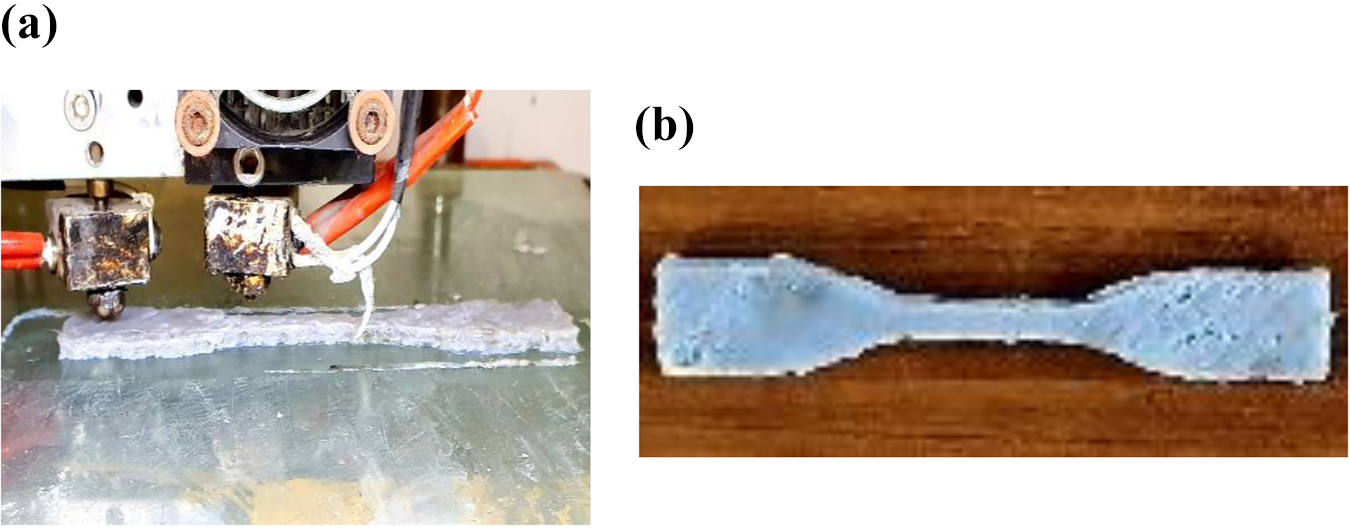
3D printing of tensile test specimen (a) and 3D-printed tensile test specimen (b).
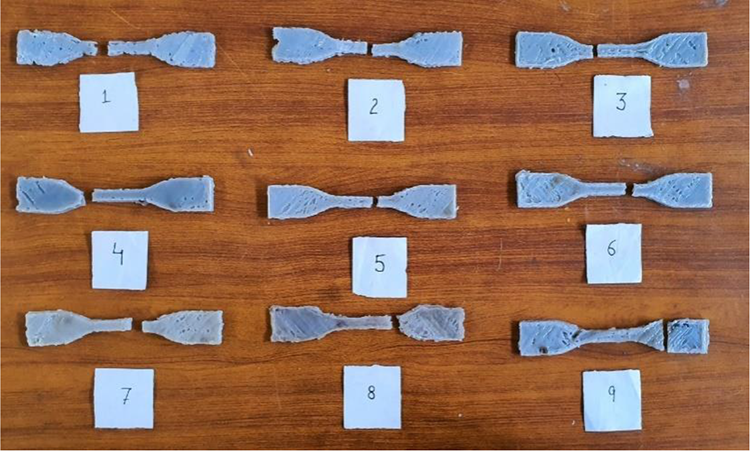
Tensile specimens after testing.
Results and discussion
Mechanical properties characterization
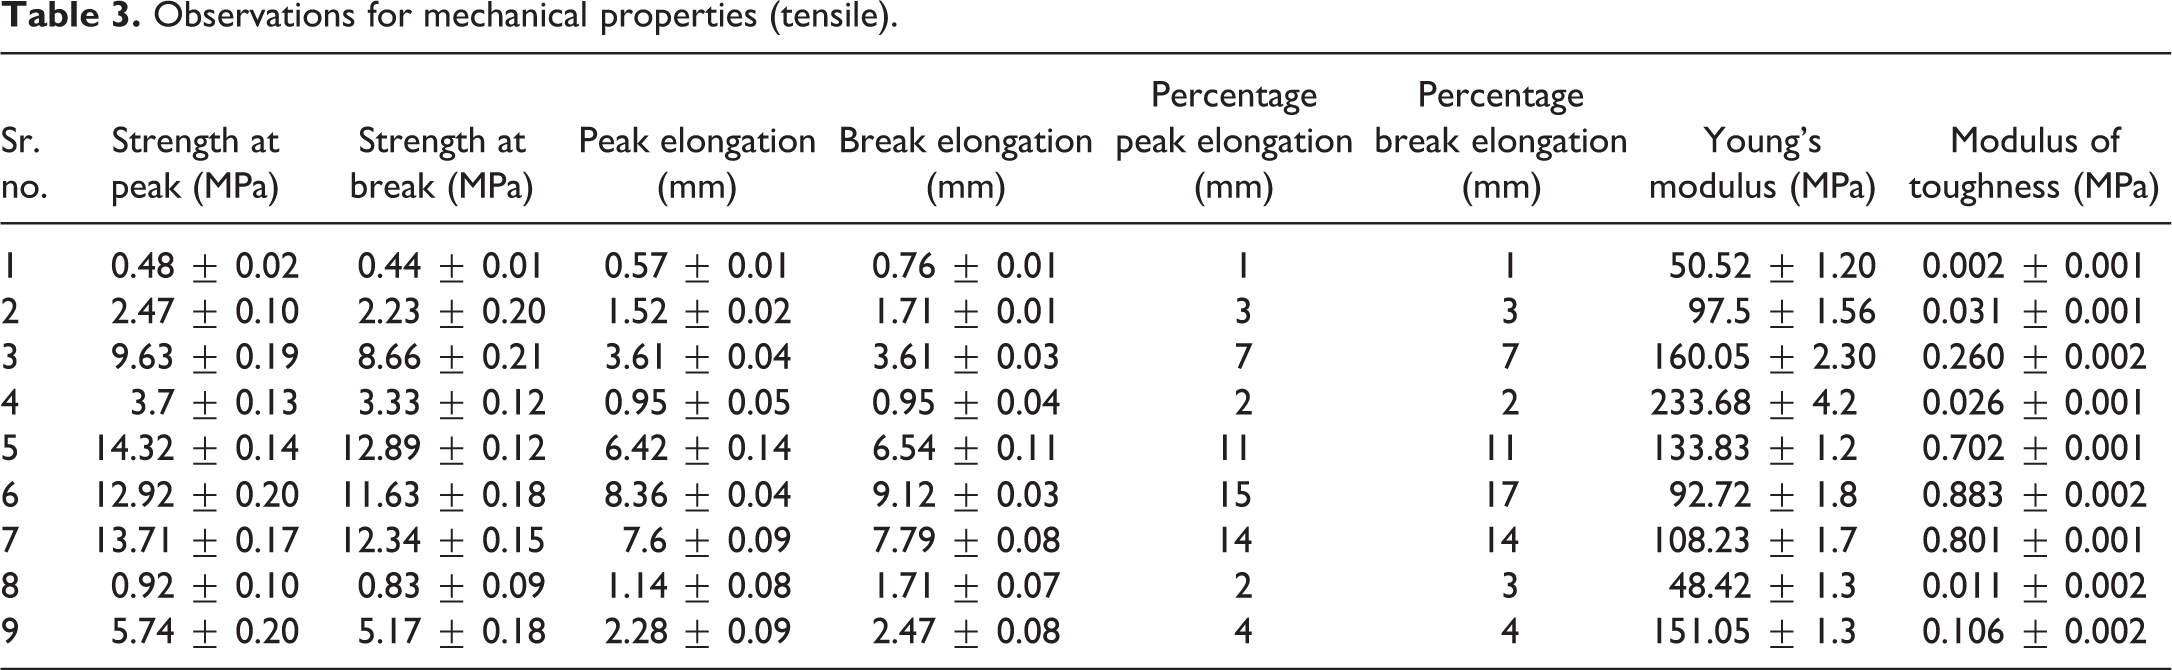
Table 3 and Figure 7 show the observed results of tensile test on all nine samples (with three repetitions) in term of tensile properties (such as strength at peak, strength at break, peak elongation, break elongation, percentage peak elongation, percentage break elongation, modulus of toughness and Young’s modulus). It has been observed from Table 3 and Figure 7 that the pattern, density and perimeter play a significant role on the tensile properties of specimens. In case of rectilinear pattern specimens, the maximum strength at peak (12.92 MPa), maximum strength at break (11.63 MPa), maximum Young’s modulus (92.92 MPa) and maximum modulus of toughness (0.883 MPa) were observed in sixth specimen printed with 80% infill density and five perimeters. In case of triangle pattern specimens, the maximum strength at peak (14.32 MPa), maximum strength at break (12.89 MPa), Young’s modulus (133.83 MPa) and modulus of toughness (0.702 MPa) were observed in fifth specimen with 80% infill density and four perimeters. In case of honeycomb pattern specimens, the maximum strength at peak (5.74 MPa), maximum strength at break (5.17 MPa) and maximum modulus of toughness (0.106 MPa) were observed in ninth specimen with100% infill density and five perimeters. The results are in line with other investigators.31–33
Observations for mechanical properties (tensile).
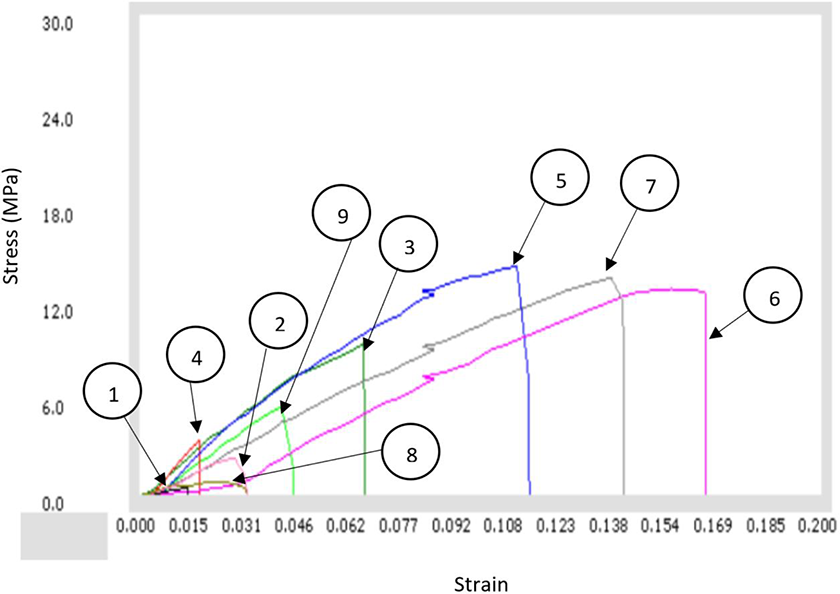
Stress versus strain curve (as per Table 3).
Optimization of process parameters
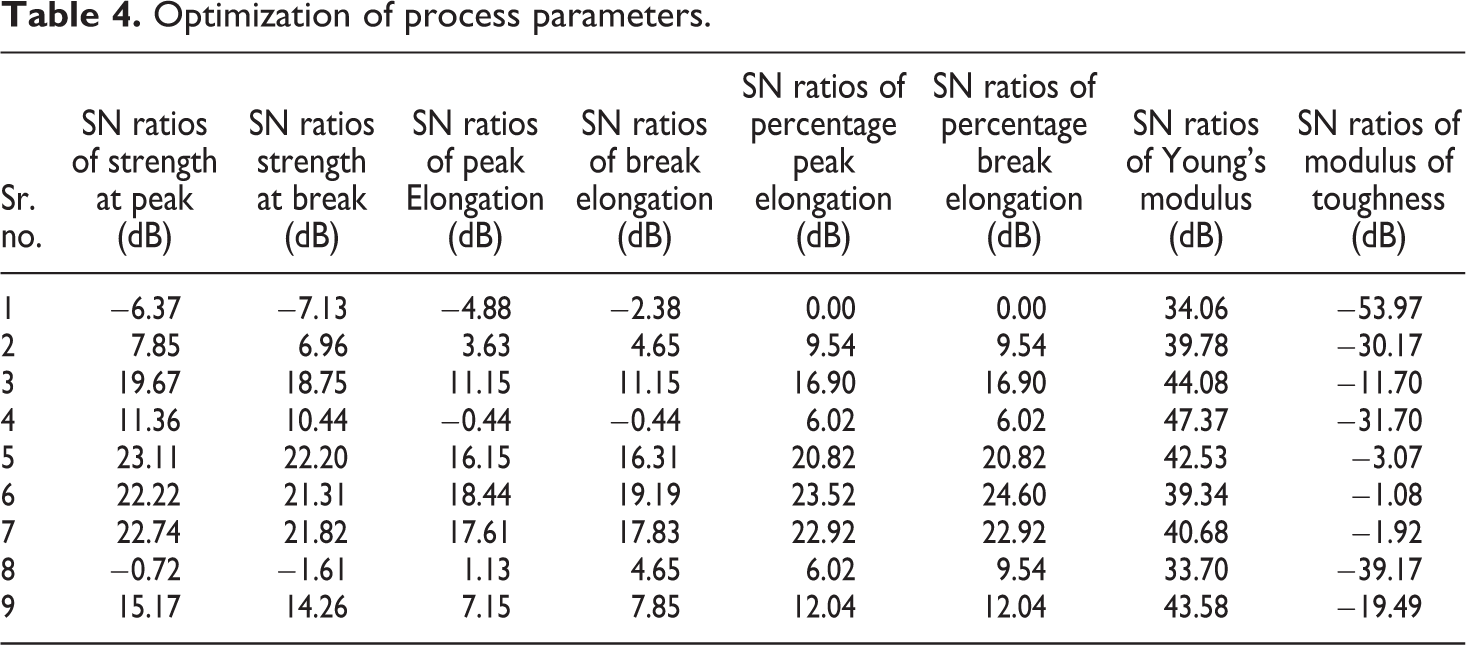
For optimization of the input parameters signal to noise (SN) ratio has been calculated as presented in Table 4. The SN ratio for large is better type case has been calculated as follows:
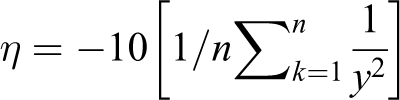
where ‘η’ is the SN ratio, ‘n’ is the number of experiment and ‘y’ are the material properties at experiment number k. Based upon Table 3, Table 4 presents the SN ratios for different selected parameters.
Optimization of process parameters.
SN: signal to noise.
Based on Table 4, Figure 8 shows the main effects plots of SN ratio on tensile properties. The analysis of variance (ANOVA) was conducted (Table 5) for various SN ratios of tensile test (as per Table 4). Based upon Table 5, Table 6 presents ranking table for SN ratios of strength at peak. It has been ascertained (Table 6) that the infill pattern is ranked 1, infill density is ranked 2 and perimeter is ranked 3 for strength at peak. The ANOVA results for SN ratios of other responses and ranking tables are presented in Online Appendix I (Supplementary Tables S7–S20).
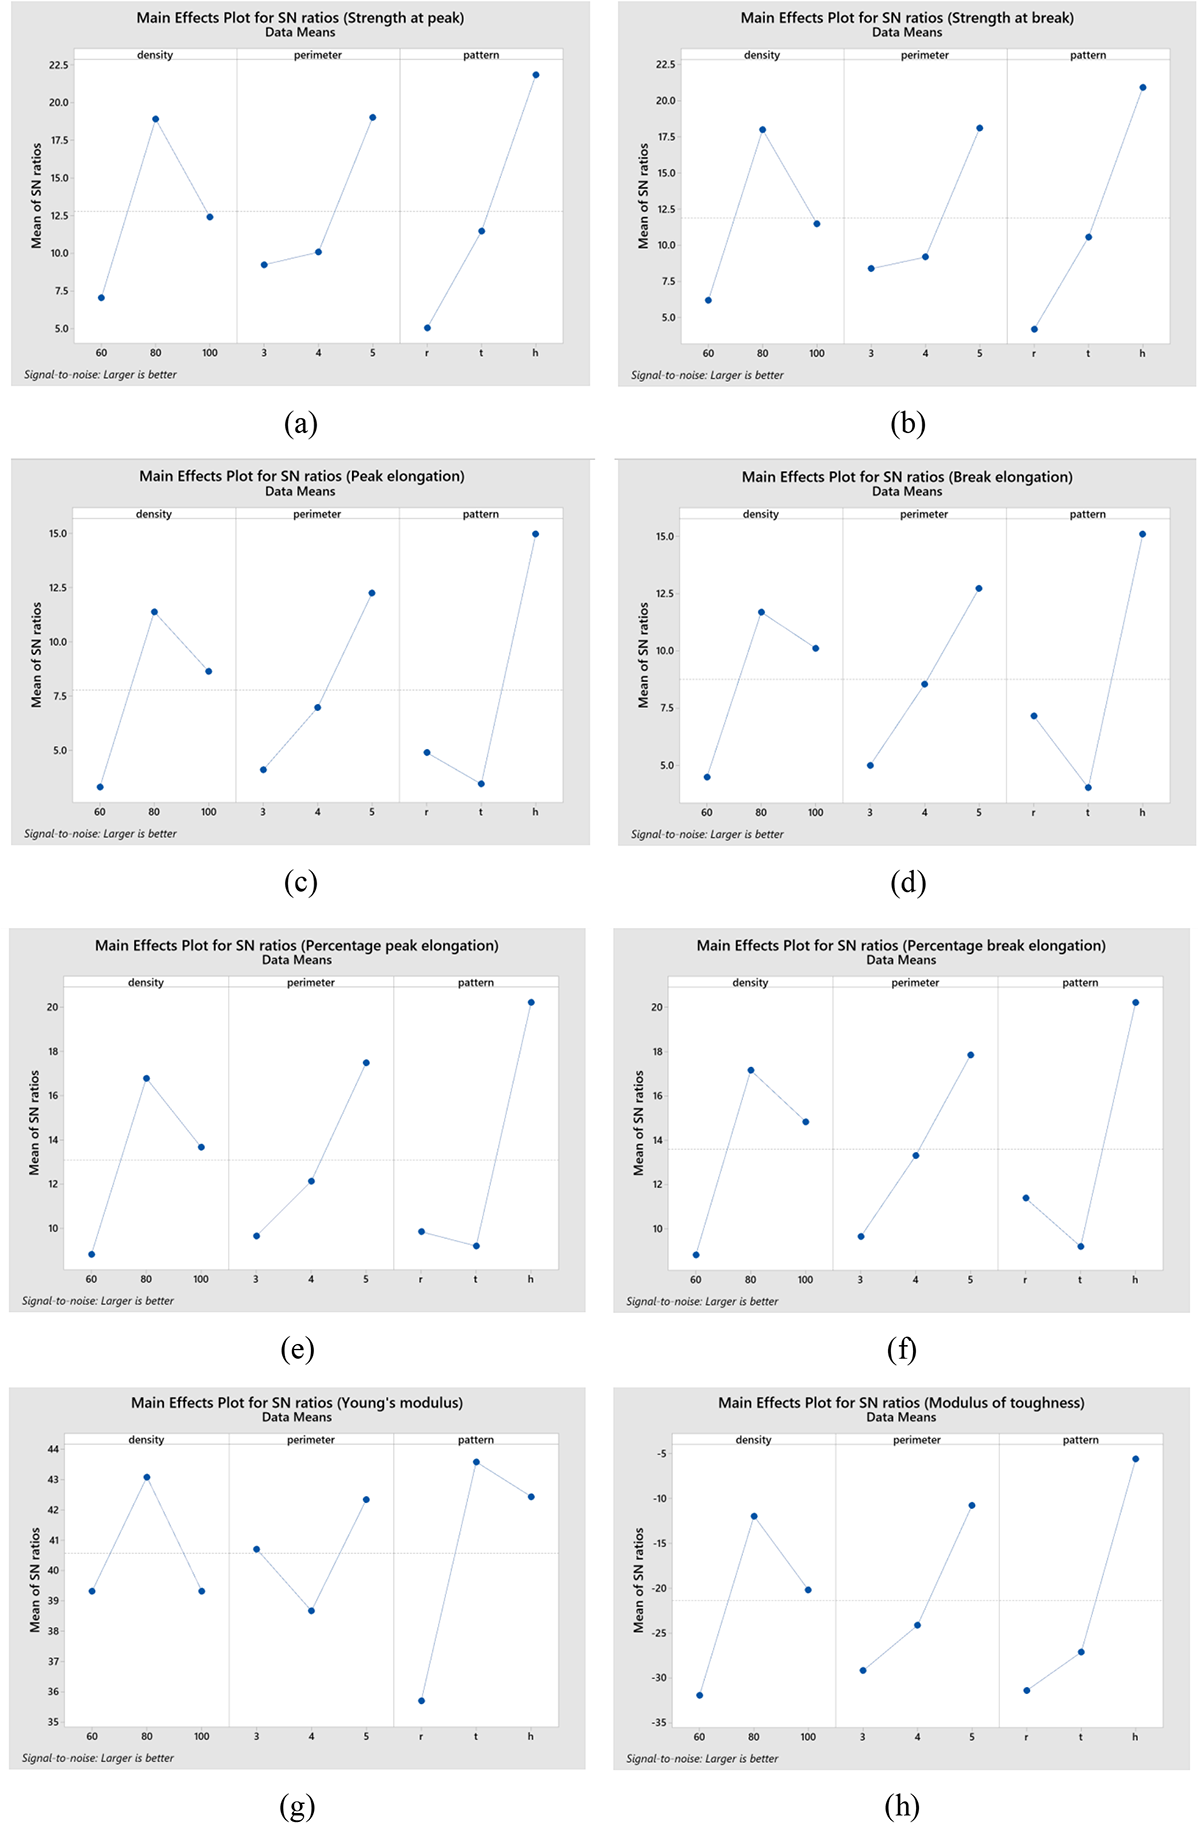
Main effects plots of SN ration on tensile properties (a) strength at peak, (b) strength at break, (c) peak elongation, (d) break elongation, (e) percentage peak elongation, (f) percentage break elongation, (g) Young’s modulus and (h) modulus of toughness.
ANOVA for SN ratios of strength at peak.
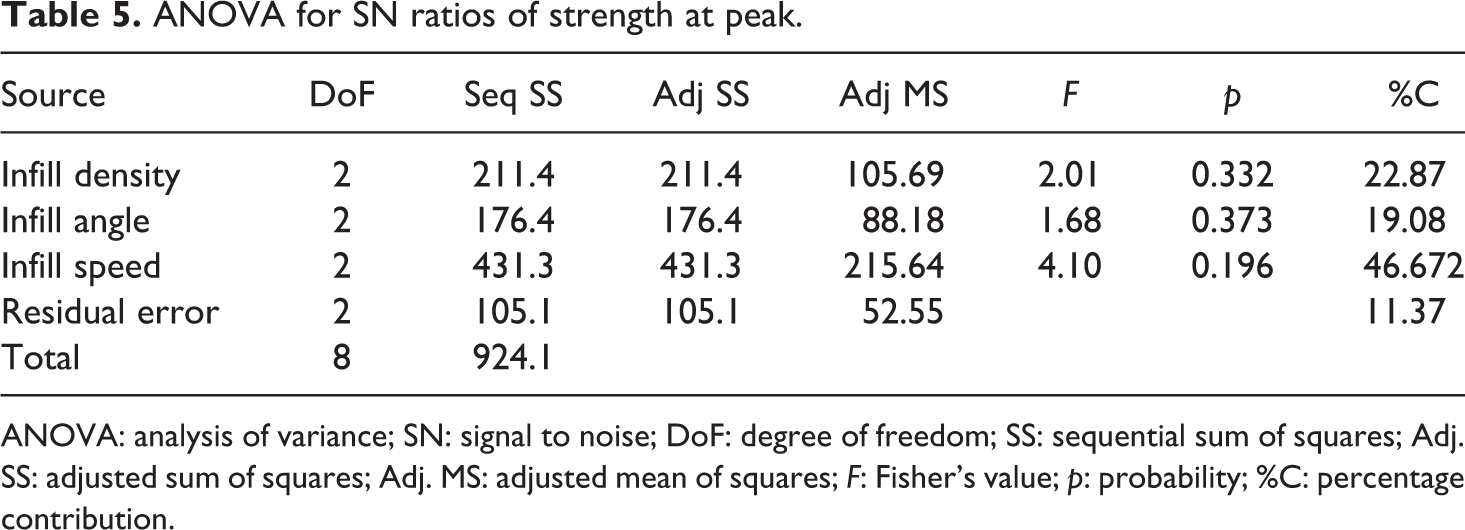
ANOVA: analysis of variance; SN: signal to noise; DoF: degree of freedom; SS: sequential sum of squares; Adj. SS: adjusted sum of squares; Adj. MS: adjusted mean of squares; F: Fisher’s value; p: probability; %C: percentage contribution.
Ranking table for SN ratios of strength at peak.
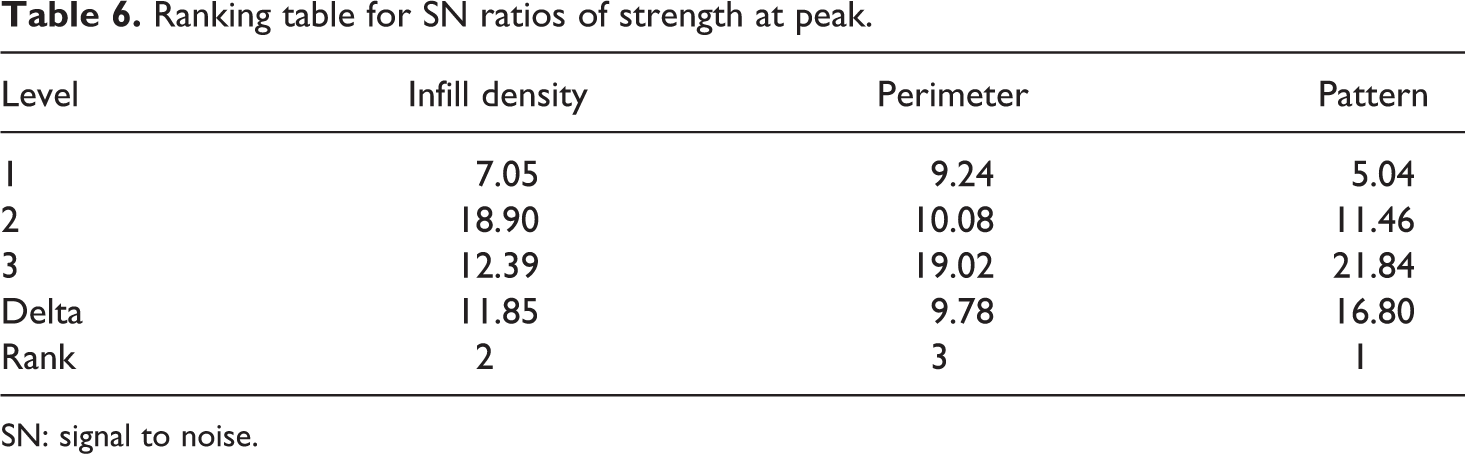
SN: signal to noise.
As observed from Tables 5 and 6 and Online Appendix I of Supplementary Tables S7–S20, for almost all output parameters, no input parameters are significant as p > 0.05 (at 95% confidence level), so various models (such as linear and two-factor integration (2FI) models) were applied on the outputs with design expert-12 software with historical data approach (Online Appendix II, Supplementary Tables S21–S28). Based on Supplementary Tables S21–S28, final equations in term of input parameters are given as follows:
Strength at peak (for linear model) = 7.09889 + 1.73333 × infill density + 3.89 × pattern
Strength at break (for linear model) = 6.39111 + 1.55833 × infill density + 3.49833 × pattern
Peak elongation (for 2FI model) = 3.02667 + 0.855 × infill density + 1.26 × pattern + 0.868333 × infill density × perimeter −2.945 × infill density × pattern
Break elongation (for 2FI model) = 3.32 + 0.95 × infill density + 1.05833 × pattern + 0.796667 × infill density × perimeter −3.135 × infill density × pattern
Percentage peak elongation (for 2FI model) = 5.33333 + 1.5 × infill density + 2.33333 × pattern + 1.83333 × infill density × perimeter −5.25 × infill density × pattern
Percentage break elongation (for 2FI model) = 5.66667 + 1.83333 × infill density + 1.83333 × pattern + 1.83333 × infill density × perimeter − 5.75 × infill density × pattern
Young’s modulus (for linear model) = 119.556 + 1.89833 × infill density + 35.075 × pattern
Modulus of toughness (for 2FI model) = 0.248 + 0.07 × infill density + 0.1445 × pattern + 0.0983333 × infill density × perimeter −0.3555 × infill density × pattern
Figure 9 shows cube plots for understanding the interaction of input parameters.
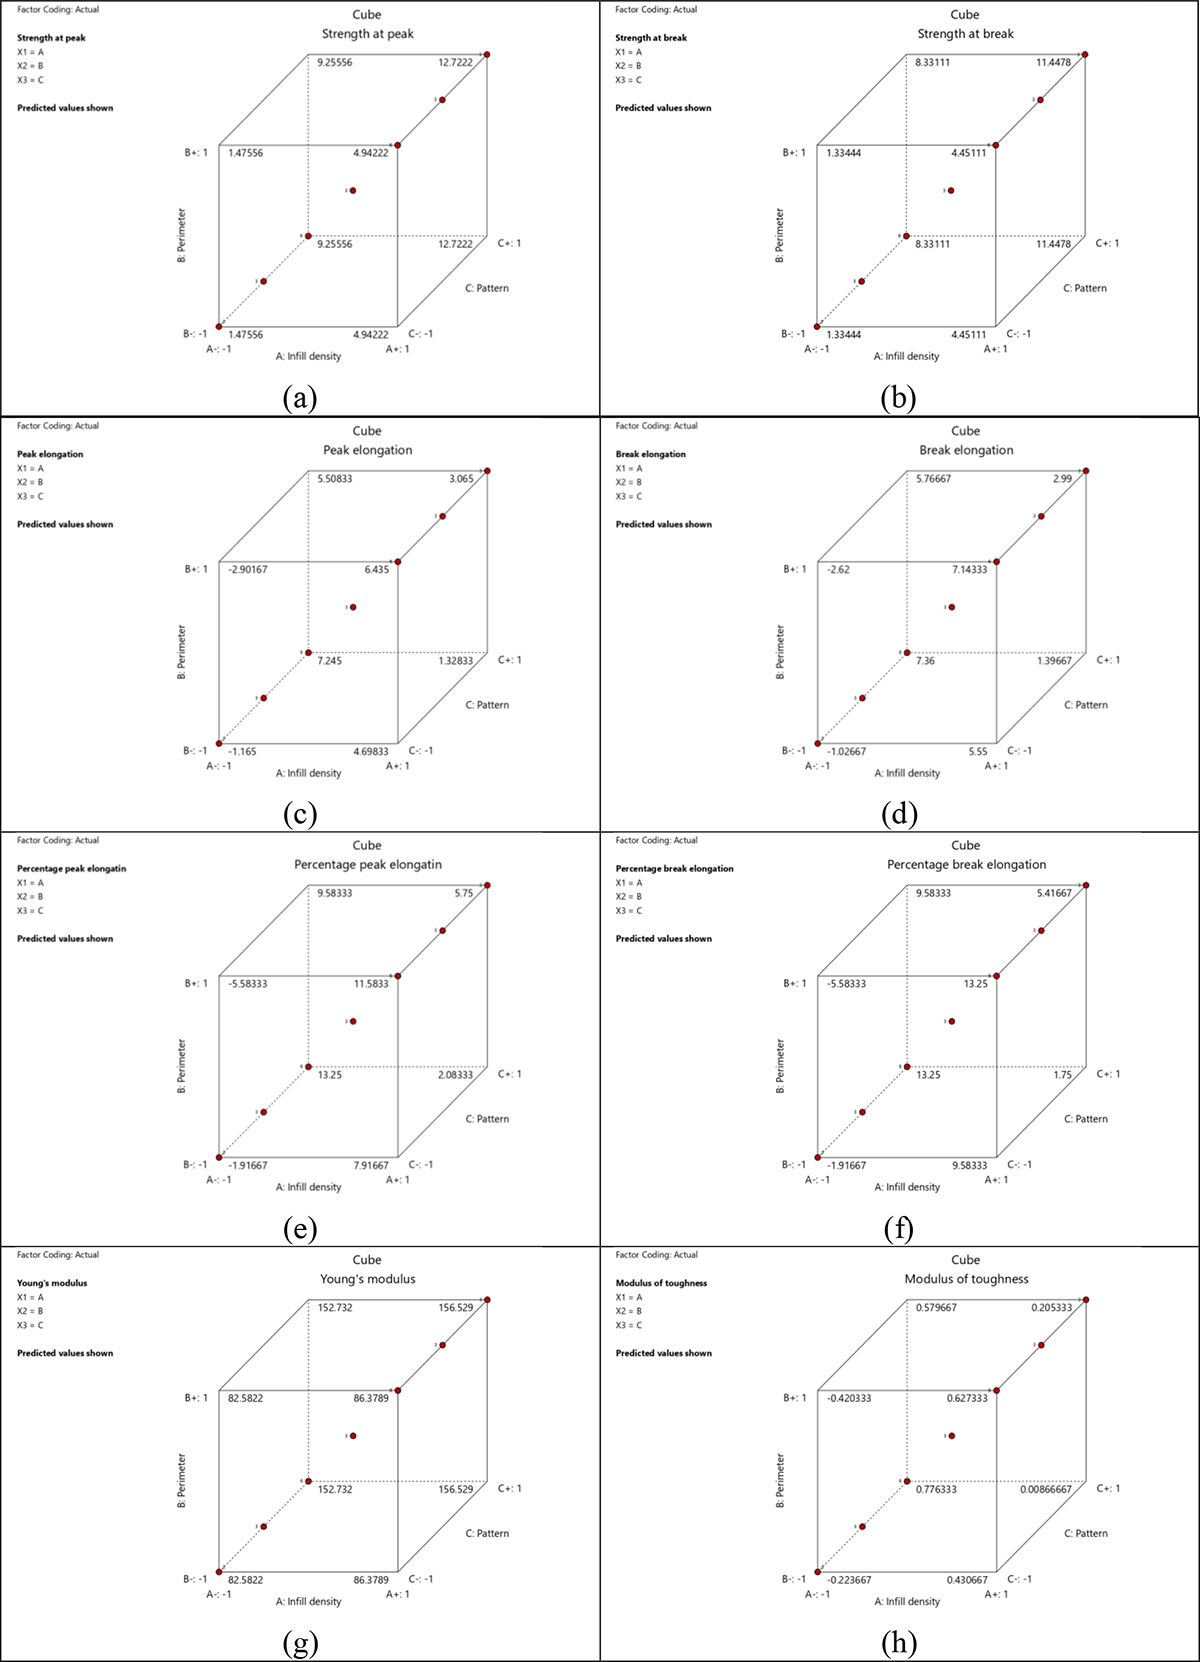
Cube plots for (a) strength at peak, (b) strength at break, (c) peak elongation, (d) break elongation, (e) percentage peak elongation, (f) percentage break elongation, (g) Young’s modulus and (h) modulus of toughness.
Further to predict the responses of input process parameters regarding strength at peak of PLA-ZnO composites (as per Table 6), following formula was used as follows:

βopt = optimum SN ratio value for strength at peak, u = overall mean of SN ratios, uA2 = mean of SN ratios for infill density at level 2, uB3 = mean of SN ratios for perimeter at level 3 and uC1 = mean of SN ratios for pattern at level 3.
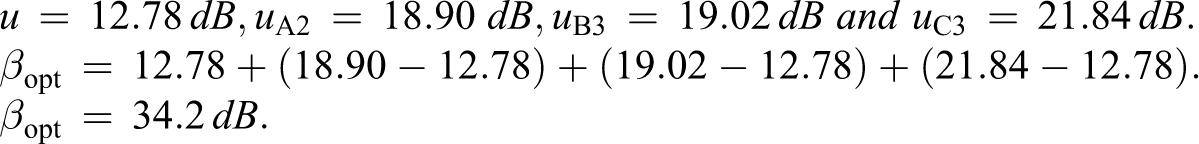
The optimum value of strength at peak (xopt) can be achieved by using the below-mentioned formula:

Putting the value of xopt2 in the above equation, xopt2 = (10)34.2/10 and xopt = 51.28 MPa.
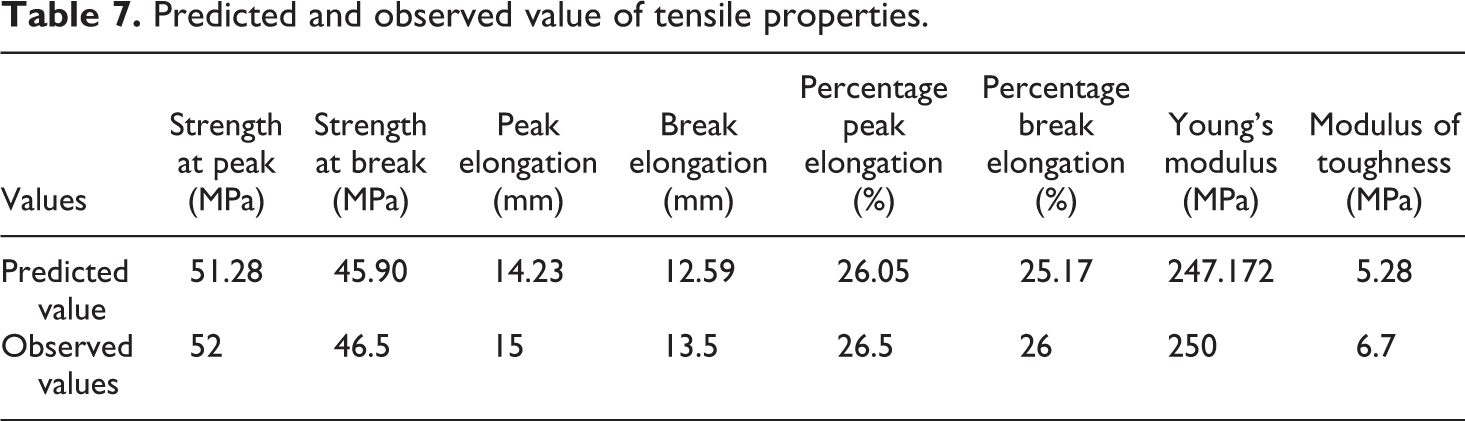
Table 7 presents the predicted and observed values for all different mechanical properties.
Predicted and observed value of tensile properties.
Combined optimization of process variables
Figure 10 shows the contour plots of mean of SN ratios. In this study, interactions among all process variables have been considered and optimum range of process variables have been selected. Figure 10(a) shows that the mechanical properties will be better when infill density is maintained between 67% and 82% with four to five perimeters of 3D-printed specimens. Figure 10(b) shows that infill density of 79–85% with rectilinear pattern will give better mechanical strength. Figure 10(c) shows that the maximum mechanical properties will be obtained with three to five perimeters with rectilinear and triangle patterns. Overall, it has been observed that 70–80% infill density, four to five perimeters and triangle/rectilinear pattern are desirable for obtaining maximum mechanical strength.
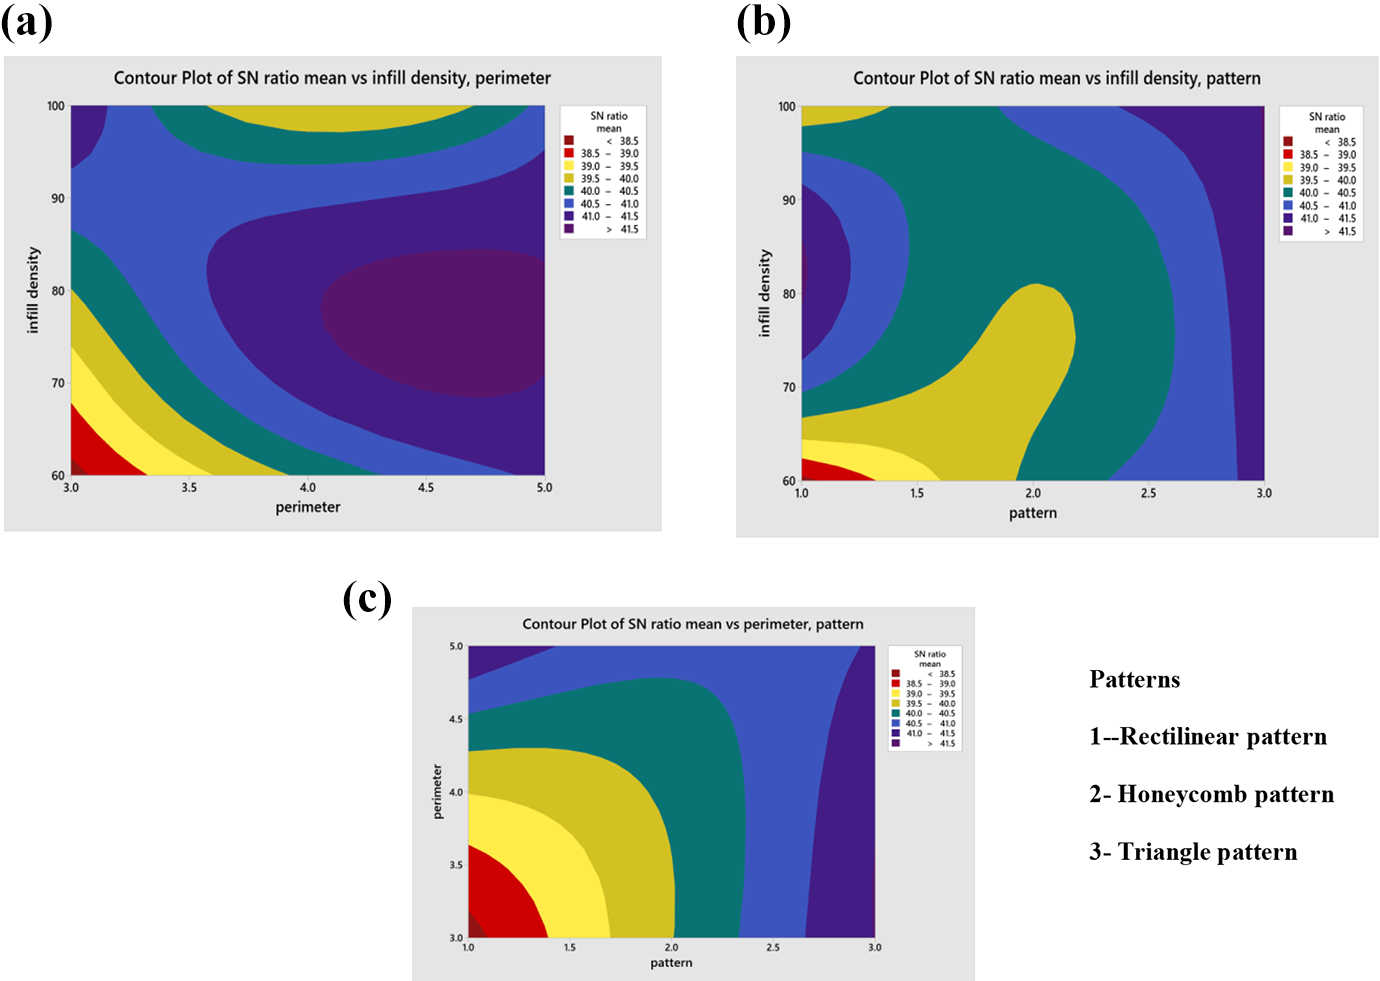
Contour plots for interaction of process parameters. (a) Contour plot of normalized SN ratio versus infill density perimeter, (b) contour plot of normalized SN ratio versus infill density pattern and (c) contour plot of normalized SN ratio versus perimeter pattern.
Thermal analysis
Further thermal analysis has been conducted for best and worst samples observed in tensile testing (Table 3), to investigate the effect of FDM process parameters during 3D printing. It has been observed that both specimens 1 and 5 were responsive to endothermic cycle (Figure 11). By comparing endothermic second cycle of both samples, it has been observed that there is little difference between the first peaks of meting point, that is, 51.40°C and 50.11°C, respectively, and similar response was observed in the second peak, that is, 138.74°C and 137.47°C of first and fifth specimen. The most interesting fact was observed in case of normalized heat capacity, which were the almost similar for both specimens (−1.58 J/g, −5.58 J/g and −1.13 J/g, −5.86 J/g of the materials. This means, with exposure of heat to the PLA with ZnO nanoparticle, reinforcement shows good thermal responsive behaviour. The similar trend was observed because printing of all specimens was performed at the same temperature. In other words, the filament used for printing has gone through similar thermal processing conditions for the preparation of specimens. The results of the thermal analysis are in line with the previous studies for PLA thermoplastic composite matrix.31–34
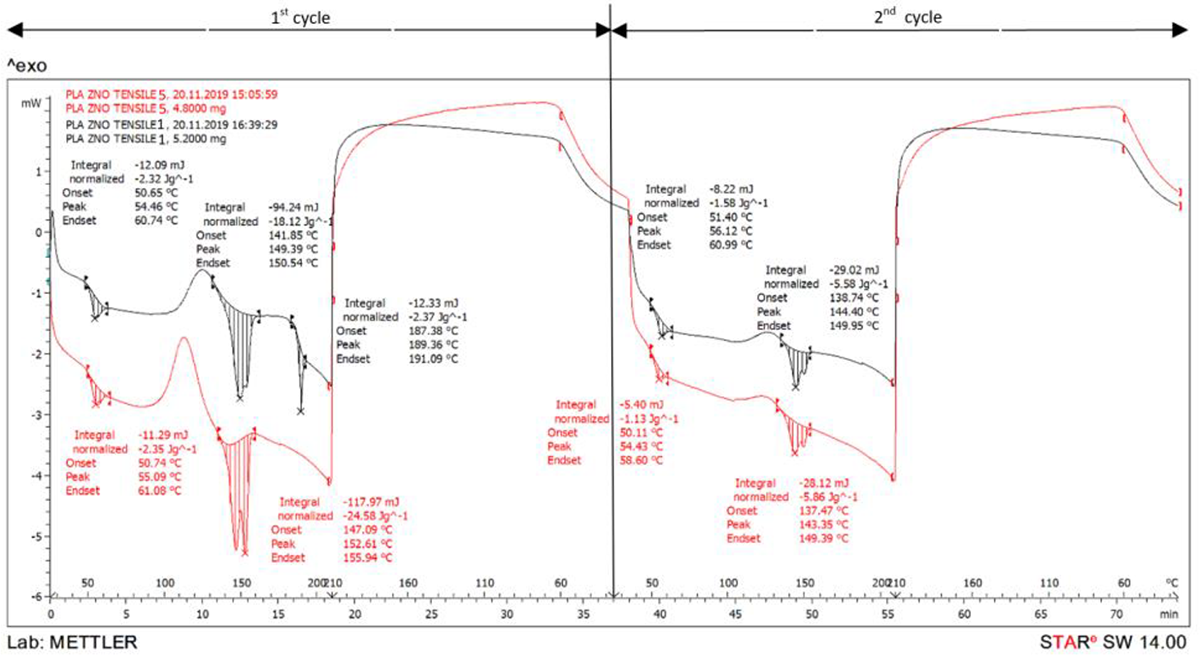
DSC analysis of 3D-printed specimens 1 and 5 (as per Table 3).
Shape memory effect
Based on dimensions
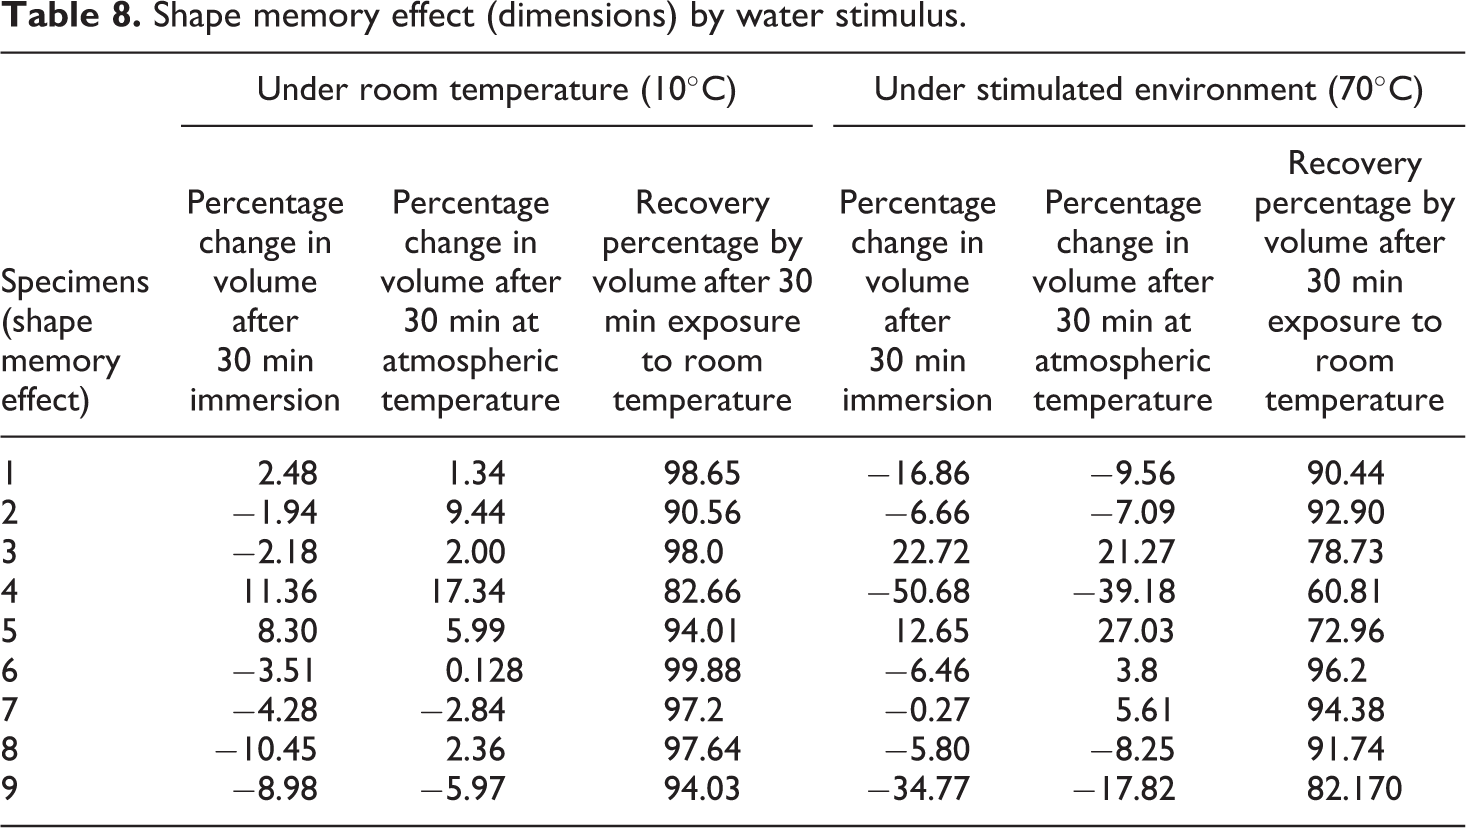
The dimensional changes (length, width and thickness) have been observed to ascertain the effect of shape memory effect with the immersion of 3D-printed parts into the cold (10°C) and hot water (70°C). The dimensions (such as length, width and thickness) were noted before immersion, after 30 min of immersion and after 30 min exposure to room temperature for both conditions of 10°C and 70°C. The noted dimensions are shown in Online Appendix III (Supplementary Tables S30–S35). Table 8 presents percentage change in volume after 30 min immersion, percentage change in volume after 30 min at room temperature and recovery percentage by volume after 30 min exposure to room temperature for both temperature conditions (10°C and 70°C). It has been observed that at 10°C, maximum recovery percentage by volume (99.88%) was observed in case of sixth specimen printed at 80% infill density, five perimeters and with rectilinear pattern and minimum recovery percentage by volume (82.66%) was observed in fourth specimen printed at 80% infill density, three perimeters with honeycomb pattern. At 70°C, maximum recovery percentage by volume (96.2%) was observed in case of sixth specimen printed at 80% infill density, five perimeters and with rectilinear pattern and minimum recovery percentage by volume (60.81%) was observed in fourth specimen printed at 80% infill density, three perimeters and with honeycomb pattern.
Shape memory effect (dimensions) by water stimulus.
Based on weight
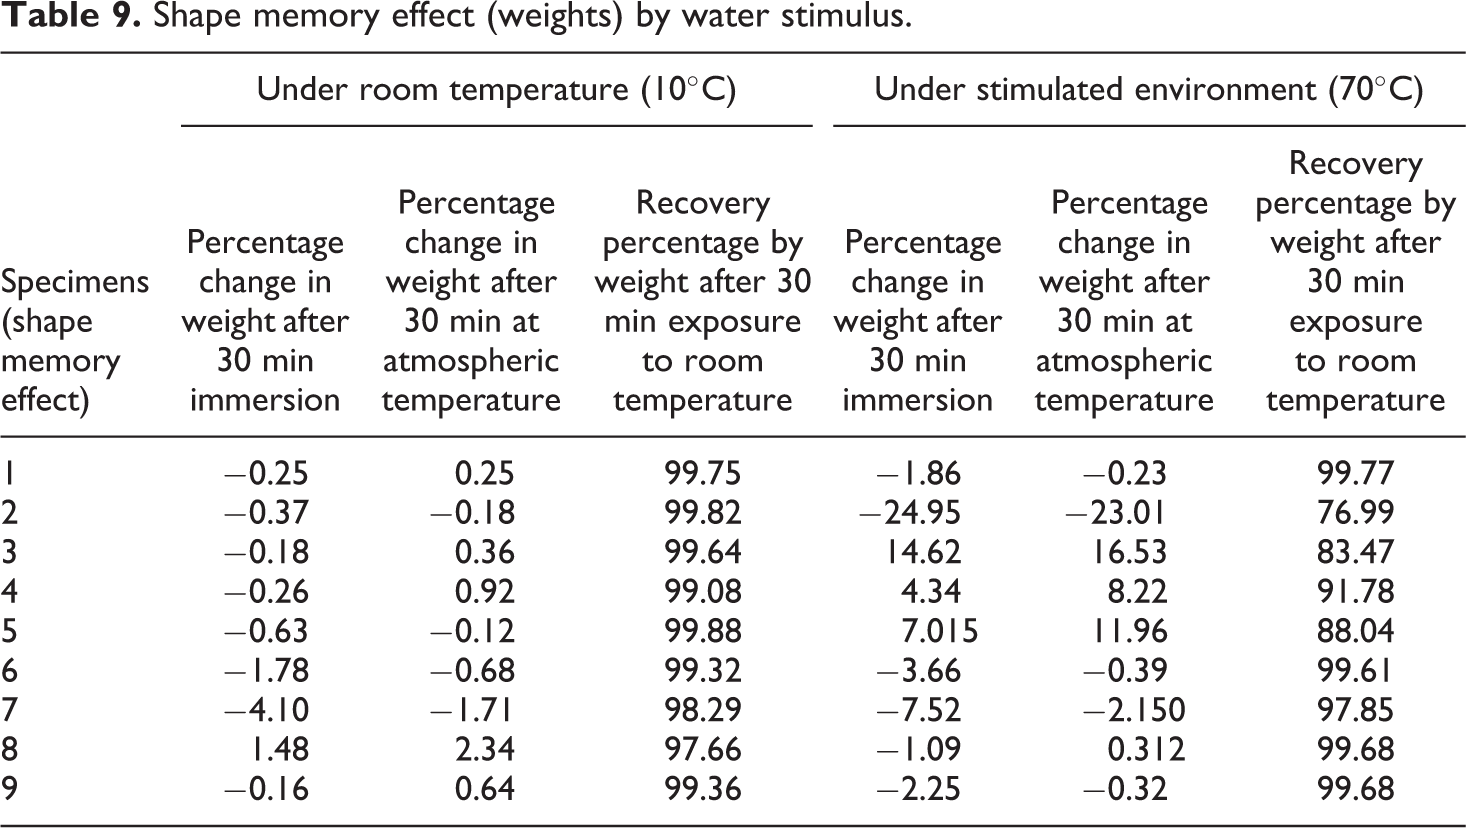
The weight changes occur with the immersion of 3D-printed part into the cold (10°C) and hot water (70°C). The weights were noted before immersion, after 30 min of immersion and after 30 min exposure to room temperature. The noted weights were presented in Online Appendix IV (Supplementary Table S37). Further, Table 9 presents percentage change in weight after 30 min immersion, percentage change in weight after 30 min at atmospheric temperature and recovery percentage by weight after 30 min exposure to room temperature for both temperatures (10°C and 70°C).
Shape memory effect (weights) by water stimulus.
Based on photomicrographs
The photomicrographic changes were noticed with the immersion of 3D-printed parts into the cold (10°C) and hot water (70°C) and porosity values are shown in Figures 12 and 13, respectively. The images of fractured part taken to observe the changes with the stimuli of water (while immersion in water) were also captured. The photomicrographs were taken before immersion, after 30 min of immersion and after 30 min exposure to room temperature. Figure 12 shows that the porosity value decreases while immersion into cold water and after 30 min of atmospheric exposure the porosity value was regained.
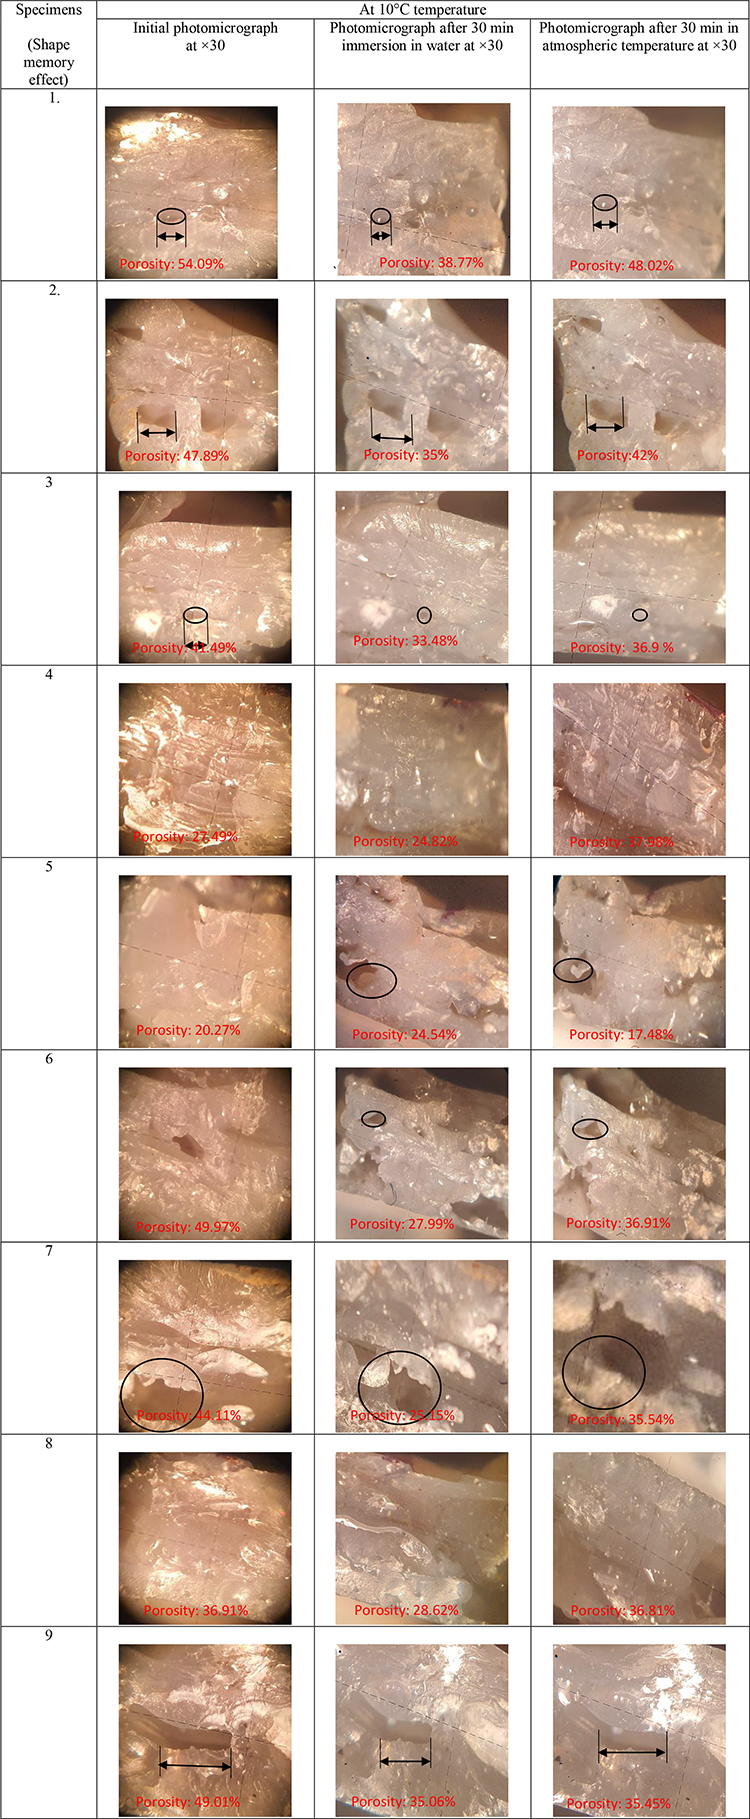
Shape memory effect (photomicrographs) by water stimulus at 10°C.
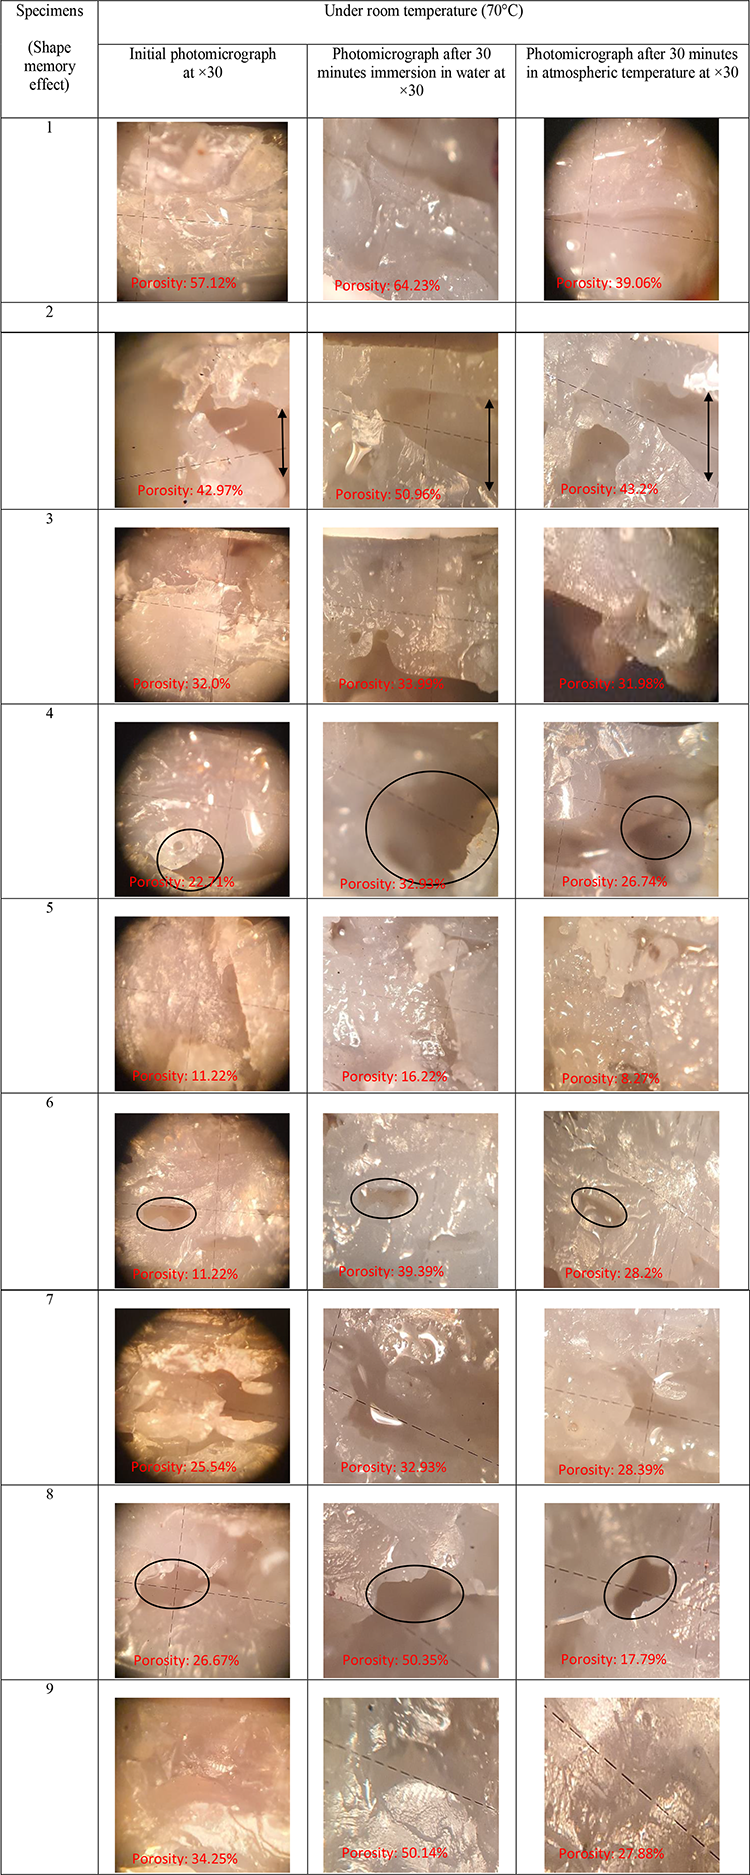
Shape memory effect (photomicrographs) by water stimulus at 70°C.
As observed from Figure 13, the porosity value increases while immersion in hot water and after 30 min of atmospheric exposure, the porosity value was regained.
To quantify the fracture/porosity under tensile loads the optical photomicrographic images (Sample 1 (having lowest strength at peak and break) and 5 (having highest strength at peak and break) as per Table 2) were processed with image processing software to get 3D-rendered images and surface roughness (Ra) profile (Figure 14).
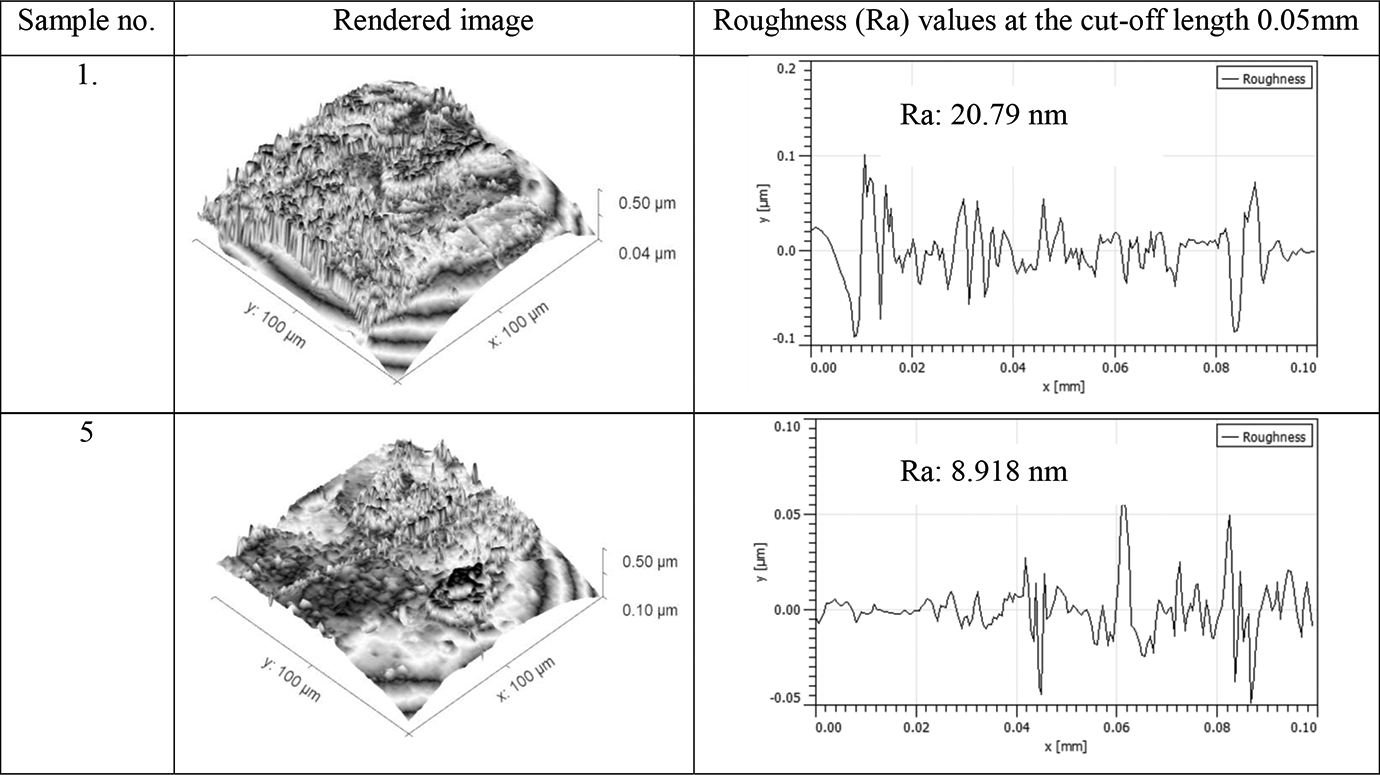
3D-rendered image and Ra profiles of specimens (as per Table 2).
As observed from Figure 14, the Ra value of surface after tensile testing is minimum for sample number 5 and maximum for sample number 1, which is in line observations of tensile properties (Table 3).
Conclusions
Following are the conclusions from the study:
It has been observed that the maximum strength at peak (14.32 MPa) and maximum strength at break (12.89 MPa) were in case fifth specimen (as per Table 2) printed at 80% infill density, four perimeters with triangular pattern. Maximum Young’s modulus (233.68 MPa) was observed in case of fourth specimen, printed at 80% infill density and three perimeters with honeycomb. Also, the maximum modulus of toughness (0.883 MPa) was observed in case of sample printed at 80% infill density, five perimeters with rectilinear pattern (sixth specimen). Hence, the combined effect of pattern, density and number of perimeters is responsible for the tensile properties of specimens.
The differential scanning calorimetry (DSC) results show no significant difference on melting point and normalized heat capacity between best and worst specimens (on basis of mechanical properties).
It has been observed that the porosity values increase with 30 min immersion in stimuli (water) at 70°C and regain after 30 min exposure to atmospheric temperature. The porosity values decrease with 30 min immersion in stimuli (water) at 10°C and regain after 30 min exposure to atmospheric temperature. Some effect on weight and volume of functional parts has been noticed. These observations are important for selecting thermoplastic matrix especially for different structural applications exposed to water under different temperature conditions.
Supplemental material
Appendix_Supplementary_material - On 3D-printed ZnO-reinforced PLA matrix composite: Tensile, thermal, morphological and shape memory characteristics
Appendix_Supplementary_material for On 3D-printed ZnO-reinforced PLA matrix composite: Tensile, thermal, morphological and shape memory characteristics by Mohit Singh, Rupinder Singh, Ranvijay Kumar, Pawan Kumar and Pawan Preet in Journal of Thermoplastic Composite Materials
Footnotes
Acknowledgements
The authors are grateful to Manufacturing Research Lab, Department of Production Engineering, Guru Nanak Dev Engineering College, Ludhiana, India, and Chandigarh University, India, for providing support continuously and lab facilities available in the respective departments.
Funding
The author(s) disclosed receipt of the following financial support for the research, authorship, and/or publication of this article: This work was supported by DST (GoI), File No. DST/TDT/SHRI-35/2018.
Supplemental material
Supplemental material for this article is available online.
References
Supplementary Material
Please find the following supplemental material available below.
For Open Access articles published under a Creative Commons License, all supplemental material carries the same license as the article it is associated with.
For non-Open Access articles published, all supplemental material carries a non-exclusive license, and permission requests for re-use of supplemental material or any part of supplemental material shall be sent directly to the copyright owner as specified in the copyright notice associated with the article.