
Abstract
In this study, a thermodynamic model of a laser-assisted automated thermoplastic fiber placement process is developed and validated. The main focus is on modeling the heat transfer into the composite with a laser heat source, the thermal properties of the tape, and the resulting heat distribution in the part, the mold, and the compaction roller. A new integrated analytical method is presented to calculate the energy input of the laser based on the geometric boundary conditions, including first-order reflection and laser shadow. The carbon fiber/polyethersulphone tape is modeled by combining literature properties of carbon fiber and matrix as well as based on experimental data of the tape itself. Also a thermal contact resistance between the tape layers is modeled based on a literature model and own experimental measurements. The created model is discretized and implemented in a 2-D finite difference code. With the help of this simulation, the temperature distribution is calculated during layup. The influence of a possible thermal contact resistance between the composite layers is investigated. Furthermore, an experiment with a thermoplastic fiber placement machine from Advanced Fibre Placement Technology GmbH (AFPT) was conducted in order to evaluate the simulation. The simulation and the experiment show a good agreement and prove that thermal contact resistance between the layers is negligible for the investigation process.
Keywords
Introduction
In recent years, the demand for carbon fiber–reinforced plastics (CFRPs) grew steadily. In order to meet the increasing demand, the need for decreasing production costs and higher accuracy of the fiber orientation in the part, the degree of automation was raised and automated manufacturing processes like filament winding, automated tape placement (ATP), and automated fiber placement (AFP) were introduced.
In the AFP process, the structural elements are fabricated in layers. Each layer consists of single stripes of unidirectional, pre-impregnated tapes placed side by side using a tape placement head. The incoming tape and the laminate are heated by a heat source and subsequently consolidated by a compaction roller (Figure 1).
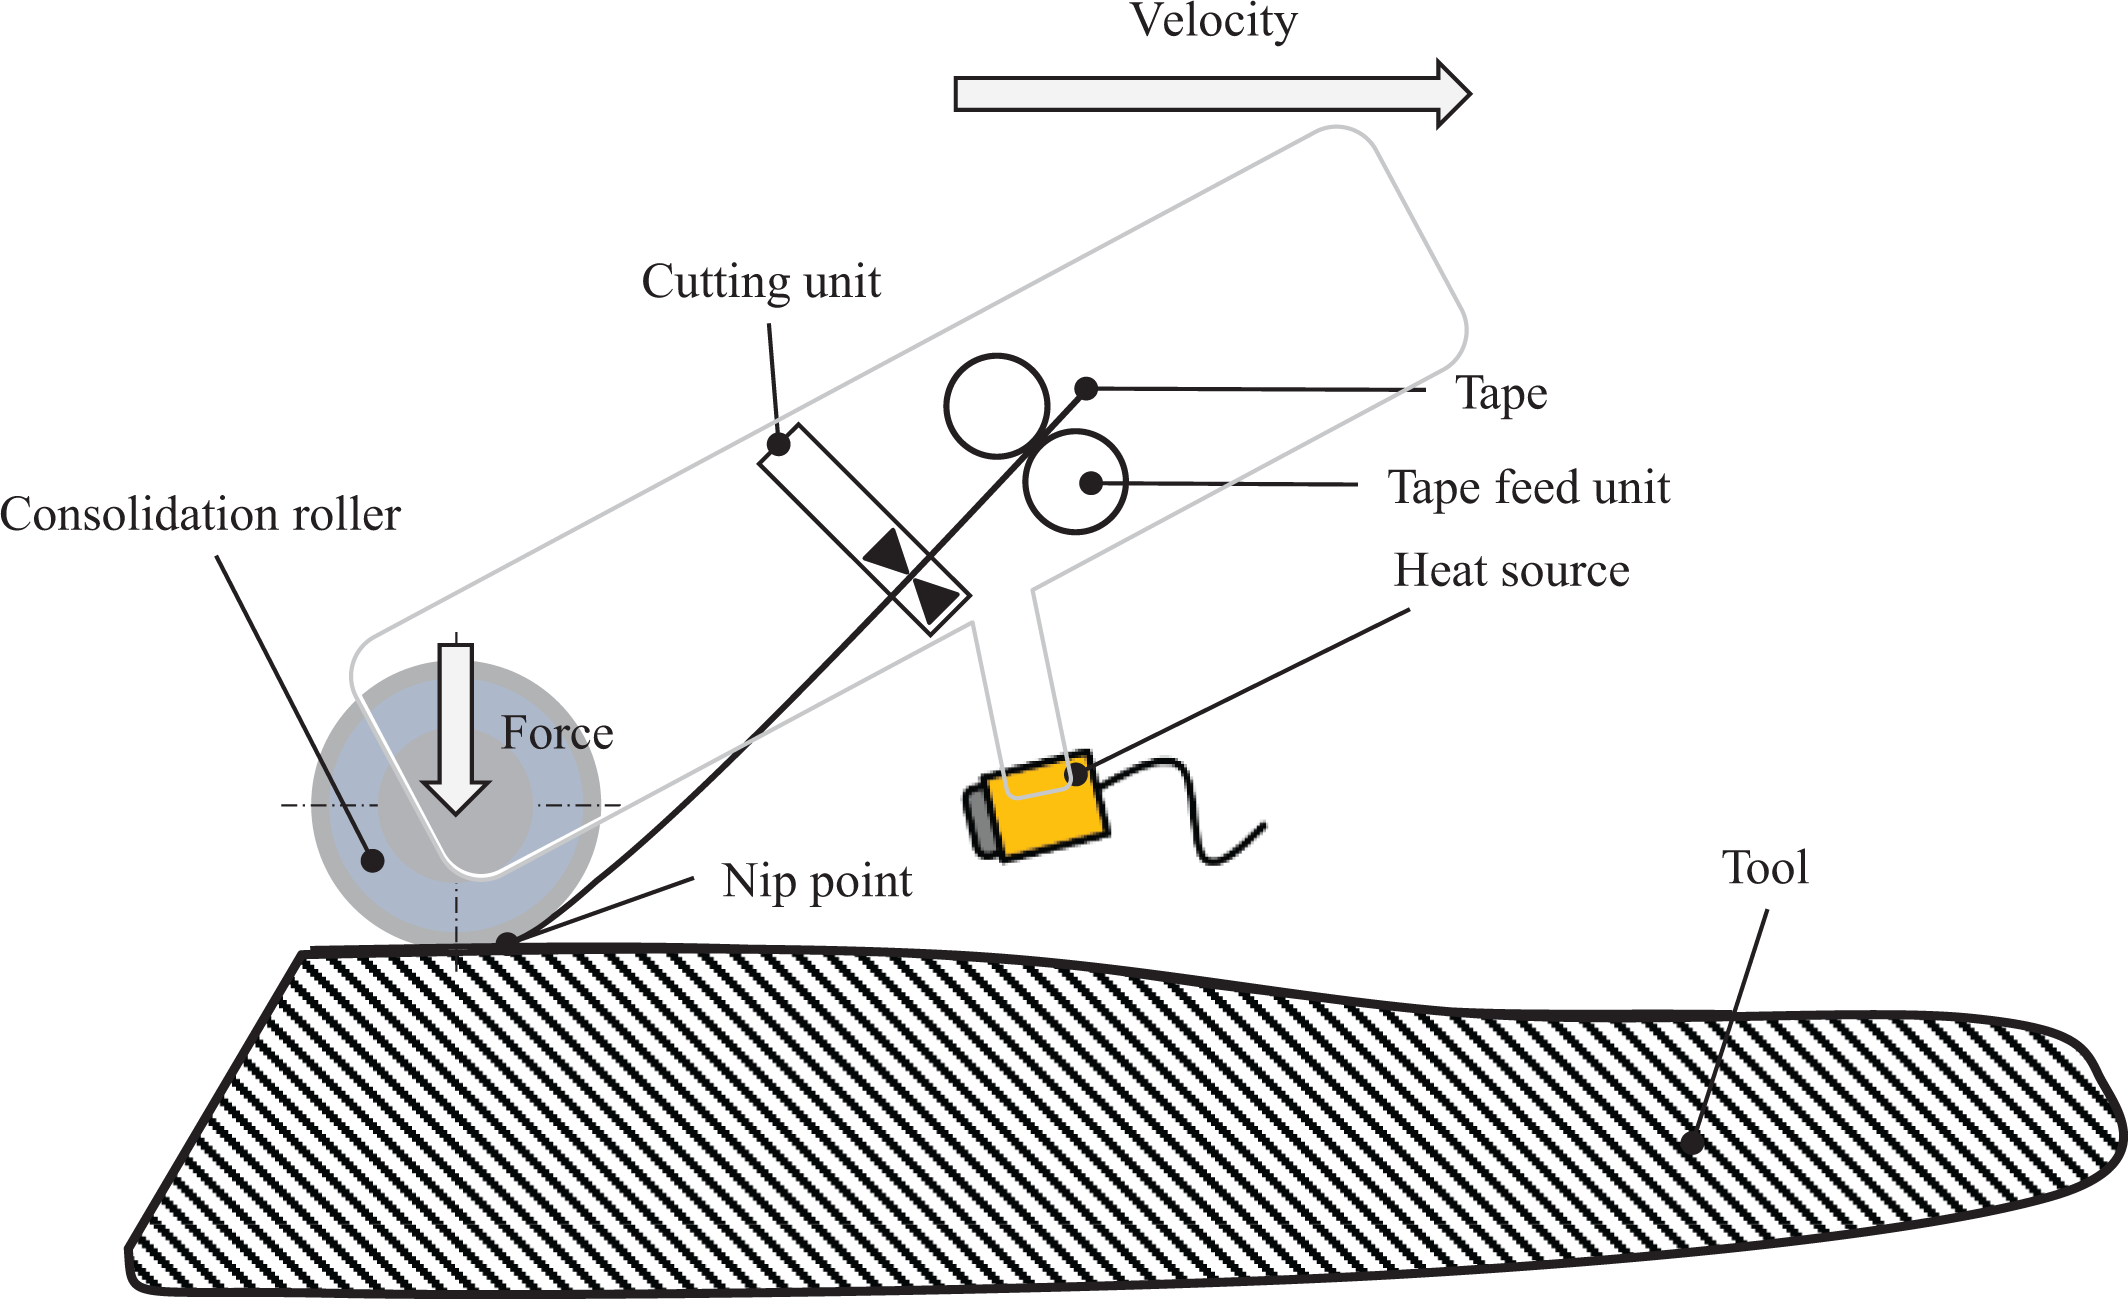
AFP principle with functional units of the placement head. AFP: automated fiber placement.
AFP can be used for thermoset and thermoplastic CFRPs. While thermoset CFRPs usually have to be cured and consolidated in an autoclave after the tape-laying process, thermoplastic CFRPs can be directly consolidated during layup (in situ). This allows a faster fabrication in contrast to the time-consuming curing process of thermoset CFRPs. 1,2
Recent thermoplastic automated fiber placement (TP-AFP) machines use a laser for heat activation of the composite. Laser heat sources offer high heat flux and fast control of the laser power. 3,4 For a high productivity, high energy density is required to rapidly melt the thermoplastic matrix but keep it below its degradation threshold.
Since thermoset CFRPs are cured in an autoclave, temperature and pressure during cure can be controlled accurately. That guarantees a constant high quality of the final part. With out of autoclave (in situ) manufacturing of thermoplastic composites, the quality of the final part is dependent on the AFP process parameters. The main processes that determine the quality of the final thermoplastic composite are the heat up and cool down of the tape under compaction pressure. These determine bond formation, void growth, polymer degradation, residual stresses, and in the case of semi crystalline matrices also crystallization. 1,2,5 –9
All of the mentioned quality parameters depend on the temperature history of the part. Therefore, many thermodynamic models of the tape-laying process were developed.
Mantell and Springer 5 created a two-dimensional (2-D) thermochemical model of an ATP process in order to determine consolidation, interlaminar bonding, and residual stresses and strains. Although it is possible to consider a heat flux or temperature distribution on the top ply, the calculation of the actual distribution was not part of the study. The temperature dependencies of specific heat capacity and thermal conductivity were only considered between the glass transition temperature and the melting temperature. While Mantell and Springer also considered filament winding and press forming, Sarrazin and Springer 10 focused on the thermochemical and mechanical aspects of tape laying. They assumed uniform heating of the composite and a linear temperature dependency of the specific heat capacity and the thermal conductivity.
Pitchumani et al. 1 analyzed the interfacial bonding and void dynamics during fiber placement. As in the previous papers, 4,9 the incoming tape is modeled instantaneously laid down and heated from above. Their thermodynamic model considers the thermal dependency of specific heat capacity and thermal conductivity but assumes uniform heat input and perfect heat transfer between the plies.
Sonmez and Hahn 8 used a nip point (NP) tape placement head similar to the one used in this study. The interface between incoming tape and laminate is heated by a heat source, and therefore the maximum temperature is at the interface. The compaction roller is modeled as a heat sink with constant temperature. A heat transfer coefficient between the incoming tape and the compaction roller is introduced. Based on the results, Sonmez and Hahn calculated the interlaminar bond strength, thermal degradation, and crystallinity. 2 Later, Sonmez and Akbulut 7 used the relationships between the process parameters and the quality parameters to optimize the process velocity.
Tierney and Gillespie 11 created a simplified 1-D model in order to determine the void dynamics. They neglected the heat transfer in laying direction, because the heat transfer in laying direction is driven by the mass transport of the incoming material.
Highest temperatures during placement occur at the irradiated areas of the laminate and the incoming tape. Therefore, it is necessary to know the exact temperature distribution especially at the irradiated areas. The aforementioned studies did not analyze the energy input distribution, and therefore the calculated temperature distribution deviates from the real values in a critical area of the composite during AFP processing.
Agarwal et al. 12 showed in their study the importance of the exact modeling of the heat input and that not all energy from the laser source is absorbed by the tape and laminate. Grove 13 measured the reflectance of a laser beam at the tape surface and used the mean reflectance to calculate the heat distribution input. Grouve 14 analyzed the reflectance of the laser light at the surface of the tape and found that a part of the reflected beam is scattered and does leave the 2-D plane. However, the majority of the radiation is reflected specular and it is justifiable to use the Fresnel equations. A downside of his optical model is that it neglects laser beam divergence, which reduce the local heat flux. The results of the optical model serve as input for a thermal model, which is similar to the one from Tierney and Gillespie. 11,14
Stokes-Griffin and Compston 15 created a three-dimensional (3-D) ray tracing model to determine the heat input. In order to consider the scattering effect of the fibers, the tape surfaces are modeled as an area of half cylinders with a diameter of 10 µm in fiber direction. Therefore, the reflected and scattered radiation impinges only partly on laminate and tape and the heat energy input is not as high as with a perfect specular surface. However, this effect is decreasing with decreasing distance to the NP, as close to the NP, almost all of the scattered irradiation impinges on tape or laminate. The data from the 3-D ray tracing model are used as heat input distribution for a former 2-D thermal model. 15,16 The model accounts for temperature-dependent material parameters. However, the thermal contact resistance is neglected. This can lead to a higher heat flux within the substrate and therefore leading to a lower maximum temperature.
All of the aforementioned studies assume perfect thermal contact between the plies in the laminate. Recent studies indicate that thermal contact resistance has to be considered.
Barasinski et al. 17,18 measured and simulated a TP-AFP process and determined a contact resistance between the layers due to imperfect bonding. However, no laser NP heating TP-AFP machine was used.
Levy et al. 19 created a function to connect the degree of intimate contact, surface roughness, and transverse thermal conductivity. The experimental setup was a hot press forming and no TP-AFP setup. Longer compaction phases and lower compaction forces were used. On other studies, Levy et al. 20,21 used the function to model the interlayer thermal contact resistance during a laser-assisted fiber placement process with a through thickness heating principle, similar to Barasinski et al. 17,18
A full 3-D thermomechanical simulation was developed by Lichtinger 22 for thermoset AFP and is currently in development for thermoplastic AFP by ESI Group 23 . These 3-D models provide a more detailed insight to process and material behavior but require much more calculation time, making virtual process parameter variations very time consuming.
Most thermal models don’t focus on the heat input and omit its calculation, although they illustrate the importance of the temperature history. 1,5,8,10,11,16 Other studies focus on the modeling of the heat input. 13 –15 The accuracy of the modeled heat input is experimentally verified. However, the temperature distribution is not only depends on the heat input but also from the quality of the thermodynamic model itself. The existing heat input models are evaluated with thermodynamic models that omit certain aspects, mostly thermal contact resistance between the layers. 13 –15 Therefore, it is neither possible to assign existing differences between simulation and experimental results to the heat input model nor to the thermodynamic model.
In order to solve this, the presented study focuses on modeling all of these phenomena: nonuniform heat input by laser, thermodynamic model including temperature-dependent material properties, and thermal contact resistance between the layers. The effects of the individual aspects in the model are investigated. Experimental layup trials validate the presented model.
Experimental setup
TP-AFP machine
A fiber placement machine from Advanced Fibre Placement Technology GmbH (AFPT GmbH, Dörth, Germany) is used for placement trials. A system from AFPT GmbH was also used by Stokes-Griffin and Compston, 15 Stokes-Griffin et al., 16 and Grouve. 14 The placement head is mounted on a six axis robot. A conformable silicone consolidation roller with 64 mm in diameter is used for compaction. A near infrared diode laser (wavelength 1030–1060 nm) heats the material during layup. An optics forms a rectangular laser spot heating both the incoming tape and the substrate laminate. The laser spot size is 57 × 57 mm2 in 250 mm focal distance.
An unheated aluminum tool was used for the layup trials (299 K). Fully impregnated carbon fiber/polyethersulphone (CF/PES) tapes with 55% fiber volume fraction (FVF), 0.14 mm thickness, and 25.4 mm width (Suprem™ T 55% AS4/PES-4100 0.14 × 25.4) from Suprem SA (Yverdon-les-Bains, Switzerland) were used for the validation experiments.
Thermocouple test setup
Three stripes of 0.5 m length and 15 layers were manufactured (Figure 2). A thin polyimide tape and a double-sided adhesive tape on top were used for first layer fixation. On layer 10, thin thermocouples (TCs; type K: Omega CHAL-002 and IEC-TFAL-003-15M/IEC-TFCY-003-15M) were welded onto the tape by a soldering iron. The TC data were measured by an amplifier (MX840A from Hottinger Baldwin Messtechnik GmbH) at 150 Hz. The mean value of the temperature of the three stripes was used for validation of the simulation. After each layer, the layup process was halted until the TC temperatures dropped under 30°C.
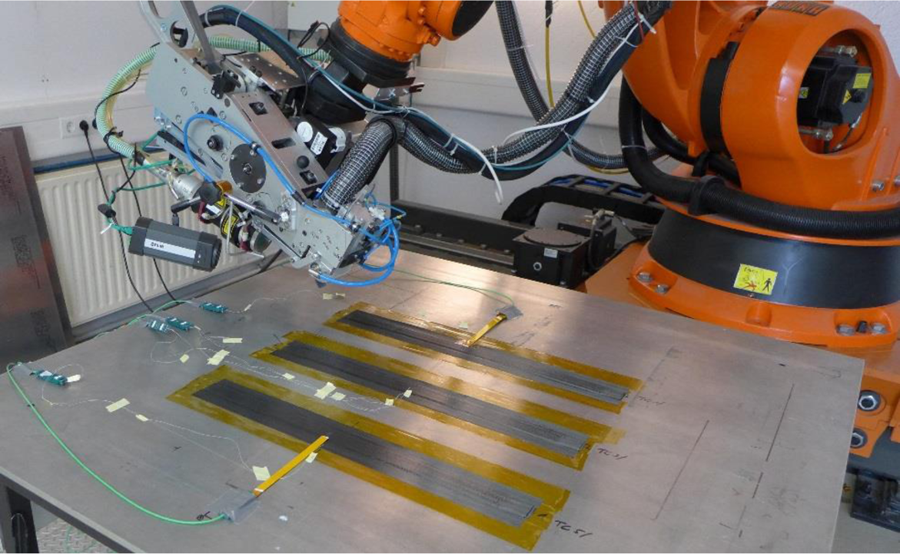
Experimental setup with TCs embedded in tape. TC: thermocouple.
A FLIR A325sc infrared camera was used to monitor the surface temperatures of the tape and substrate around the NP during layup. The cooling of the consolidation roller was also monitored by the infrared camera during the pause. For the validation experiments, fixed laser power and fixed laser optics angle were used.
Modeling
Based on the experimental setup, a thermodynamic, 2-D model of laser-assisted AFP process with implicit transient heat transfer equations is developed. The regarded plane is determined by the vertical axis and the depositing path. In addition to the tape, the tool and the compaction roller are part of the model. Figure 3 shows the heat boundary conditions implemented in the model. Heat conduction is considered within the mold, the tapes, and the roller. Heat transfer is modeled between these parts by heat transfer coefficients. Heat transfer to the ambient air (T 0) is also implemented by free convection or forced convection depending on the boundary condition. Figure 3 also shows the distinctive points for the laser boundary conditions on the incoming tape and laminate.
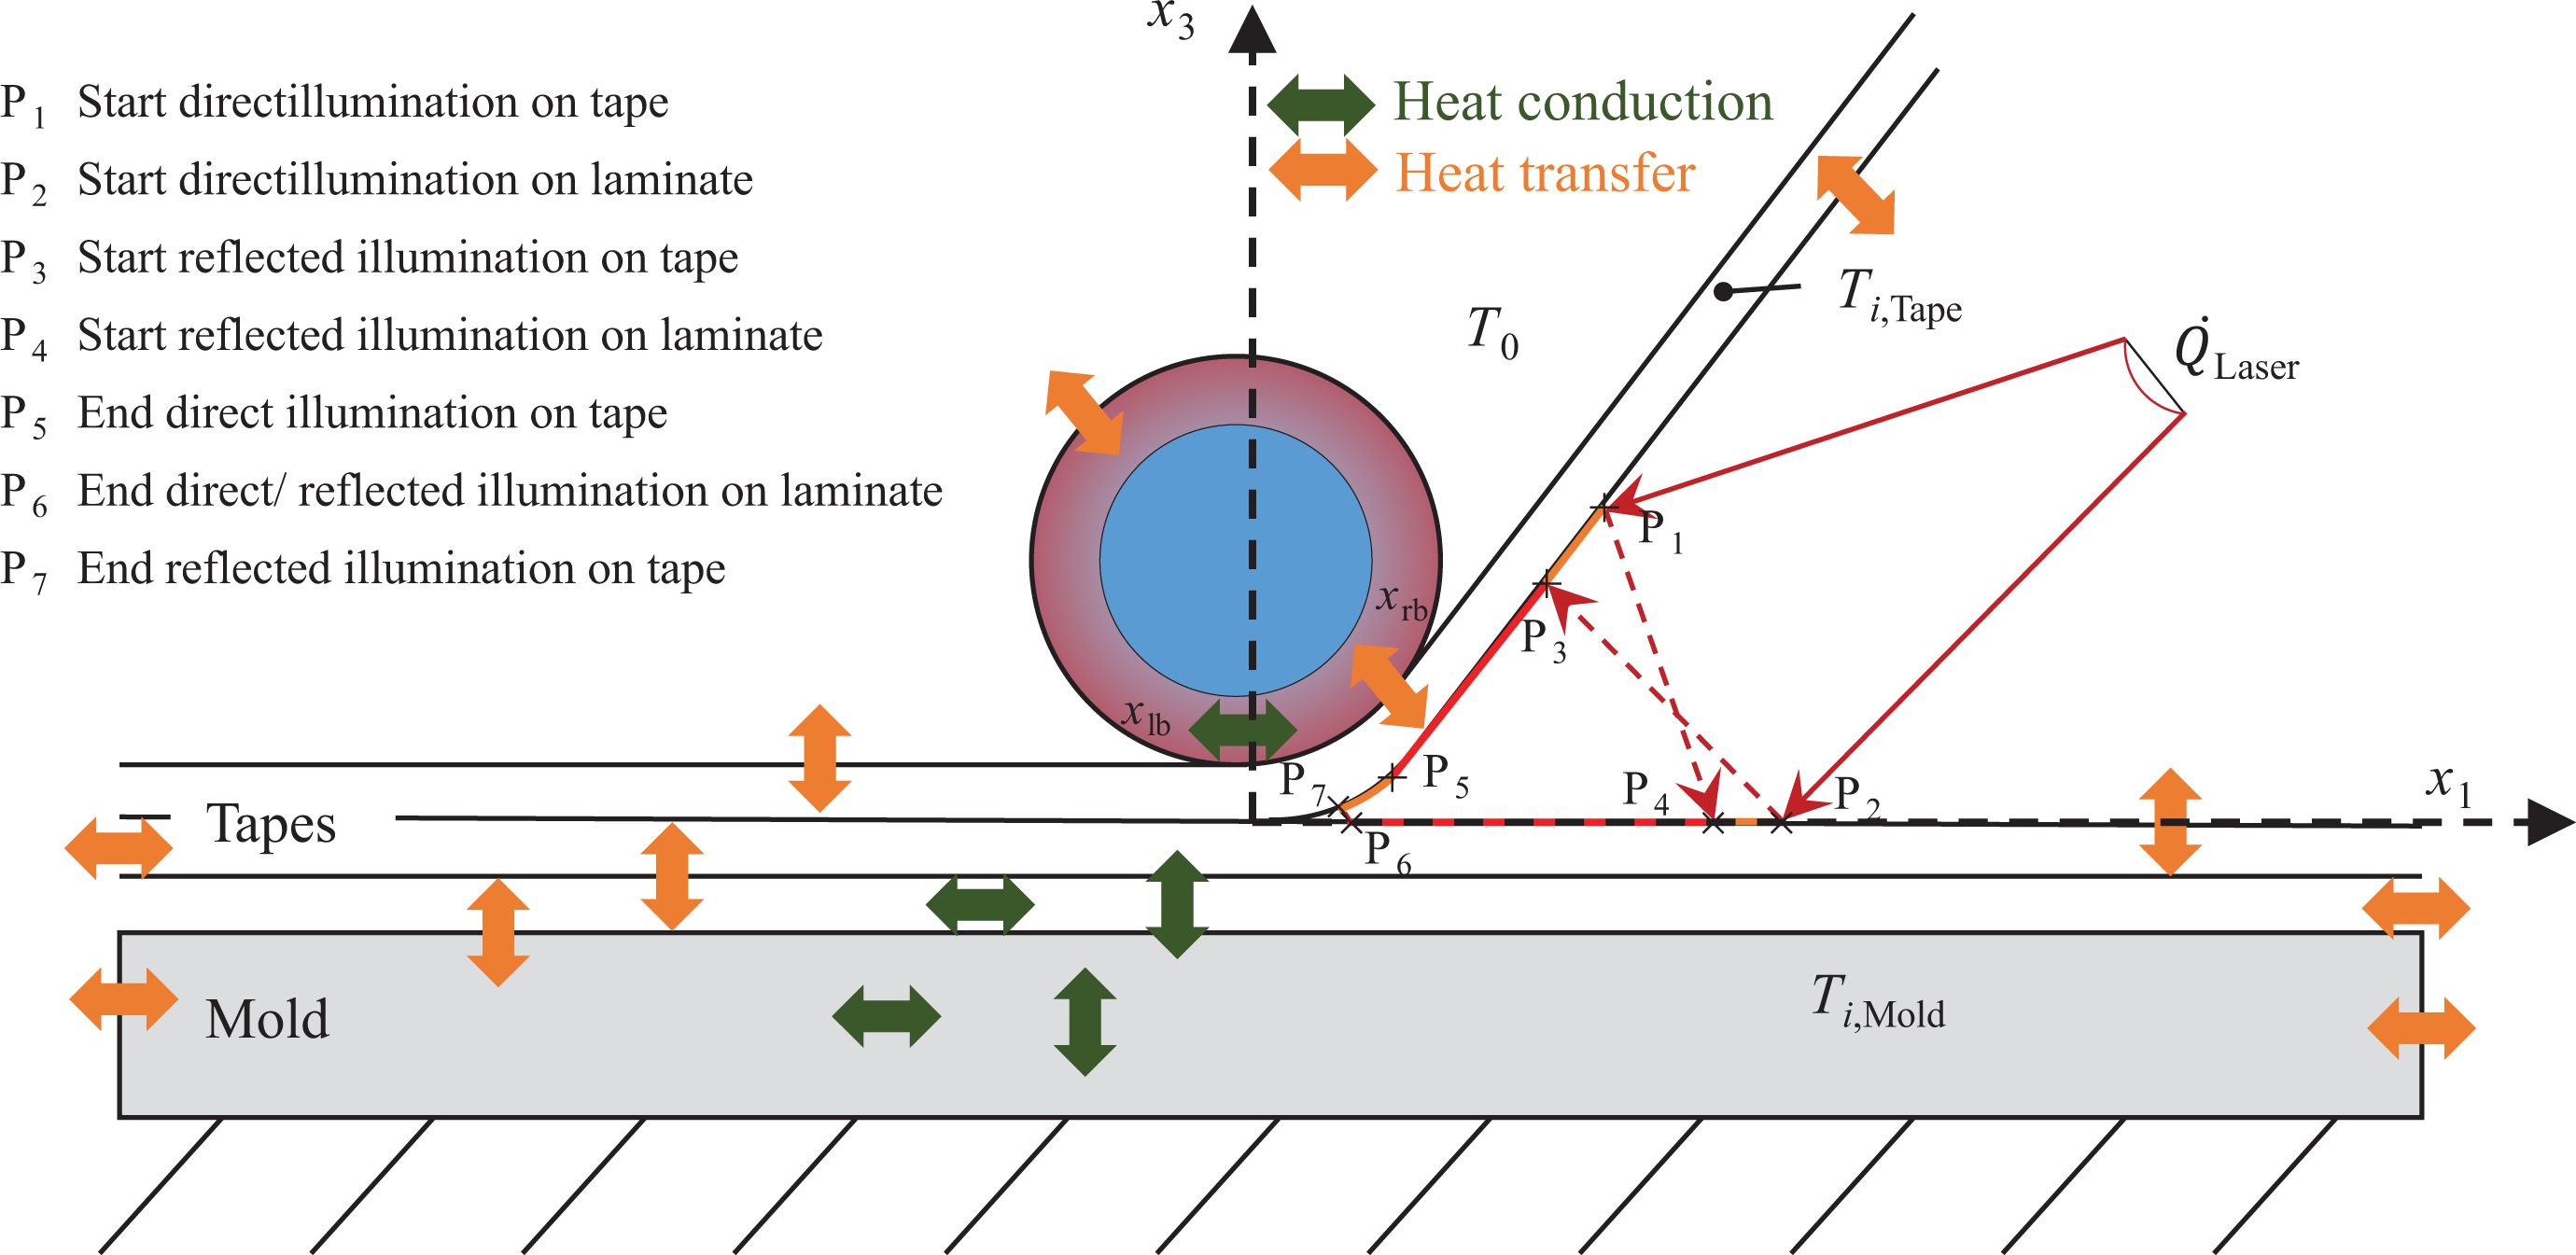
2-D model of the AFP. 2-D: two-dimensional; AFP: automated fiber placement.
The thermal contact between the incoming tape and laminate is only modeled after the NP. The area in front of the NP, both on the laminate and incoming tape, is exposed to laser heating and cooling due to the colder ambient air. The water-cooled compaction roller acts as a heat sink and is modeled in the area where it is in contact with the incoming tape. After placing the whole length of the tape, the compaction roller returns to the starting position in order to place the next ply and the heated composite cools down.
To cover the temperature dependency of material parameters, implicit transient heat transfer equations are used. Taking the general law of energy conservation
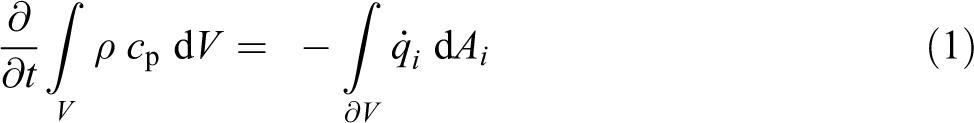
and the definition of Fourier’s Law

with ρ being the density, c p the specific heat capacity, V the equivalent volume, A the equivalent surface, λ the temperature and direction-dependent heat conductance, and T the temperature, an adequate transient thermal model can be derived.
Boundary conditions
The following boundary conditions were implemented: The initial temperature T
0 at t = 0 s for the tool, the tapes, and the compaction roller is 299 K and equals the constant ambient temperature. Thermal insulation at the bottom of the tool.
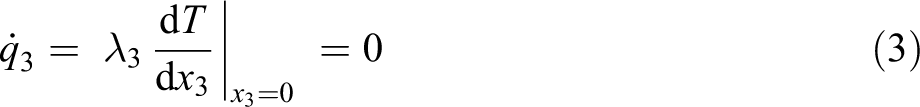
with λ 3 being the transverse heat conductance of the tool.
Free convection at outer areas of the laminate, tool, and incoming tape in contact to ambient air is

where h is the heat transfer coefficient. The heat transfer coefficients are calculated during the simulation. 24
The thermal conductance at the contact surfaces between the different components (i.e. tool, layers of the laminate, compaction roller) is

with h r (T) as the heat transfer coefficient.
Constant temperature T R at the inner diameter of the roller due to water cooling.
Thermal insulation at the left boundary surface x lb of the compaction roller that is considered in the model due to the rotational symmetry of the compaction roller
A reduced temperature at the right boundary surface x rb of the compaction roller that is considered in the model due to the cooling of the compaction roller while not in contact to the incoming tape

where r c1 is the cooling factor and i the current time step. The cooling factor r c1 was measured by the FLIR IR camera during test layup and determined as 0.44.
The heat input at the irradiated area by the laser is
Heat input by the laser
The laser radiation is partially absorbed (Q a), reflected (Q r), and transmitted (Q t) by the composite tape. This is expressed by the equivalent percentages α r, ρ r, and τ r.

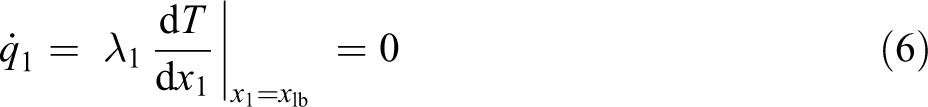
According to Esche, 3 the transmission rate τ r is assumed to be zero. Therefore, the absorbance can be calculated with help of the reflectance. It is assumed that the reflectance occurs only on the surface of the tape, consisting only of the matrix material. The reflectance of a nonconductor can be determined with the Fresnel’s relation. 25 A refractive index of 1.65 was used for PES. 26 Due to the high fiber volume fraction and the high absorbance of the carbon fibers, it is assumed that the entire energy is absorbed at the surface. 3,25
Additionally, the absorption of the Suprem CF/PES tape was measured by a “Perkin Elmer LAMBDA 1050 UV/Vis/NIR” spectrophotometer with an integrating sphere according to Stokes-Griffin and Compston. 15 Figure 4 shows the absorption relative to the laser angle of incident for both Fresnel’s relation and the measurements.
Absorption of CF/PES tape determined by Fresnel’s relation and by measurement. CF/PES: carbon fiber/polyethersulphone.
At the relevant angle of incidence for substrate heating (around 60°), the difference between the Fresnel model and the measurements is around 2%.
The absorbance of the tape decreases with increasing temperature. Kölzer measured the influence of temperature on the absorbance of a carbon fiber tape with polyether ether ketone (PEEK) matrix. 27 This linear relation is used here for the CF/PES tape as well.
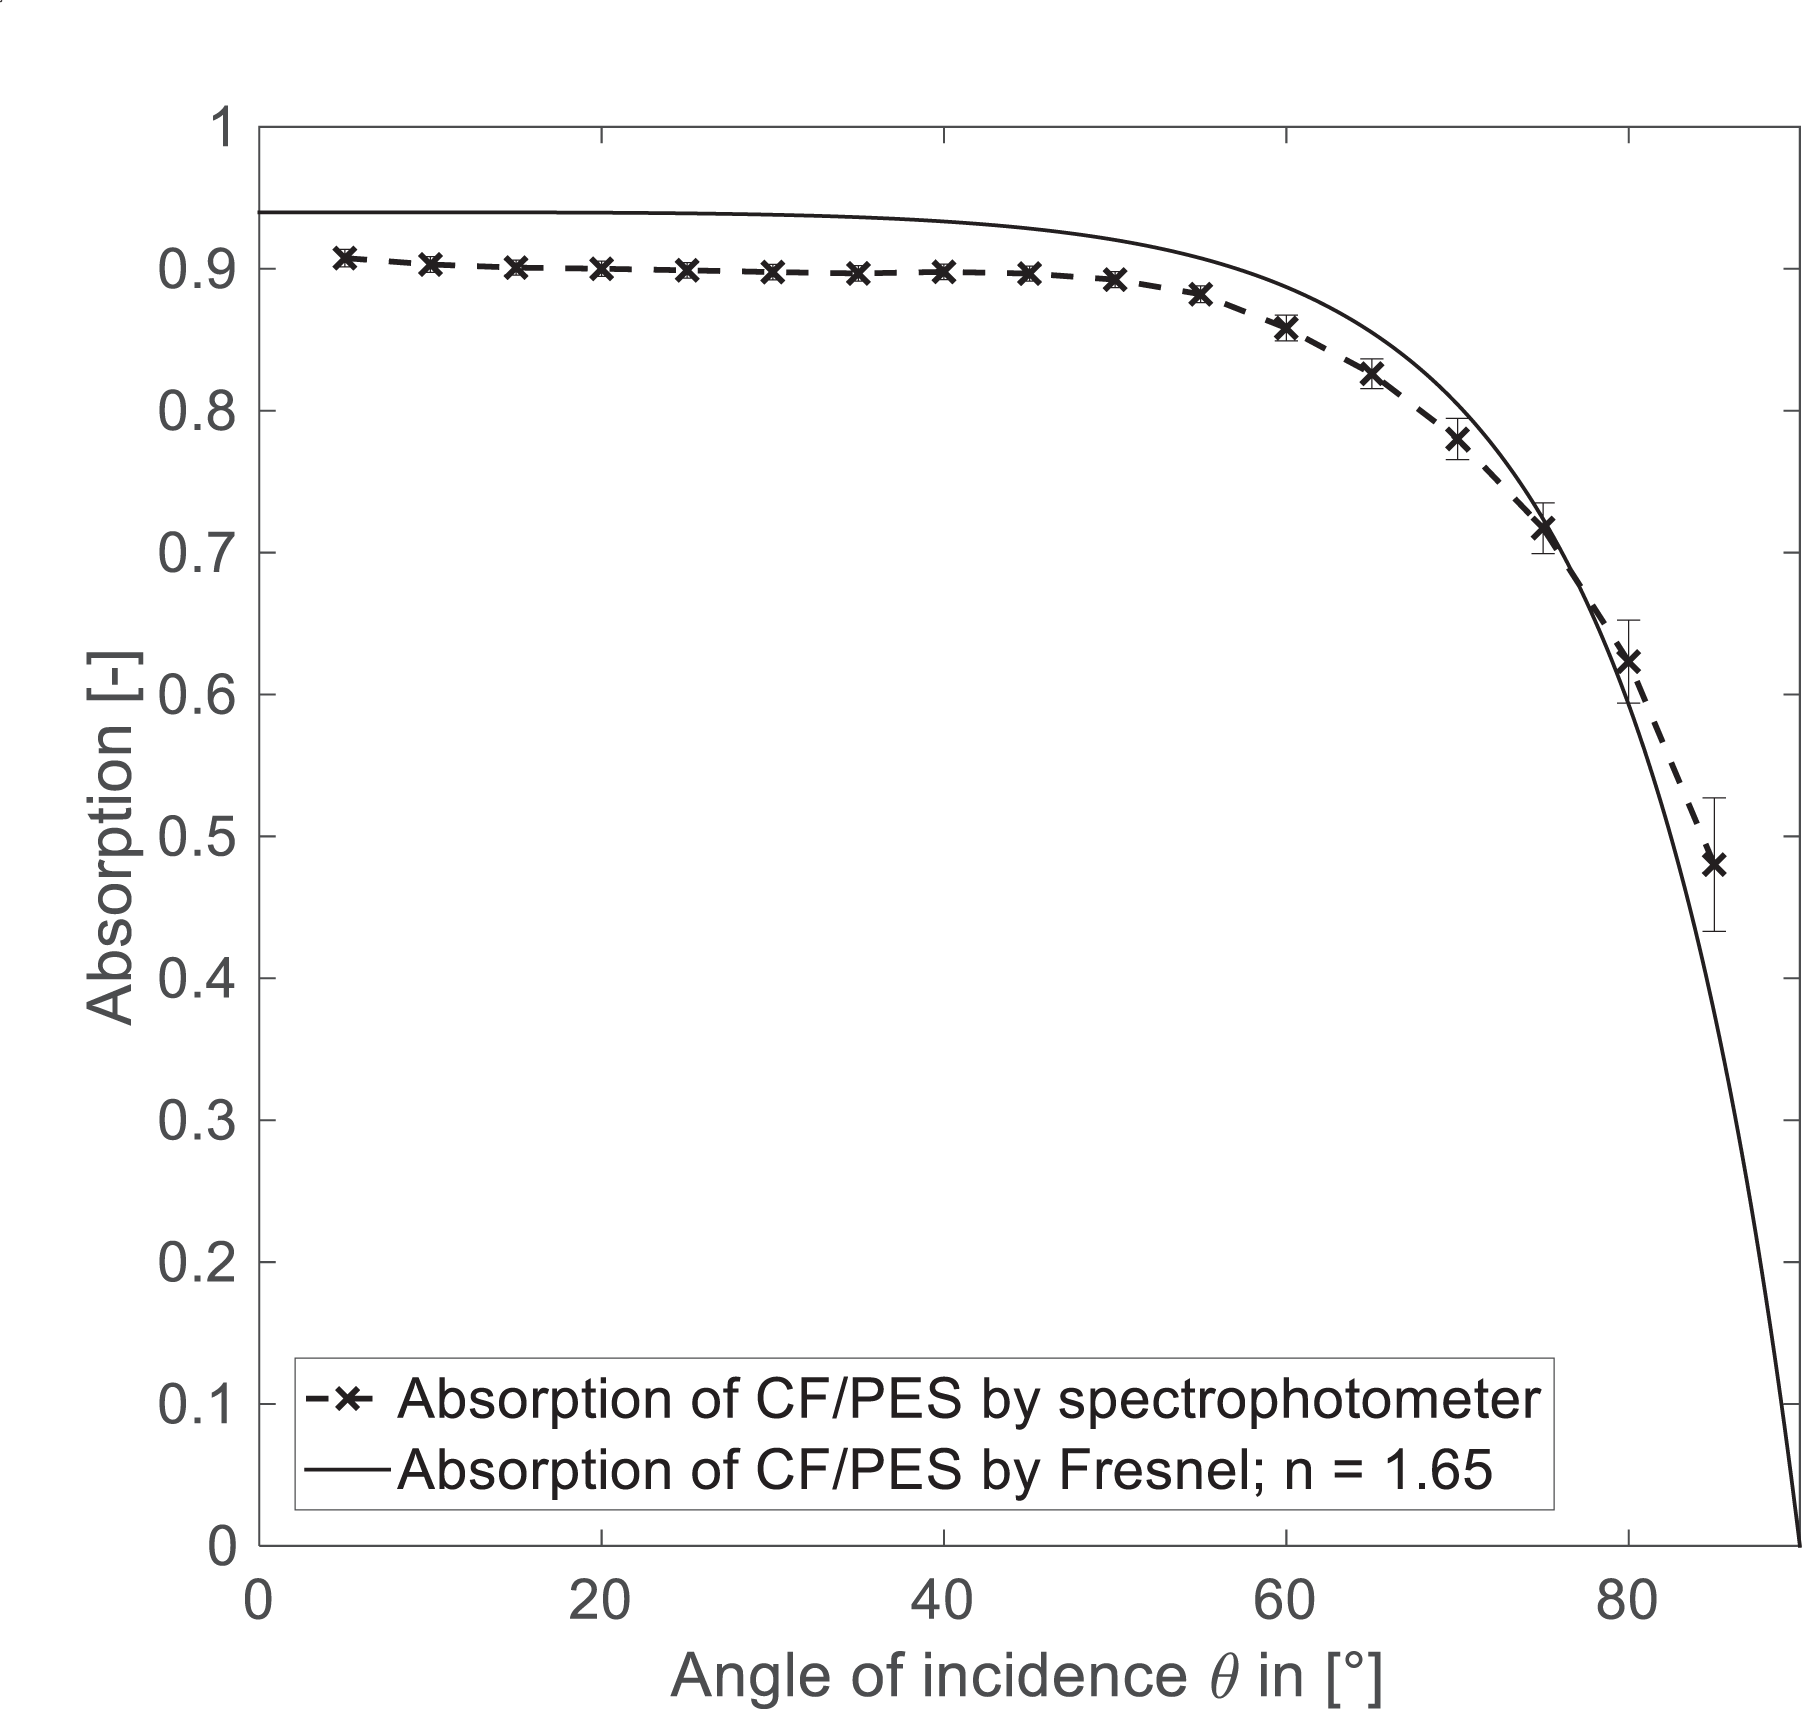
With this information, it is possible to determine the average heat input during the layup for each time step. The average heat flux density during onetime step dt in an 2-D element with a length dx 1 in the x 1-direction is

where
For the irradiation of the laminate, the angle of incidence θ1 is constant. For the irradiation of the incoming tape, the integration variable is s instead of x, and the angle of incidence is dependent on s as the incoming tape bends around the roller during movement (see Figure 5).
Heat input in the tape and laminate.
Additionally to the energy input by direct illumination, the model also calculates the energy input by the first reflection from the other side. The average heat flux density originating from the reflected irradiation is

where θ2 is the angle of incidence of the laser after the first reflection with respect to the absorbing element. Compared to equation (9), the factor ρ(θ1,n) has to be added to account for the percentage that is absorbed at the first reflectance. In this case, the distance the light travels between the laser and the point of impact consists of the distance between the laser and the point of reflection and the distance between the point of reflection and the point of impact. The heat flux density in the irradiated area is the sum of
Restrictions of the model
The model is a 2-D model. Thus, it neglects the heat flux in the third dimension (two-direction on unidirectional laminate coordinate system). This assumption is rated tolerable as the heat input of the laser is constant over the tape width and the heat flux is strongly driven by the much higher heat conductivity of the CF/PES tape in fiber direction and the higher temperature difference in laminate thickness direction. The divergent behavior of the laser beam is only considered to calculate the boundary points of the laser-heated area. The angle of the laser and the substrate is simplified to the mean angle α, thus the angle of incidence of the laser is constant here.
Fiber orientation of the substrate laminate always has to be in layup direction. Additionally, the tool and laminate need to be flat due to the fact that the heat input is strongly dependent on the angle of incidence of the laser beam. To minimize the modeling effort, the element size in fiber direction (x 1) has to be kept the same for the CF/PES tape, mold, and roller. Element size can alter in thickness direction (x 3) for the three components.
Besides laser power and laser angle, all other simulation and process parameters (e.g. consolidation length or layup speed) need to be constant during the simulation.
Simulation sequence
The simulation sequence is based on a validated 2-D model for thermoset-AFP with an infrared heat lamp for tack activation. 22 The heat transfer equations are solved in the commercial software MATLAB from Mathworks Inc. by finite differences method. The simulation sequence can be seen in Figure 6.
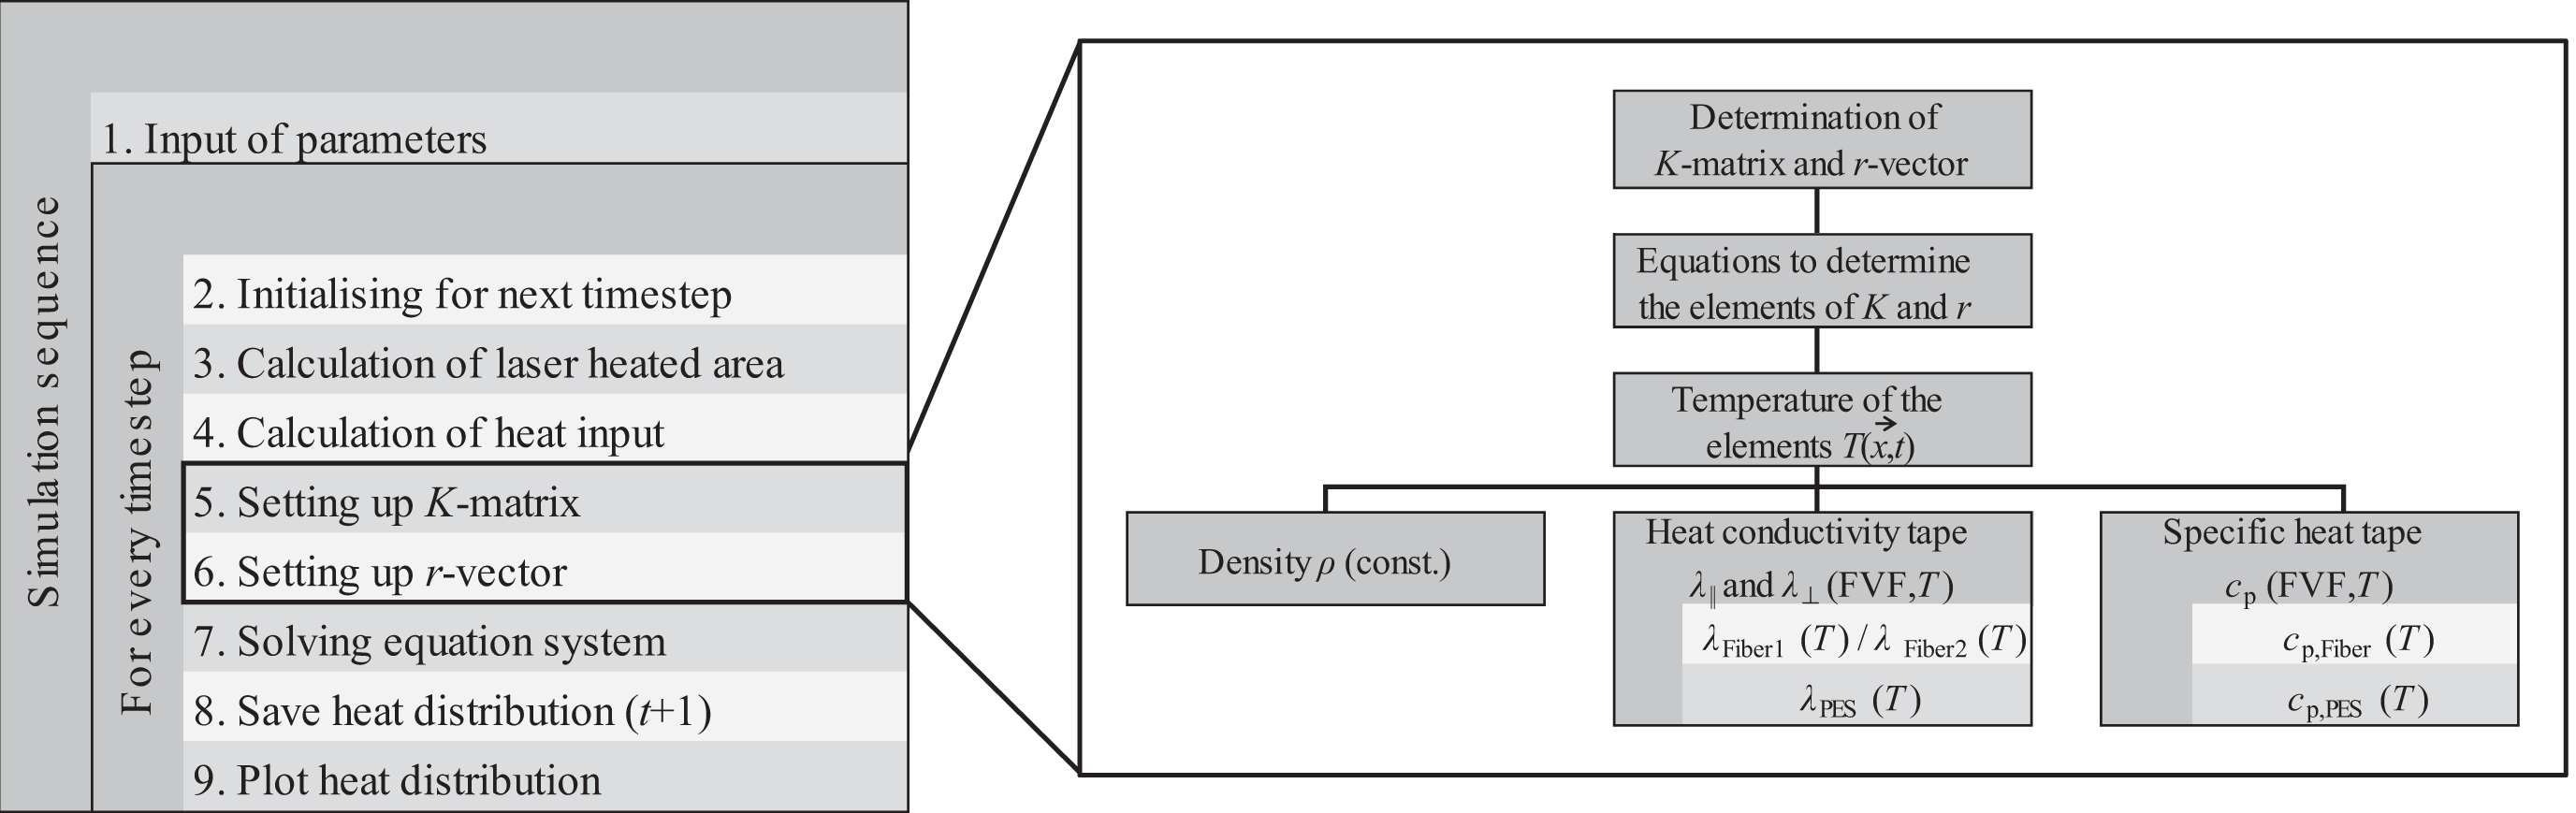
Sequence of the simulation program.
Material
CF/PES tape
Due to the high temperature range during the fiber placement process, the temperature dependency of the specific heat capacity c p and the heat conductance λ is considered. Two approaches were followed to determine the CF/PES tape material properties: Firstly, the tape properties were derived from the properties of the fiber and matrix by models. Secondly, the properties of the tape itself were measured by differential scanning calorimetry (DSC) and laser flash analysis (LFA).
Model
The temperature-dependent specific heat capacity and thermal conductivity in fiber (index ||) and transverse fiber (index ⊥) direction of the AS4 carbon fiber is documented by Johnston. 28 Varma-Nair et al. 29 measured the specific heat capacity of PES. Van Krevelen and Nijenhuis 30 developed a formula for the determination of the temperature-dependent heat conductance of amorphous thermoplastics. Applied on PES, the results show good accordance with the test results from Amesöder et al. 31
The specific heat capacity of the tape and the heat conductivity of the tape in fiber direction can be calculated with the help of the rule of mixture (ROM). 32,33 The transverse heat conductivity of the tape can be determined with an equation Springer and Tsai 33 developed and which was corrected later by Twardowski et al. 34
Measurement
The specific heat capacity was measured by temperature-modulated DSC (TMDSC) with a Q1000 machine from TA Instruments. The samples were cut from a three-layer laminate and processed by the TP-AFP machine. The average TMDSC heating rate was 3 K/min from 10 to 420°C. It was modulated by a sinus function with an amplitude of 1 K and a period of 100 s. Five samples were tested and the mean value was determined. Figure 7 shows the specific heat of the AS4 fiber, PES matrix, and the CF/PES tape calculated by ROM and from the TMDSC measurements. It can be observed that the specific heat differs from model and measurement for lower temperatures and converges around and above T g.
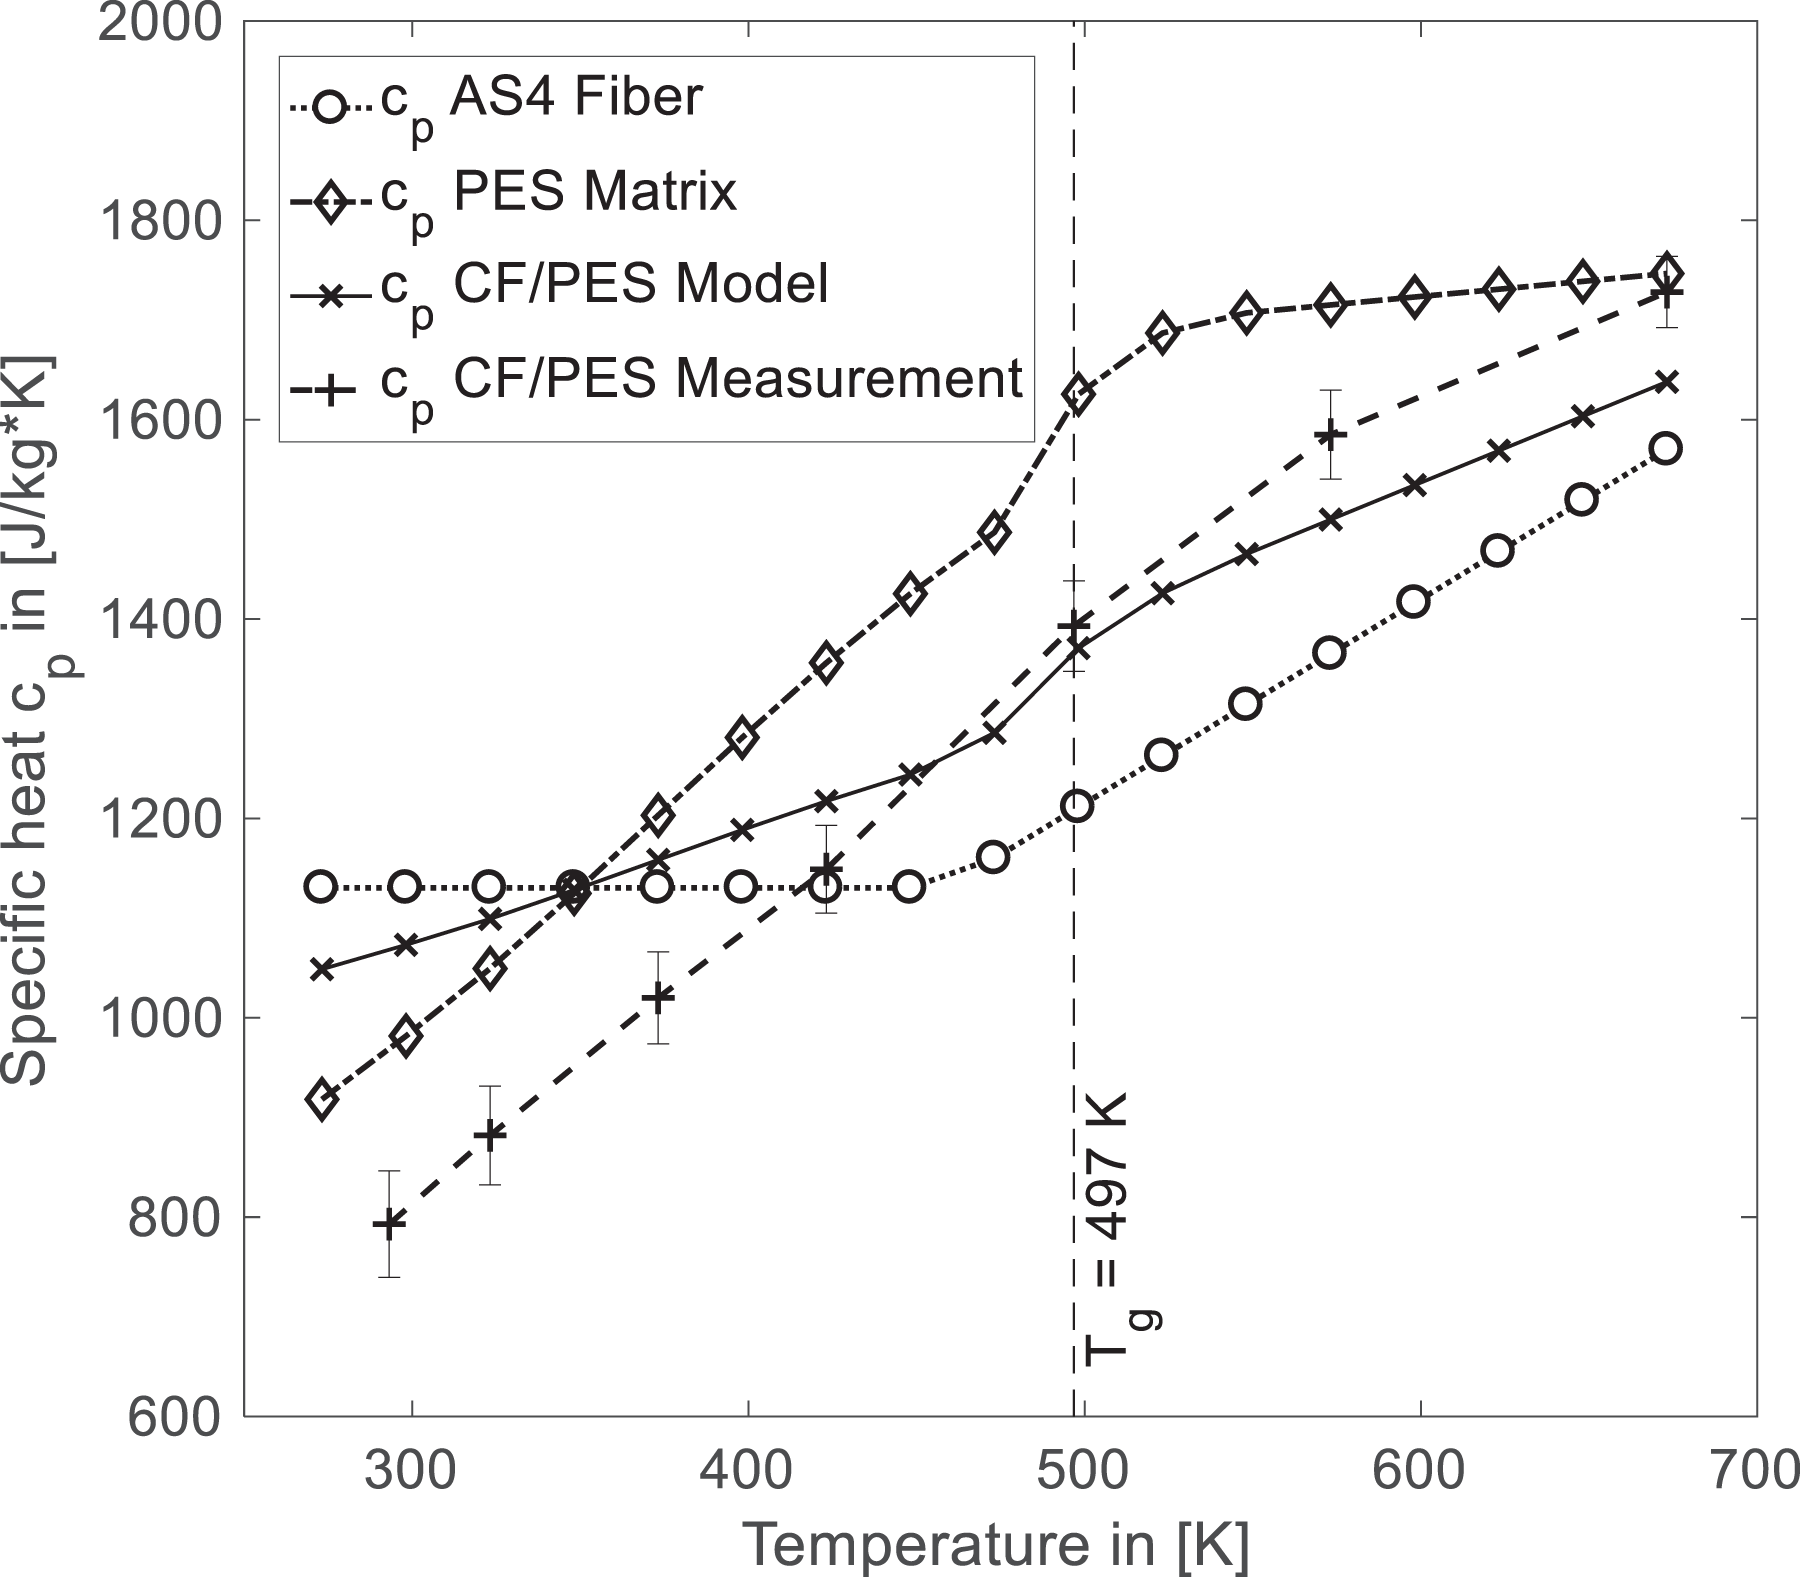
Specific heat capacity of AS4 carbon fiber, PES matrix, and CF/PES tape (fiber volume fraction 55%) determined by model and TMDSC measurement. CF/PES: carbon fiber/polyethersulphone; TMDSC: temperature-modulated differential scanning calorimetry.
The thermal conductivity of the CF/PES tapes was measured by LFA. A LFA 1000 machine from LINSEIS Messgeräte GmbH was used to measure the thermal diffusivity of the tape material in fiber direction (λ ||) and in transverse direction (λ ⊥). Five samples were tested and the mean value was determined. One-layer circular samples with a diameter of 13 mm were used for λ ⊥ measurements. Hot press consolidated 84 layer samples were used for λ || measurements to meet the required sample size of 10 × 10 × 1 mm3. The samples were dried at a temperature of 150°C for 5 h before testing. The thermal conductivity was measured between room temperature and 450°C every 25°C. Figure 8 shows the thermal conductivity of the material in fiber direction (||) and in transverse fiber direction (⊥) determined by model and measurements. Model and measurement are in very good agreement for λ ||. The decrease of λ || above 600 K is due to softening of the LFA specimens. A linear extrapolation of the measurements until 600 K is used instead. There is a rather big discrepancy for λ ⊥ between model and measurement. Only for temperatures above T g, the measured transverse conductivity assimilates with the calculated values.
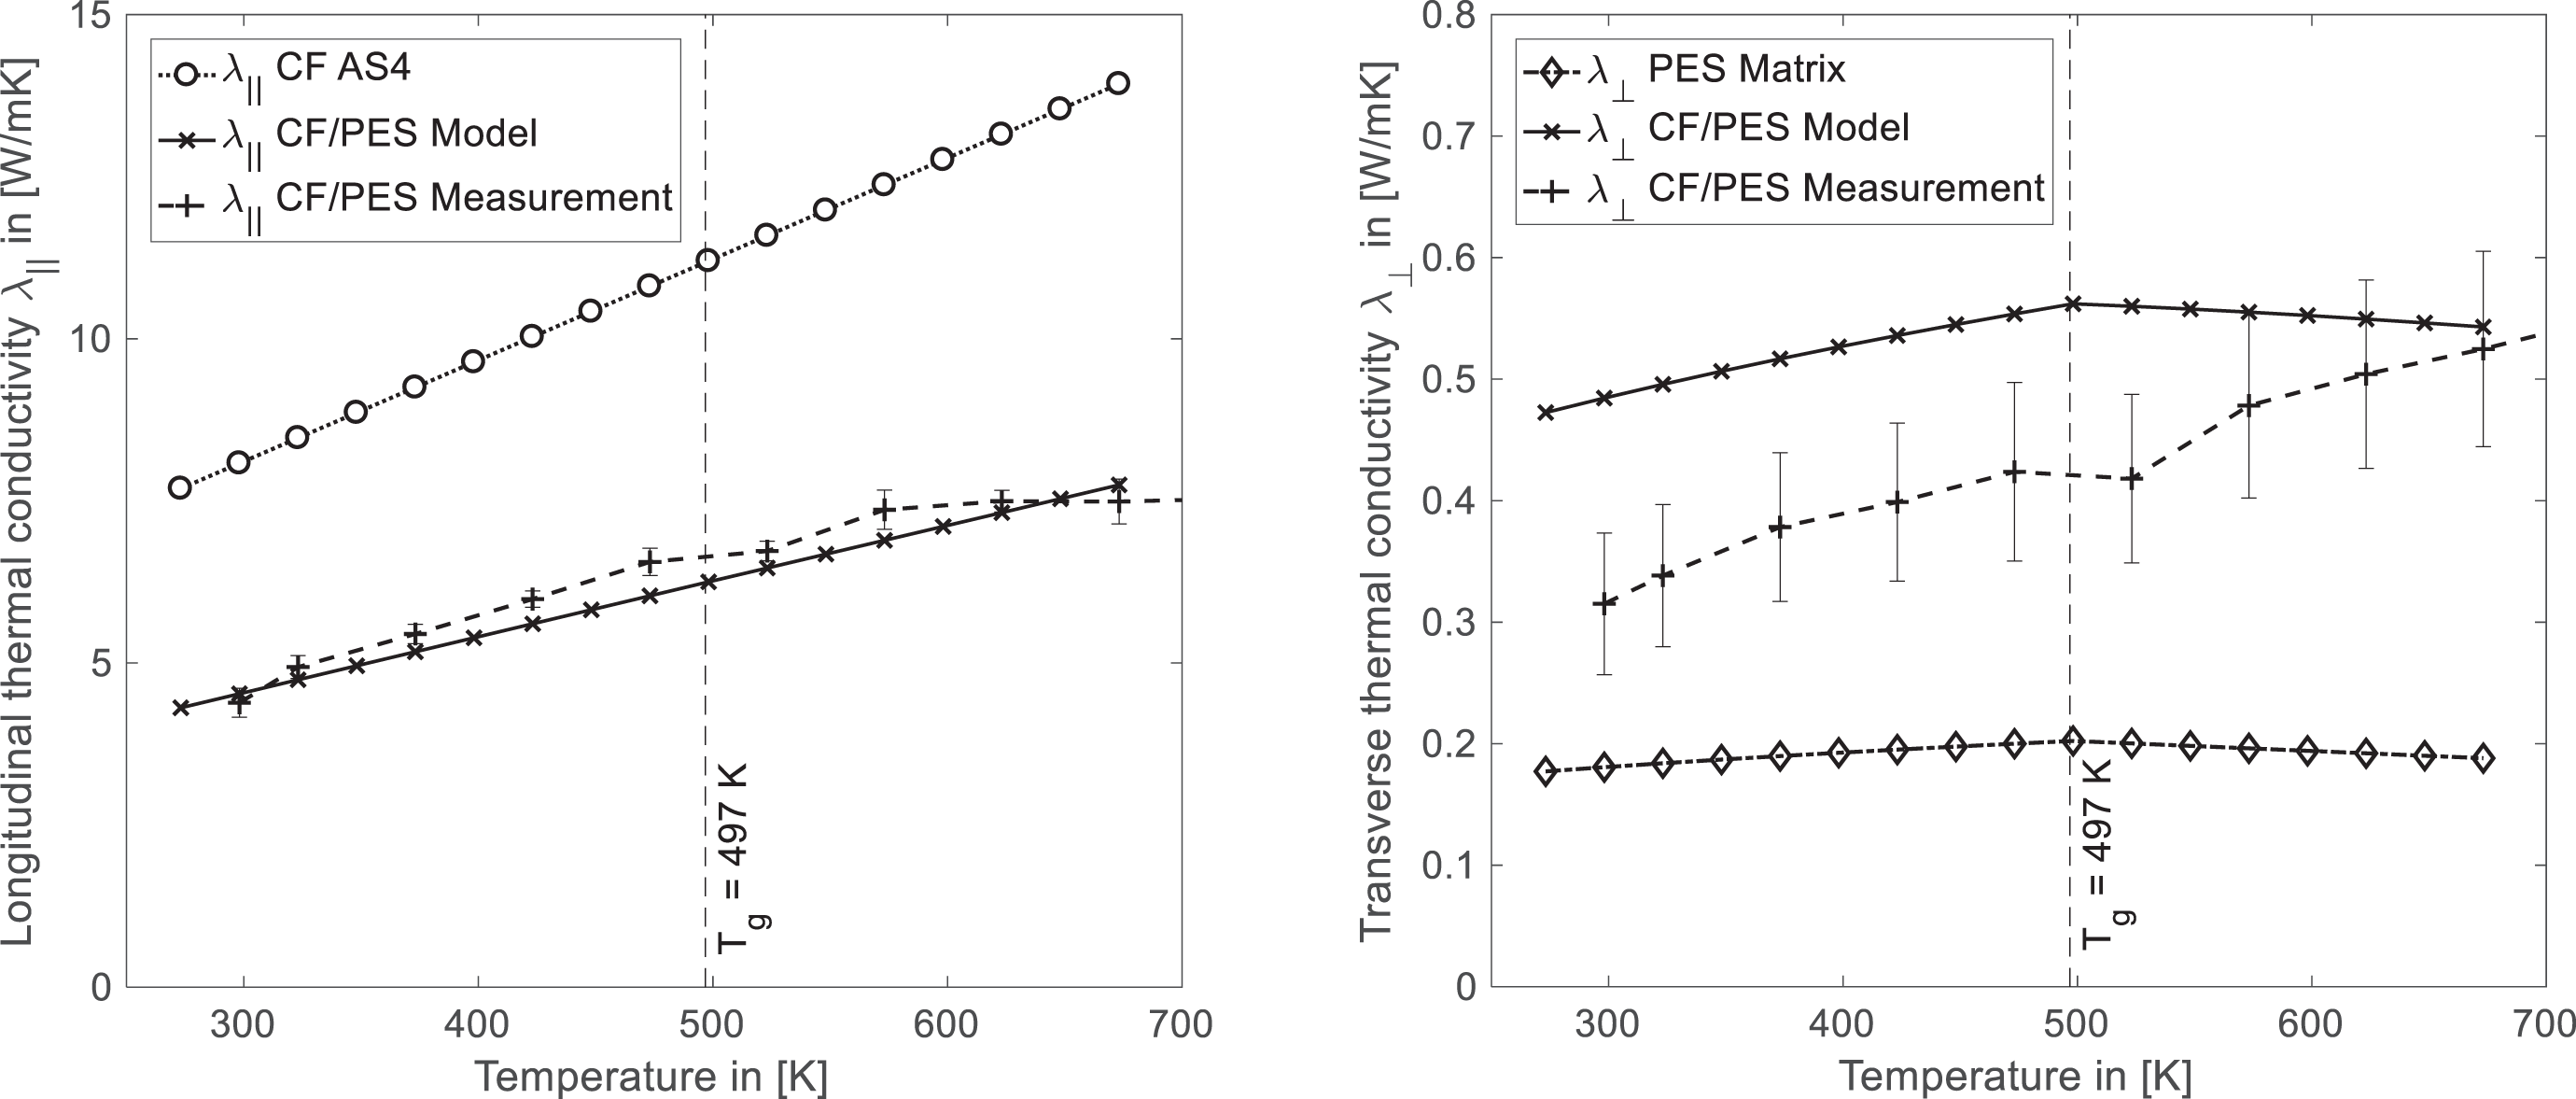
Thermal conductivity λ || and λ ⊥ of PES matrix and CF/PES tape determined by model and LFA measurement. CF/PES: carbon fiber/polyethersulphone; LFA: laser flash analysis.
Tool and compaction roller
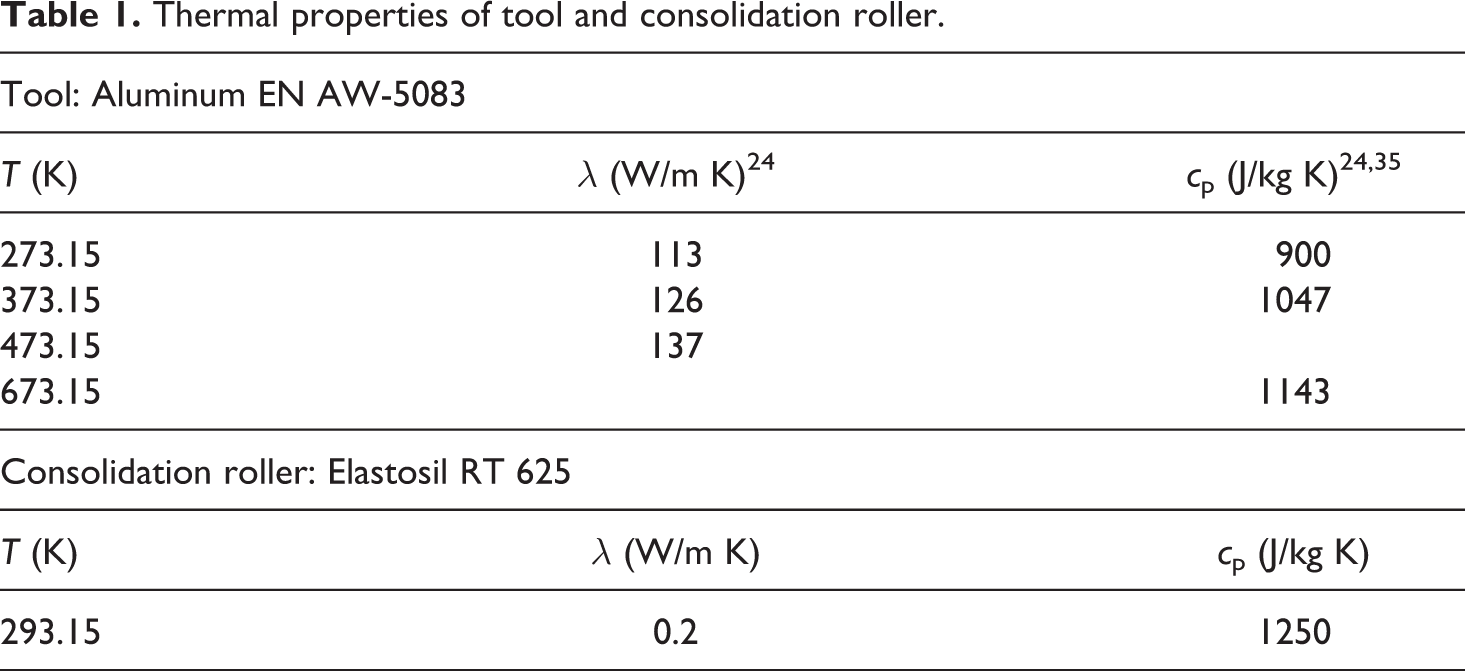
An unheated aluminum tool (material EN AW-5083) was used for the experiments.
Table 1 shows the properties for the tool and roller. For temperature values at which no measured value is reported, they are interpolated. Since the inside of the silicone compaction roller is water-cooled, the increase in temperature during the tape laying is not as high as in the tapes. Therefore, the effect of the temperature on the silicone properties is neglected and the values are assumed to be constant.
Thermal properties of tool and consolidation roller.
Thermal contact resistance
Thermal contact resistance within the laminate: Model
Recent studies indicate that thermal contact resistance has to be considered. 17 –19 Levy et al. created a function of the degree of intimate contact and surface roughness as well as transverse thermal conductivity. 19 For this study, a constant thermal contact resistance with a mean degree of intimate contact of 0.75 is used. The surface roughness is expressed by the depth of the asperities and chosen according to Levy et al. 19 to a 0 = 21.1 µm.
Thermal contact resistance within the laminate: Measurements
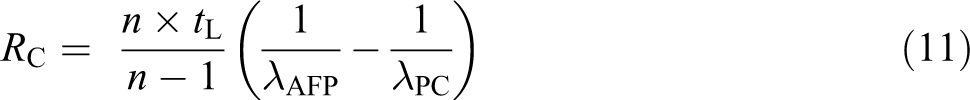
To determine the contact resistance between the CF/PES layers of the laminate, LFA measurements of seven-layer samples (thickness around 1 mm) were conducted. These seven-layer samples were manufactured with the TP-AFP machine and part of them were additionally post consolidated (PC) on a hot plate under a vacuum bag (20 min at 400°C). The PC seven-layer samples represent perfect bonding between the layers while the non-PC (AFP) seven-layer samples are expected to have a more distinct bonding interface. For both types of seven-layer CF/PES samples (PC and AFP), the thermal conductivity was determined by LFA between 25 and 250°C every 25°C. Five samples were tested for each type. The thermal contact resistance R C between n layers with thickness t L and (n − 1) interfaces is calculated by
It has to be noted that due to matrix flow, a small increase of fiber volume fraction may happen during post consolidation. Figure 9 shows the determined heat conductivity of the seven-layer PC and non-PC samples and the calculated thermal contact resistance derived from these measurements. Additionally, the thermal contact resistance calculated by the model of Levy et al. for crossply laminates is highlighted in the diagram.
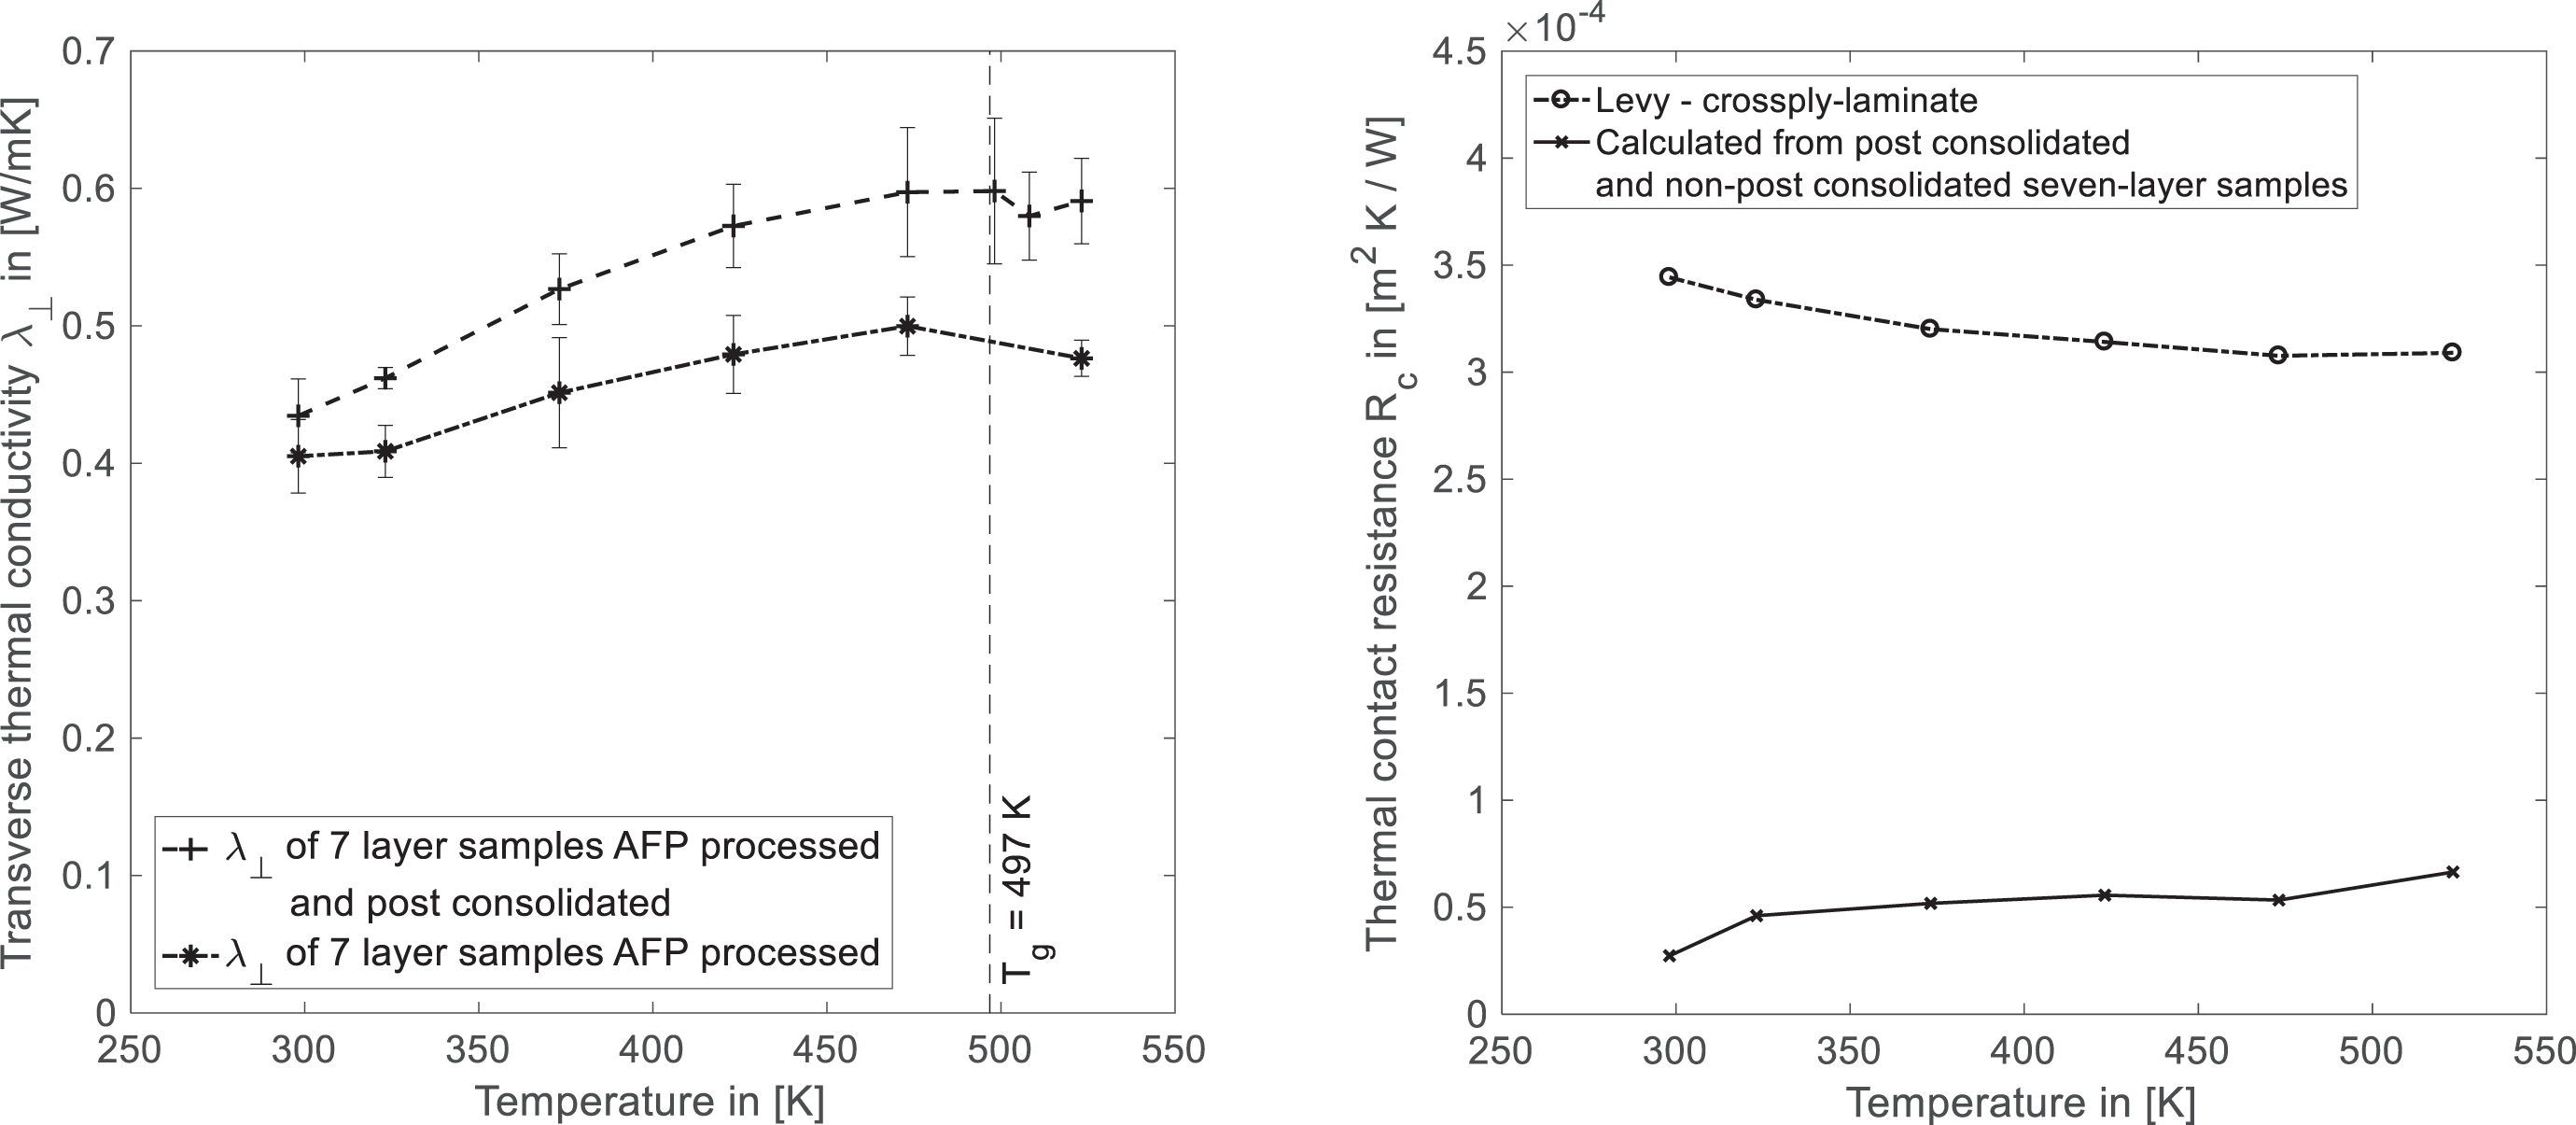
Heat conductivity λ ⊥ of seven-layer CF/PES tape with and without post consolidation (left) and derived thermal contact resistance from LFA measurements and by the model of Levy et al. for crossply laminates. CF/PES: carbon fiber/polyethersulphone; LFA: laser flash analysis.
Further experimental investigations were conducted to examine the evolution of the overall thermal conductivity of TP-AFP samples with different number of layers. The thermal conductivity of one-layer to seven-layer samples of TP-AFP-processed tapes was determined in a LFA setup at room temperature. The assumption is, if a significant thermal contact resistance exists, the overall thermal conductivity of the samples will decrease with an increasing number of plies and interfaces.
Figure 10 shows the thermal conductivity and the respective layer thickness for the samples with increasing number of layers. No significant increasing or decreasing trend for the thermal conductivity can be found with respect to the number of processed layers.
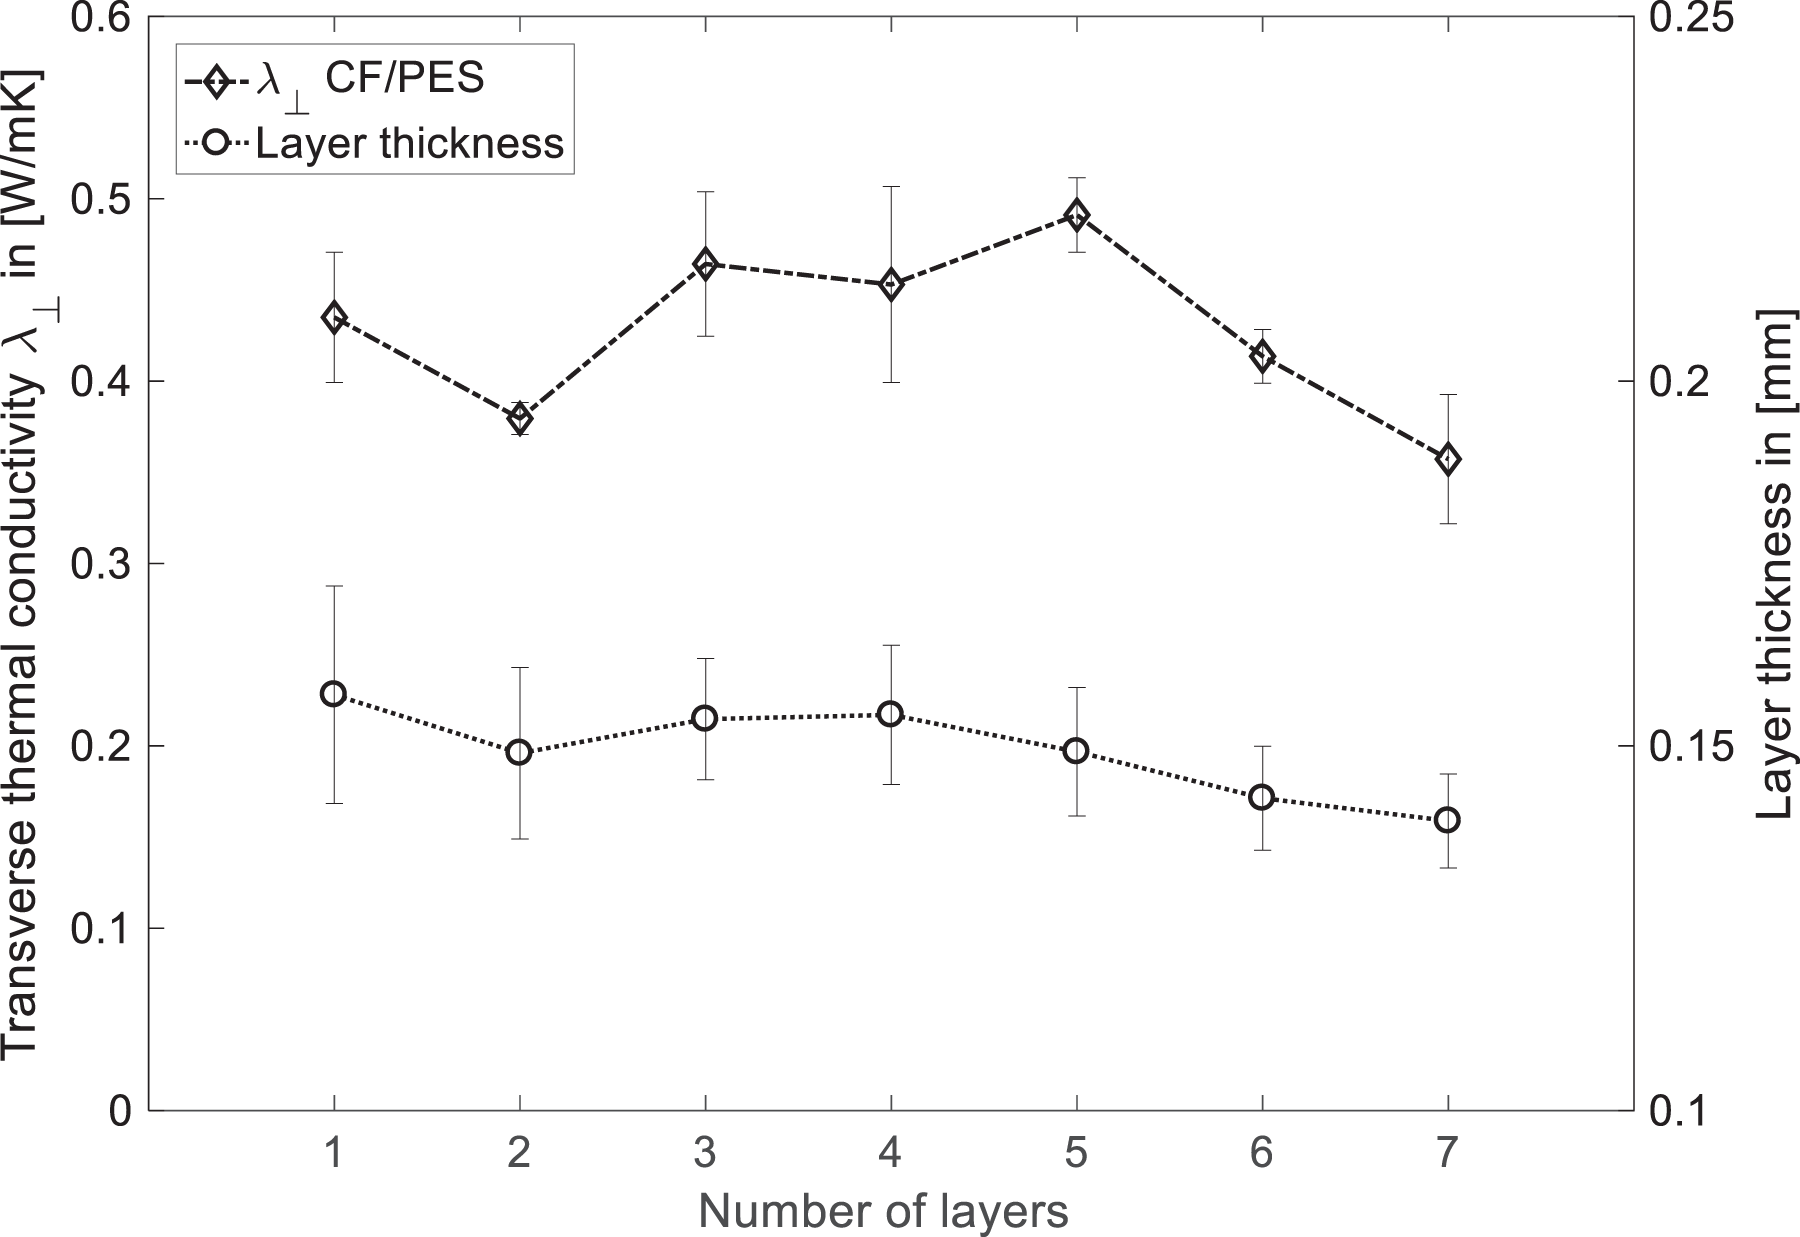
Transverse heat conductivity λ ⊥ of processed one- to seven–layer CF/PES samples from LFA measurements at room temperature. CF/PES: carbon fiber/polyethersulphone; LFA: laser flash analysis.
Figure 11 shows micrograph of the unprocessed CF/PES tape (top) and of a seven-layer sample processed by TP-AFP (bottom). The initial tape is fully impregnated and shows a homogeneous fiber distribution with a matrix-rich surface and low void content. After processing, a matrix-rich area is visible between the layers but almost no voids are visible at this interface. Thus, excellent bonding can be expected. However, some voids inside the tape layer are visible. It is assumed by the authors that intra-ply voids cannot be removed during the short time of TP-AFP processing. From experience and these micrographs, it can be concluded that tapes of high quality are necessary for excellent in situ laminate quality. Dominating factors for the tape quality are degree of impregnation, void content, fiber, and matrix distribution, especially on the tape surface and surface roughness.
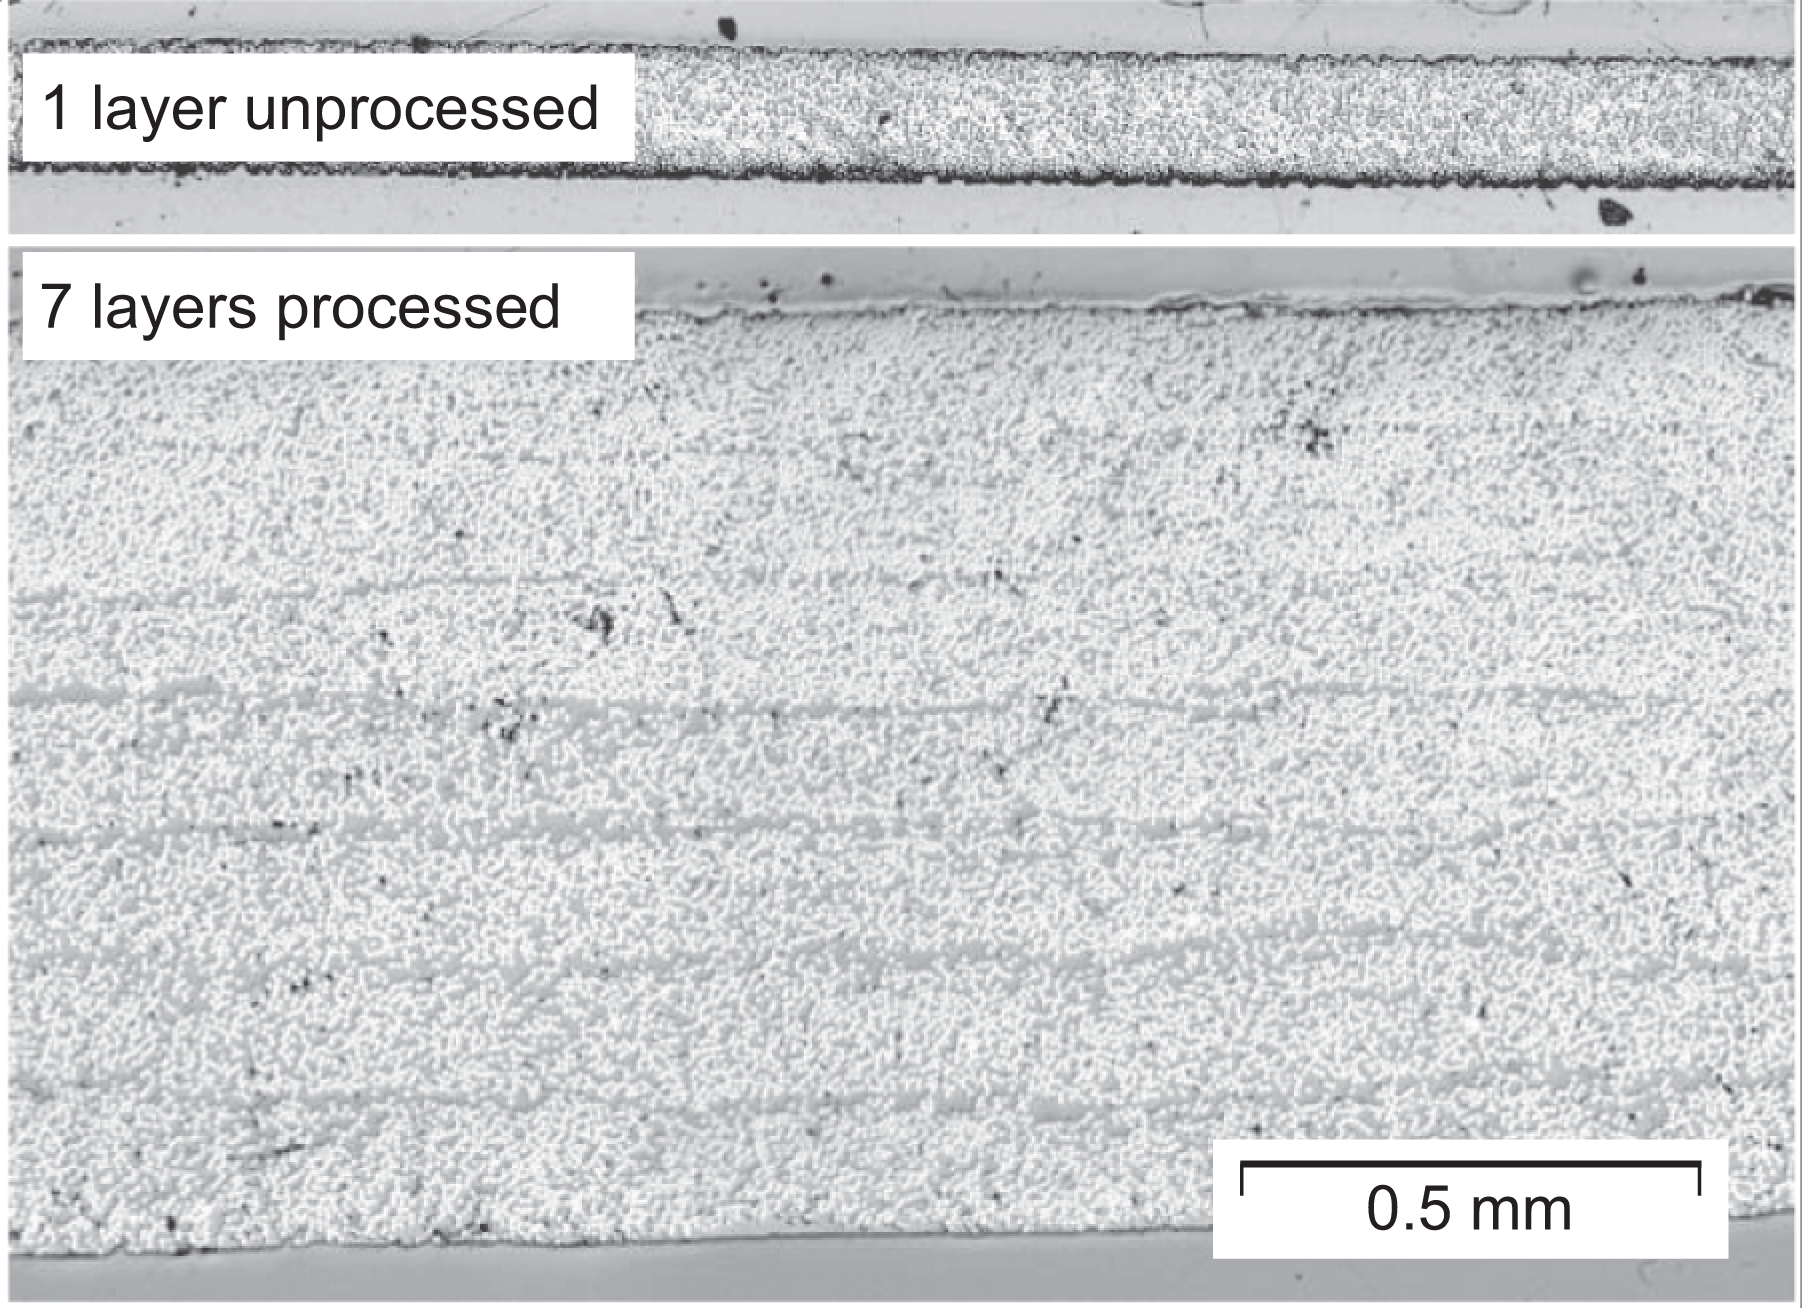
Micrographs of unprocessed single layer and seven–layer CF/PES sample for LFA measurements at room temperature. CF/PES: carbon fiber/polyethersulphone; LFA: laser flash analysis.
Thermal contact resistance between laminate–tool and laminate–compaction roller
The heat transfer coefficient of the interface between the tool and the first tape layer h r,tool is estimated by the thickness and conductivity of the adhesive tape for first layer fixation at 1650 W/m2 K. The heat transfer coefficient between the incoming tape and the compaction roller h r,roller is assumed to be 500 W/m2 K according to Stokes-Griffin et al. 16
Simulation and process parameters
The dimensions of the tape placement head and of the laser beam for the simulation are given in Figure 12 and Table 2. All parameters were kept constant during experiment and simulation. According to the laser and laser optics manufacturer LASERLINE, an efficiency of 90% was assumed for the laser optics.
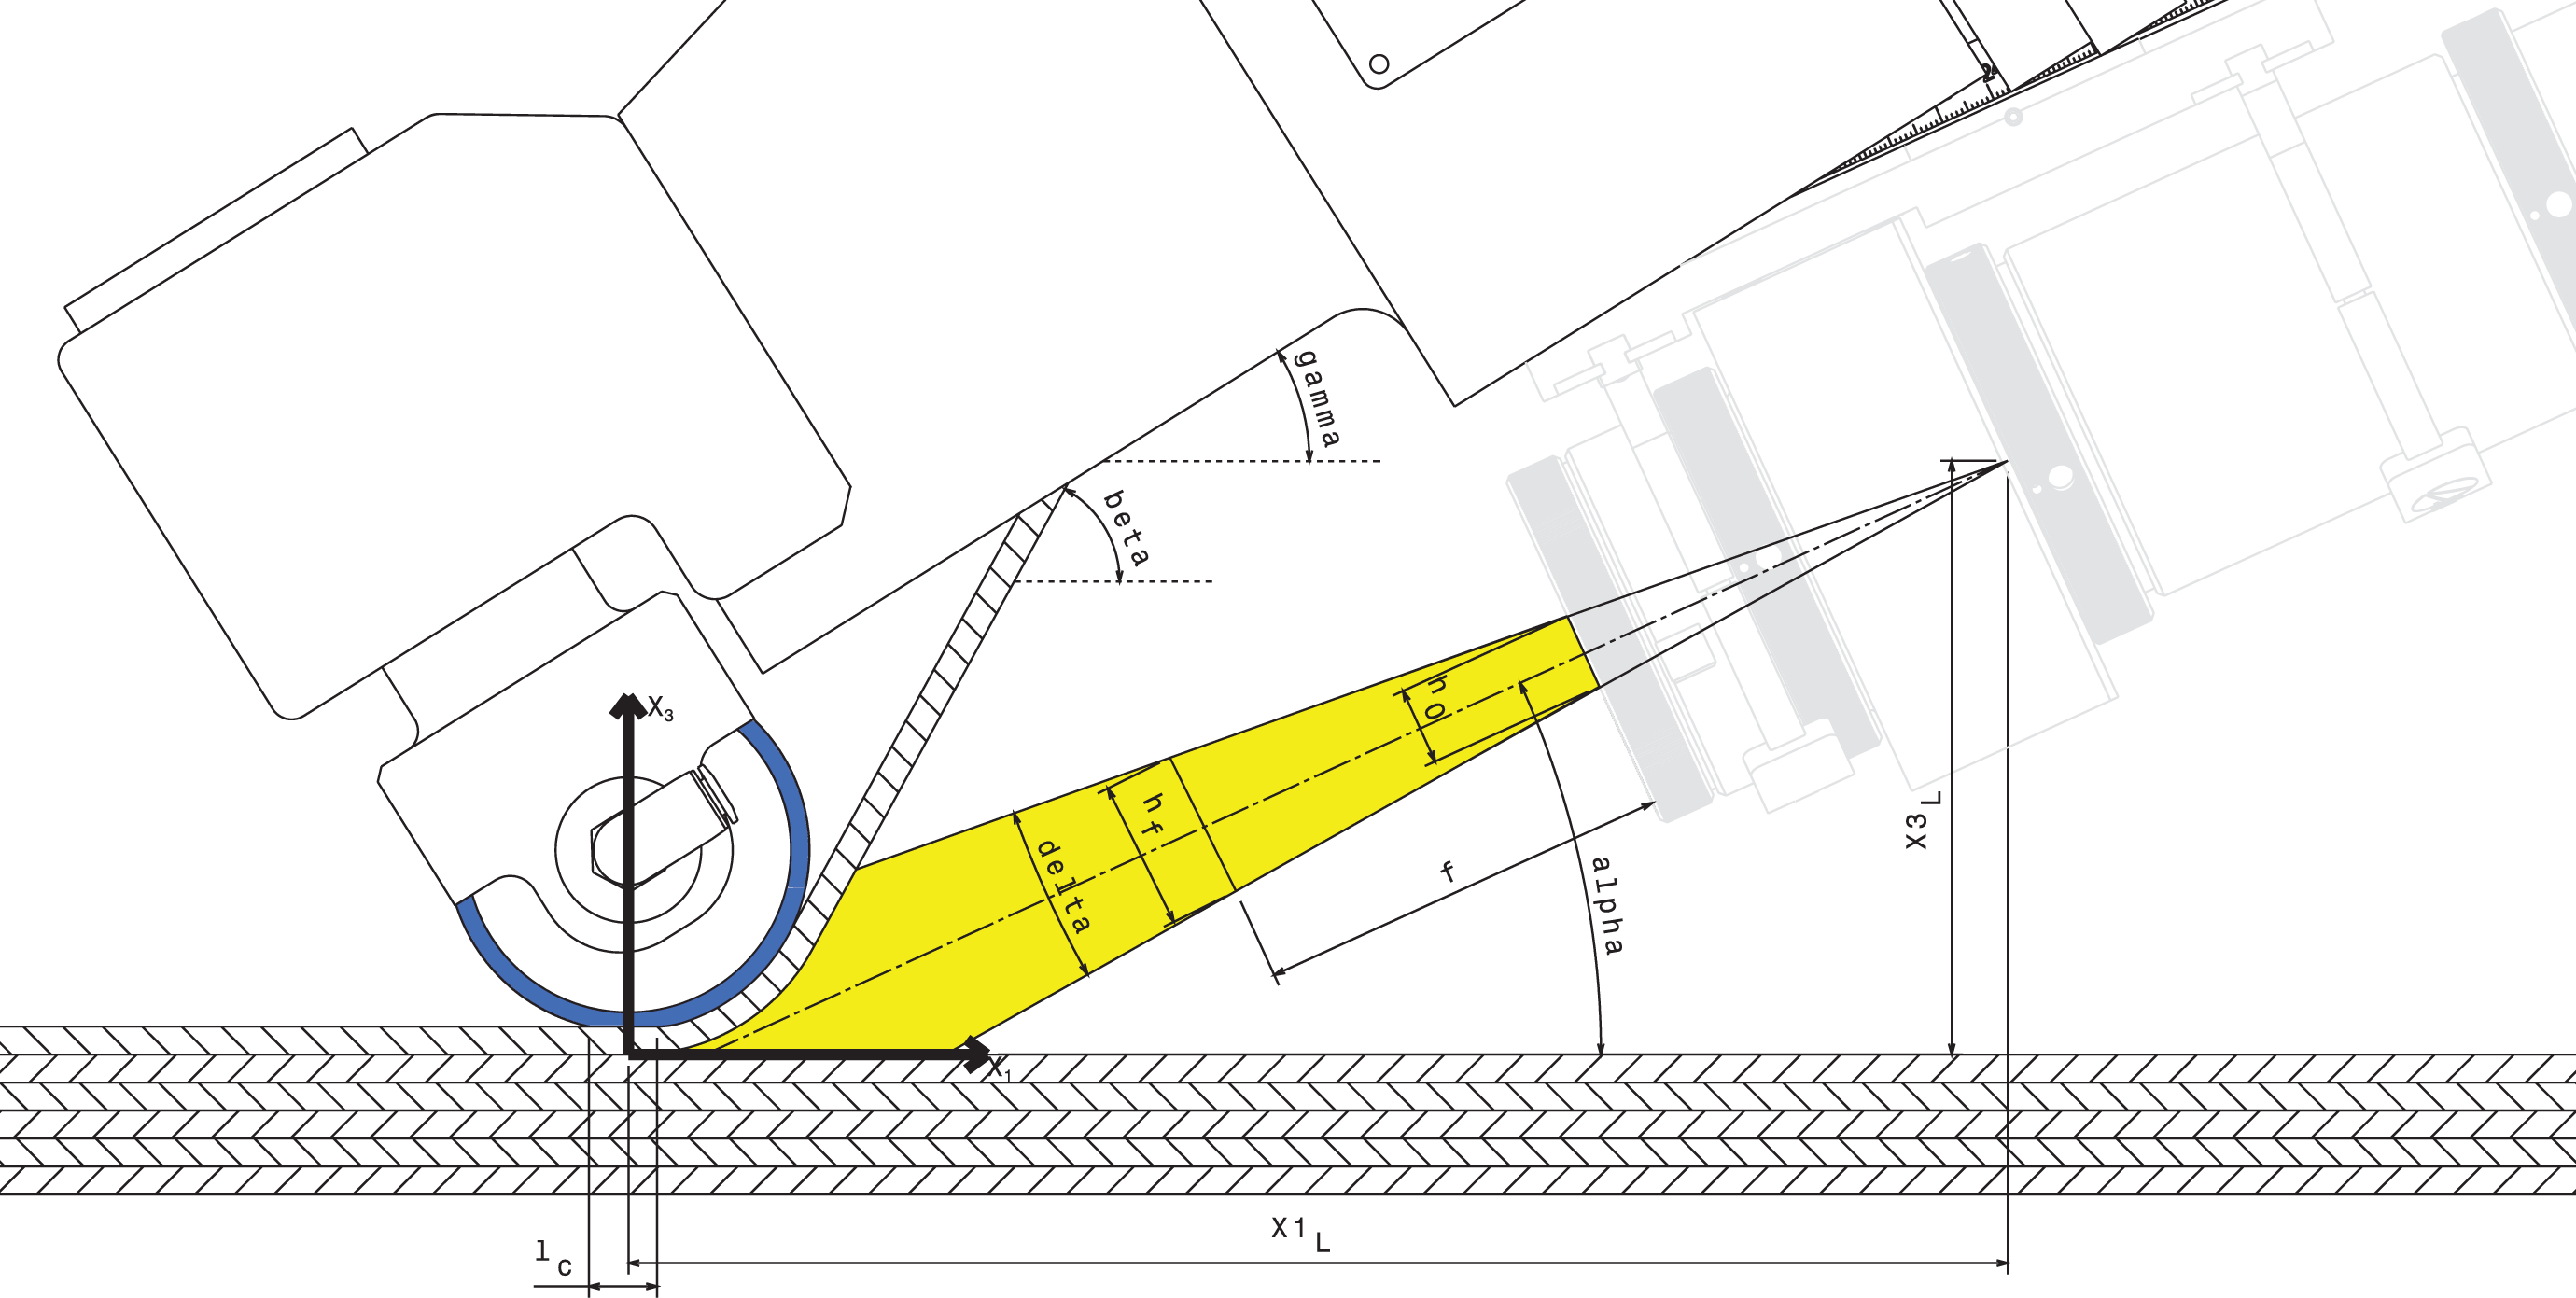
Geometry of tape-laying head for experiment and simulation.
Simulation and process parameters for CF/PES layup.
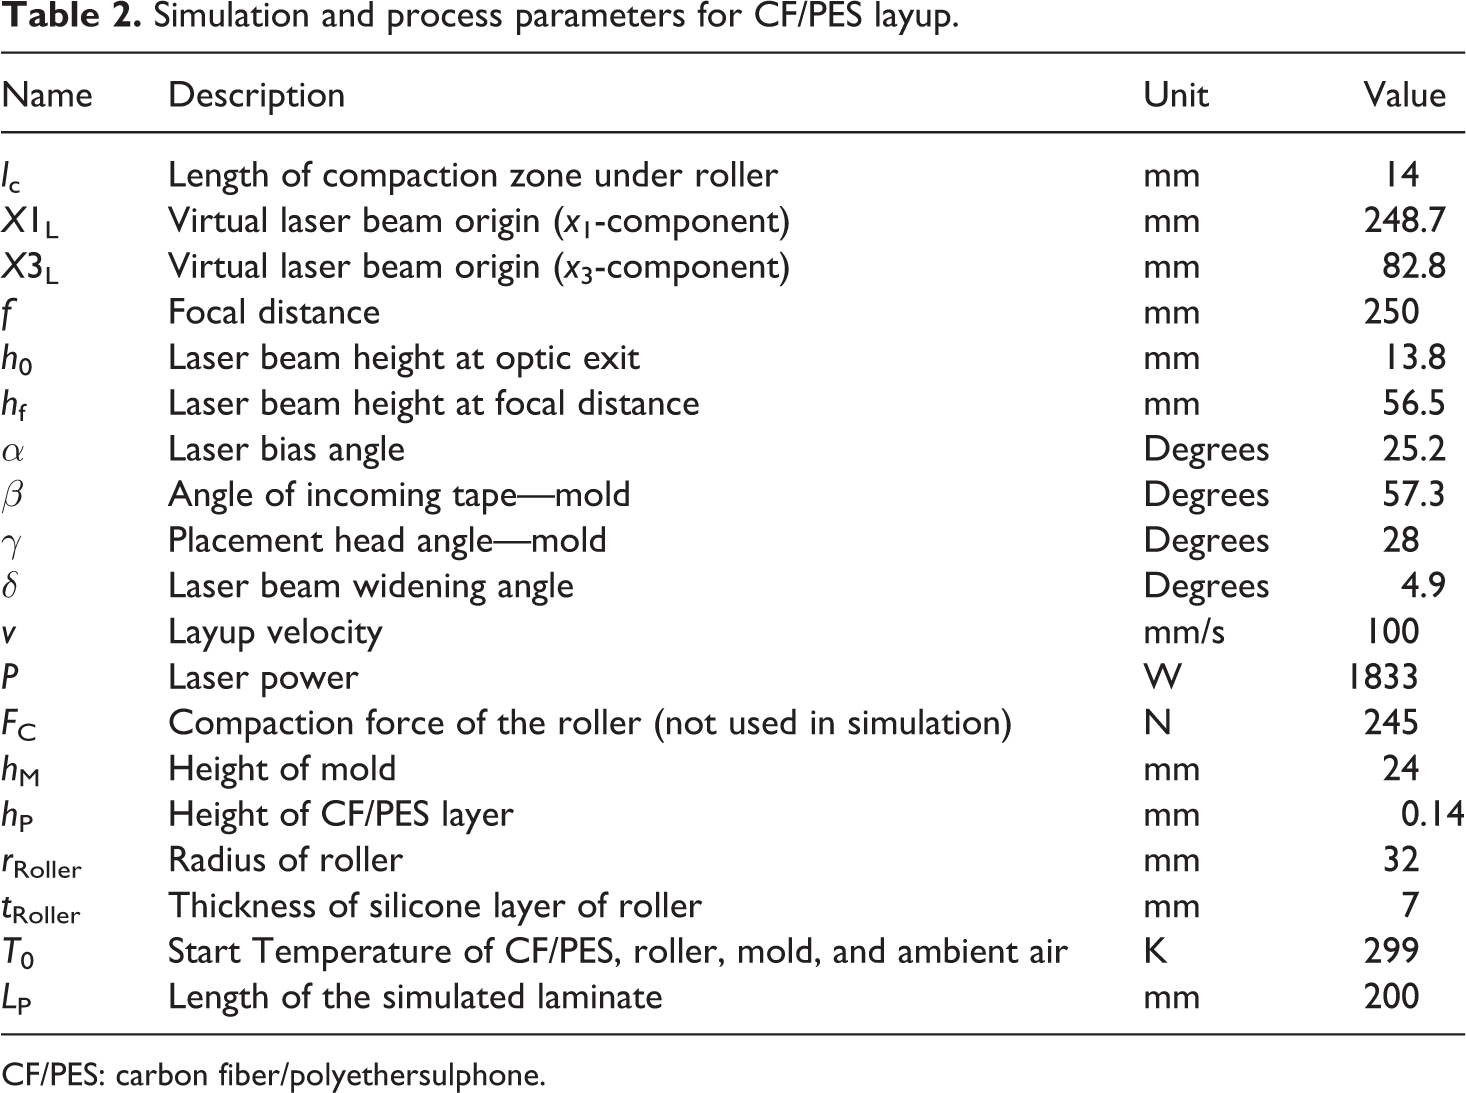
CF/PES: carbon fiber/polyethersulphone.
Results and discussion
The simulation calculates the temperature distribution of the composite, roller, and mold for each time step. Figure 13 shows the temperature plot during layup of the 12th CF/PES layer. The plot simplifies the geometry of the incoming tape and roller. A virtual TC is put between layer 10 and 11 as in the experiments. Also, the relevant laser points from Figure 3 are highlighted in the plot.
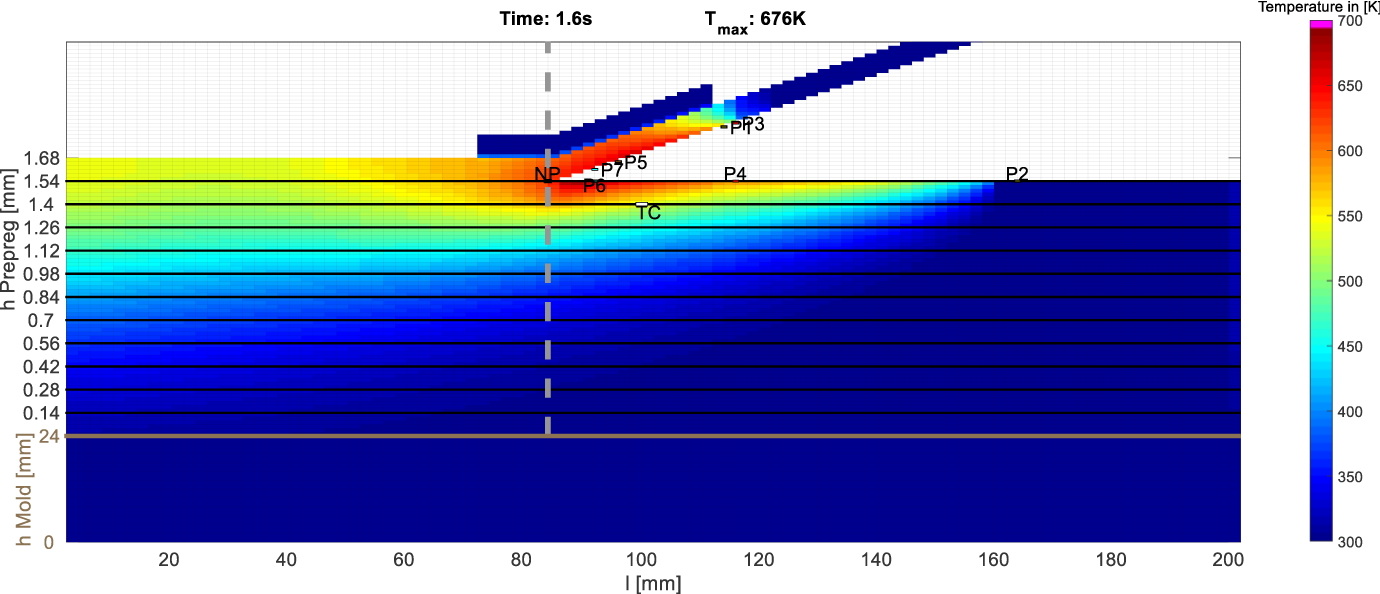
Temperature distribution of the simulated layup of the 12th layer, with compaction roller segment and laser points.
A convergence study was carried out to investigate the influence of the size of the simulation time step (dt) and element size in fiber direction (dx 1) and in thickness direction (dz). Figure 14 shows the maximum temperature of a virtual TC on layer 10 during the layup of layer 12 for different time steps. Layup speed, element size in fiber direction and time step, and are linked by the equation

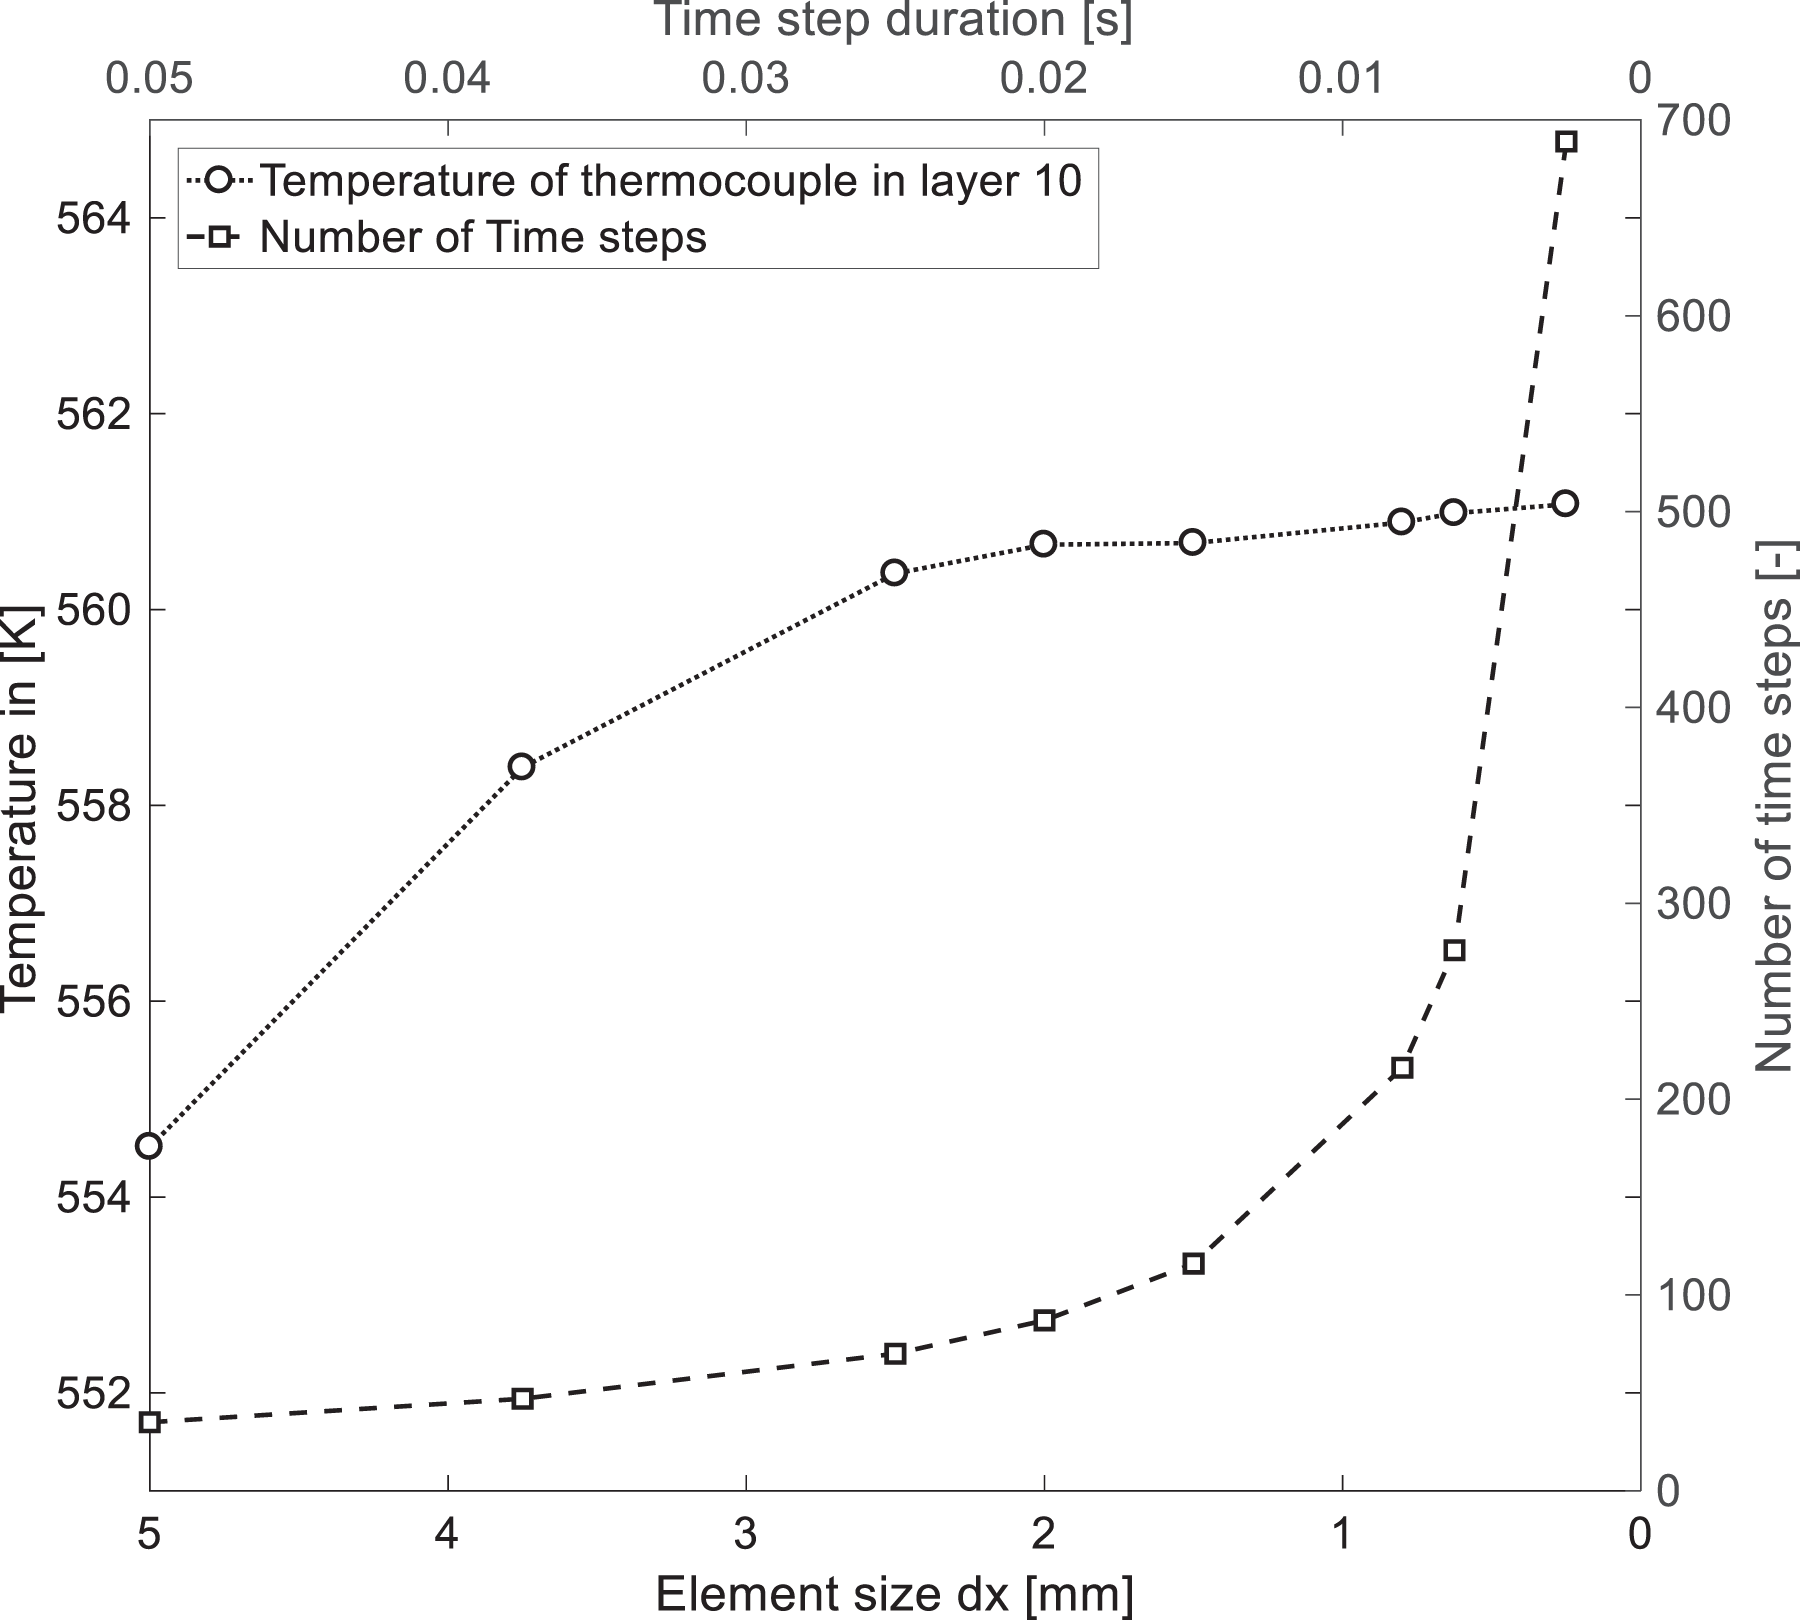
Convergence study of maximum temperature and virtual TC temperature on layer 10 when laying down layer 12 with respect to element size and time step duration. TC: thermocouple.
Consistent results are achieved by time steps smaller than 0.02 s.
The energy flux distribution on the incoming tape and the substrate laminate is being calculated during the simulation according to the geometric design of the layup head and the laser optics (Figure 15). The graphs in the figure show the amount of energy input by direct illumination, first-order reflection from the other side, and the total energy input. The energy flux is shown for both modeling strategies. The calculated energy input by Fresnel’s law is shown by dots and the bars represent the energy input based on the measured absorption and reflection behavior of the tape. The energy flux distribution of modeled and measured absorption behavior is very similar. The difference of the totally absorbed energy is less than 1%. The heated length, starting at the NP, of the laser on the incoming layer is about half of the length as on the laminate substrate.
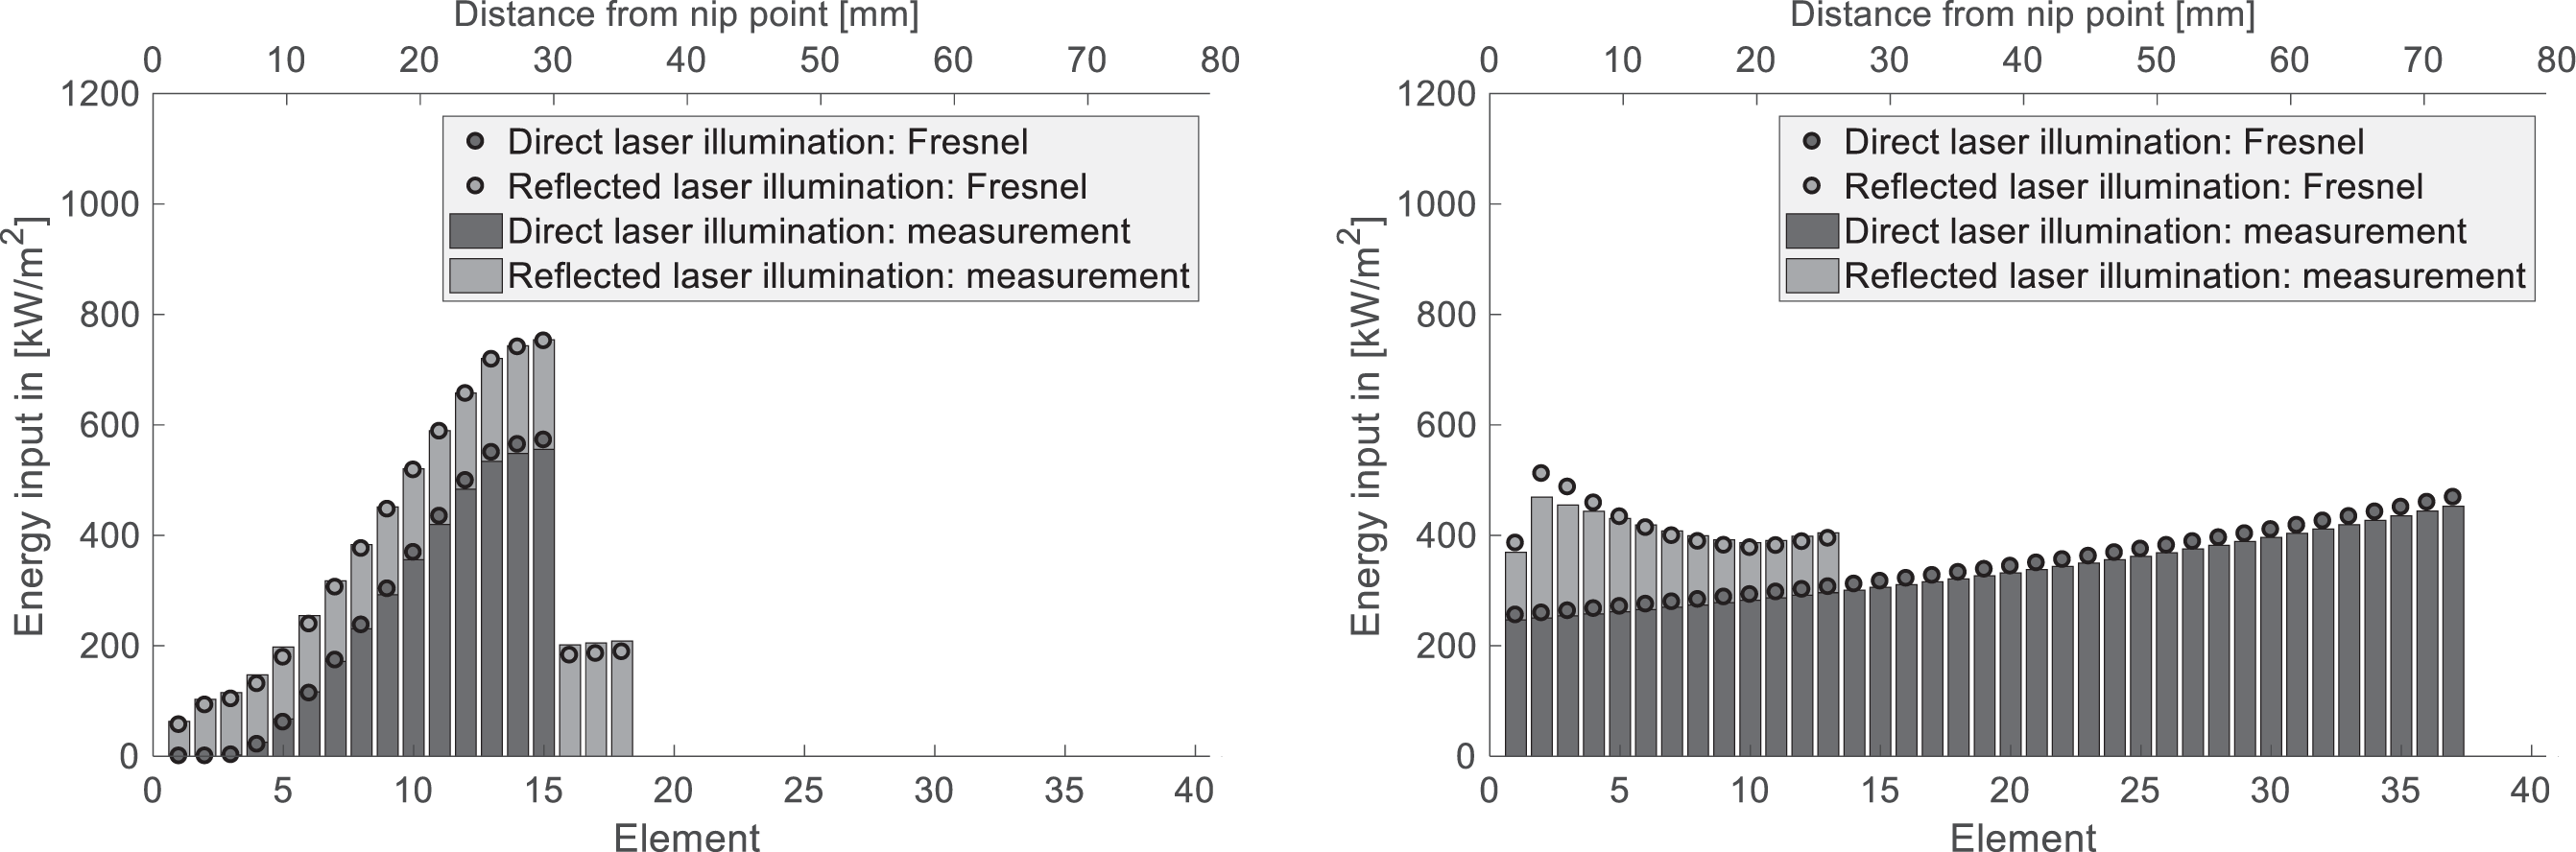
Energy input of laser into incoming layer (left) and substrate (right) by direct laser illumination, first reflection from the other side, and total energy input for Fresnel’s absorption/reflection (points) and measured absorption/reflection (bars).
On the incoming tape, the heated length by reflection is longer than by direct laser illumination. As the compaction roller causes a shadow, there is no direct illumination on the incoming tape right before the NP. The reflected laser radiation reaches until the NP. As the laser angle θ1 is constant for the substrate laminate, the reflected energy from the substrate to the incoming layer is only depending on the local energy density. The energy density on the substrate by direct illumination is depending on the elements proximity to the laser optics, as the laser has a divergent behavior. The reflection from the incoming tape to the substrate laminate starts at 35% of the direct laser illuminated area and the reflected energy increases toward the NP due to the increase of the angle of attack of the laser θ1 on the incoming tape toward the NP. The reflected energy decreases just before the NP due to the shadowing effect of the roller. Around 22% of the absorbed laser energy on tape and substrate laminate has been reflected from the other side before.
A comparison between the mean value of the TC measurements and the simulations’ virtual TC is shown in Figure 16. The simulations were conducted with the modeled optical and thermal material properties as well as with the measured optical and thermal material properties of CF/PES. Contact resistance according to Levy et al. is used for the modeled CF/PES tape, while results from the LFA measurements are used for the measured CF/PES tape. Additionally, a simulation without the reflected energy input was done as well.
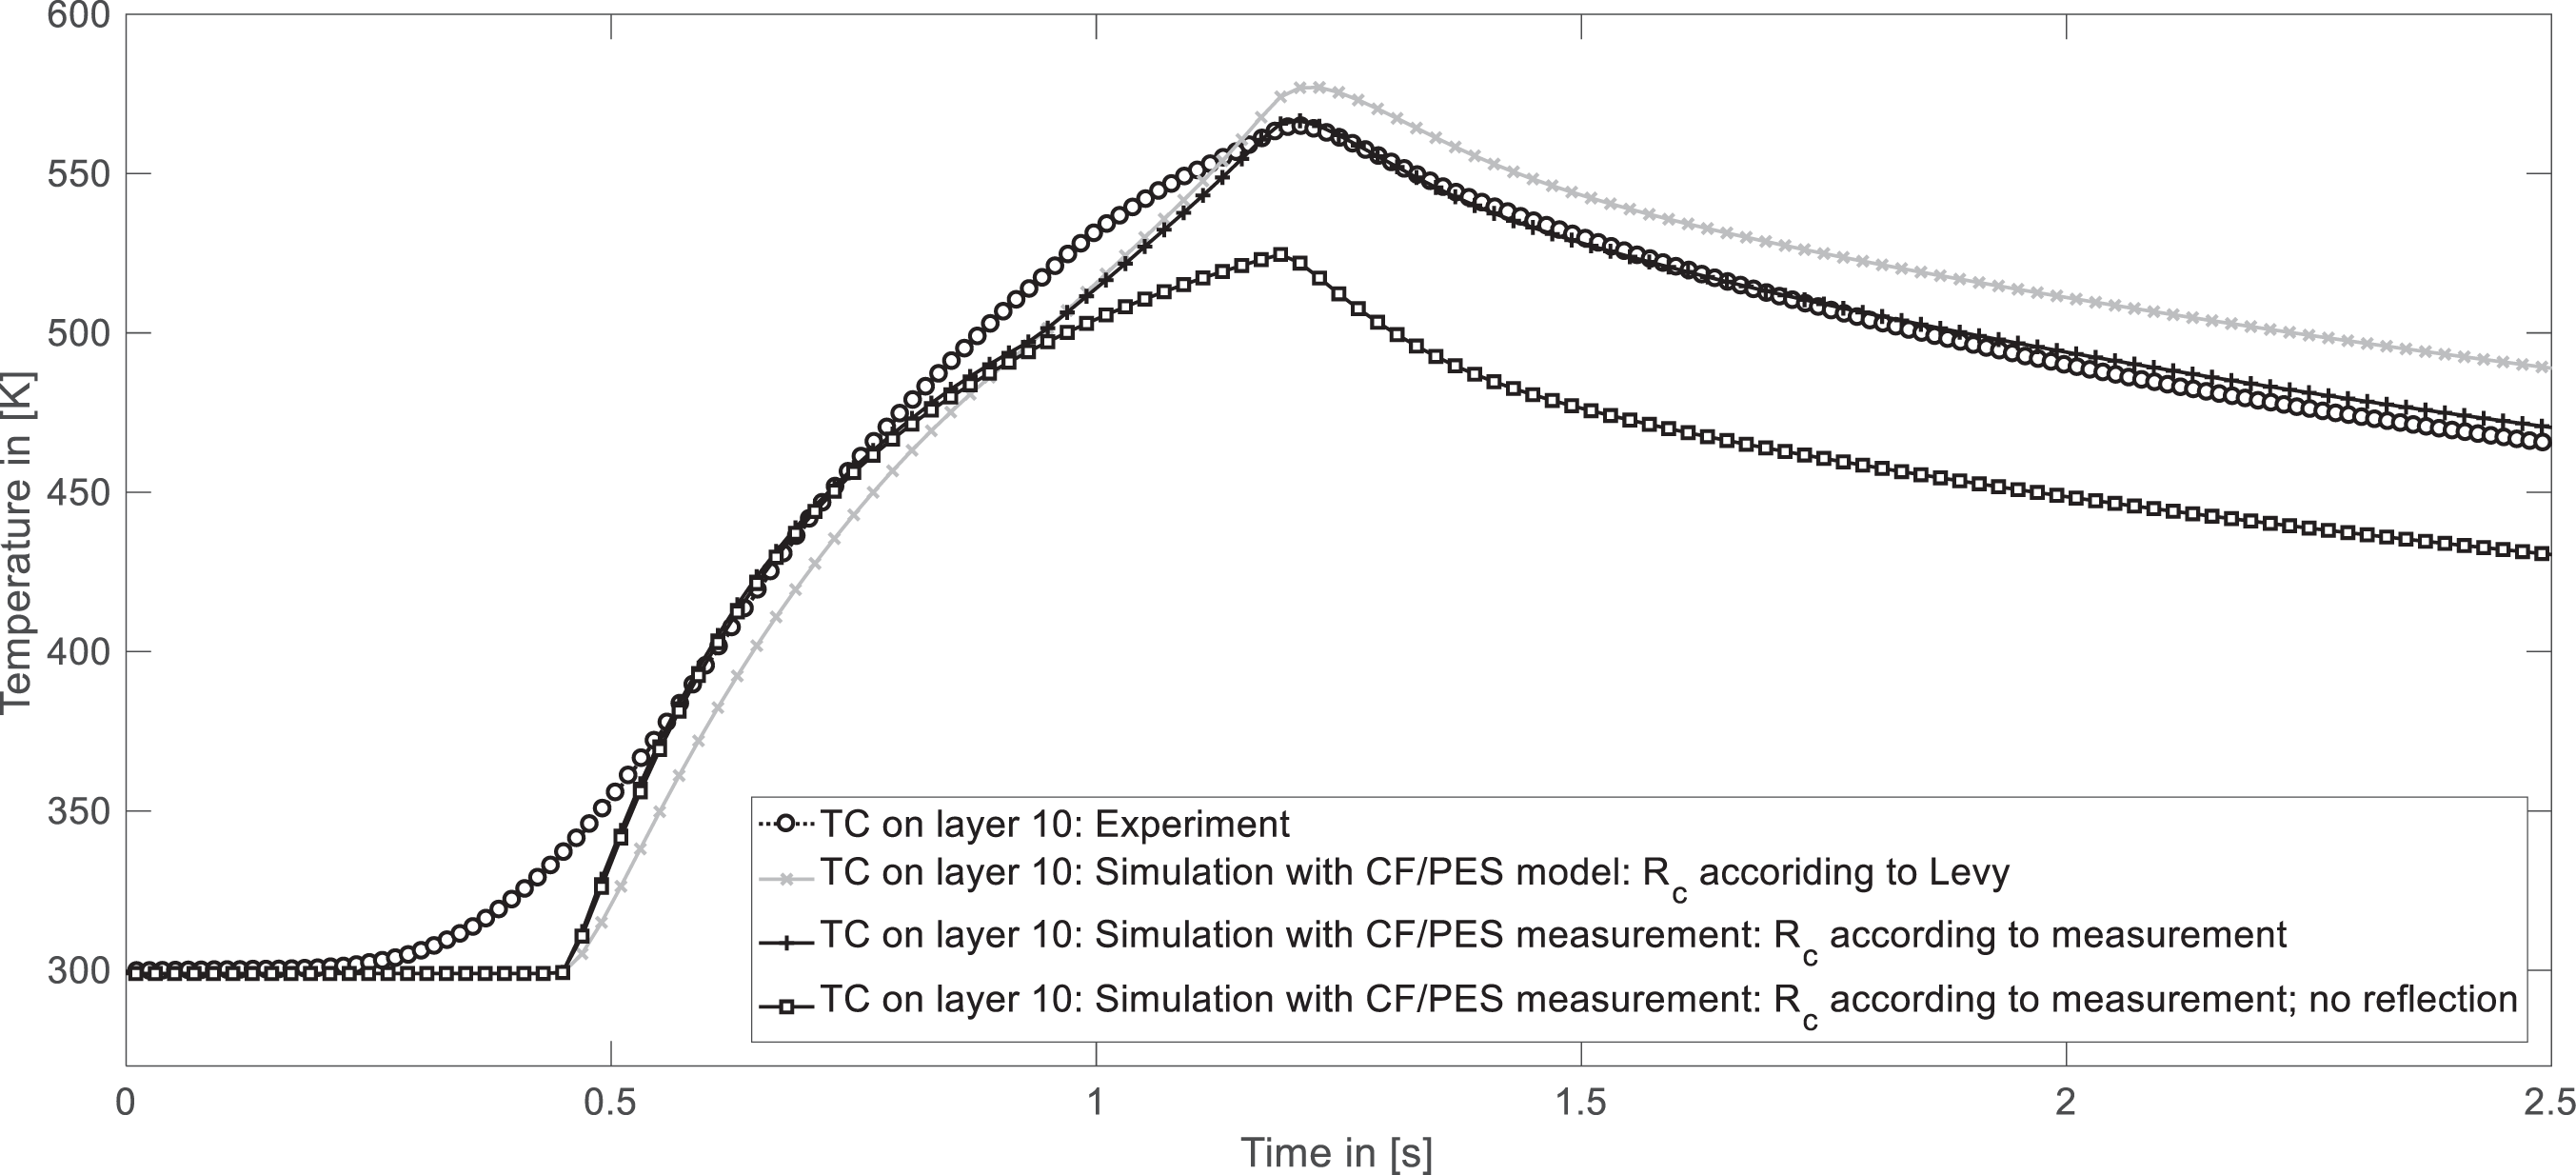
Comparison of experimental TC and virtual TC on layer 10 while layup on layer 12 for different simulation strategies. TC: thermocouple.
The rise in temperature at the beginning is softer in the experiments and steeper in the simulation. This can be attributed to a softer runout of the laser intensity at the boundaries of the laser spot in reality. The laser spot is modeled as a top hat profile with divergent distribution. Stokes-Griffin and Compston 15 already showed that an emittance function improves the laser spot intensity representation. In the simulation, there is a drop in temperature rise before the maximum temperature is reached. The additional temperature rise is attributed to the reflected energy. Heat input by direct illumination decreases toward the NP until the heat input increases due to additional reflected laser illumination before the NP. In contrast to the experimental setup, the modeled laser with a top hat intensity profile has a more distinct change in intensity at the transition to the reflected area (see transition from element 13 to 14 in Figure 15, right). The simulation with only direct illumination confirms this. At the beginning, the temperature curve of the virtual TC is congruent to the simulation with reflection but results in a lower maximum temperature (525 K instead of 567 K).
A higher maximum temperature is reached in the simulation with modeled CF/PES material properties (+21 K). The temperature rise is stronger at the beginning with the measured CF/PES properties compared to the simulation with modeled properties. This changes before the maximum temperature is reached. It is assumed that this is due to the presence of a significant thermal contact resistance in the laminate by the model from Levy et al. Despite these deviations, the simulation predicts the overall temperature rise, the maximum temperature, and the temperature drop very well.
To examine the effect of the modeled thermal contact resistance between the CF/PES layers, both the measured thermal contact resistance and the resistance according to the model of Levy et al. were simulated. Additionally, no thermal contact resistance (R c) but normal transverse heat conductivity (λ ⊥) as it is modeled inside the layers is simulated between the CF/PES layers as well. Figure 17 shows the vertical temperature profile from bottom (mold) to the top (roller) under the NP for these simulations (see also dashed vertical line in Figure 13). A significant drop in temperature at each layer interface can be observed for the thermal resistance according to the model by Levy et al. Almost no temperature difference occurs for the experimentally determined thermal resistance. The difference to the simulations without thermal contact resistance, but λ ⊥ between the layers is very small. This indicates that the thermal conductivity at the interface between the layers is equivalent to the conductivity inside the CF/PES tape. The vertical temperature profile is almost identical for both simulations with modeled and measured CF/PES properties and no thermal contact resistance between the layers. This indicates that the thermal contact resistance is significant for the in-depth temperature distribution and must be modeled correctly.
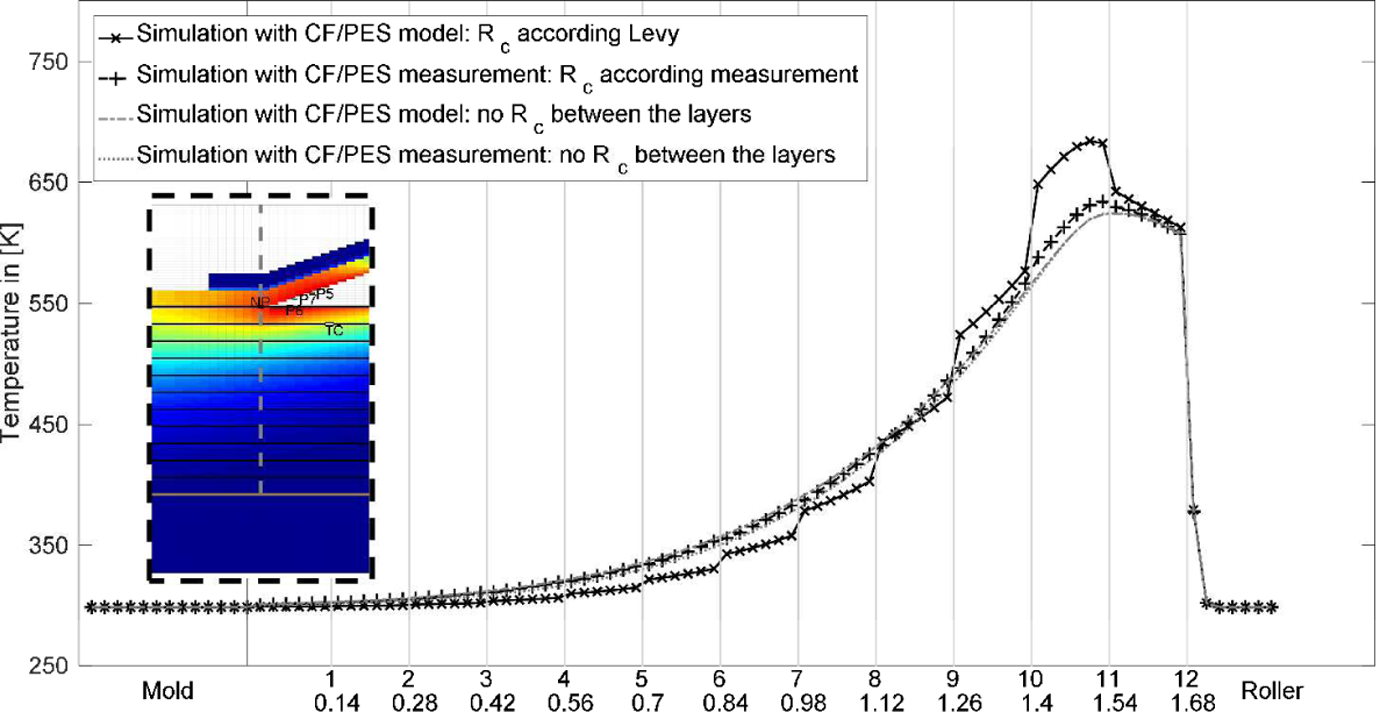
Influence of thermal contact resistance: vertical temperature profile from simulations with modeled, measured and with no thermal contact resistance between the CF/PES layers. CF/PES: carbon fiber/polyethersulphone.
When also considering the λ ⊥ measurements of the one- to seven-layer samples in the LFA (compare Figure 10), this suggests that a fully consolidated laminate can be produced with the presented combination of CF/PES tape, process conditions, and TP-AFP machine (in situ consolidation).
Conclusion and future work
A 2-D simulation for the analysis of the temperature distribution with an integrated energy input calculation is presented. A more realistic, nonuniform heat input profile is determined within the simulation with only limited numerical cost. The simulation shows that the first-order reflection has to be taken into account, as 22% of the energy would be neglected otherwise. This would result in a significant lower temperature prediction in the laminate.
A comparison of the absorption behavior of the CF/PES tape according to Fresnel’s law and measurements in a spectrophotometer shows only minor difference in the resulting laser energy input (less than 1%).
Two approaches for material modeling are realized. The properties of the CF/PES tape are calculated by models from the literature according to literature properties of fiber and matrix. Additionally, a study to experientially determine the properties of the consolidated tape was conducted. A comparison of the modeled and measured tape properties shows that the specific heat varies only for temperatures below T g and converges for higher temperatures. Also, the longitudinal thermal conductivity λ || of the modeled and measured CF/PES tape is in very good agreement. However, modeled and measured values of the transverse thermal conductivity λ ⊥ vary up to 35%.
It can be concluded that for best results in a thermal simulation, the transverse thermal conductivity λ ⊥ should be determined or checked by measurements. Specific heat, longitudinal thermal conductivity λ ||, and the absorption behavior can be calculated by models to reduce the experimental time and effort.
The presence and possible influence of a thermal contact resistance between the layers, as it can occur due to insufficient bonding, is investigated. A thermal contact resistance is derived from the difference of the overall thermal conductivity of PC and TP-AFP-processed seven-layer laminates. The measured thermal contact resistance of the TP-AFP-processed samples is smaller than predicted by a model from literature. Additionally, a test campaign to determine the contact resistance from the overall transverse conductivity of one- to seven-layer samples is presented. There is no change in overall transverse conductivity with increasing number of layers detectable by the LFA measurements.
Simulations with both approaches for the tape material properties and thermal contact resistances were compared with experimental TC measurements during layup trials. Best results were found with the measured tape properties. The simulation predicts the temperature rise and also the cooling of the laminate very well. The model by Levy et al. overestimates the thermal contact resistance between the layers for the TP-AFP process used in this study. The machine used in this study from AFPT GmbH has a laser heating system with a relatively large laser spot heating both joining partners directly before the NP and is capable for in situ processing of the investigated material. It seems there is no significant thermal contact resistance present in the laminate. Micrographs of the laminate confirm this.
In the presented study, a layup speed of 100 mm/s was used. Industrial AFP machines for thermoset composites operate at much higher layup speed. Stokes-Griffin and Compston 36 show that CF/PEEK can be in situ processed up to 400 mm/s without affecting the samples’ short-beam strength. With increasing layup speed, they also increased the process temperature and adjusted the laser distribution between incoming tape and substrate laminate. Although Stokes-Griffin and Compston show that layup speed can be increased significantly for in situ consolidation, future studies are needed to determine the limit.
The authors plan to conduct a parameter study, investigating the influence of machine (e.g. roller diameter, machine head angle) and process parameters (laser bias angle, laser optics position, and tool temperature) on the resulting temperature distribution during layup. The presented 2-D simulation of the TP-AFP process is capable to be adjusted with little effort for AFP machines with different design from various manufacturers.
Also the simulation of the layup on crossply laminates is intended.
In this study, the thermal contact resistance was used as a criterion to evaluate the bonding of the tape layers. A mechanical test campaign to validate the criterion and to reference the temperature distribution and the bonding of the layers is planned as well.
Future work will also focus on TP-AFP layup on no flat surfaces (3-D). During 3-D layup, the heated area, heating time, and laser intensity on the tape change due to the geometric conditions of the part geometry. This can result in insufficient heating or overheating and damage the material. Especially, sharp convex corners are critical. In the presented simulation approach, the heat input can be calculated at every time step within the simulation and it will be capable to predict the temperature profile on such 3-D parts as well.
Footnotes
Acknowledgements
The authors would like to express their gratitude to Australian National University for the support for spectrophotometer and LFA measurements and the Universität Augsburg for their support for LFA measurements of CF/PES tapes and also gratefully acknowledge the support of Luciano Avila Gray, Daniel Stelzl, Alexander Carrels, and Husam Fruja during specimen preparation and testing. The authors thank the German Federal Ministery of Economics and Technology (BMWi) for funding this research under the ZIM programme within the AiF project “Accurat3”.
Declaration of Conflicting Interests
The author(s) declared no potential conflicts of interest with respect to the research, authorship, and/or publication of this article.
Funding
The author(s) disclosed receipt of the following financial support for the research, authorship, and/or publication of this article: This work was supported by the German Federal Ministry of Economics and Technology (BMWi) under the ZIM programme within the AiF project “Accurat3.”