
Abstract
Twin screw extrusion (TSE) is one of the commercially established processes for reinforcement of metallic/nonmetallic/ceramic fillers in polymer matrix for tailor-made applications. In this study, biocompatible feedstock filament has been prepared (in-house) for commercial fused deposition modeling (FDM) setup with biocompatible grade polymers, namely polyvinyl chloride and polypropylene which was reinforced with the hydroxyapatite particles. The process parameters (namely, material composition, rotational speed of TSE, die temperature of TSE, HAp particle grain size, and applied load on TSE) were optimized using Taguchi L18 orthogonal array. In this study, mechanical, thermal, and metallurgical properties have been established, and best-feedstock filament wire for development of partial/complete denture on the FDM with functionally graded surfaces properties has been recommended for future applications.
Introduction
Polymers are mostly used all over the world due to its properties such as more strength to weight ratio, high temperature/chemical/corrosive resistance, nonconductivity, high clarity, reprocessability, and low cost. The mechanical processing of polymers demands very less amount of energy as compared to other materials. 1–2 Polymers extrusion is an unpredictable process, and hence, it is highly prone to fluctuate in nature. 3 There are variety of twin-screw extruders commercially available depending on its end-use application. 4 If centerline distance between the shafts is less than the screw diameter, the screws are called intermeshing unless called nonintermeshing. 5 Twin-screw extruders have many advantages over single-screw extruders. Better feeding and more positive conveying characteristics allow the machine to process hard-to-feed materials. 6 Some studies highlighted that the synthetic hydroxyapatite (HAp) particles were reinforced into a polymer matrix to produce composites for medical applications, and corotating twin-screw compounding produces an effective and homogeneous distribution of HAp particles in a polymers matrix, which is maintained after compression moulding. 7 –9 The HAp-reinforced polymer bio-composites offer a robust system to engineer synthetic bone substitutes with tailored mechanical, biological, and surgical functions; the basic design rationale has been to reinforce a tough, biocompatible polymer matrix with bioactive HAp filler. 10 The new-generation biocompatible polymer shows excellent blood compatibility and biocompatibility and has been approved for medical use by the food and drug administration. 11 The construction of biocompatible surfaces is a pivotal requirement for medical or analytical devices that contact blood. 12–13 Scaffold design and fabrication are major areas of biomaterial research, and they are also important subjects for tissue engineering and regenerative medicine research. 14 Scaffolds are defined as three-dimensional porous solid biomaterials designed to perform some or all of the following functions: (i) promote cell–biomaterial interaction, cell adhesion, and ECM deposition, (ii) permit sufficient transport of gases, nutrients, and differentiation, (iii) biodegrade at a controllable rate that approximates the rate of tissue regeneration, and (iv) provoke a minimal degree of inflammation or toxicity in vivo. 15 The developing scaffolds with the optimal characteristics, such as their strength, rate of degradation, porosity, and microstructure, as well as their shape and sizes are more readily and reproducibly controlled in polymeric scaffolds. 16 –19 The previous reported literature suggests that the scaffold material can be synthetic or biological, degradable, or nondegradable depending upon the intended use. 20 –26
The literature review reveals that many researchers have performed parametric optimization of twin screw extrusion (TSE) process for preparation of fused deposition modeling (FDM) feedstock filament wire. But hitherto very less has been reported for preparation of in-house biocompatible feedstock filament for commercial FDM setup without any change in hardware or software of the system. So, in the present work, biocompatible grade polymers (namely, polyvinyl chloride (PVC) and polypropylene (PP)) were reinforced with the HAp to prepare feedstock filament wire for development of partial/complete denture (on the FDM) with functionally graded surfaces properties for dental applications. For the present study, five input parameters (namely, composition of material, revolution per minute of the screw, temperature, grain size of HAp, and load applied) were judicially selected for preparation of in-house feedstock filament with mixture of PVC with PP and reinforced with HAp as filler.
Experimentation
In pilot experimentation, an effort has been made to prepare the feedstock filament of biocompatible grade of PVC and PP in the ratio of 70:30 (by weight). The first step was to check the possibility of preparation of feedstock filament of PVC and PP, which is reinforced with HAp with varying input parameters. Taking random selection of different composition/proportions of polymer materials, the best parametric condition or range of parametric condition was established for TSE. Figure 1 shows schematic of TSE. For this study commercial make: HAAKE Mini CTW, (Dieselstr, Karlsruhe, Germany) has been used.
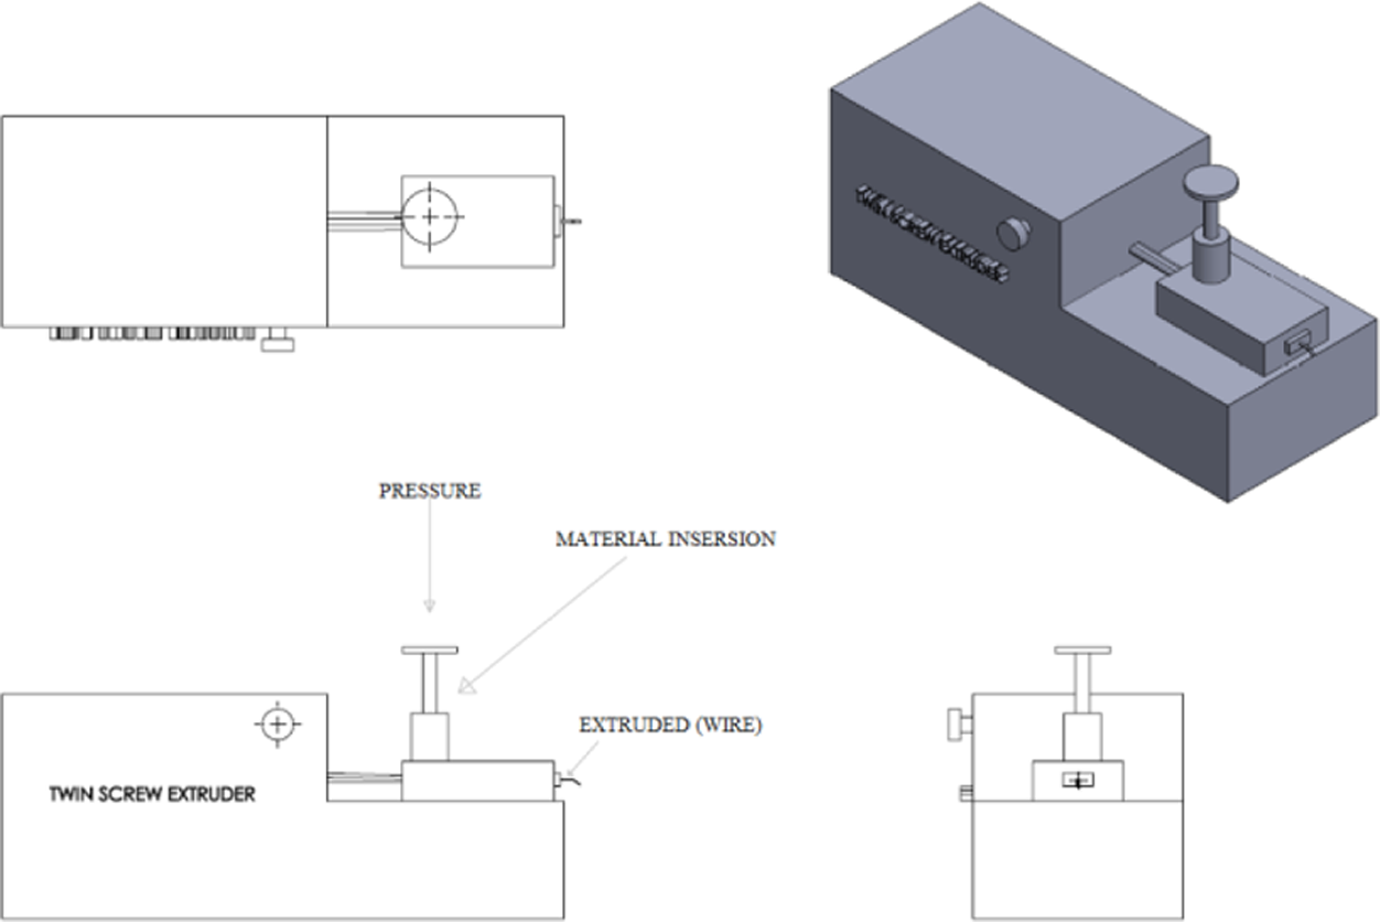
Schematic of twin screw extrusion process.
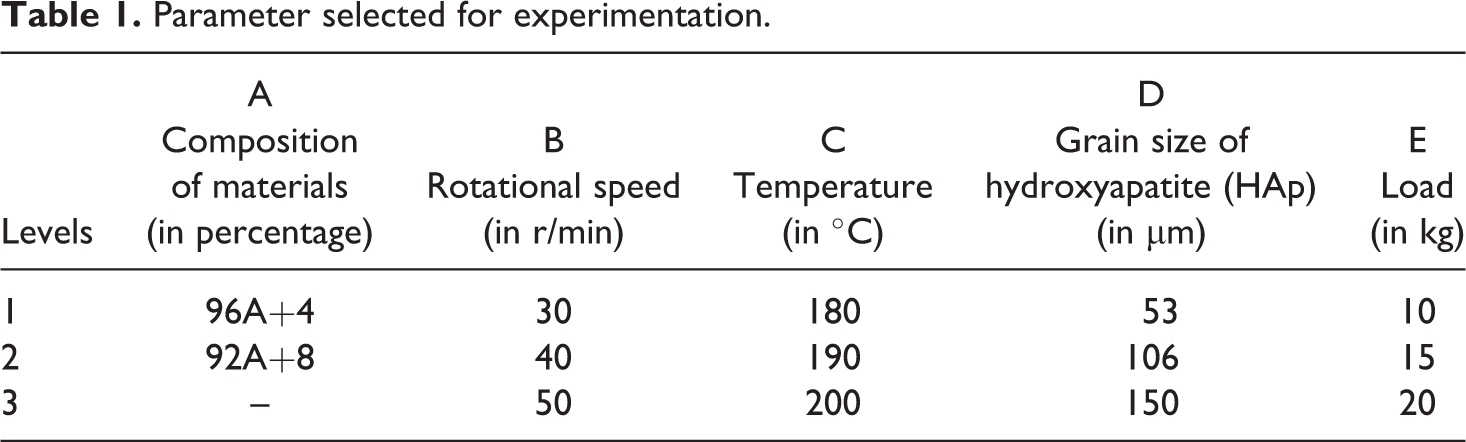
The feedstock filament wire prepared as per Taguchi L18 (2⁁1 3⁁4) orthogonal array. Table 1 shows list of input parameters and their levels (based on pilot experimentation) for the experimental study.
Parameter selected for experimentation.
Based on Table 1, Table 2 shows the control log of experimentation based on Taguchi L18 (2⁁1 3⁁4) orthogonal array which was 18 runs of experimentation.
Control log of experimentation.
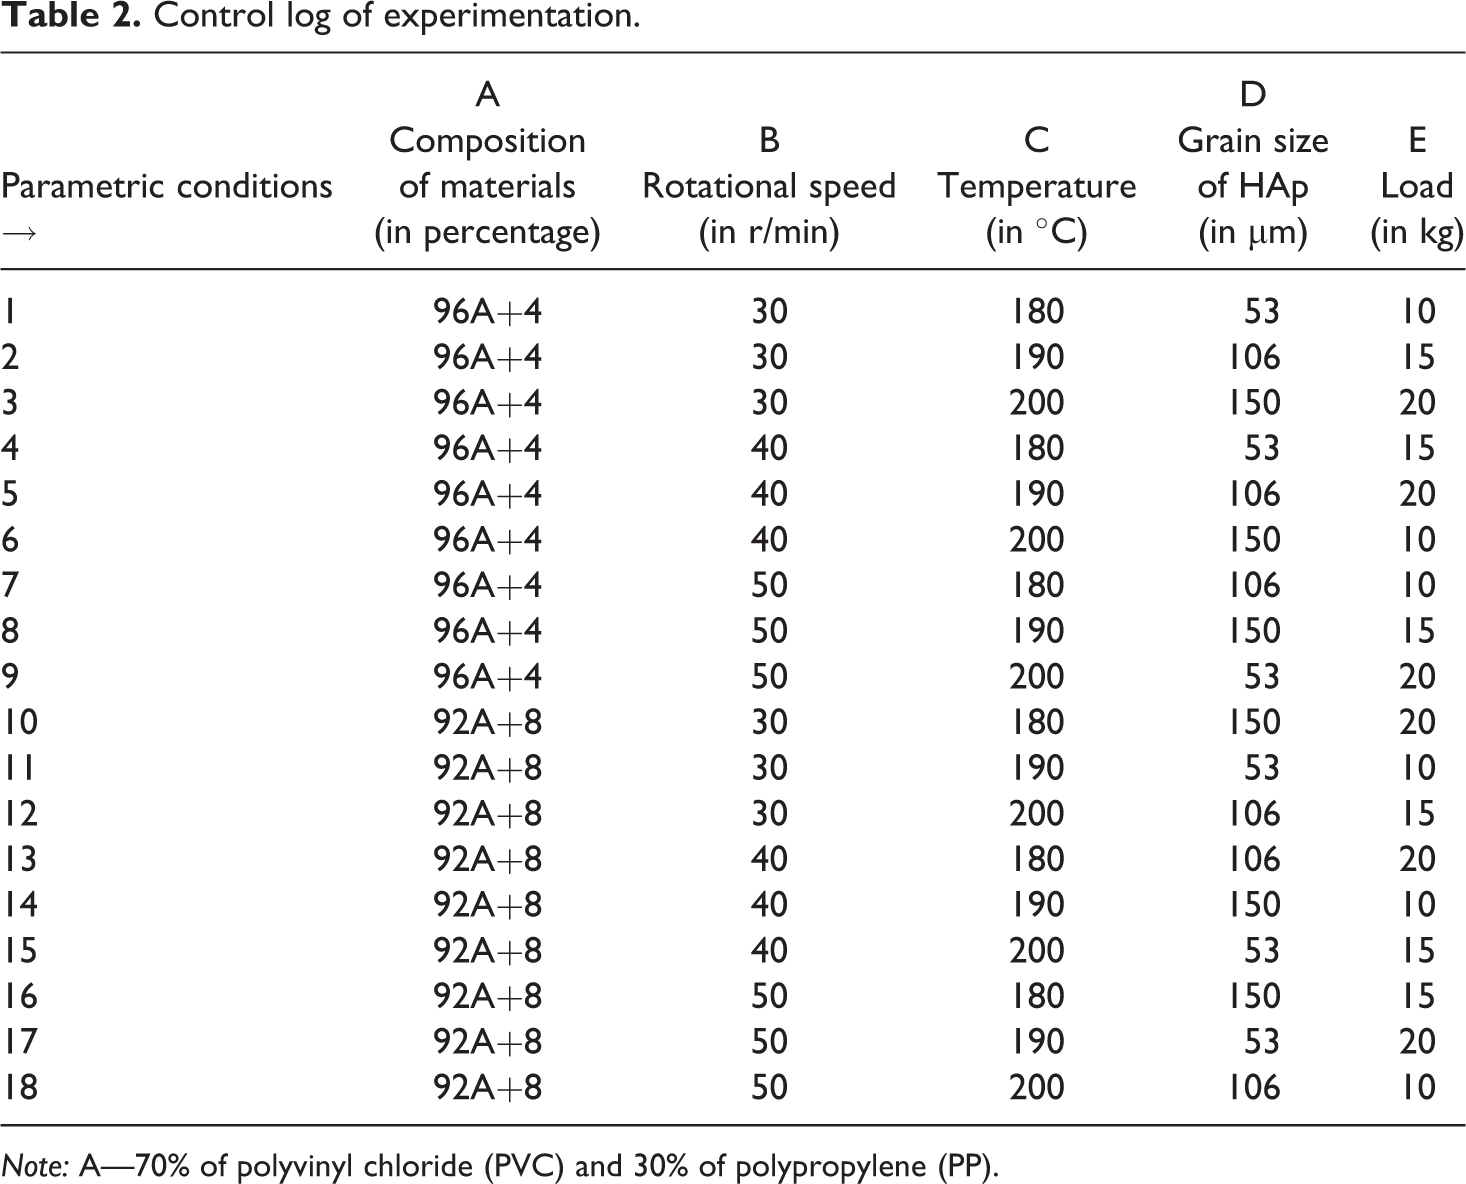
Note: A—70% of polyvinyl chloride (PVC) and 30% of polypropylene (PP).
For the investigation of mechanical properties, tensile test was performed for peak load and Young’s modulus on universal tensile machine (Shanta Engineering, Pune, India). After establishing mechanical properties, the finally prepared feedstock filament at best settings was investigated for thermal properties on differential scanning calorimetry (DSC) setup, and material properties (grain size) were observed on metallurgical microscope.
Result and discussion
Mechanical properties
After successful runs of pilot experimentation at predefined level of process variables, feedstock filament wire prepared as per Taguchi L18 (2⁁1 3⁁4) orthogonal array, the result for the different output parameters (namely, peak load and Young’s modulus) is shown in Table 3.
Outputs of peak load and Young’s modulus for different parametric condition.
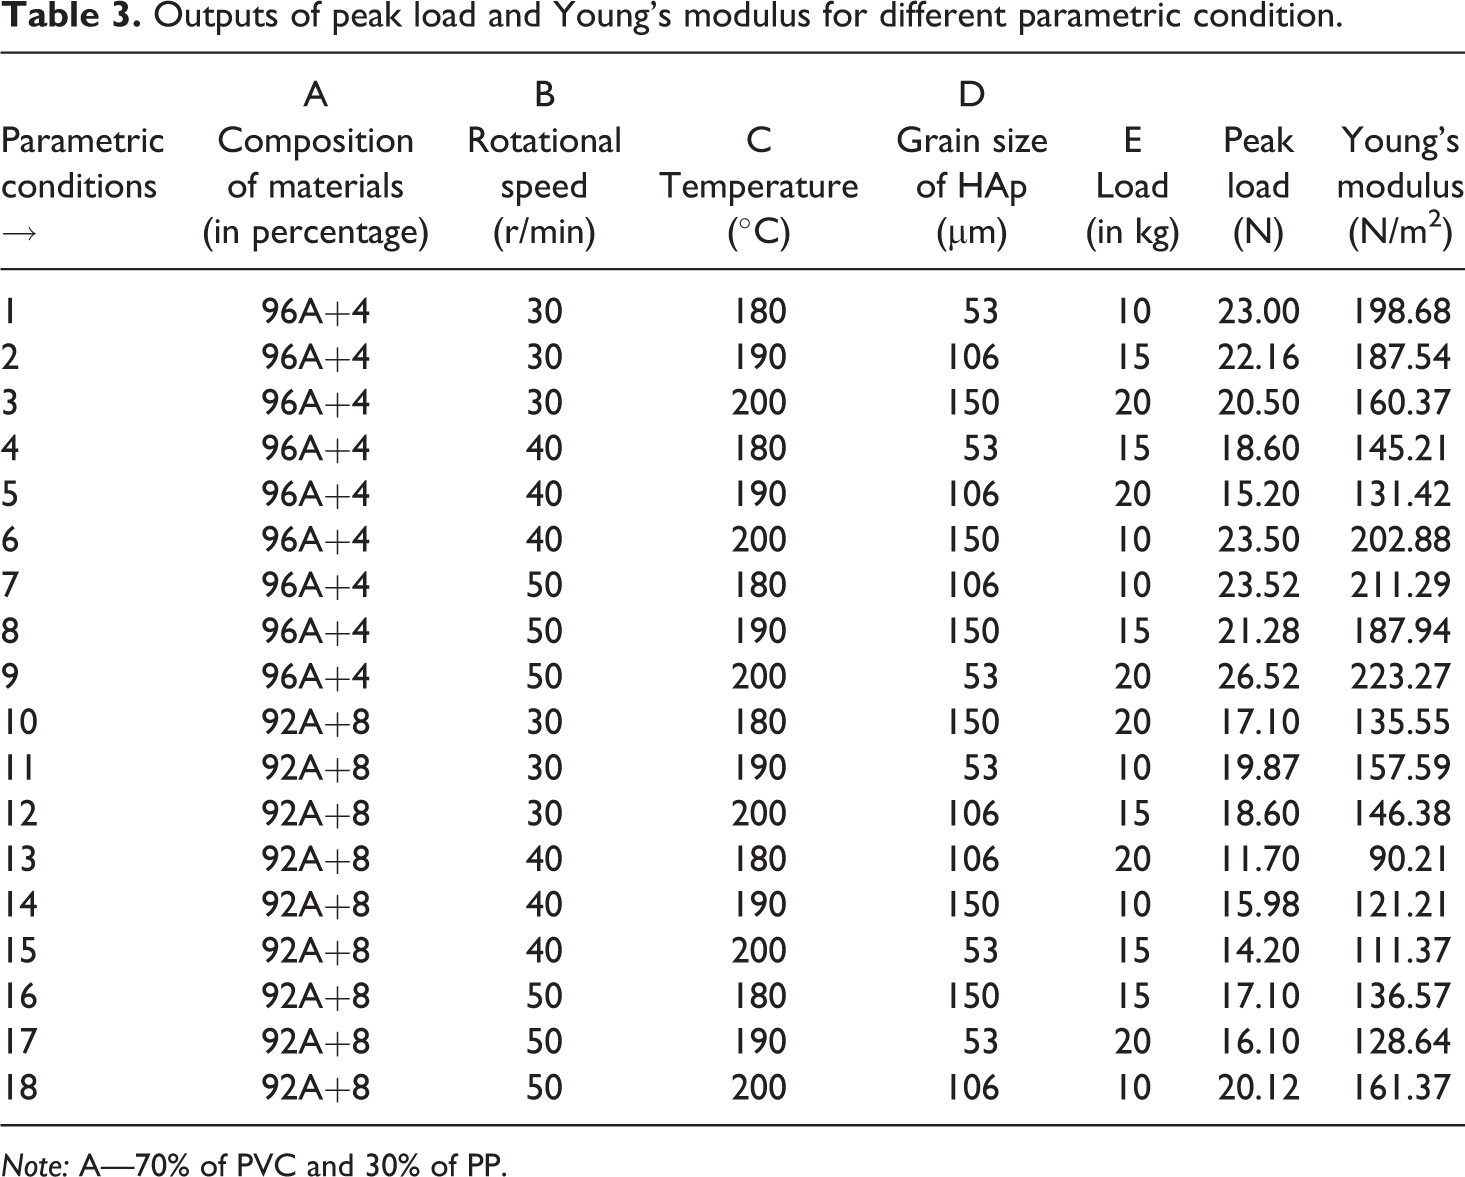
Note: A—70% of PVC and 30% of PP.
As observed from Table 3, experimentation run no.09 was the maximum value of peak load as well as Young’s modulus in which parametric conditions are combination of materials are 96A+4 at 50 r/min, and temperature was 200°C with the HAp grain size is 53 µm with load applied as 20 kg. Further on, experimentation run no.13 was the minimum value of peak load as well as Young’s modulus in which the parametric conditions are combination of materials are 92A+8 at 40 r/min, and temperature was 190°C with 150 µm of HAp grain size and load applied was 10 kg.
Peak load
Figure 2 shows main effects plot for signal-to-noise (SN) ratios for peak load as output parameter (for larger the better type case).
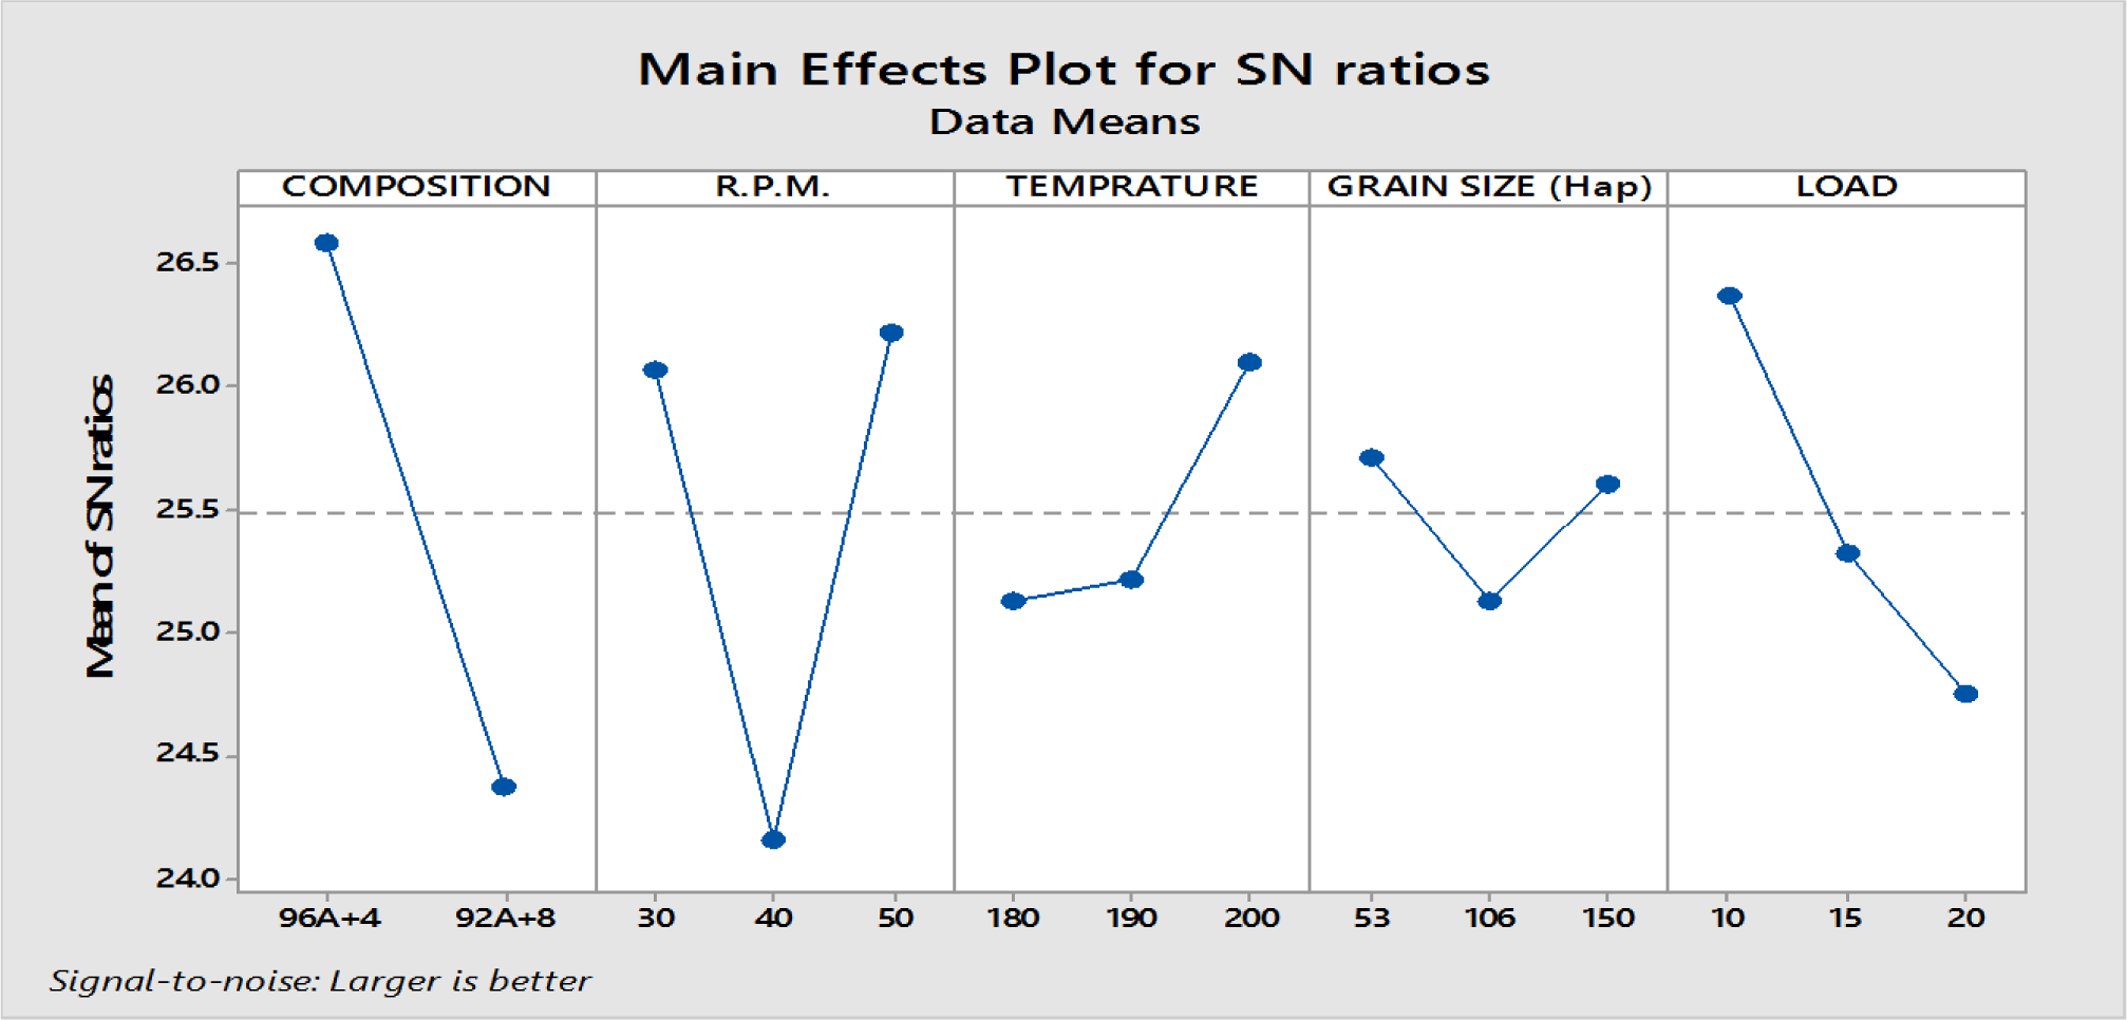
Main effect plots for signal-to-noise (SN) ratios for peak load.
As observed in Figure 2, SN ratio decreased with increases of HAp proportion. This may be because of the fact that high proportion of HAp particles leads to more brittleness as it is basically a ceramic material. The dense HAp particle decreases the mechanical strength. 27 Further, the SN ratio for rotational speed first decreases as revolution per minute was increased and further it increased with increase in revolution per minute. This may be because at intermediate value of revolution per minute, the dispersion of HAp ceramic particles may not be uniform which gets better at further higher values. In the case of temperature, SN ratio was increased, with rise in temperature. This may be because of the fact that at higher temperature better melt flow properties are attained. The SN ratio for grain size initially decreased then increased, which may be due to better dispersion of HAp particles with smaller size. The SN ratio for load is continuously decreased as load is increased, mainly because at high load melt flow properties increase tremendously. Table 4 shows analysis of variance for SN ratio for peak load.
Analysis of variance for signal-to-noise (SN) ratios for peak load.
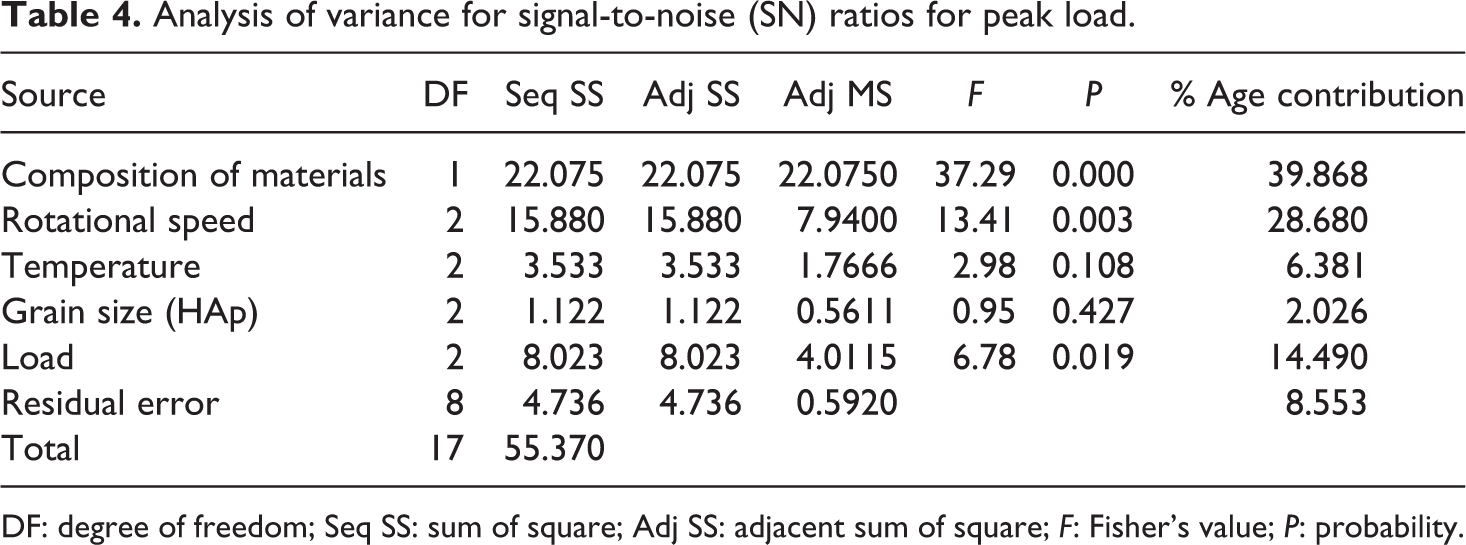
DF: degree of freedom; Seq SS: sum of square; Adj SS: adjacent sum of square; F: Fisher’s value; P: probability.
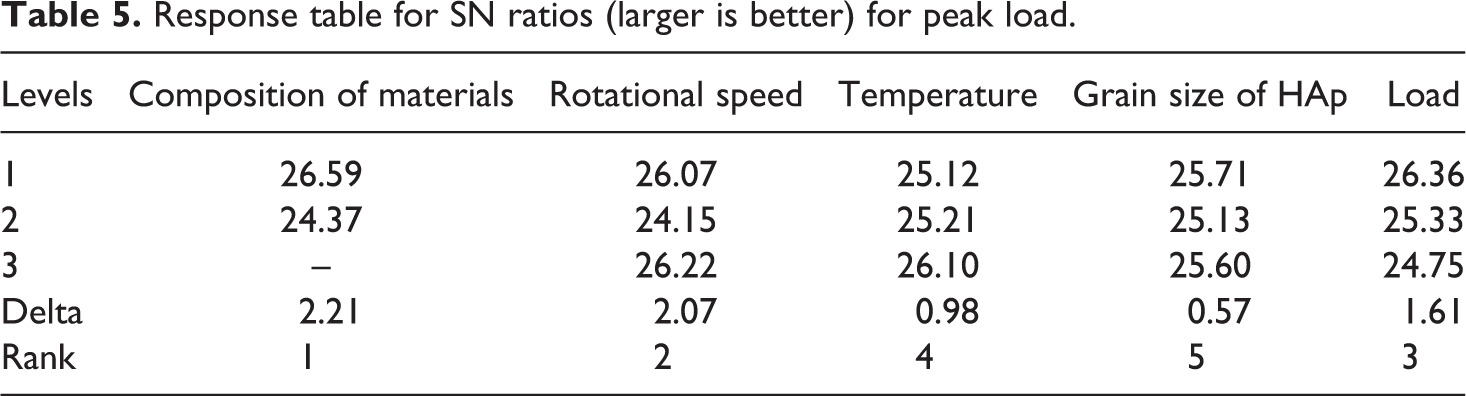
As shown in Table 4, percentage error was found to be 8.553%. It shows that model has higher degree of accuracy. These results are at 95% confidence level. Further, it was observed that composition of material, rotational speed, and load are only significant parameters, which contributes the 39.86%, 28.68%, and 14.49% respectively, and temperature and grain size (of HAp) was not significant and have less percentage contribution 6.38% and 2.02%, respectively. Based on Table 4, Table 5 shows response table for SN ratio for ranking of input parameters.
Response table for SN ratios (larger is better) for peak load.
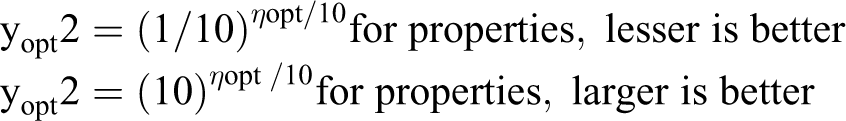
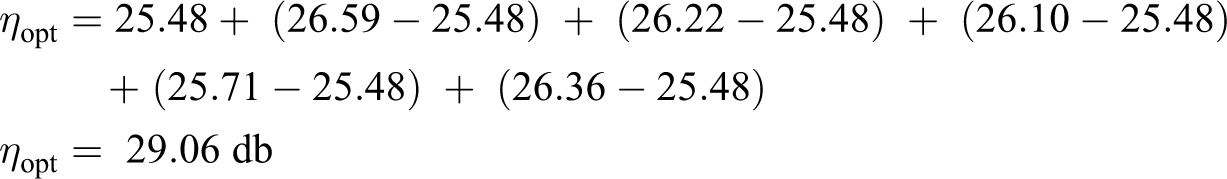
For optimization of peak load, results following the formula based on Taguchi L18 design were used:

where “m” is the overall mean of SN data, mA1 is the mean of SN data for composition of materials at level 1, mB3 is the mean of SN data for rotational speed at level 3, mC3 is the mean of SN data for temperature at level 3, mD1 is the mean of SN data for grain size of HAp at level 1, and mE1 is the mean of SN data for load at level 1.
Calculation,
Overall mean of SN ratio (m) was taken from Minitab software.

Now from response table of SN ratio (Table 5), mA1 = 26.59, mB3 = 26.22, mC3 = 26.10, mD1 = 25.71 and mE1 = 26.36.
From here,
Now, yopt 2 = (10)ηopt/10
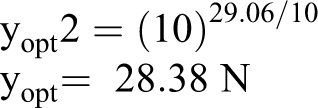
Finally, the calculated value for peak load is 28.38 N, which is close to the experimentally observed value, that is, 26.52 N (see Table 3, experiment no.9).
Young’s modulus
Figure 3 shows main effect plots for SN ratios for Young’s modulus. As observed in Figure 3, SN ratio decreased with increases of HAp proportion. This may be because of the fact that high proportion of HAp particles leads to decrease the elongation properties (namely, elongation at peak, elongation at break). The SN ratio for revolution per minute first decreases as revolution per minute increased further increased as the revolution per minute increased. At intermediate value of revolution per minute, the dispersion of HAp ceramic particles may not be uniform which gets better at further higher values. In the case of temperature, SN ratio was increased, with rise in temperature. This may be because of the fact that at higher temperature better melt flow properties and mixing properties are better attained up to certain temperature. The SN ratio for grain size initially decreased then increased, which may due to better dispersion of HAp particles with smaller size. The SN ratio for load is continuously decreased as load is increased; this may be because at low load, the mixing of polymers and filler was better, but at high load, the melt flow rate is high, this cause mixing of polymer with HAp properties was poor.
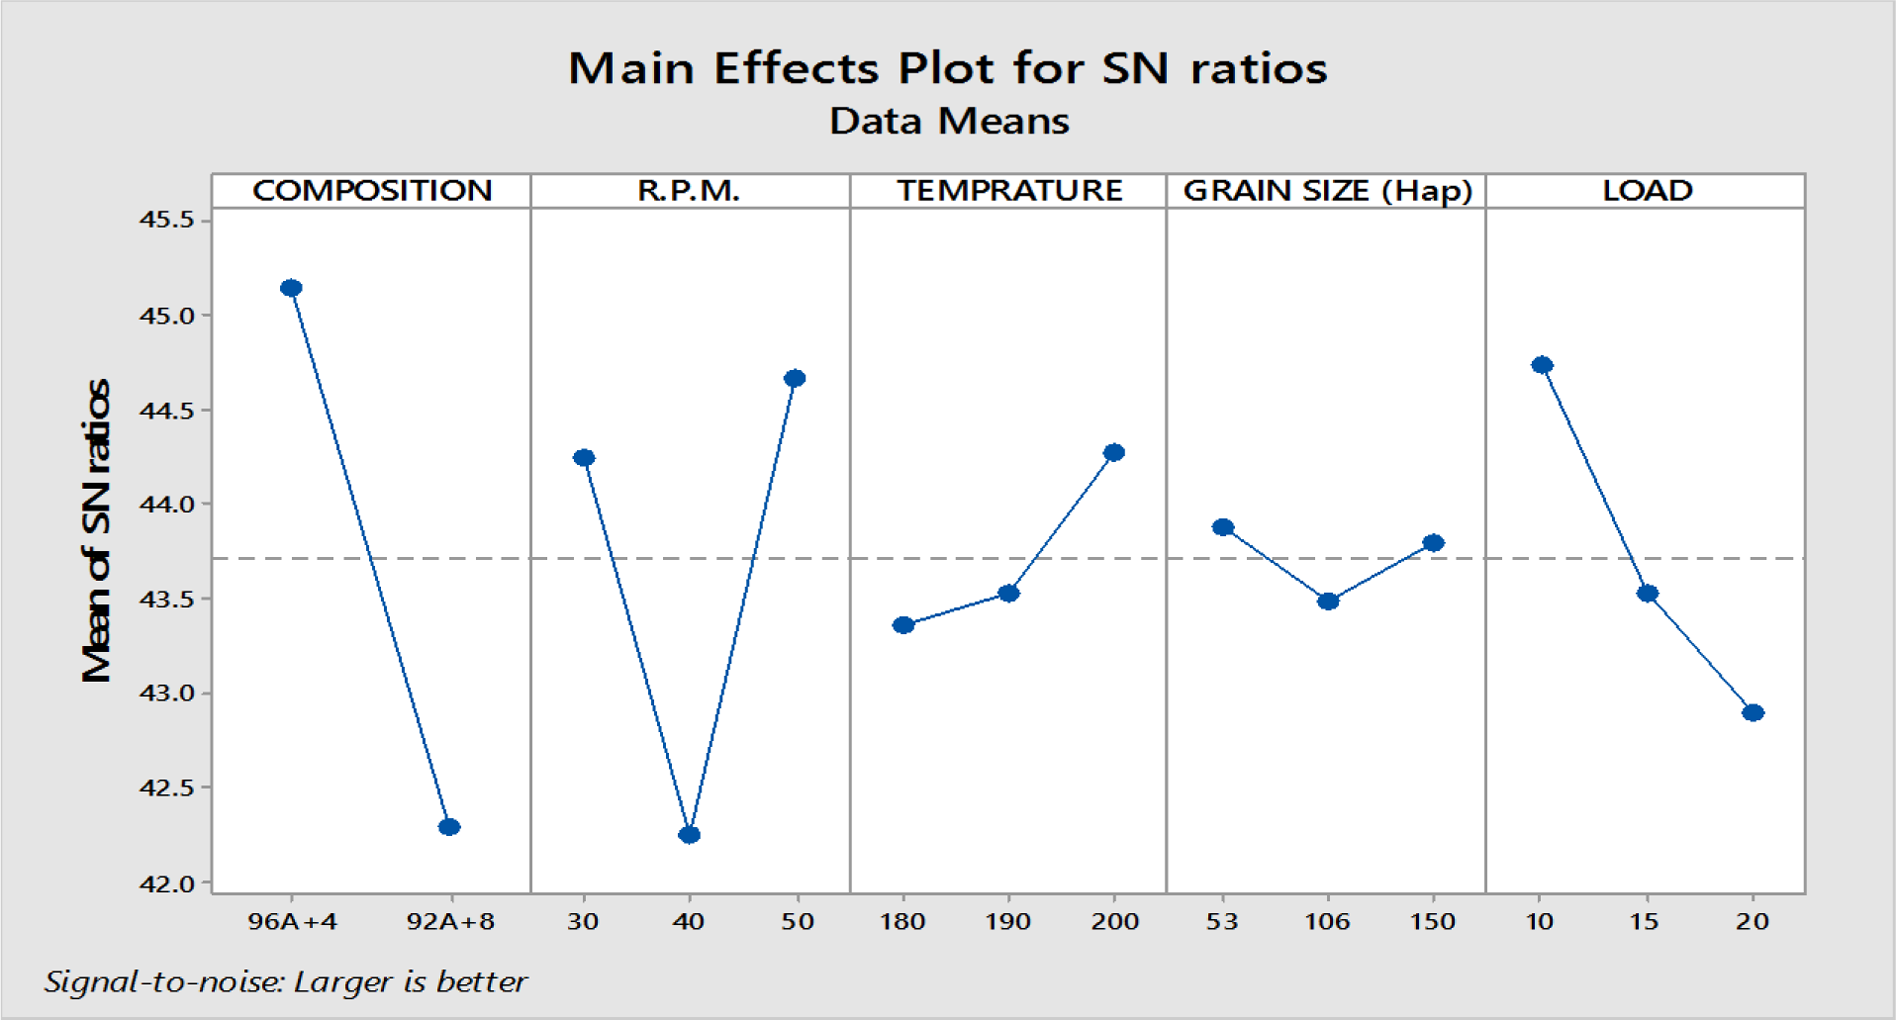
Main effect plots for SN ratios for Young’s modulus.
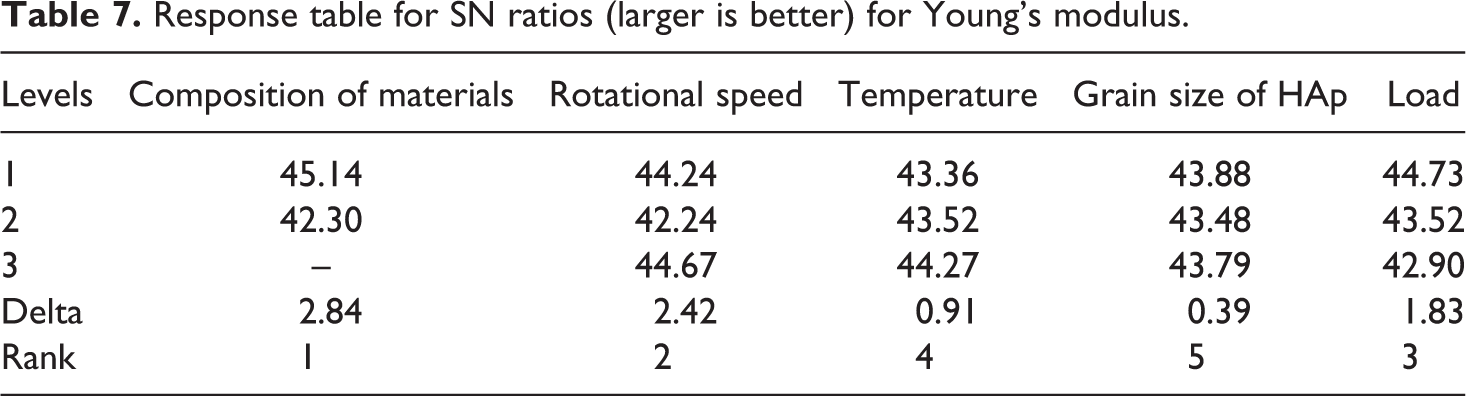
Tables 6 and 7, respectively, show the analysis of variance and ranking response table for larger the better type case. As shown in Table 6, percentage error was found to be 7.383%. It shows that model has higher degree of accuracy. Further, it has been observed that composition of materials, rotational speed, and load are only significant parameters, which contributes 47.969%, 26.474%, and 13.751%, respectively, and temperature and grain size (HAp) was not significant and have less percentage contribution 3.749% and 0.673%, respectively.
Analysis of variance for SN ratios for Young’s modulus.
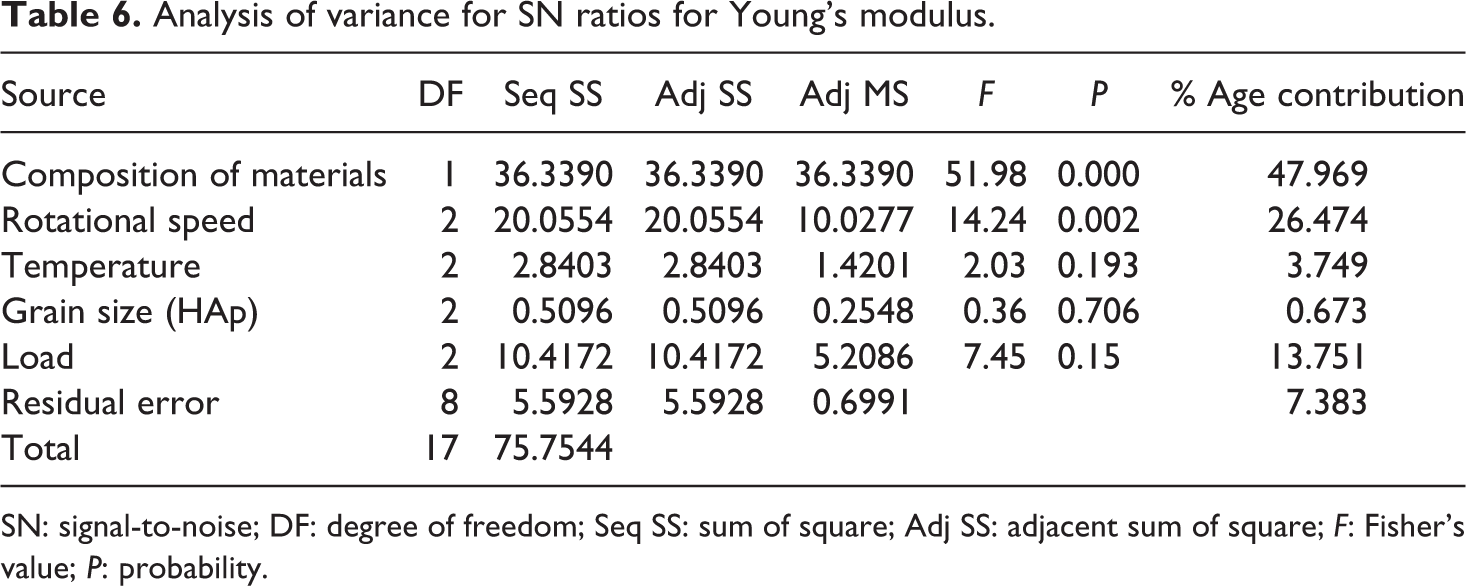
SN: signal-to-noise; DF: degree of freedom; Seq SS: sum of square; Adj SS: adjacent sum of square; F: Fisher’s value; P: probability.
Response table for SN ratios (larger is better) for Young’s modulus.
Finally, the calculated value (similar to section 3.1.1) for Young’s modulus is 230.906 N/m 2 , which is close to the experimentally observed value 223.27 N/m 2 (see Table 3, experiment no.9). The results are in line with the observations made by other investigators. 27 –31
Thermal properties
After optimization of mechanical properties (peak load and Young’s modulus) of feedstock filament wire, it was observed that better and poor mechanical properties are achieved for experiment run 9 and 13, respectively (see Table 3). The sample filament wire prepared for experiment run 9 and 13 was subjected to DSC analysis. For thermal analysis, METTLER TOLEDO, Model DSC3, Swiss make with STARe (SW 14.00) software was used in N2 gas environment. Figures 4 and 5 show the thermal analysis of feedstock filament run 9 (with better mechanical properties) and run 13 (with poor mechanical properties), respectively.
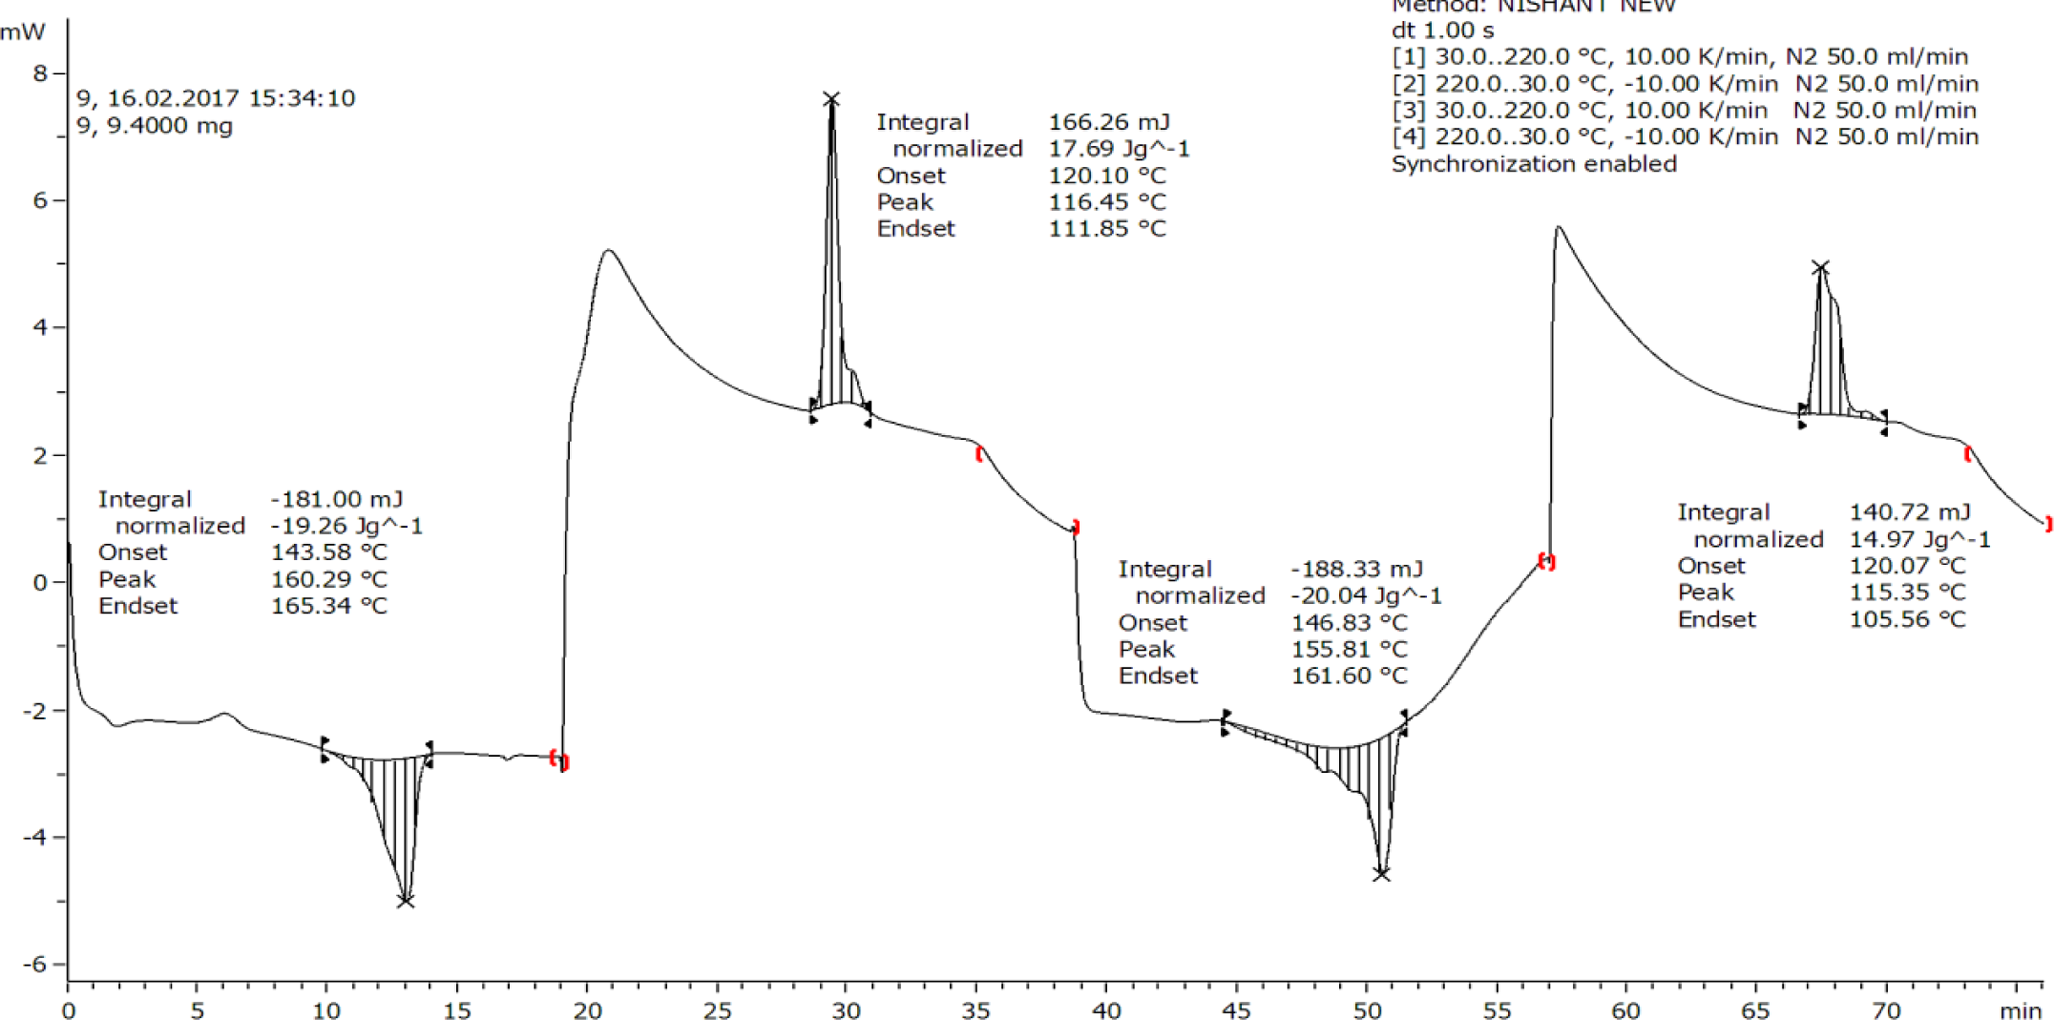
Thermal analysis of sample wire run 9.
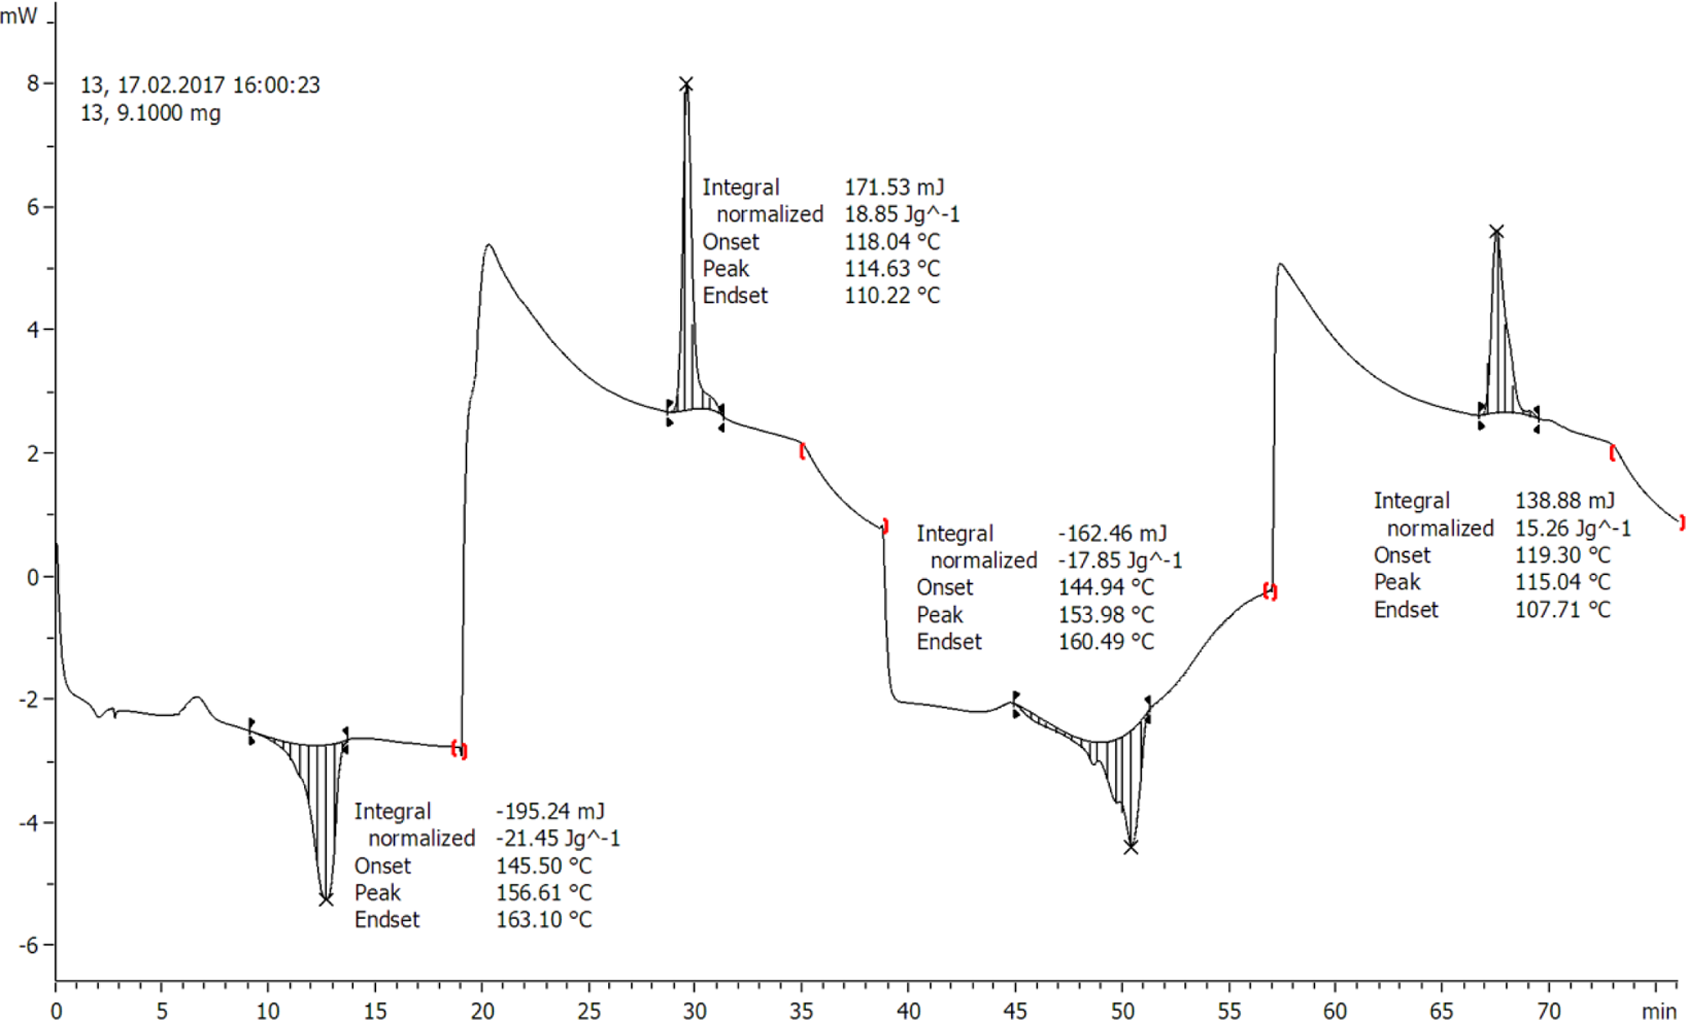
Thermal analysis of sample wire run 13.
As shown in Figure 4, for thermal analysis 2 heating–cooling cycles are involved. In first cycle, initially heat the sample with comparison to reference from 30°C to 220°C at the rate of 10 K/min, after that in the presence of N2 gas (flow rate is 50.0 ml/min), cooling process is done in which matter was cooled from 220°C to 30°C at the rate of 10 K/min. After that in the second cycle, the same process was repeated. The maximum temperature is taken 220°C because the material was burnt near 230°C and lower temperature is generally taken as near to room temperature.
Figure 5 shows thermal analysis of sample wire run 13. While comparing Figures 4 and 5, it has been observed that melting point temperature (Tm ) of run 9 was 160.29°C and for run 13 was 156.61°C and solidification temperature at 116.45°C in the first case and 114.63°C in the second case. Further, it should be noted that the heat capacity (which is the difference of heat input and released) for sample prepared at run 9 has dramatically increased after second repetition of heating–cooling cycle as compared to sample prepared at run 13, which justifies the use of parametric settings suggested for run 9 (as per Table 3).
Material properties
To further ascertain the behavior observed for mechanical properties, photomicrographs were captured using metallurgical microscope at 100× magnification at 1000 DPI (see Figure 6).
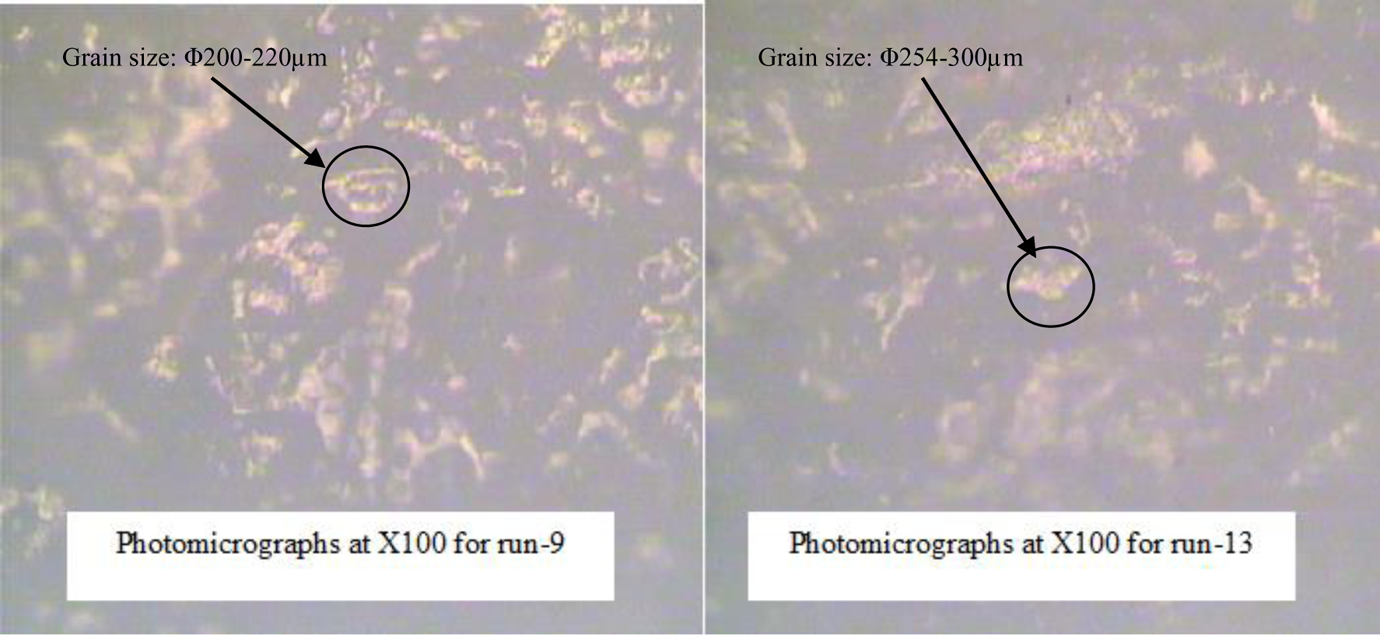
Photomicrographs for run 9 and run 13.
The magnified image was put on gray scale and analyzed on the basis of grain size. It was observed that average grain size number is 1.5 for run 09 and 0.75 for run 13 according to ASTM E1382 (using MIAS commercial software). A higher ASTM grain size number means the more number of grains per unit area. Here, for feedstock filament prepared in run 09 with average grain size number 1.5 has grain size diameter from Φ200 to 220 µm, and for feedstock filament prepared in run 13 with grain size number 0.75 has grain size diameter from Φ254 to 300 µm. Hence, grain size of best-feedstock filament (prepared in run 09) is relatively fine as compared to poor quality feedstock filament (prepared in run 13). The presence of coarse grain structure in feedstock filament prepared at run 13 resulted into poor tensile strength as compared to fine grain structure with best-feedstock filament (run 9).
Conclusions
This investigation highlights that best setting of input parameters of TSE for preparation of in-house feedstock filament based on mechanical and thermal analysis. The material composition as 96% polymer matrix (comprising of 70% of PVC and 30% of PP) and filler (HAp) as 4% with grain size 53 µm at 200°C and rotational speed 50 r/min with load applied of 20 kg were the best conditions observed. The results are also supported by microstructure analysis. The final filament wire prepared as per the suggested parametric settings can be easily run on commercial FDM setup without any change in hardware/software of the system and can be successfully used for preparation of biocompatible dentures in clinical dentistry with functionally graded tailor-made properties.
Footnotes
Acknowledgment
The authors were highly thankful to Manufacturing Research Lab (Production Engineering Department, GNDEC Ludhiana), DST (GoI) for financial support to carry out the research work.
Declaration of Conflicting Interests
The author(s) declared no potential conflicts of interest with respect to the research, authorship, and/or publication of this article.
Funding
The author(s) received no financial support for the research, authorship, and/or publication of this article.