
Abstract
Melt polymer nanocomposites were prepared using polyvinyl alcohol (PVA) with the different weight percentage of calcined clays (CCs) in a twin-screw extruder at 210°C and 70 r min−1 for 8 min. Bentonite was surface functionalized with benzidine using dilute hydrochloric acid at 60°C and calcined at 600°C for 6 h. The CCs were incorporated into the PVA matrix to study their morphology and rheological properties. The melt viscosities of the composites were measured by the cone-plate rheometer, the rheogram show non-Newtonian and thixotropic flow behavior. Scanning electron microscope confirmed the degree of exfoliated nanocomposites. The polymer and functionalized nanoclay interactions were reflected in the enhancement of thermal stability and mechanical properties. The melting endotherm temperature (T m) and glass transition temperature (T g) of the nanocomposites tend to increase with increase in weight percentage of the calcined nanoclays. Thermal properties show that addition of calcined nanoclays would improve the thermal decomposition temperatures from 295°C to 307°C when CC content was 2 wt% in covalent or ionic bonding system.
Introduction
The composite is a combination of two or more materials which has different structural, chemical, and physical properties. Composites are useful in various fields such as construction, consumer products, package application, photosensitive coating, adhesive for paper, wood, textile, and leather. 1 Polymer nanocomposites are composites, which are constituted by polymer matrix and filler in the range of nanoscale, less than 100 nm. The nanofillers such as nanoclays exhibit unique properties because of their small size, large surface area, and its interfacial interactions. 2 The polymer nanocomposites exhibit significant improvements in the material properties compared to the neat polymer or conventional micro and macro composites. 3,4 These improvements may include increased mechanical properties, heat resistance, and decreased gas permeability. 5 –7 Polyvinyl alcohol (PVA) is a water-soluble polymer which is a host for many filler materials in nanoscale. 8,9 PVA is a thermoplastic polymer used for living tissues because of non-toxicity nature. It is studied widely because of its full biodegradability and biocompatibility. 10,11 PVA is widely used in paper coating, textile sizing, and flexible water-soluble packaging films.
PVA has poor tensile strength, less resistant to solvents, reduced thermal stability, and antiaging behavior, all which restrict its application in package industries. The nanoclays addition in the PVA matrix leads to the enhancement of mechanical, thermal, and gas barrier properties. Many efforts have been made to improve the melting process of PVA. 12,13 Several works have been reported in the literature based on PVA clay nanocomposites in solution processes. 14 –17 PVA has poor thermal properties; it is difficult to form a film during melt extrusion processing, because its endothermic melting temperature (T m) is very close to its decomposition temperature. Melt intercalation method is the most flexible and eco-friendly, 18 because no organic solvent is involved. The melt mixing method can be used for the commercial productions of polymers. In this method, the polymer reaches its glass transition temperature (T g) or T m, so the chains of polymer spread out between the silicate layers within the galleries. 19 The modification of PVA and clays was carried out using surface modification. The clay layer with the hydrophobic surface is essential to make the organoclay with lowered surface energy are compatible with polymers due to the expansion of interlayer basal space in the clay layers. 20 –22
A twin-screw extruder is a melt blending processing equipment, which is widely used in plastic and rubber industries because of its high capacity and good mixing using shear forces in an extruder. 23 For better mixing, screw configuration may be fixed as either corotation or counter rotation. The extruder may be used for compounding of various polymers, fibers, nanoscale fillers, and polymer blending. Owing to its lower consumption of energy used for processing and the demand for higher additional-value production, the relevance of a twin-screw extruder has been rapidly increasing. The present work was to investigate the morphology and rheological behavior of nanoclay composites and influence of the calcined clays (CCs) in the PVA matrix. The CC was added in different wt% to PVA and melt mixed in a twin-screw extruder, and their properties were examined. We report here the homogeneous dispersion of the modified nanoclays in the PVA matrix. The stress–strain properties, thermal, and rheological properties were analyzed. The rheogram shows a non-Newtonian flow and nonlinear elastic behavior in the low-stress region and plastic deformation at higher stress.
Experimental
Materials
Bentonite (BT) nanoclay and PVA were purchased from Aldrich (New York, USA) and used as received. PVA with the molecular weight (M w) 13,000–23,000, 87–89% hydrolyzed. Benzidine was obtained from Fluka (New Jersey, USA), and hydrochloric acid (HCl) was purchased from S.D. Fine Chemicals Pvt. Ltd., Chennai, India.
Functionalization and calcination of BT
Benzidine (0.006 moles) and BT clay (5 g) were gradually added to 500 mL of dilute HCl with continuous stirring for better clay dispersion. It was heated up to 60°C and continuously stirred for 8 h. The modified clay (MBT) was washed with double distilled water several times to remove residual ions and dried in a hot air oven. The dried organo clay was ground to powder, and the powdered clay was used for Fourier transform infrared (FTIR), differential scanning calorimetry (DSC), and thermo gravimetric analysis (TGA) characterization. The modified clays were calcined at 600°C for 6 h in a box furnace (VBCC/Fur/1400°C-3/2010-11). The CC thus obtained was used for the preparation of polymer clay nanocomposites.
Preparation of polymer nanoclay composites
Polymer nanoclay composites (PNCs) were prepared by melt blending of PVA with CC in different weight percentages. PVA was melt-mixed in a corotating twin-screw extruder (Haake mini lab, Electron Corporation, Austria, Germany) with a screw speed of 70 r min−1 at 210°C for 8 min, see Figure 1. The composition and codes were given in Table 1. All the processing parameters (time, temperature, and revolutions per minute) were fixed after different trial experiments.
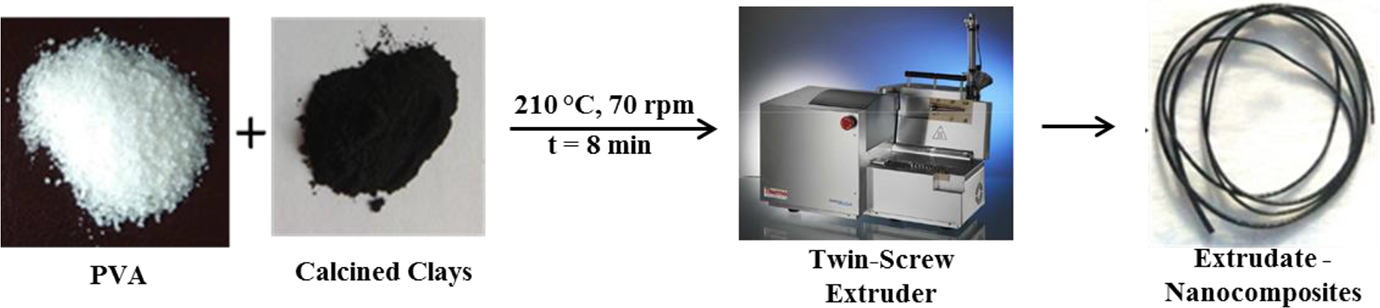
Extrusion of PVA-based CC composites.
Code and compositions of PVA/CCs.
PVA: polyvinyl alcohol; CC: calcined clay.
Characterization of nanocomposites
Attenuated Total Reflection (ATR)-FTIR spectra of modified clay, CC, and nanocomposites were recorded using ABB MB3000 FTIR spectrometer (Zurich, Switzerland) in the spectral range from 600 to 4000 cm−1. TGA was carried out using TG Analyzer–Model Q50, TA Instruments (Banglore, India), with a heating rate of 15°C min−1 from 30°C to 600°C under nitrogen (N2) atmosphere. DSC analysis was done using DSC–Model Q2000, TA Instruments at a heating rate of 10°C min−1 with N2 flow of 50 mL min−1 from 30°C to 300°C. The surface morphology of the prepared nanoclay composites was examined by SEM HITACHI-S3400 N (Sydney, Australia). Tensile property was studied using a Universal Testing Machine (UTM, Instron 3369, Norwood, Massachusetts) at a crosshead speed of 50 mm min−1, as per the ASTM D: 638 test procedure method. X-ray diffraction (XRD) measurements were carried out on a Rigaku, Americas Corporation (USA) Miniflex II Desktop X-ray diffractometer (Texas, USA) using copper K α radiation at a scanning rate of 4°C min−1. The rheological studies were carried out using Anton Paar (Ostfildern, Germany) EC Twist 302 rheometer having cone-plate geometry of 25 mm diameter at a temperature of 170°C. The rheometer instrument measures shear rate up to 100 s−1.
Results and discussion
FTIR spectroscopy
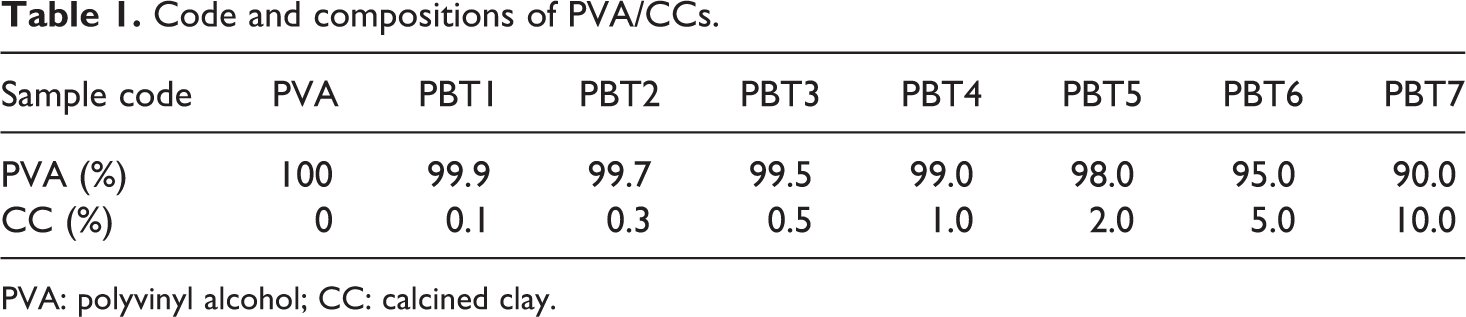
The FTIR spectrum of BT clay shows an absorption peak at 3623 cm−1 due to O–H stretching and a broad peak at 3424 cm−1 and a small peak with less intensity at 3545 cm−1 for intra- and interlayer hydrogen bonding O–H. The peak at 1050 cm−1 was due to Si–O stretching and the peaks at 912 cm−1 and at 879 cm−1were due to Al–O stretching. In PVA/nanoclay composites, the interaction between O–H and Si–O stretching results in shifting of peak from 1050 cm−1 to 1026 cm−1. Amine-modified clay, as shown in Figure 2(a), shows peak values at 3376 cm−1 corresponds to N–H stretching, the peaks at 1628 cm−1 and 1502 cm−1for N–H bending indicates that amine functional group was incorporated on the clay surface. A broad peak at 1026 cm−1 is due to Si–O stretching, 812 cm−1 for Al–O stretching, and Si–O bending at 520 cm−1. The protons in PVA are hydrogen bonded to the oxygen of Si−O, and Al−O bond leads to shifting of Si−O and Al−O stretching peaks in PNC. 24 PNC shows spectral peaks at 3344 cm−1 for NH group, 2923 cm−1 and 2853 cm−1 for alkyl CH stretching and 1092 cm−1 for CO stretching. The residual acetate groups in the PVA exhibit a peak at 1738 cm−1 (acetate C=O stretching), 1377 cm−1 for CH bending, and 1249 cm−1 due to acetate C–O bending. Si–O stretching of composites shows an intense peak at 1047 cm−1and at 625 cm−1 for Si–O bending. A representative FTIR of Polyvinyl alcocol/Bentonite (PBT3) is given in Figure 2(b). The residual carbonyl is shifted to lower frequencies at 1738 cm−1. 25
FTIR spectra of (a) amine MBT and (b) PBT3.
Thermo gravimetric analysis
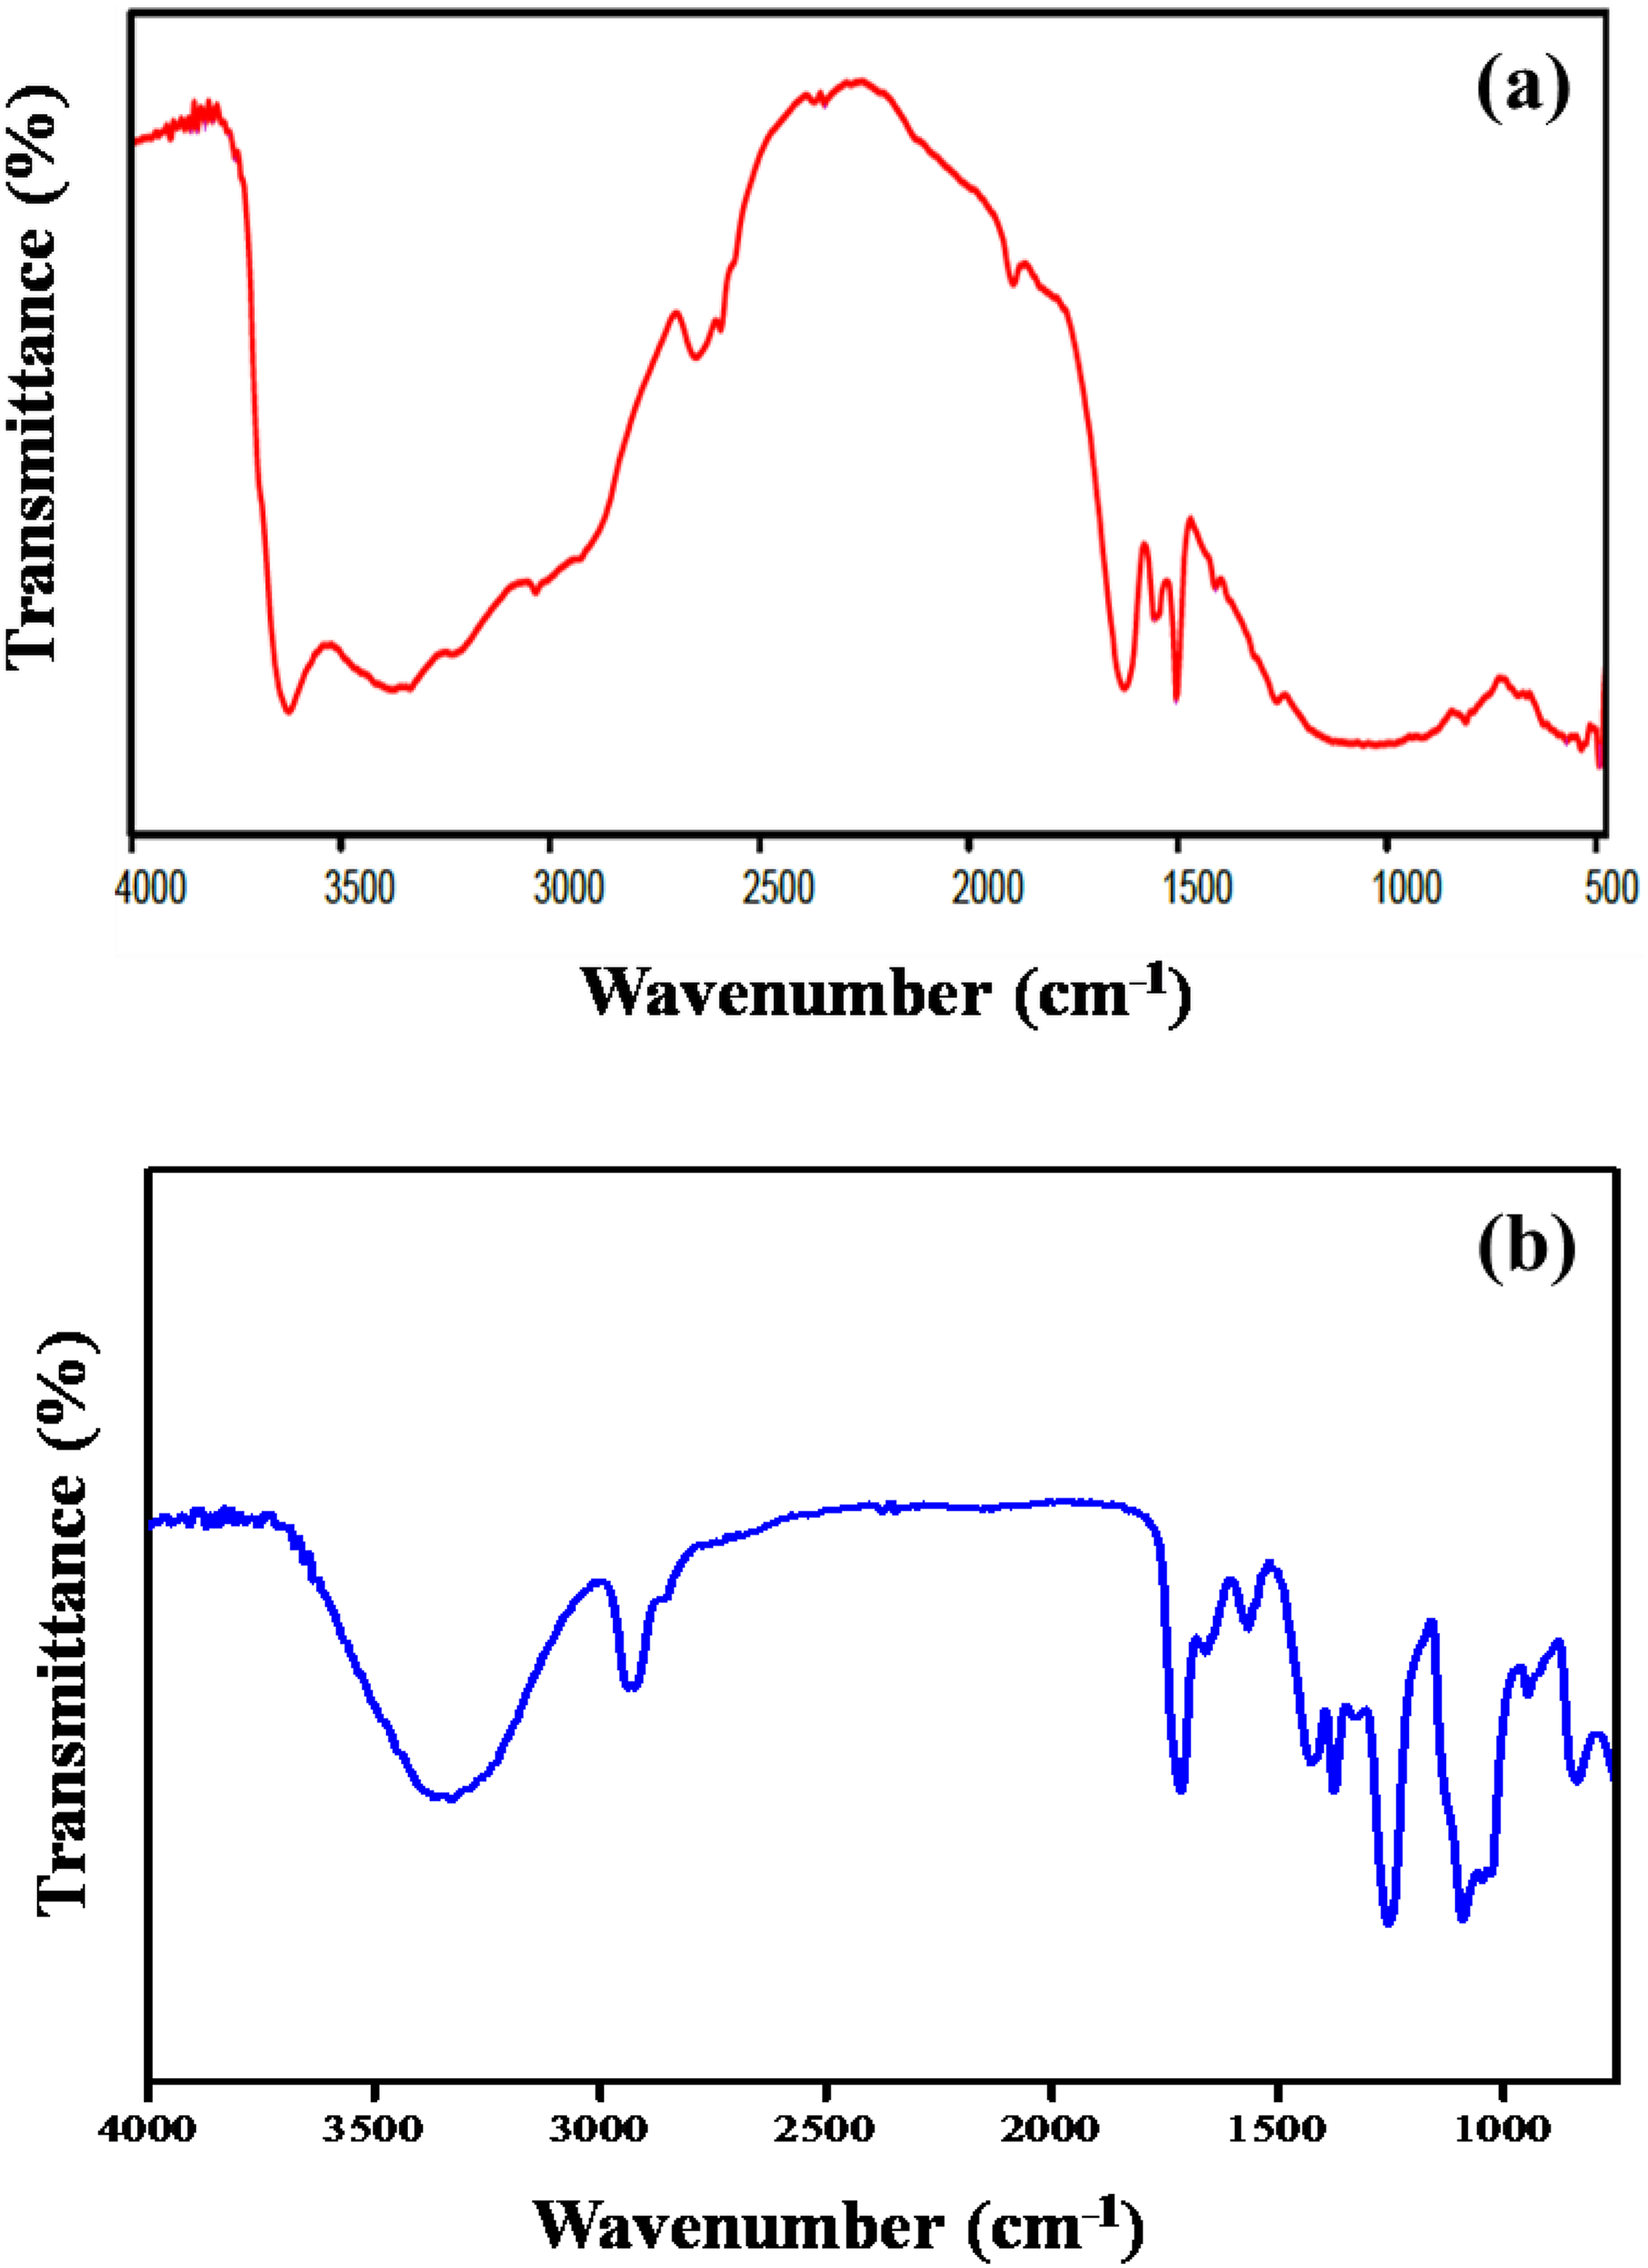
TGA curves of the clays were shown in Figure 3. It was found that the CC shows much high thermal stability compared to modified bentonite (MBT) and BT. The TGA thermogram of BT exhibits 10% weight loss at 236°C, whereas the MBT shows same weight loss at 510°C and CC has high thermal stability at 520°C with 5% weight loss. These weight losses are due to the dehydroxylation occurred in smectic layers of the clays. The effect of calcination increases the decomposition temperature of the CC. The PNC shows high thermal decomposition temperature than the pure PVA. The degradation temperatures of different stages T d1 and T d2 were given in Table 2. The TGA results show an increase in the thermal stability of the nanocomposites with the increase in weight percentage of CC. 16,26 –28 The TGA thermograms (Figure 4) show double decomposition profile, the first stage of decomposition occurs at 300°C due to the breaking of the side chain of the nanocomposites. The second stage decomposition at 440°C was correlated to the cleavage of the C–C backbone of the PVA. The residual weight was more for the nanocomposites compared to neat PVA. The nanocomposite PBT2 that contains 0.3 wt% of the CC and 99.7% of PVA shows the highest residual weight percentage. The incorporated CC chemically interacts with polymer and acts as the thermal barrier, due to which 20% of the residual weight was observed in TGA thermogram. 16 The enhanced thermal stability was resulted from the reduced chain mobility of the PVA chain in the nanocomposites, leading to the slowness of the decomposition process.
TGA of BT, MBT, and CC.
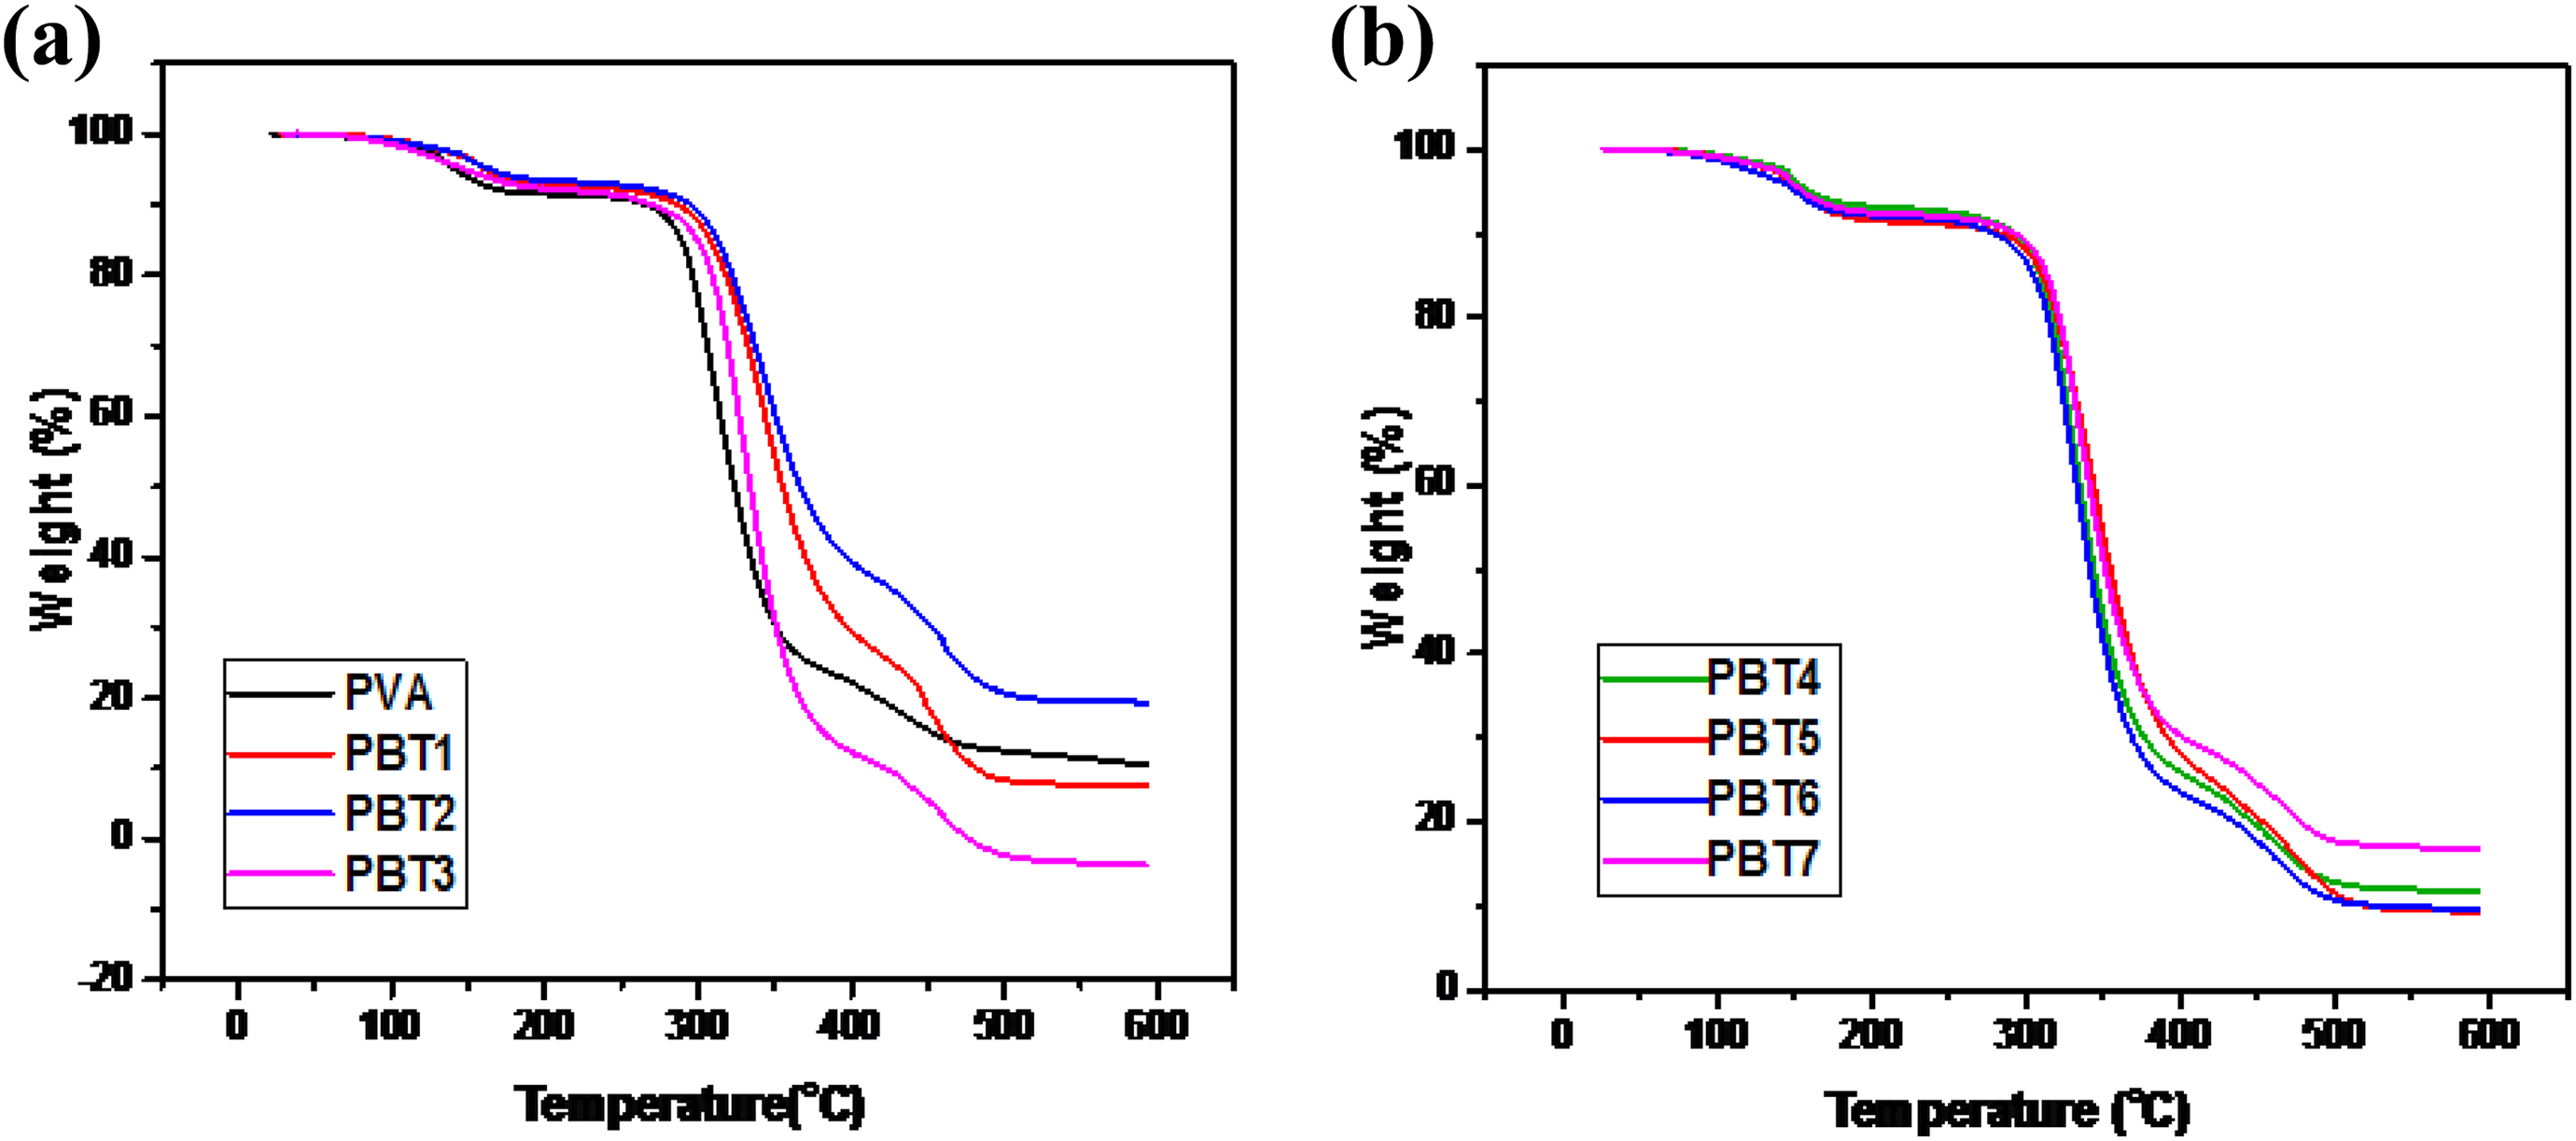
TGA of (a) PVA, PBT1, PBT2, PBT3 and (b) PBT4, PBT5, PBT6, PBT7 nanocomposites.
Thermal data for PVA and nanocomposites.
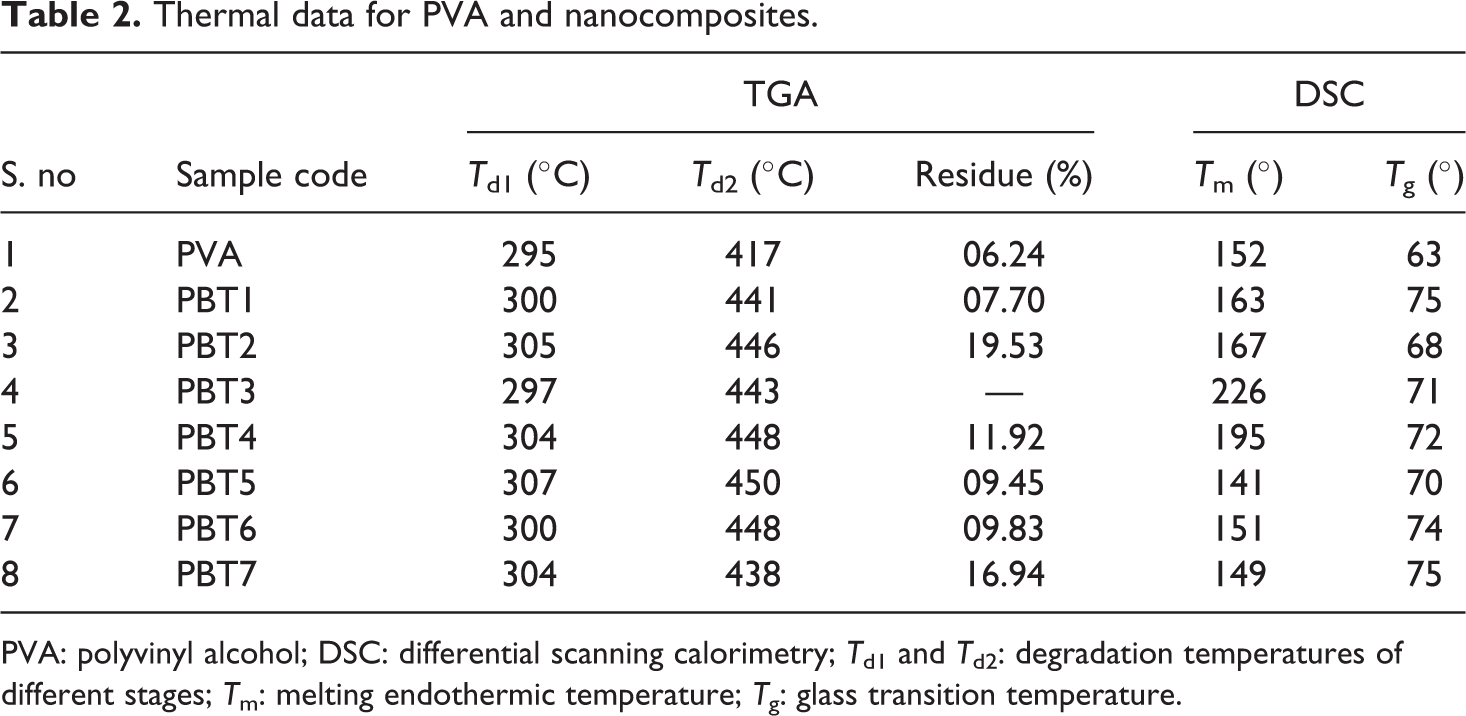
PVA: polyvinyl alcohol; DSC: differential scanning calorimetry; T d1 and T d2: degradation temperatures of different stages; T m: melting endothermic temperature; T g: glass transition temperature.
Differential scanning calorimetry
DSC thermograms of clays were given in Figure 5. The BT and MBT show melting endothermic peak (T m) at 140°C and 112°C, respectively. There is a shift in the melting transition after the incorporation of amine in the BT clay. The CCs exhibit melting endotherm at 128°C. The changes in the melting behavior of CC up to 12°C are due to the effect of calcinations that may remove the water and impurities present in the clays. The DSC thermogram data of the nanocomposites are presented in Table 2. PVA extruded shows an endothermic peak at 152°C corresponding to its T m and T g at 63°C. The T g value is comparable with the value obtained by Yu et al. 29 The T g value of the nanocomposites was increased, indicating that the polymer chain mobility is restricted after the addition of the clay. 30,31 The melting transition temperature (T m) of nanocomposites shifts toward higher values up to 0.5 wt% (PBT3) of nanoclay addition. This may be due to the better interaction between PVA matrix and modified calcined nanoclays. On further addition of nanoclays, the T m value is decreased because of the agglomeration of the nanoclays that leads to phase separation.
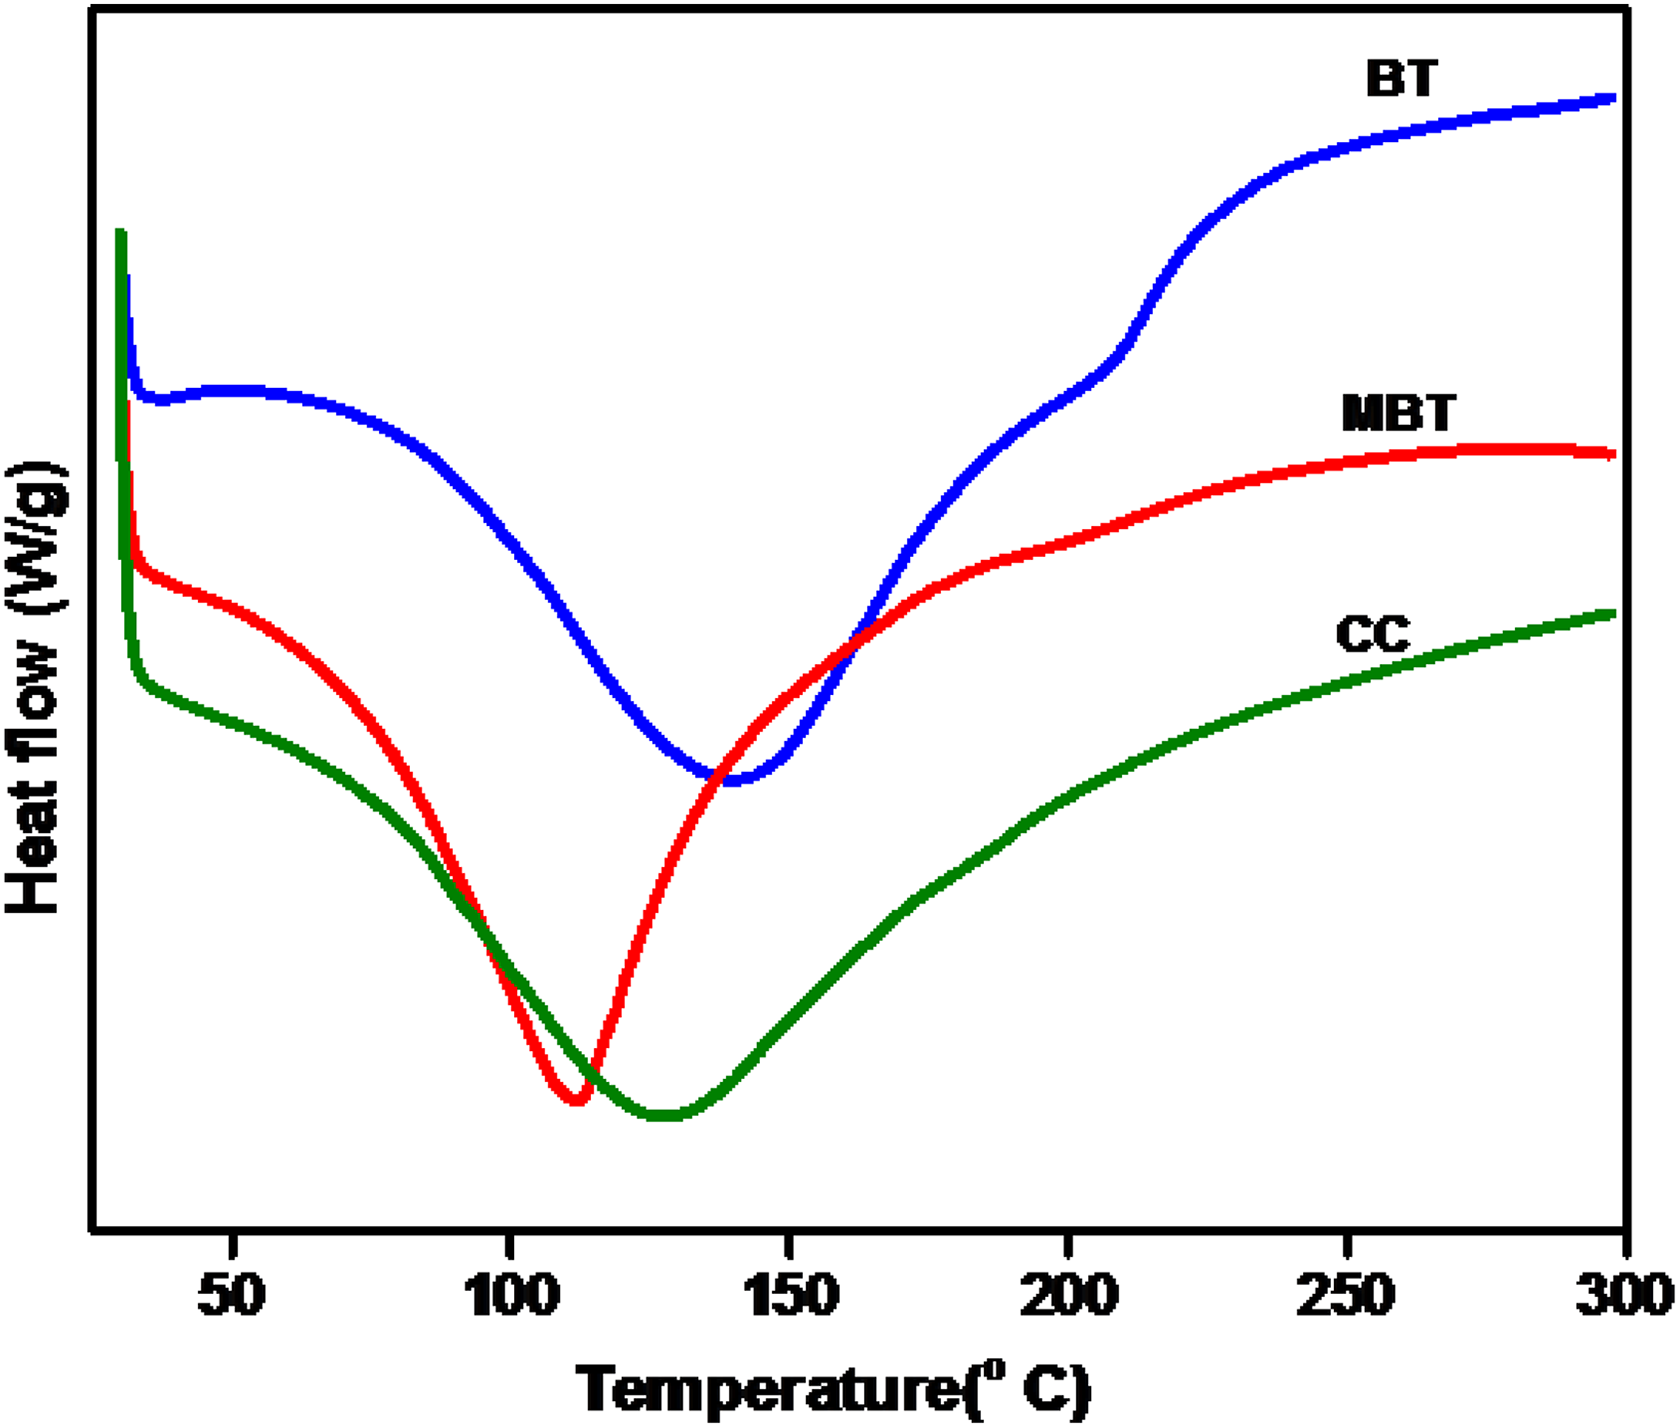
DSC of BT, MBT, and CC.
Scanning electron microscope
SEM images of PBT3 nanocomposites at various magnifications were shown in Figure 6(a) to (d). The PBT3 shows the uniform dispersion of CC in the PVA matrix, with higher magnification exhibit the voids on the surface given in the Figure 6(a). The white spots in the nanocomposites may be due to the elements Si, Mg, and Al of the inorganic filler nanoclay dispersed in the PVA matrix. With higher magnification exhibit the voids, flakes, and some deformed portions on the surface in Figure 6(b) of the nanocomposites. The incorporation of clay into the polymer matrix may introduce some amorphous nature in the nanocomposite, 29 as shown in Figure 6(c). This will be evidenced by the change in the melting behavior of the nanocomposites proved by DSC results (PBT3). In Figure 6(d) of the nanocomposites, there was aggregate texture seen due to the effect of agglomeration of clay particles. 32
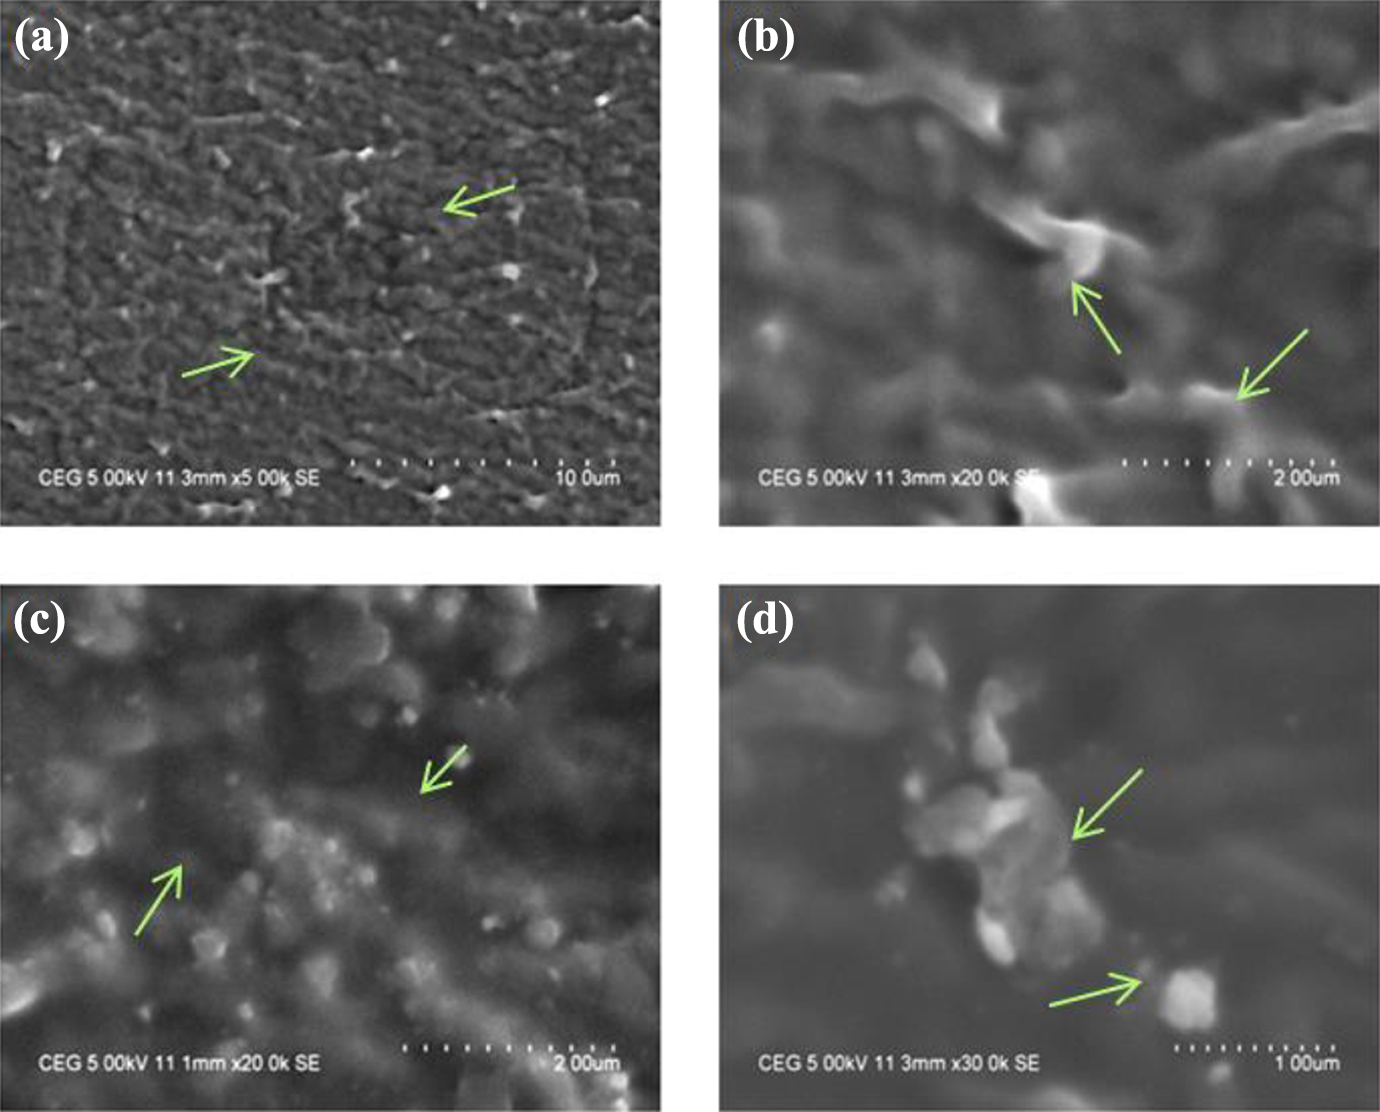
(a) to (b) SEM images of PBT3 nanocomposite.
Tensile strength
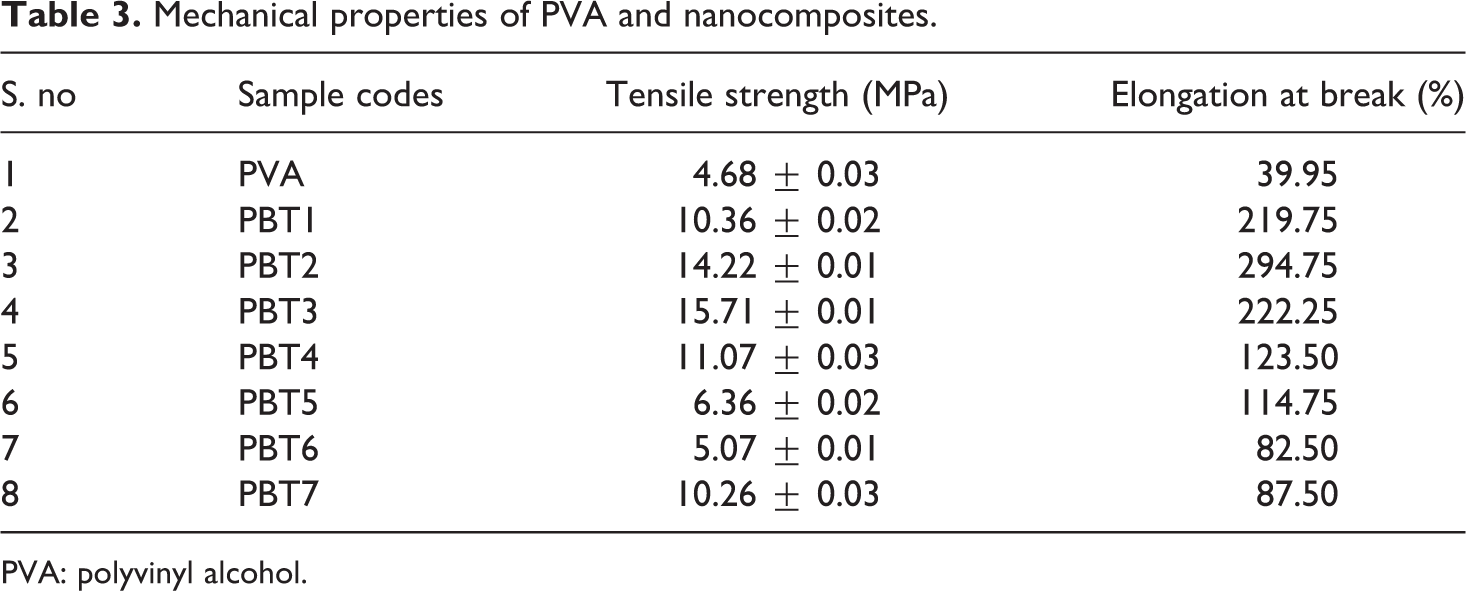
The tensile property of the nanoclay composites was analyzed and was given in Table 3. The tensile strength and percentage of elongation at break of the nanocomposites have shown drastic improvement compared to the neat PVA. 33 The percentage of elongation at break decreases with increase in different weight percentage of nanoclay loading for PBT3. This shows that the addition of clay increases the strength properties of the resulting nanocomposites. When the nanoclay content reached 0.5 wt% in PBT3, the tensile strength of nanocomposites increased from 4.68 to 15.71 MPa (an increase of 235%) and the percentage of elongation of the composites increased from 40% to 222%. The variation in the strength properties from PBT4 may be due to agglomeration of the nanoclay in the PVA matrix, which is a critical parameter, that affects the tensile strength of the composites. 8 The enhancement in the tensile property of the composites was better in the lower percentage of clay loading with less than 1 wt%. 16,29 This may be due to better dispersion and good interaction of the clays in the polymer matrix. PVA-based nanoclay composites exhibit tough and transparent materials with enhanced strength properties and long-term thermal resistance. Upon calcination, the basic structure of the clays will be destroyed and the layered structure is retained.
Mechanical properties of PVA and nanocomposites.
PVA: polyvinyl alcohol.
XRD studies
XRD patterns of neat PVA, PBT, and CC were given in Figure 6. Neat PVA showed an XRD peak at 2θ = 20.1° with d-spacing of 4.43 Å. The XRD of CC showed a peak at 2θ = 8.54° with d-spacing 10.35 Å. For the nanocomposites, the XRD peaks at 2θ values greater than 20.1° revealed that the d-spacing decreases after the incorporation of the clay. The nanocomposites show 2θ values of XRD at 20–25 the peak gets broadening in comparison with the nanoclays was observed in Figure 4. This shows the homogeneous dispersion of nanoclays in the PVA matrix. 30,34 The absence of characteristic clay peaks in XRD of nanocomposites indicated the exfoliation of clay layers in the PVA matrix leading to the formation of exfoliated nanocomposites. It was reconfirmed with tensile property data. In PBT7, there is a peak at 2θ = 6.07°, which was due to the agglomeration of clay content (Figure 7). The peak at 2θ = 27° is due to a partially crystalline structure of PVA. Thus, XRD studies indicate that all the nanocomposites exhibit exfoliated nanocomposites structure.
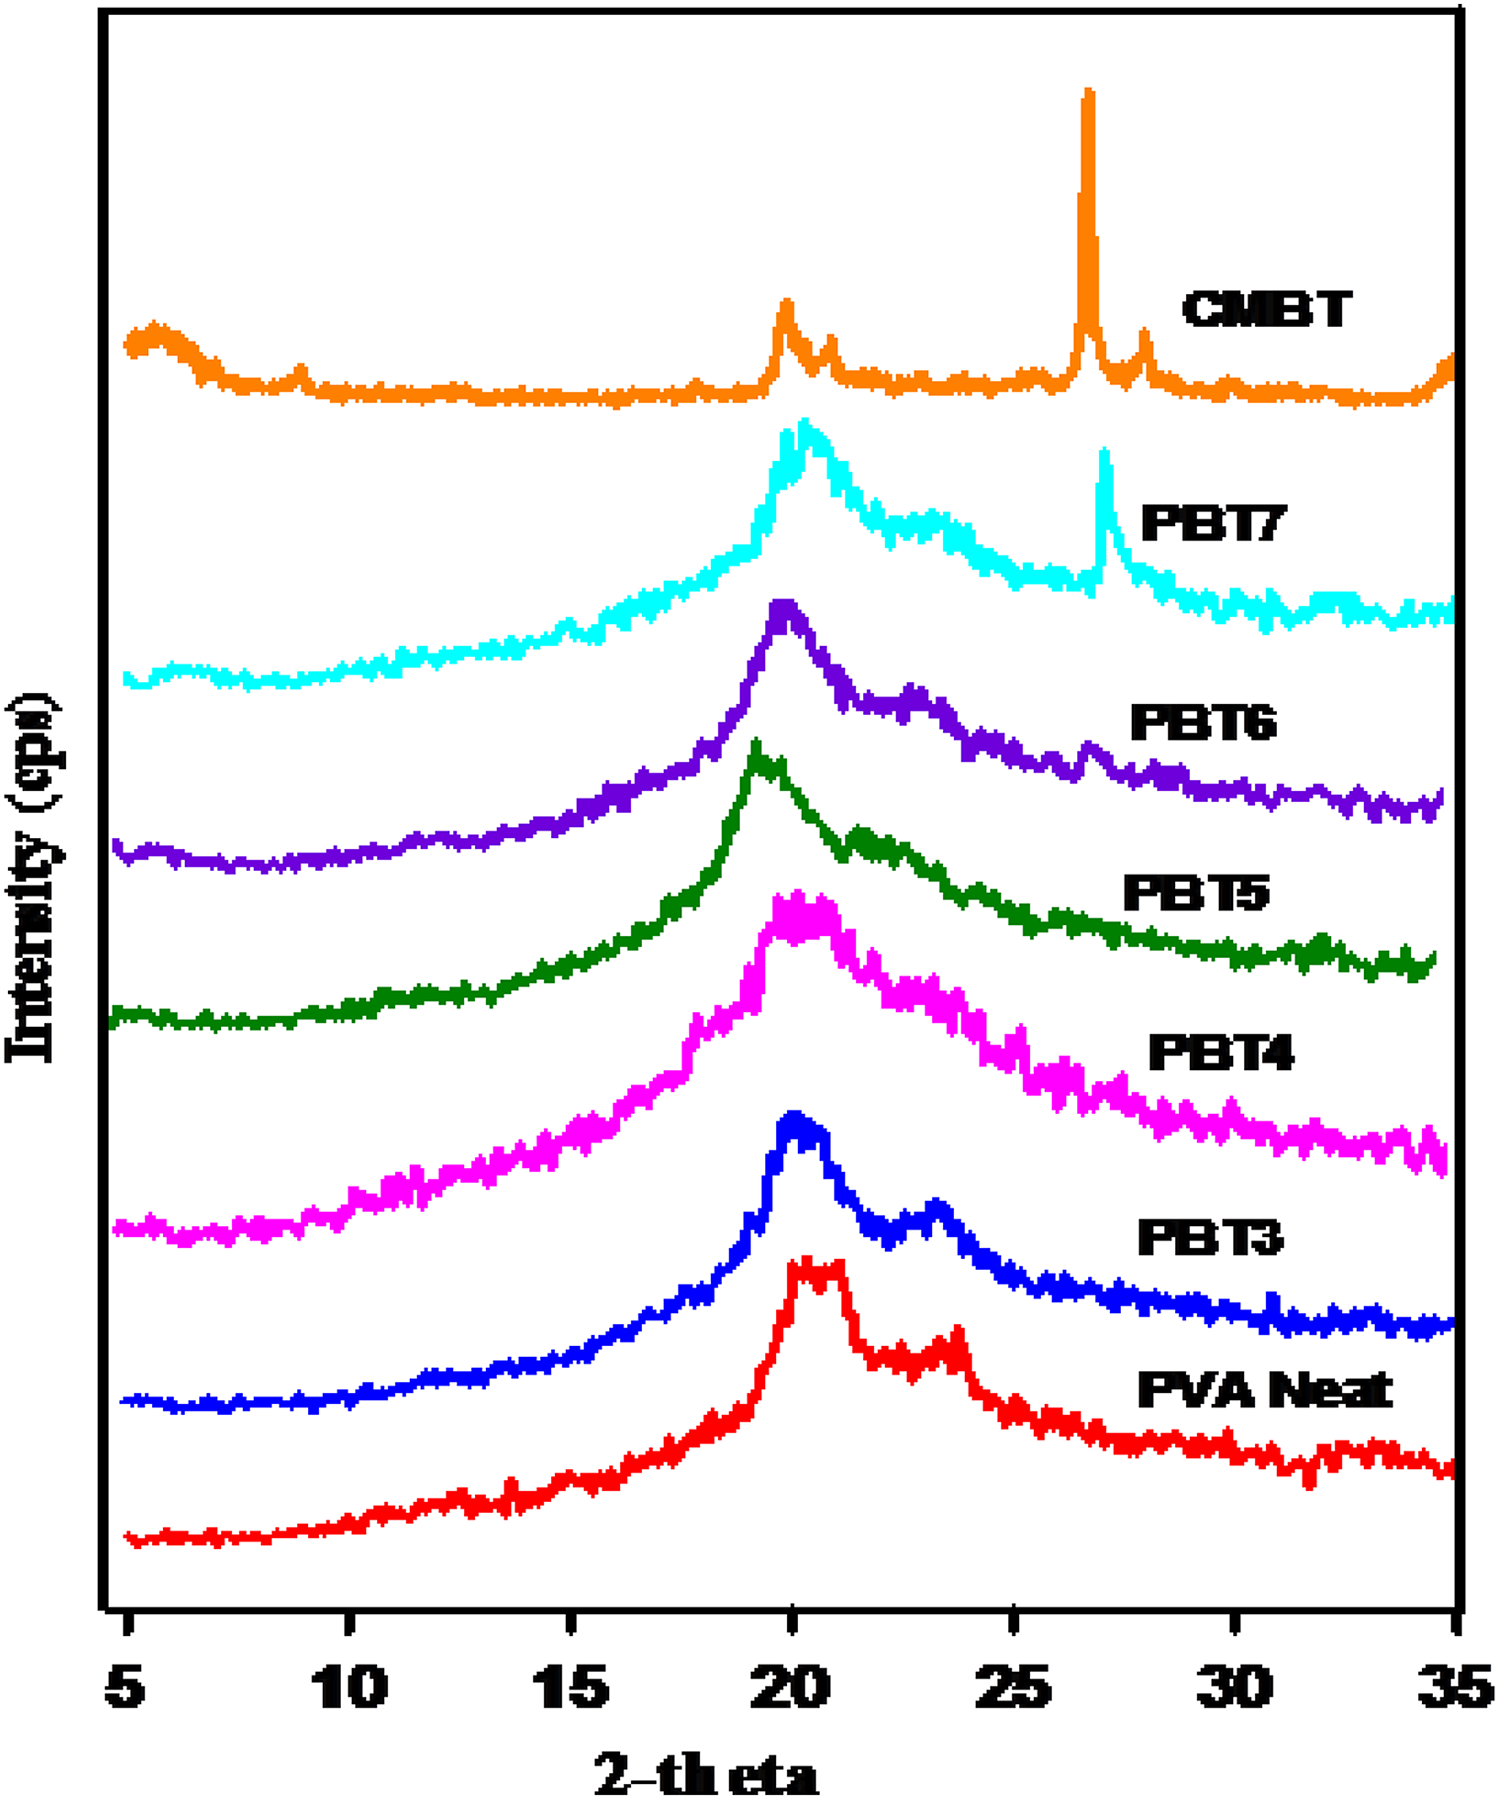
XRD pattern of PVA and nanocomposites.
Rheological studies
The rheological properties were studied using cone-plate rheometer. The shear stress and melt viscosity (η) of all the nanocomposites were measured and compared with the pristine PVA. The rheogram of the PVA and nanocomposites was given in Figure 8. The flow curve of the nanocomposite exhibits nonlinear behavior. The intercept of the flow curve of nanocomposites on shear stress axis at γ = 0, referred as yield stress, was found to be greater than the PVA. There was sudden decrease in viscosity at the low shear rate leading to the thixotropic flow (shear thinning) behavior of the nanocomposite 25 given in Figure 9(a) and (b). The melt viscosity of the nanocomposites decreases with the increase in shear rate resulting in non-Newtonian flow behavior of the nanocomposites given in Figure 9(a) to (c). The addition of nanoclay into the PVA matrix improves the melt viscosity of the nanocomposites.
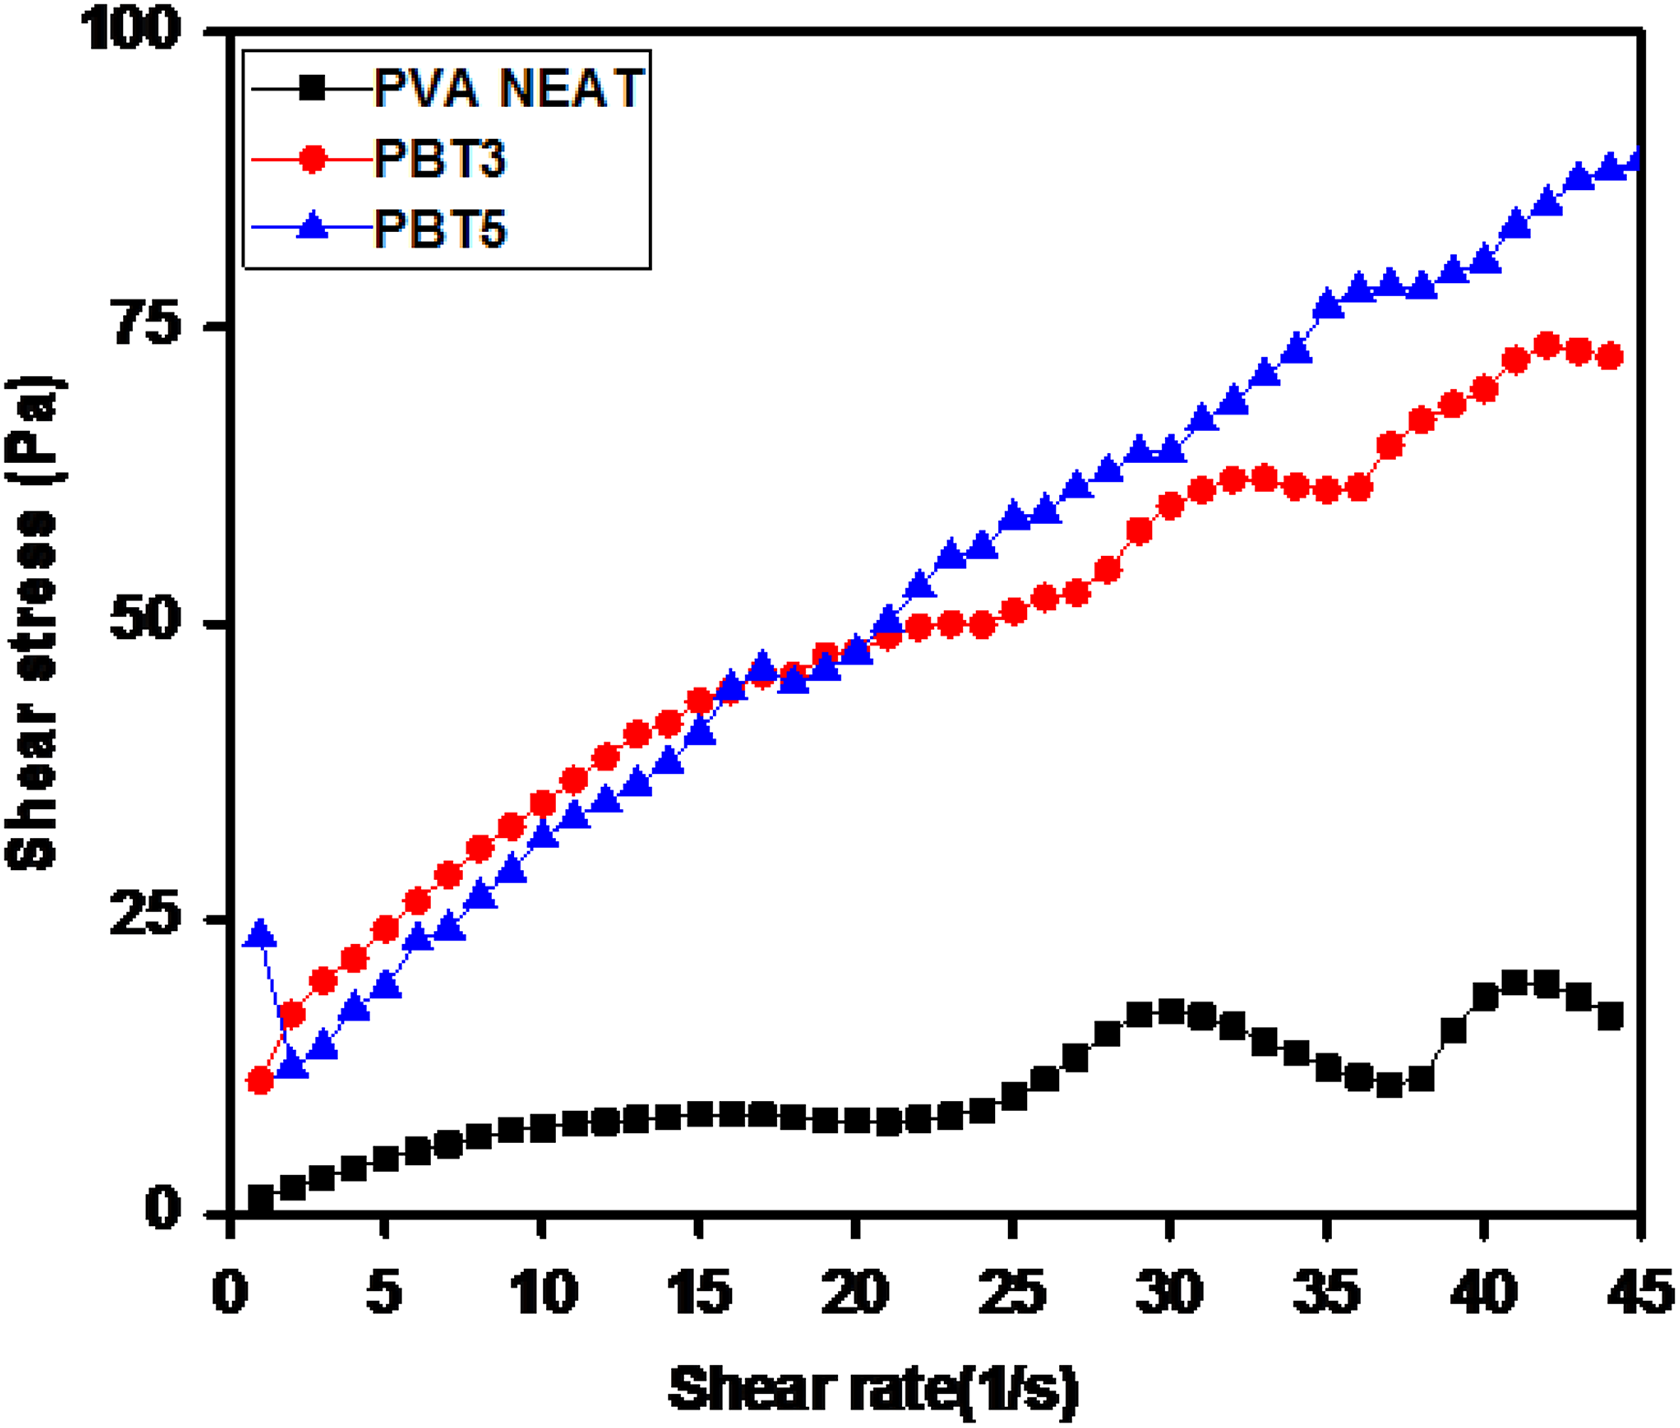
Rheogram of shear rate versus shear stress of PVA and PBT nanocomposites.
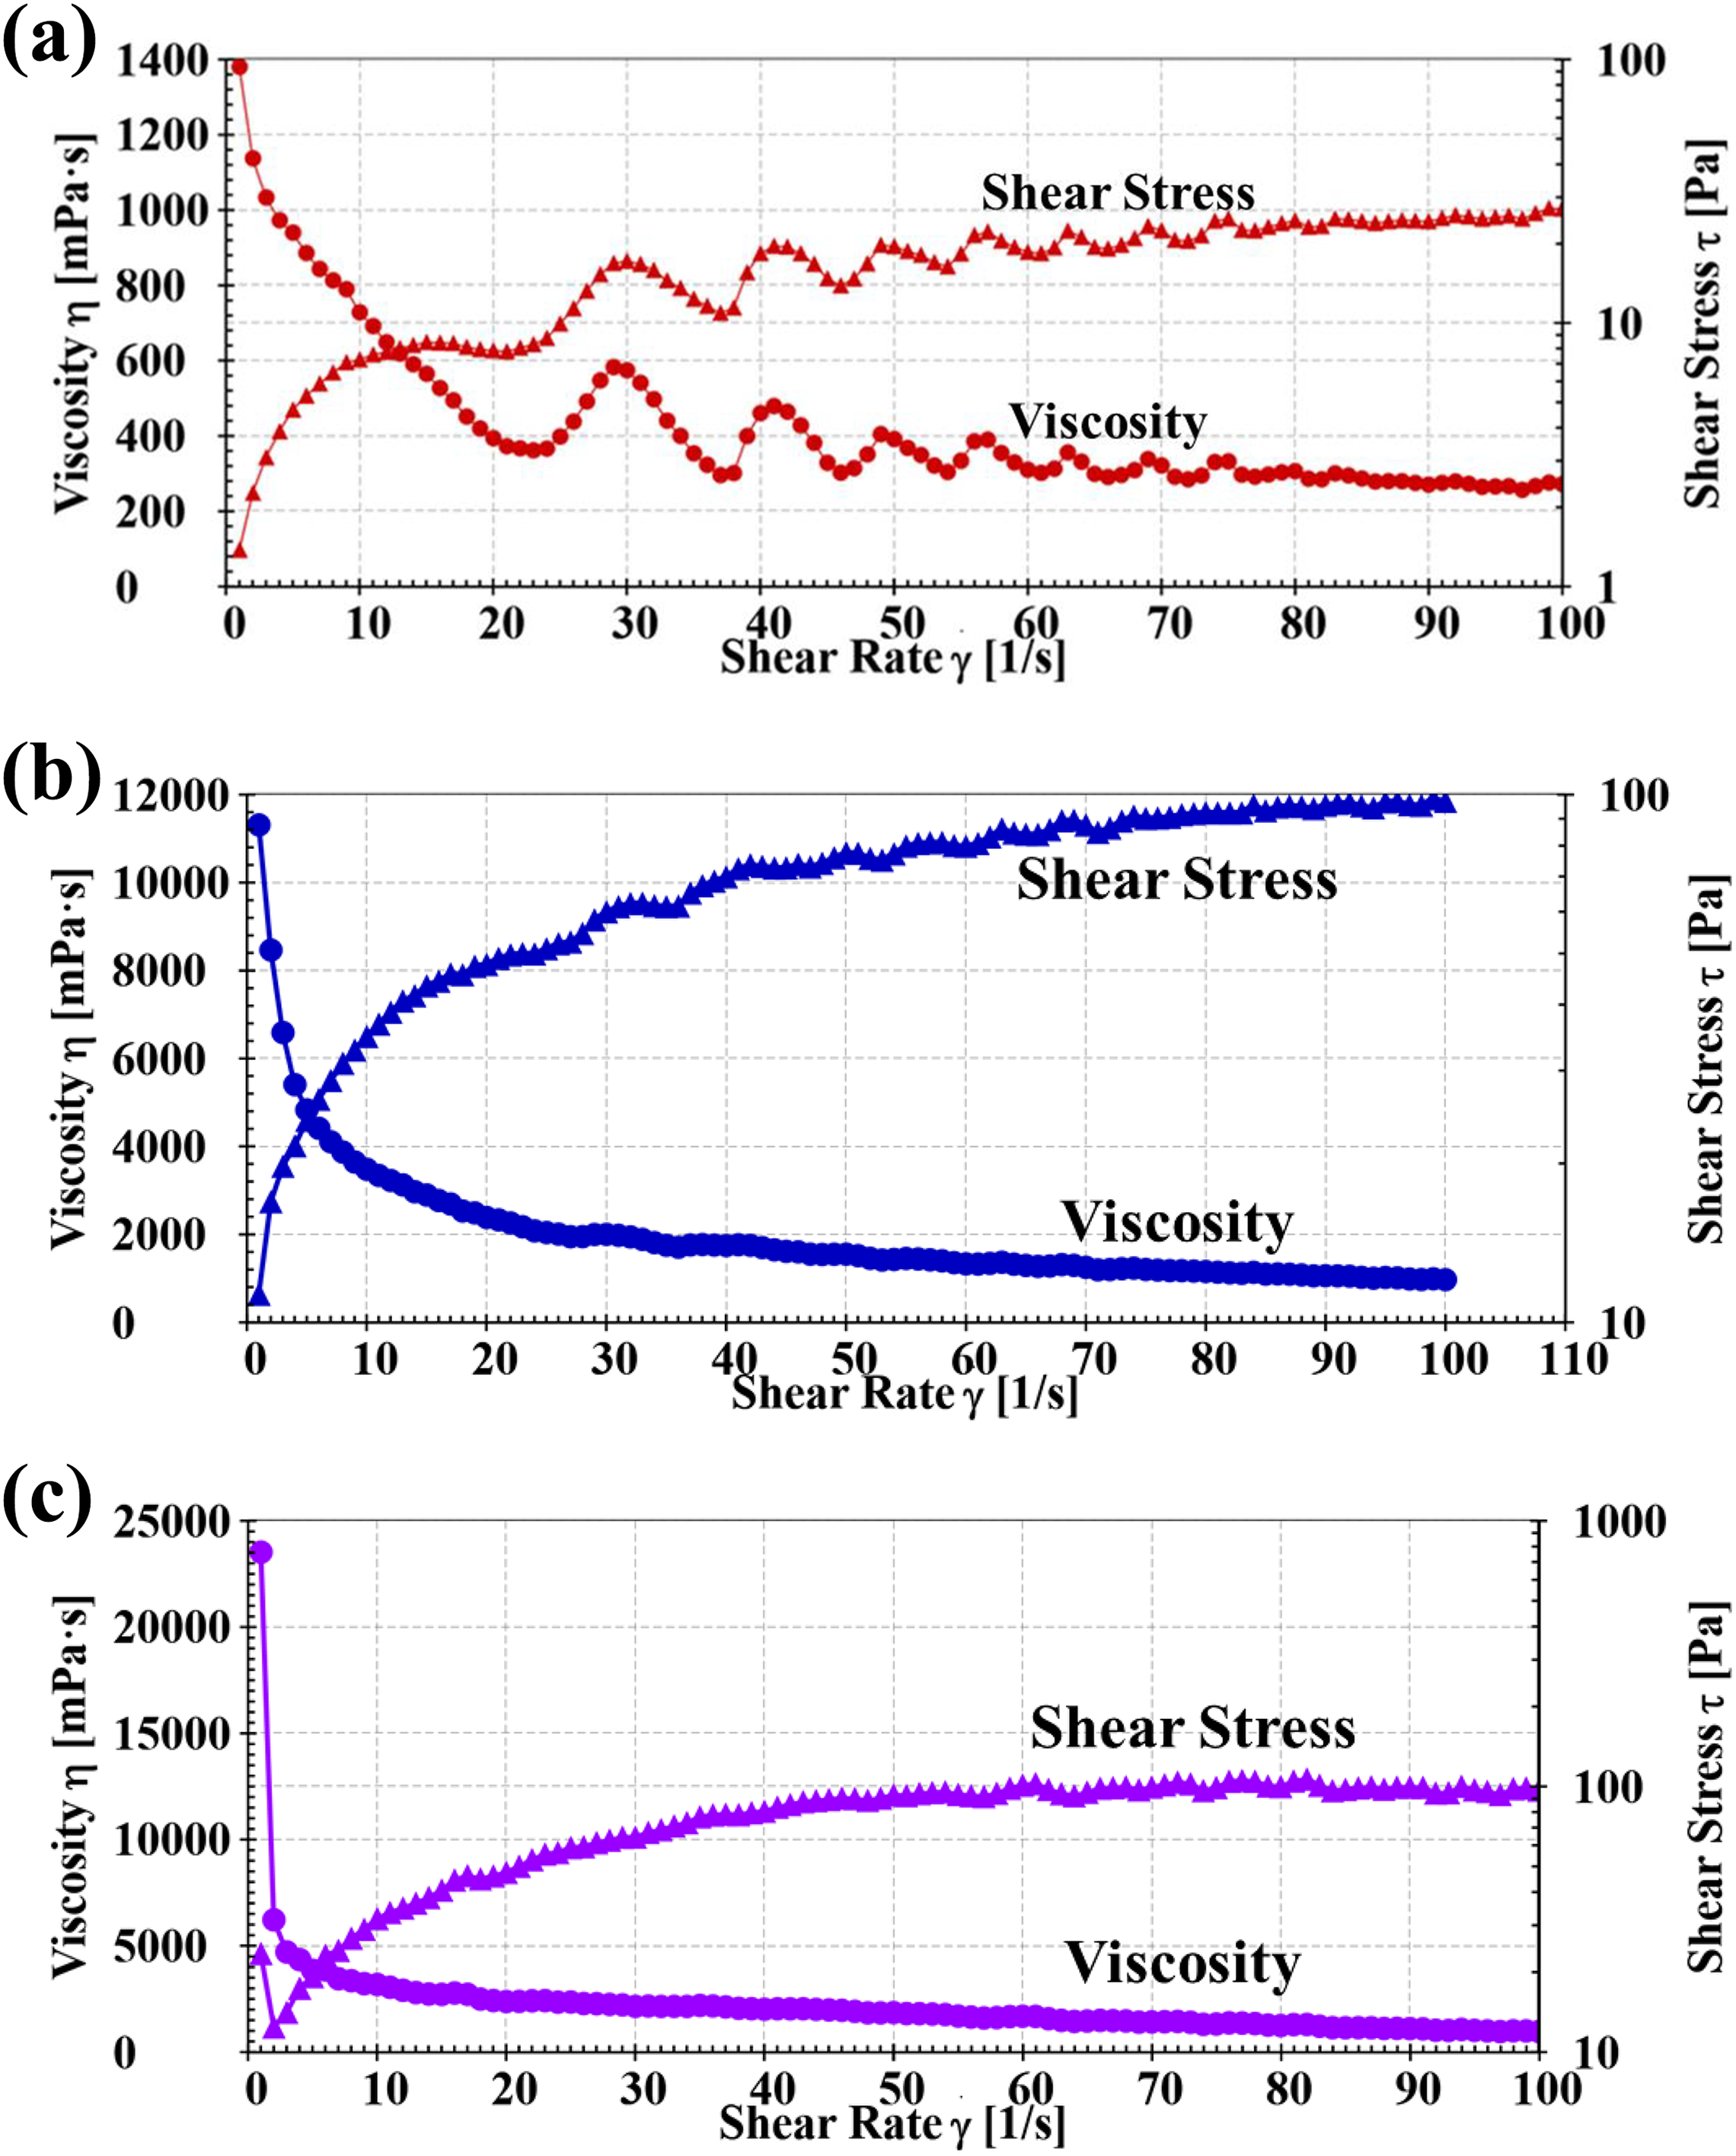
(a) Flow curve of PVA, (b) flow curve of PBT3, and (c) flow curve of PBT5.
Conclusions
PVA/calcined nanoclay composites were prepared using a twin-screw extruder. The nanocomposites show enhanced thermal stability, tensile strength, and percentage of elongation at break. The maximum melt viscosity of 4200 mPa s at 5 S−1 was observed for PBT3 in comparison with PVA (820 mPa s at 5 S−1) due to the incorporation of functionalized nanoclays. All the nanocomposites show shear-thinning flow behavior was determined using cone and plate geometry at 170°C. The SEM image and XRD pattern of PBT3 show good dispersion of nanoclays in the PVA matrix and exhibit exfoliated nanoclay composites structure, as confirmed by the thermal and stress–strain properties.
Footnotes
Acknowledgement
B Rajeswari and N Malarvizhi thank the Principal, Guru Nanak College, Chennai, Tamil Nadu 600042, India, for the permit to carry out the research work.
Funding
The author(s) disclosed receipt of following financial support for the research, authorship, and/or publication of this article: This project was funded by CSIR-CLRI cross-cluster project ZERIS (WP-21 CSC 0103).