
Abstract
Circadian rhythms in adult eclosion of Drosophila are postulated to be regulated by a pair of coupled oscillators: one is the master clock that is light sensitive and temperature compensated and the other that is a slave oscillator whose period is temperature sensitive and whose phase is reflected in the overt behavior. Within this framework, we reasoned that in populations of Drosophila melanogaster that have been artificially selected for highly divergent phases of eclosion rhythm, there may be changes in this network of the master-slave oscillator system, via changes in the temperature-sensitive oscillator and/or the coupling of the light- and temperature-sensitive oscillators. We used light/dark cycles in conjunction with different constant ambient temperatures and 2 different amplitudes of temperature cycles in an overall cool or warm temperature and analyzed phases, gate width, and normalized amplitude of the rhythms in each of these conditions. We found that the populations selected for eclosion in the morning (early flies) do not vary their phases with change in temperature regimes, whereas the populations selected for eclosion in the evening (late flies) show phase lability of up to ~5 h. Our results imply a genetic correlation between timing of behavior and temperature sensitivity of the circadian clock.
Introduction
Restricting behaviour to specific phases of the cyclic external environment is associated with enhanced Darwinian fitness and is known to improve physical and mental well-being in humans (Roenneberg et al., 2012; Vaze and Sharma, 2013). Thus, the study of behavioural phases under entrainment (ΨENT; also referred to as chronotypes) and their regulation is essential. Early studies have postulated that between-group differences in ΨENT (chronotype divergence) are predominantly driven by different free-running periods and/or the phase/velocity responses (PRC/VRC) of the clock to zeitgebers (Daan and Pittendrigh, 1976; Pittendrigh and Daan, 1976; Swade, 1969). Additional factors that regulate ΨENT also include inter-oscillator coupling, amplitude of the zeitgeber and intrinsic amplitude of the circadian clock (Aschoff and Pohl, 1978; Bordyugov et al., 2015; Granada et al., 2013; Johnson et al., 2003; Roenneberg et al., 2010). While there are many studies that look at the effect of period on ΨENT in great detail (for instance, Rémi et al., 2010; Srivastava et al., 2019), there are relatively fewer experimental studies that have analyzed the effect of other factors such as zeitgeber strength and coupling on ΨENT (Abraham et al., 2010; Aschoff and Pohl, 1978). Moreover, each such study is performed on a different model system, and therefore, gaining a unifying understanding of clock features that regulate phasing and their inter-relationships is difficult.
We have sets of populations of Drosophila melanogaster (henceforth, stocks) that have evolved in our laboratory to exhibit divergent phases of the adult eclosion rhythm (Kumar et al., 2007). We think that this is a suitable model system to ask questions regarding (1) the clock properties that have evolved to facilitate divergent timing and (2) the inter-relationships between said clock properties.
As a consequence of selection on phasing, earlier studies from our laboratory have found that flies of the morning eclosing (early) stocks and evening eclosing (late) stocks have shorter and longer free-running periods, respectively (Kumar et al., 2007; Nikhil, Abhilash, et al., 2016). Although this is expected, the between-stock difference in phasing of the eclosion rhythm under standard laboratory conditions (4 to 5 h; Nikhil et al., 2014) greatly exceeds the between-stock differences in period (~1.35 h for the eclosion rhythm and ~0.75 h for activity/rest rhythm; Nikhil, Abhilash, et al., 2016). This suggests that, in our populations, variation in ΨENT cannot be explained by differences in free-running periods alone. Moreover, although light pulse PRCs of the eclosion rhythm of the early stocks show relatively larger phase advances and that of the late stocks show larger phase delays (Kumar et al., 2007), these differences do not explain the ΨENT of the 2 sets of populations (Vaze, KL, et al., 2012).
Therefore, we reasoned that differences in the inter-oscillator coupling between circadian clocks (hereafter referred to as circadian network/organization) regulating eclosion rhythm may explain chronotype divergence in our stocks. This notion stems from a model of circadian organization that was proposed by Pittendrigh and Bruce (1959) to explain phasing of eclosion rhythms in insects. The authors proposed that the phase of eclosion rhythm follows immediately from the phase of a peripheral/slave/B-oscillator, which is entrained by a central/master/A-clock. Further, the authors proposed that the master clock is light sensitive and its period temperature compensated, whereas the peripheral clock is light insensitive and its period temperature sensitive. This implied that when the B-clock is entrained by the A-clock, different periodicities of the B-clock (under different temperatures) will entrain with different phases relative to the light cycle, thereby regulating the phase of overt behavior. However, the extent of this regulation will depend on the strength of coupling between the A- and B-clocks (Oda and Friesen, 2011; Pittendrigh et al., 1958; Pittendrigh and Bruce, 1959).
A previous study from our laboratory found that the phase divergence between early and late stocks was enhanced under semi-natural conditions wherein the culture vials were exposed to multiple zeitgebers, predominantly light and temperature (Vaze, Kannan, et al., 2012). This prompted us to hypothesize that temperature plays an important role in phase divergence in the context of the aforementioned model of circadian organization. Subsequently, Nikhil et al. (2014) assayed the eclosion rhythms of the early and late stocks under rectangular and ramped light/dark (LD) and thermophase/cryophase (TC) cycles either in-phase or out-of-phase. Overall, the authors observed that phases of eclosion rhythm were delayed in all populations under LD cycles relative to phases under semi-natural conditions, when temperature was constant, whereas all populations showed similar phases under TC cycles + constant darkness and semi-natural conditions. The authors argue that ΨENT in natural environments is likely to be regulated by both zeitgebers together for “optimal” phasing, such that TC cycles can compensate for delayed phase under LD cycles. However, in the experiments conducted by Nikhil et al. (2014), the nature of cycling of LD (i.e., rectangular versus ramped) and the altered phase relationship between LD and TC cycles can act differentially on the light-sensitive pacemaker (or A-clock) of the early and late stocks. Therefore, although the authors attribute different extents of phase divergence/convergence in their study to differences in the circadian organization, the individual role of the temperature-sensitive B-clock in mediating such differences remains unclear. In addition, we hypothesize that the phase-advancing effect of TC cycles must be dependent on the absolute value of temperatures of the TC cycle. We were also interested in examining eclosion rhythms in our populations under different constant ambient temperatures and amplitudes of temperature cycles because (1) from an ecological perspective, temperature is expected to be a major zeitgeber in the wild, especially for insects (Rensing and Ruoff, 2002) and (2) the mean temperature and amplitude of daily temperature cycles vary by a large amount across latitudes and significantly across seasons, even in lower latitudes (Suppl. Fig. S1, top and bottom, respectively) where photoperiod does not change much. For instance, in Colombo, Sri Lanka (latitude: 6.93 °N), the mean temperature varies annually between 26 °C and 29 °C, and the amplitude of the temperature cycles varies annually between ~3 °C and ~8 °C (Suppl. Fig. S2, top); however, photoperiod varies only by less than an hour (Suppl. Fig. S2, bottom). Owing to the fact that smaller fluctuations in temperature can entrain circadian clocks in organisms (see Das and Sheeba, 2017, for a review), the aforementioned changes may be imposing selective pressures on insect clocks in the wild, thereby influencing chronotype divergence.
To test our aforementioned hypotheses and gain clarity regarding differences in the circadian organization of the clock regulating eclosion rhythms in our flies, we asked the following questions:
Do the early and late stocks respond differently to low and high constant ambient temperatures relative to standard 25 °C in the presence of an LD cycle?
How do phases of the eclosion rhythm in our stocks behave under LD+TC cycles with increasing amplitude of TC cycles under overall cool temperature?
Do the relationships seen above change when the overall temperature is warm?
In addition to these very specific questions related to our stocks, we think that our study is important because it allows us to assess broader questions regarding how chronotype divergence is affected by different temperature regimes. In addition, while Nikhil et al. (2014) demonstrated that the phase relationship of temperature and light cycles is an important regulator of chronotype divergence, our study focuses on how aspects of temperature cycles contribute to the regulation of such divergence. Furthermore, the fact that magnitude of chronotype divergence is subject to the environment provided suggests that all chronotypes do not respond in a similar manner to such changes in the environment. Our study allows one to understand the contribution of 2 extremes of the chronotype distribution to the overall regulation of divergence between them. We feel that such studies are important to fuel further theoretical and mechanistic studies that can allow us to understand how chronotypes are regulated under realistic environmental conditions.
Materials and Methods
Fly Populations
Briefly, 4 replicates of early (earlyi = 1..4), control (controlj = 1..4) and late (latek = 1..4) populations were derived from 4 common ancestral, large, outbred populations and were used in all of the experiments reported here. The earlyi, controlj and latek populations that share the same subscript (i = j = k; referred to as “blocks”) share common ancestry, and the populations with different subscripts indicate independent genetic substructures (detailed maintenance protocols are described in Kumar et al., 2007). All 12 populations were maintained on banana-jaggery medium under LD12:12 (with ~70 lux light intensity during the photophase) at 25 ± 0.5 °C and ~65% to 70% relative humidity, on a 21-day discrete, nonoverlapping generation cycle.
All assays reported in this article were performed on the populations after ~280 generations of selection. Before the assays, fly populations were subjected to 1 generation of common rearing (standardization) to minimize maternal and non-genetic effects on the trait being measured (Bonduriansky and Day, 2009). We argue that our approach, wherein we use 4 sets of replicate populations, allows us to make strong statements regarding the co-evolution of timing of behavior and temperature response modalities that perhaps reflect changes in the circadian organization.
Adult Eclosion Rhythm Assay
In all of our experiments, we used a fixed light/dark schedule of LD12:12 with ~70-lux light intensity during the photophase, and we also fixed the phase relationship between the LD cycles and different TC cycles, such that warm temperature onset happened 4 h after onset of light. We fixed these aspects of the light cycle to ensure that during all of our temperature manipulations, input to the light-sensitive A-clock was held constant. In this way, variations in the rhythm could be predominantly attributed to the effects of temperature on the B-clock and any other light-temperature integrator within the clock circuit.
Approximately 300 eggs from each of the 12 populations were collected and dispensed into 10 vials each with banana-jaggery medium for all the assays. Initially, eclosion of early and late chronotypes was monitored under LD12:12 at constant 19, 25 and 28 °C. The LD12:12 under 25 °C experiment was done by Lakshman Abhilash, and a part of those results are published elsewhere (Nikhil, Abhilash, et al., 2016). Further, we performed an eclosion assay under LD12:12 along with temperature cycle TC12:12 of low amplitude (3 °C) or high amplitude (6 °C). These LD+TC assays with different amplitudes of temperature cycles were performed under 2 different mean ambient temperatures, first at 19 °C (17.5-20.5 °C, LA19 and 16-22 °C, HA19) and subsequently at 28 °C (26.5-29.5 °C, LA28 and 25-31 °C, HA28). These temperatures were chosen so that the lower limit of temperature during the TC cycles with a low mean was not too low and the upper limit of temperature during the TC cycles with high mean was not too high for our flies (for a detailed note on the temperature tolerance of Drosophila, please see Ashburner et al., 2005). Further, it ensured that the temperature values did not overlap between the 2 regimes. Under all conditions, we started the assay 1 day after most pupae were black and recorded the number of flies emerging in every vial at 2 - h intervals until most flies in each culture vial had emerged. For more details regarding temperature profiles inside our incubators, please see Supplementary Figure S3.
Quantifying Rhythm Parameters and Chronotype Divergence
To estimate features of the rhythm that change under each of the assay conditions, we quantified 6 rhythm parameters. In a cumulative distribution of eclosion over 1 cycle/vial, we defined the phase of onset (ΨONSET) of eclosion as the time at which the proportion of flies emerging exceeded 0.05 and phase of offset (ΨOFFSET) as the time at which the proportion of flies emerging exceeded 0.95. We also computed phase of peak (ΨPEAK) as the time at which the maximum number of flies emerged over a cycle/vial. If there were 2 subsequent time points with the same maximum number of eclosing flies, then ΨPEAK was calculated as the average time between the 2 time points. Further, if there appeared to be bimodality in the eclosion rhythm, we considered the phase of the higher peak to carry out further analyses. In addition, gate-width was calculated as the time between the phases of onset and offset (ΨOFFSET – ΨONSET). We also calculated circular mean phase of entrainment (phase of center of mass; ΨCoM), which is a measure of the centrality of emergence on the time axis. The amplitude of the eclosion rhythm was also a key feature describing the pattern of emergence and it has also been used previously to describe the emergence rhythm waveform (Vaze, KL, et al., 2012). However, amplitude of the emergence rhythm is dependent on the gate-width of emergence, and hence, we used distance from the center (r) in polar coordinates as a measure of normalized amplitude (or, in other words, consolidation) of the oscillation. Chronotype divergence was measured as lateΨCoM – earlyΨCoM.
Data Analyses and Statistical Tests
First, the proportion of flies eclosing at a time point under each temperature regime was separately analyzed using a mixed-model 4-way randomized block design analysis of variance (ANOVA), where selection, temperature regime and time point were treated as fixed factors and blocks was treated as a random factor.
A separate mixed-model 3-way randomized block design ANOVA with block means was used for analyzing each rhythm characteristic, wherein the selection and temperature regime were treated as fixed factors and blocks as a random factor. Chronotype divergence under different constant ambient temperatures was analyzed using a 2-factor mixed-model randomized block design ANOVA with temperature regime as a fixed factor and blocks as a random factor. On the other hand, analysis of chronotype divergence under TC cycles was analyzed using a 3-way mixed-model randomized block design ANOVA with mean temperature and amplitude of temperature cycles as fixed factors and blocks as a random factor. All post-hoc multiple comparisons were performed using Tukey’s honestly significant difference (HSD) tests. All statistical tests were performed using STATISTICA v5.0 (StatSoft, Tulsa, OK), and results were considered significant at α = 0.05.
Results
In each of the temperature regimes we used, the first level of analysis was performed to infer if the rhythm of one stock differed from any other under different temperature regimes through a 4-way randomized block design ANOVA. A significant interaction between selection × time point × temperature regime implied that the waveform’s response to the temperature regime was stock dependent, therefore enabling downstream analyses. Each of the rhythm descriptors that we looked at further was analyzed using a 3-way randomized block design ANOVA, wherein a significant selection × temperature regime interaction implied that the temperature response of the waveform descriptor was stock dependent.
Eclosion Rhythms under Different Constant Ambient Temperatures
The statistically significant effect of selection × temperature regime × time-point interaction on the proportion of eclosion of early, control and late stocks indicated that the stocks responded differently to presented temperature regimes (F44,132 = 11.09, p < 0.05; Suppl. Table S4; Fig. 1a).
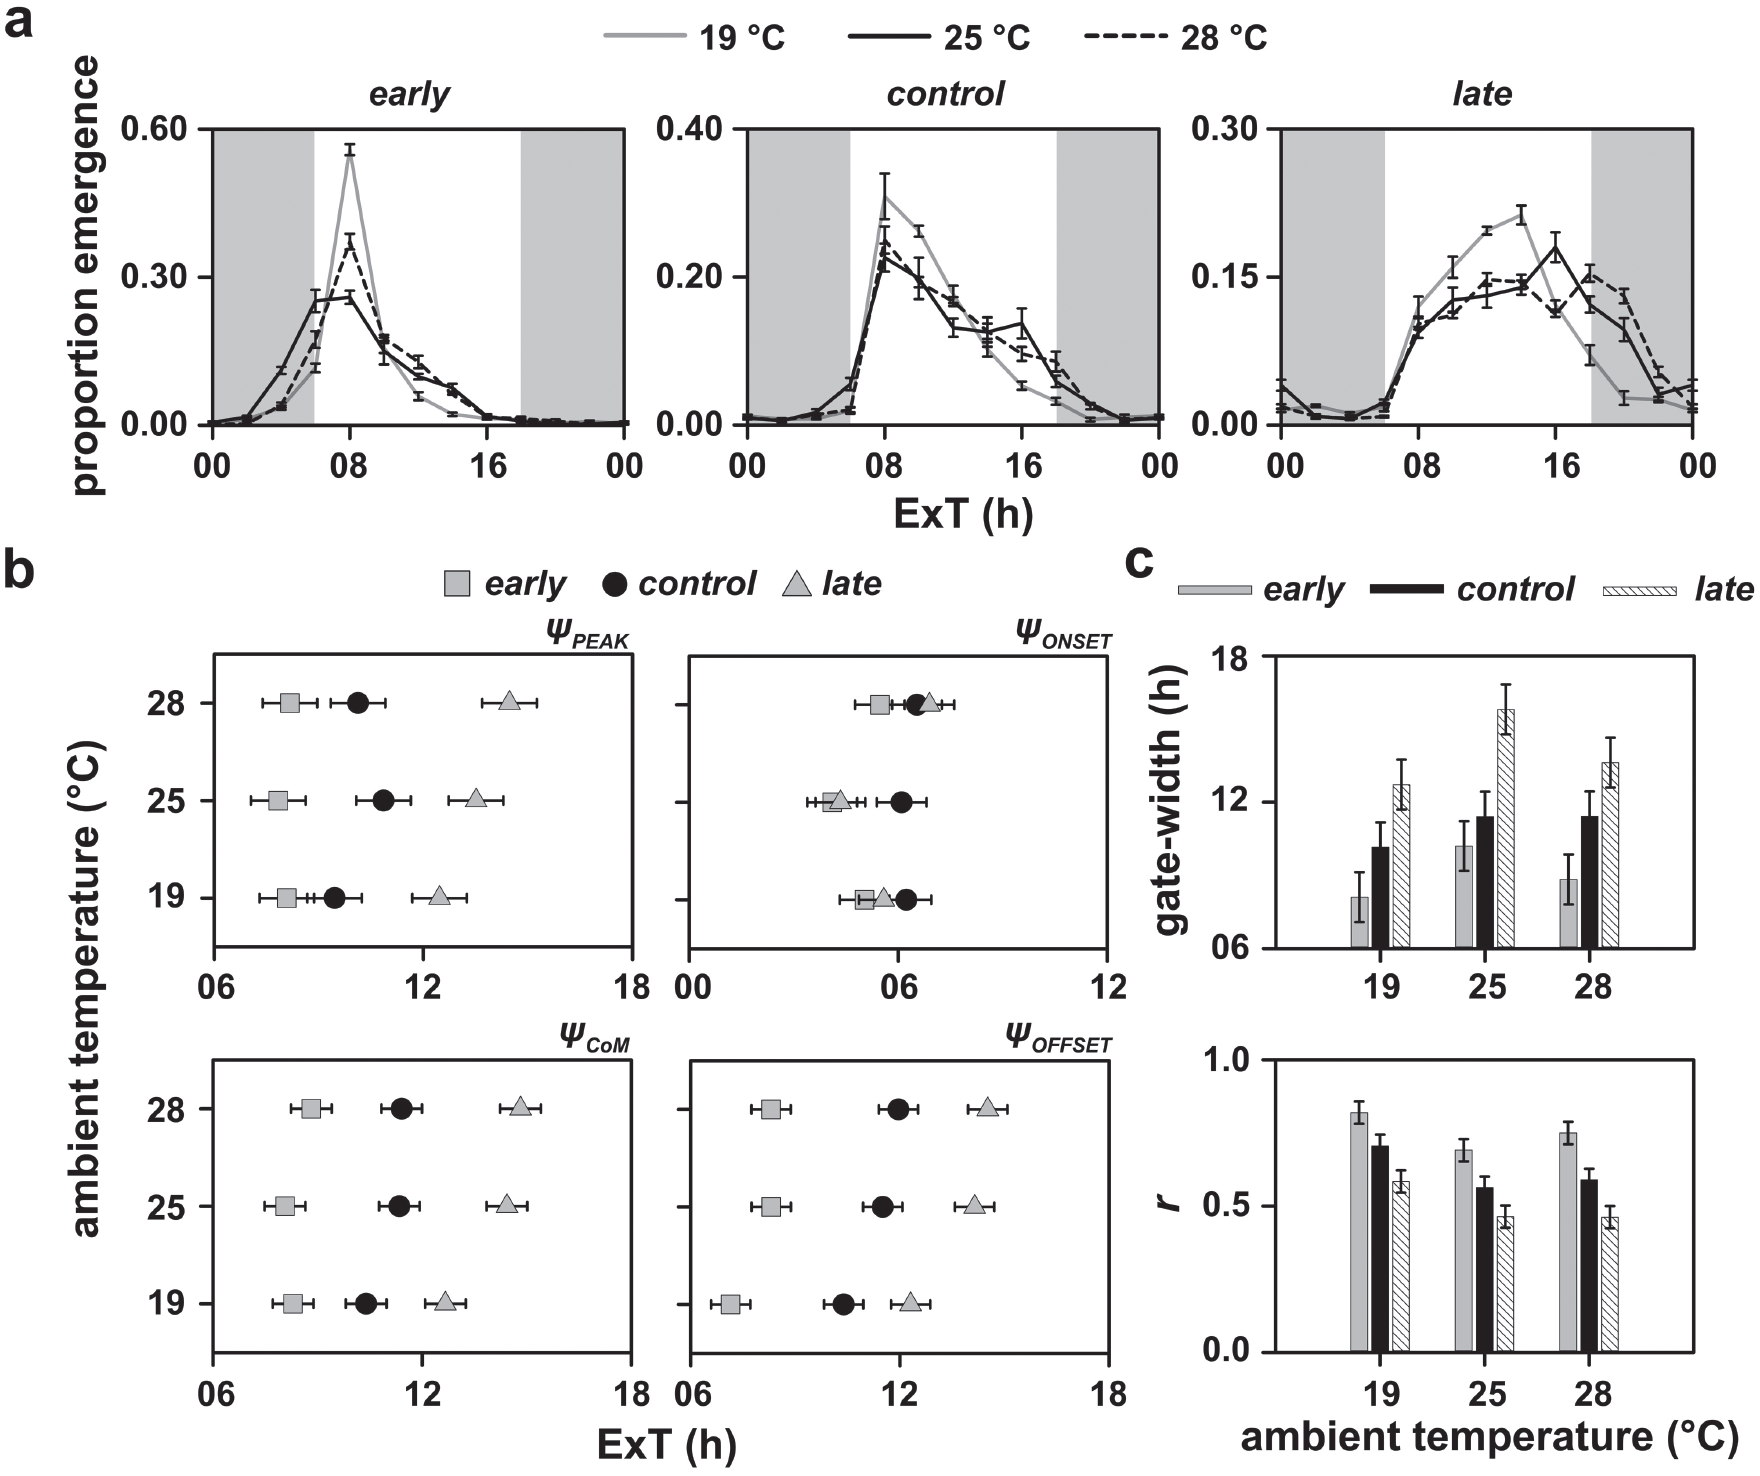
Depicted here are (a) eclosion rhythm profiles averaged over 4 replicate populations for early, control and late stocks; (b) phase of peak (ΨPEAK), phase of center of mass (ΨCoM), phase of onset (ΨONSET) and phase of offset (ΨOFFSET); and (c) gate-width and normalized amplitude (r) under LD12:12 and constant 19, 25, and 28 °C. The shaded regions in (a) represent the scotophase. Error bars in (a) are standard error of the mean and in (b) and (c) are 95% confidence intervals calculated using critical values from the Tukey’s HSD test. Therefore, all means in (b) and (c) with nonoverlapping error bars are statistically significantly different from each other. In all plots, data points were obtained by averaging values, first over all cycles, then over all vials and finally across 4 populations.
It is clear that the ΨPEAK, while invariant in response to different temperatures in the early and control stocks, is significantly delayed in the case of the late populations under warm temperatures (F4,12 = 4.60,p < 0.05; Suppl. Table S5; Fig. 1b, top left; Table 1). Further in the late stocks, although there is no significant difference in ΨPEAK between 19 and 25 °C and 25 and 28 °C, the phase is significantly delayed under 28 °C relative to 19 °C (Fig. 1b, top left; Table 1). In case of the ΨCoM, the patterns are similar to those observed with ΨPEAK. There was no difference in the phases of early and control stocks with change in temperature, but there was a significant advance of ΨCoM in the late populations under 19 °C relative to both 25 and 28 °C (F4,12 = 6.20, p < 0.05; Suppl. Table S6; Fig. 1b, bottom left; Table 1).
Phase values (in ExT), gate-width and normalized amplitude/consolidation of eclosion rhythms in early, control and late populations under LD12:12 and different constant ambient temperatures and amplitudes of temperature cycles under overall cool and warm environments.
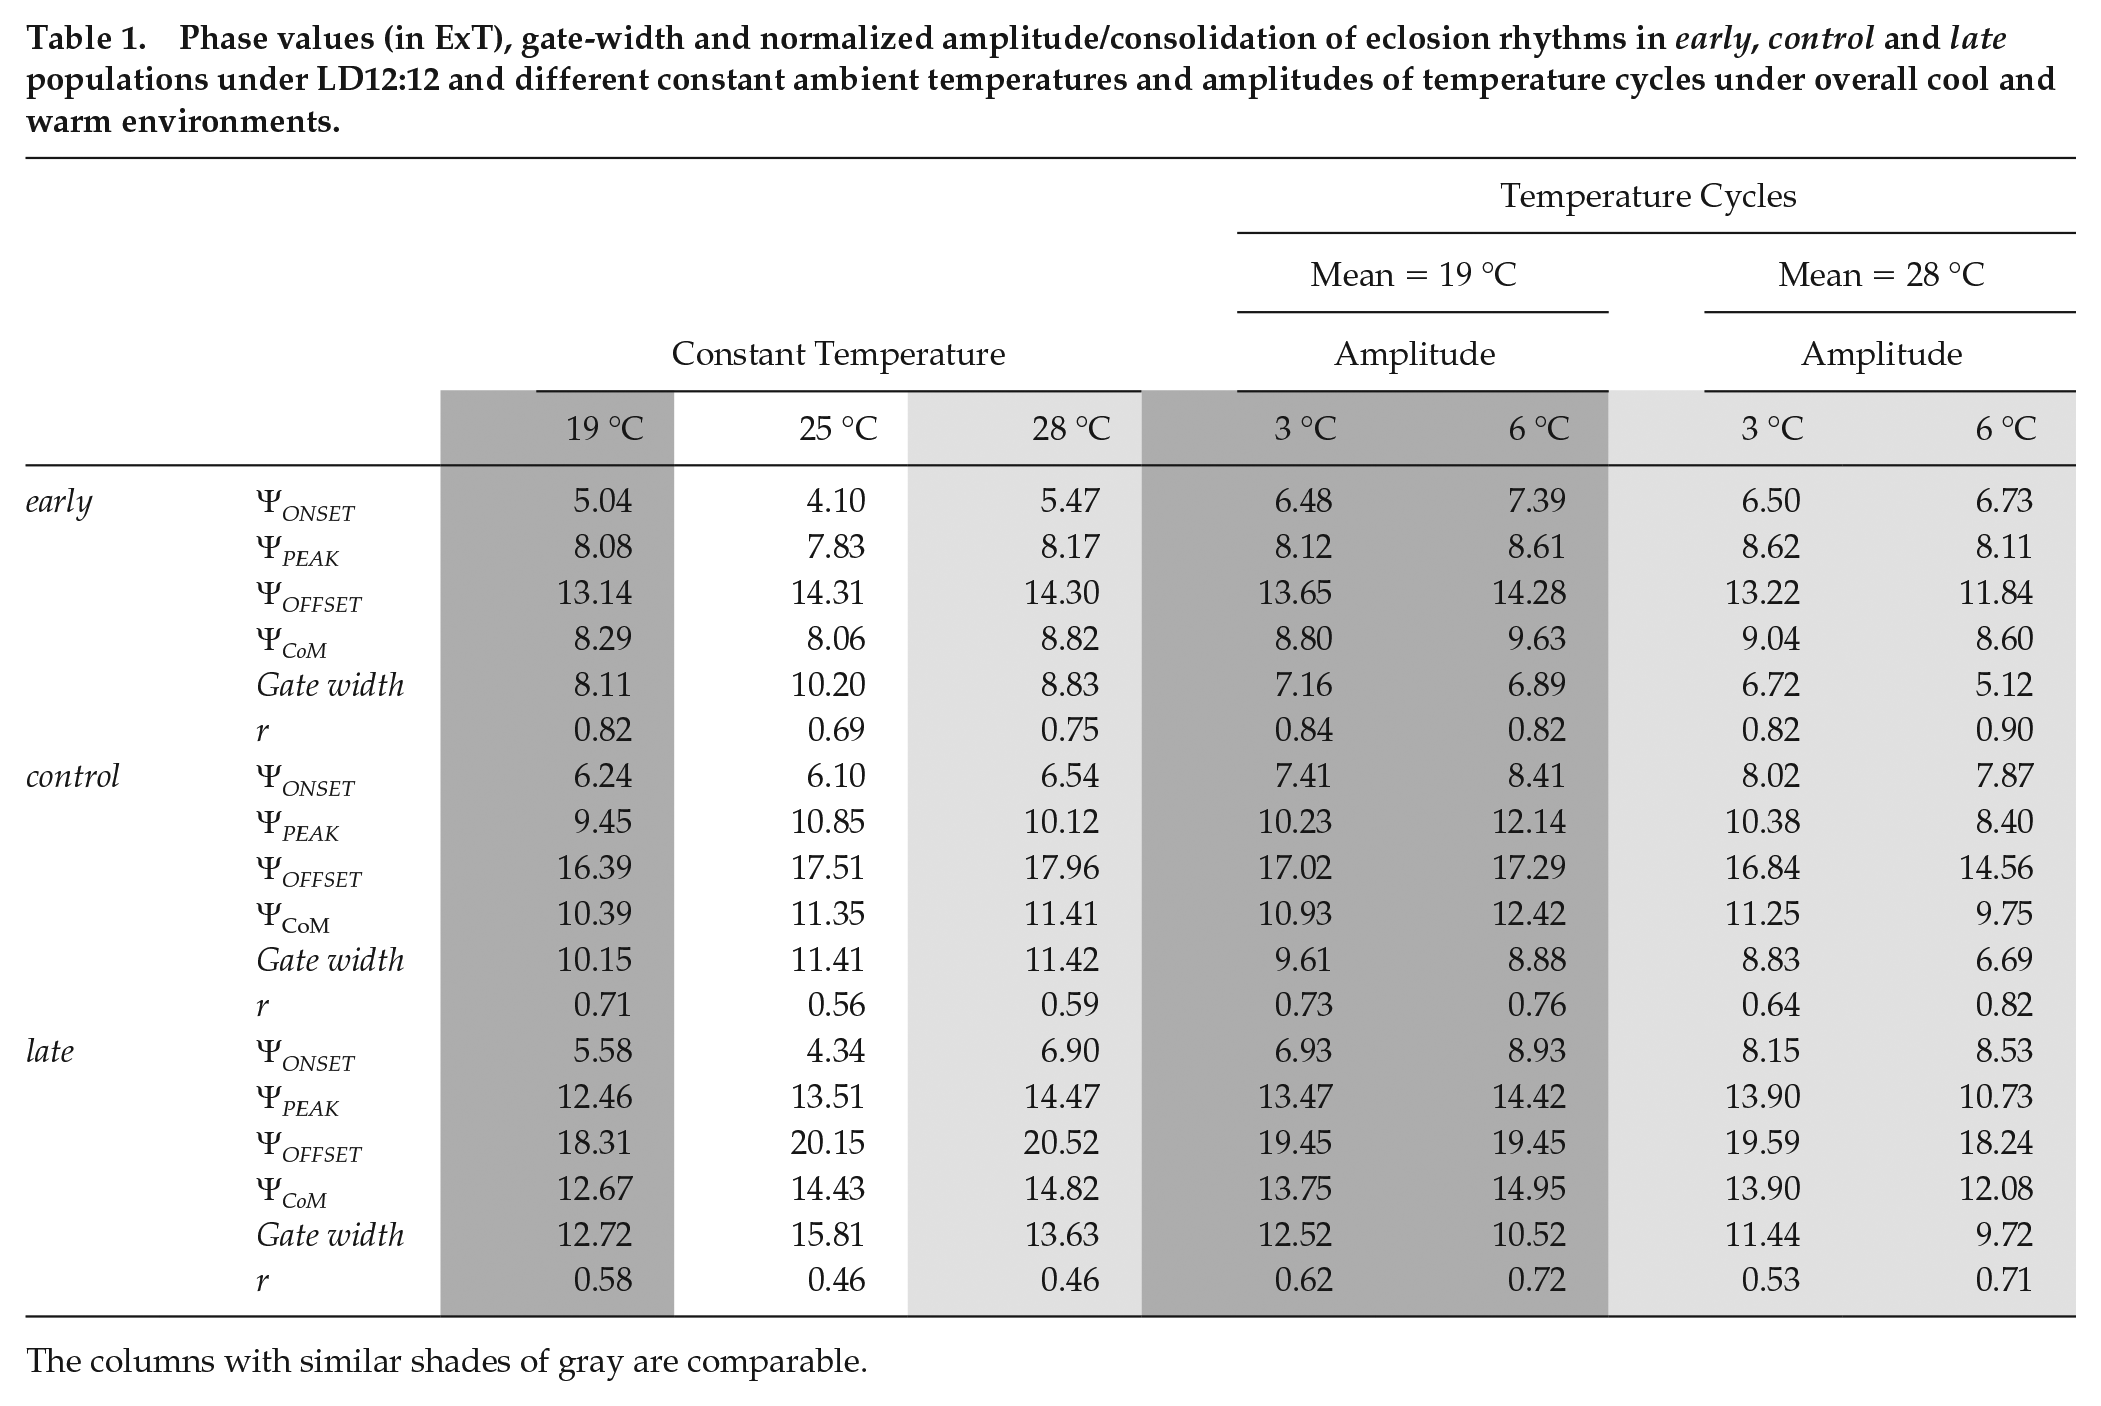

The columns with similar shades of gray are comparable.
The early and control stocks show no change in ΨONSET under different temperature regimes, whereas the ΨONSET is advanced by ~2.5 h under 25 °C relative to its value under 28 °C in the late populations (F4,12 = 3.97, p < 0.05; Suppl. Table S7; Fig. 1b, top right; Table 1). However, there was no difference in the way either population responded to different temperatures with respect to ΨOFFSET (F4,12 = 1.82, p > 0.05; Suppl. Table S8; Fig. 1b, bottom right; Table 1). All populations appeared to advance their eclosion offset by similar amounts in response to cool temperatures (Figs. 1a and 1b, bottom right; Table 1).
Under cool temperatures, gating of the eclosion rhythm was tighter and the normalized amplitude was higher (Fig. 1c, top and bottom; Table 1). However, all 3 stocks behaved similarly (gate width: F4,12 = 1.50, p > 0.05; Suppl. Table S9; normalized amplitude: F4,12 = 2.36, p > 0.05; Suppl. Table S10; Table 1).
The phases of our control populations under cool and warm temperatures were largely similar, and this result was in contrast with a previously reported study, albeit on Drosophila pseudoobscura, under similar conditions (Pittendrigh, 1954), thereby highlighting the importance of context/species specificity of such results (Figs. 1a, middle and 1b). It is also important to mention here that ΨPEAK of late populations under 25 and 28 °C in the profiles (Fig. 1a, right) appear to be different compared with the values reported in Table 1 and depicted in Fig. 1b (top left). This is due to higher replicate-to-replicate variation in the phase value and can be clearly seen in Supplementary Figure S11.
In summary, the major bout of eclosion in early and control populations happens around the same time across different constant ambient temperatures. However, the late populations phase advance their eclosion bout under lower temperatures, relative to higher temperatures, thereby suggesting enhanced temperature sensitivity of the circadian network in these populations.
Eclosion Rhythms under Overall Cool Temperature Cycles
Although we see that under constant ambient temperatures, the divergence between early and late populations is driven by the response of late populations, to claim that such responses are driven by differences in the temperature-sensitive slave oscillator, we must study their behavior under conditions wherein temperature can act as a zeitgeber. Therefore, we first studied the eclosion rhythms of early, control and late stocks that were subjected to LD+TC19 (TC cycles with a mean temperature of 19 °C) with low or high amplitudes – 3 °C or 6 °C and compared them with constant cool (19 °C) temperature (cryophase:cryophase or CC, analogous to DD for constant darkness).
Visually, while the early chronotypes do not differ much across provided regimes (Fig. 2a, left), the control populations seem to widen their eclosion distribution under TC19 with 3 °C amplitude and delay the peak such that most eclosion occurs during the thermophase under 6 °C amplitude (Fig. 2a, middle). The late chronotypes suppress eclosion even after lights-on until the thermophase begins under both low- and high-amplitude temperature cycles (LA19 and HA19, respectively) relative to their eclosion pattern under constant 19 °C (Fig. 2a, right). That the 3 stocks respond to these zeitgeber regimes differently is supported by a statistically significant effect of selection × temperature regime × time-point interaction on proportion eclosion (F44,132 = 18.36, p < 0.05; Suppl. Table S12).
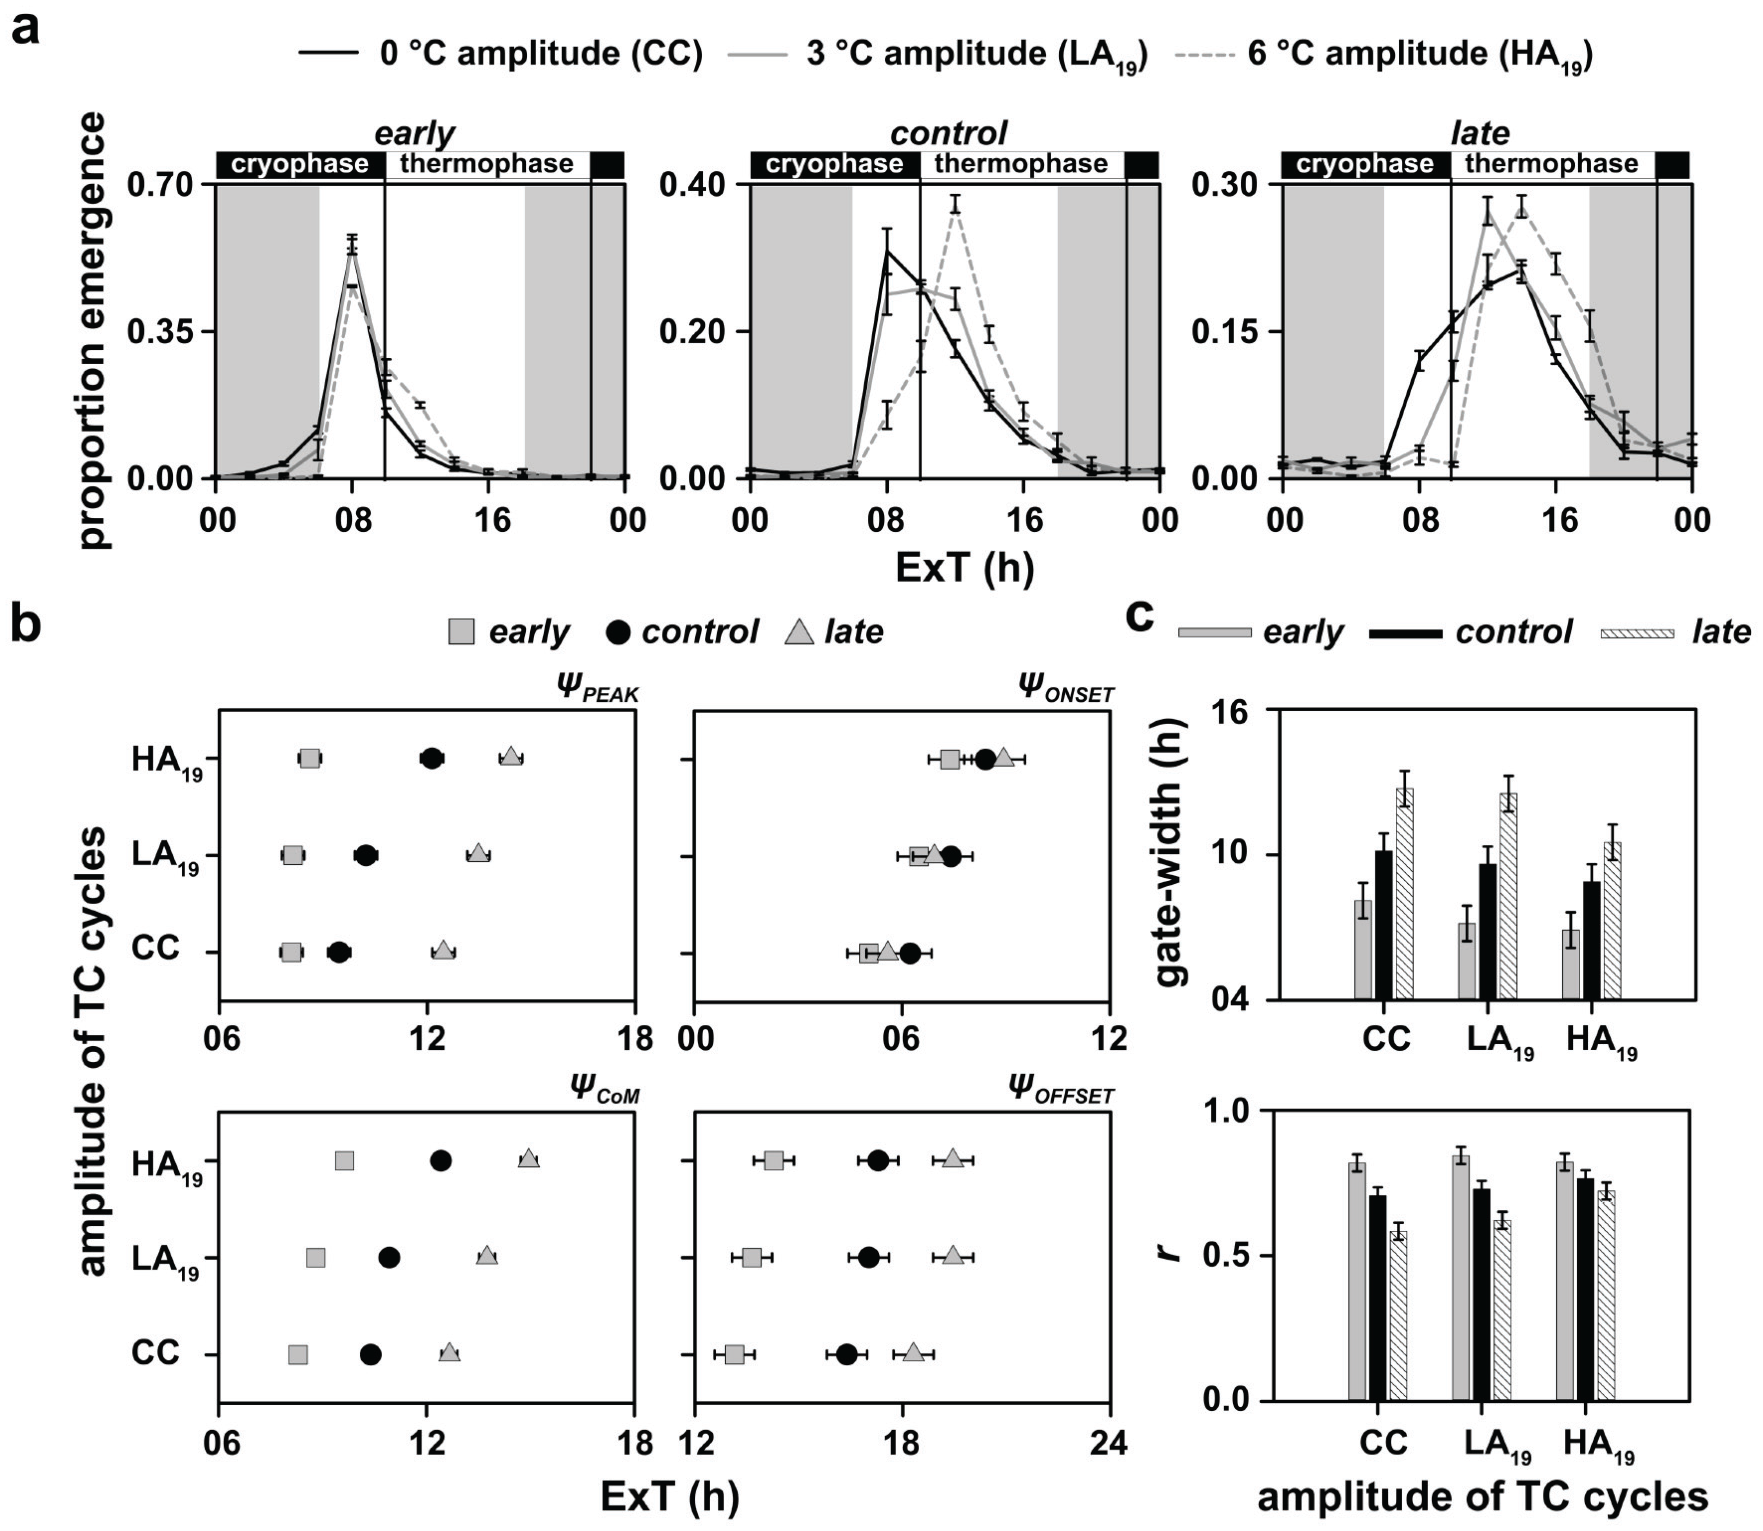
Depicted here are (a) eclosion rhythm profiles, (b) phase markers and (c) gate-width and normalized amplitude (r) for all stocks under LD12:12 and varying amplitudes of TC12:12 with an overall cool temperature. The temperature during the cryophase was 17.5 °C and 16 °C and that during the thermophase was 20.5 °C and 22 °C under the low- and high-amplitude TC cycles, respectively. Note that the eclosion profiles of early, control and late populations under 0 °C amplitude (CC-regime) are data obtained from experiments reported in Figure 1. They are replotted here to facilitate appropriate analyses and visual comparisons. All other details are same as in Figure 1.
We found that while the ΨPEAK of early populations was invariant to different TC cycles, the control and late populations progressively delayed their phases with increasing amplitude of the TC cycles (F4,12 = 21.94, p < 0.05; Suppl. Table S13; Fig. 2b, top left; Table 1). Interestingly, there were subtle changes in the waveform modulation of the late populations as compared with early and control populations, which were observed when we analyzed the ΨCoM. Although all 3 stocks showed delayed ΨCoM under HA19, relative to their values under CC, only the late populations significantly delayed their phase under LA19 (F4,12 = 10.12, p < 0.05; Suppl. Table S14; Fig. 2b, bottom left; Table 1). The apparent delay in ΨCoM of early chronotypes under HA19, despite the profiles looking similar, we think, could be due to increased eclosion during the thermophase, which is visibly absent under CC (Fig. 2a, left).
Both ΨONSET and ΨOFFSET delay with increasing amplitude of TC cycles, but all 3 stocks responded similarly (ΨONSET: F4,12 = 2.38, p > 0.05; Suppl. Table S15; Fig. 2b, top right; Table 1; ΨOFFSET: F4,12 = 0.81, p > 0.05; Suppl. Table S16; Fig. 2b, bottom right; Table 1).
Gate width narrowed with increasing amplitude of TC cycles in a similar manner across all 3 stocks (F4,12 = 2.71, p > 0.05; Suppl. Table S17; Fig. 2c, top; Table 1). However, the normalized amplitude significantly increased under HA19 compared with its value under LA19 and CC only in the late populations (F4,12 = 11.54, p < 0.05; Suppl. Table S18; Fig. 2c, bottom; Table 1).
In summary, the early populations were robust under different amplitudes of cool temperature TC cycles. However, although the control and late populations altered their phases in response to different regimes in a similar manner, the late populations were more sensitive compared with both early and control stocks and could alter their phases in response to a mere 3 °C amplitude in TC cycles. Moreover, the amplitude/consolidation of only the late populations increased under HA19. These results suggest the evolution of attenuation of temperature response in early populations and reinforce the notion of the evolution of enhanced temperature sensitivity of the clock in late populations.
Eclosion Rhythms under Overall Warm Temperature Cycles
Subsequently, we analyzed the eclosion rhythm profiles of our populations under LD+TC28 (TC cycles with a mean temperature of 28 °C). We found a statistically significant effect of selection × temperature regime × time-point interaction on proportion eclosion (F44,132 = 18.59, p < 0.05; Suppl. Table S19). The waveform of control populations was not altered under LA28 as compared with constant 28 °C (thermophase:thermophase or TT, analogous to LL for constant light; Fig. 3a, middle). However, the control populations had a sharper peak and tighter gating under HA28. The early chronotypes showed sharper peaks and narrower gate-width under both LA28 and HA28 relative to TT (Fig. 3a, left). The late chronotypes, overall, showed the most distinct changes in waveform — a phase advance under LA28 such that emergence occurs during the early hours of the thermophase. Importantly, under HA28, the late chronotypes show a very sharp peak and phase advance by ~5 to 6 h relative to TT, and most emergence occurs just before the transition to the thermophase (~31 °C; Fig. 3a, right).
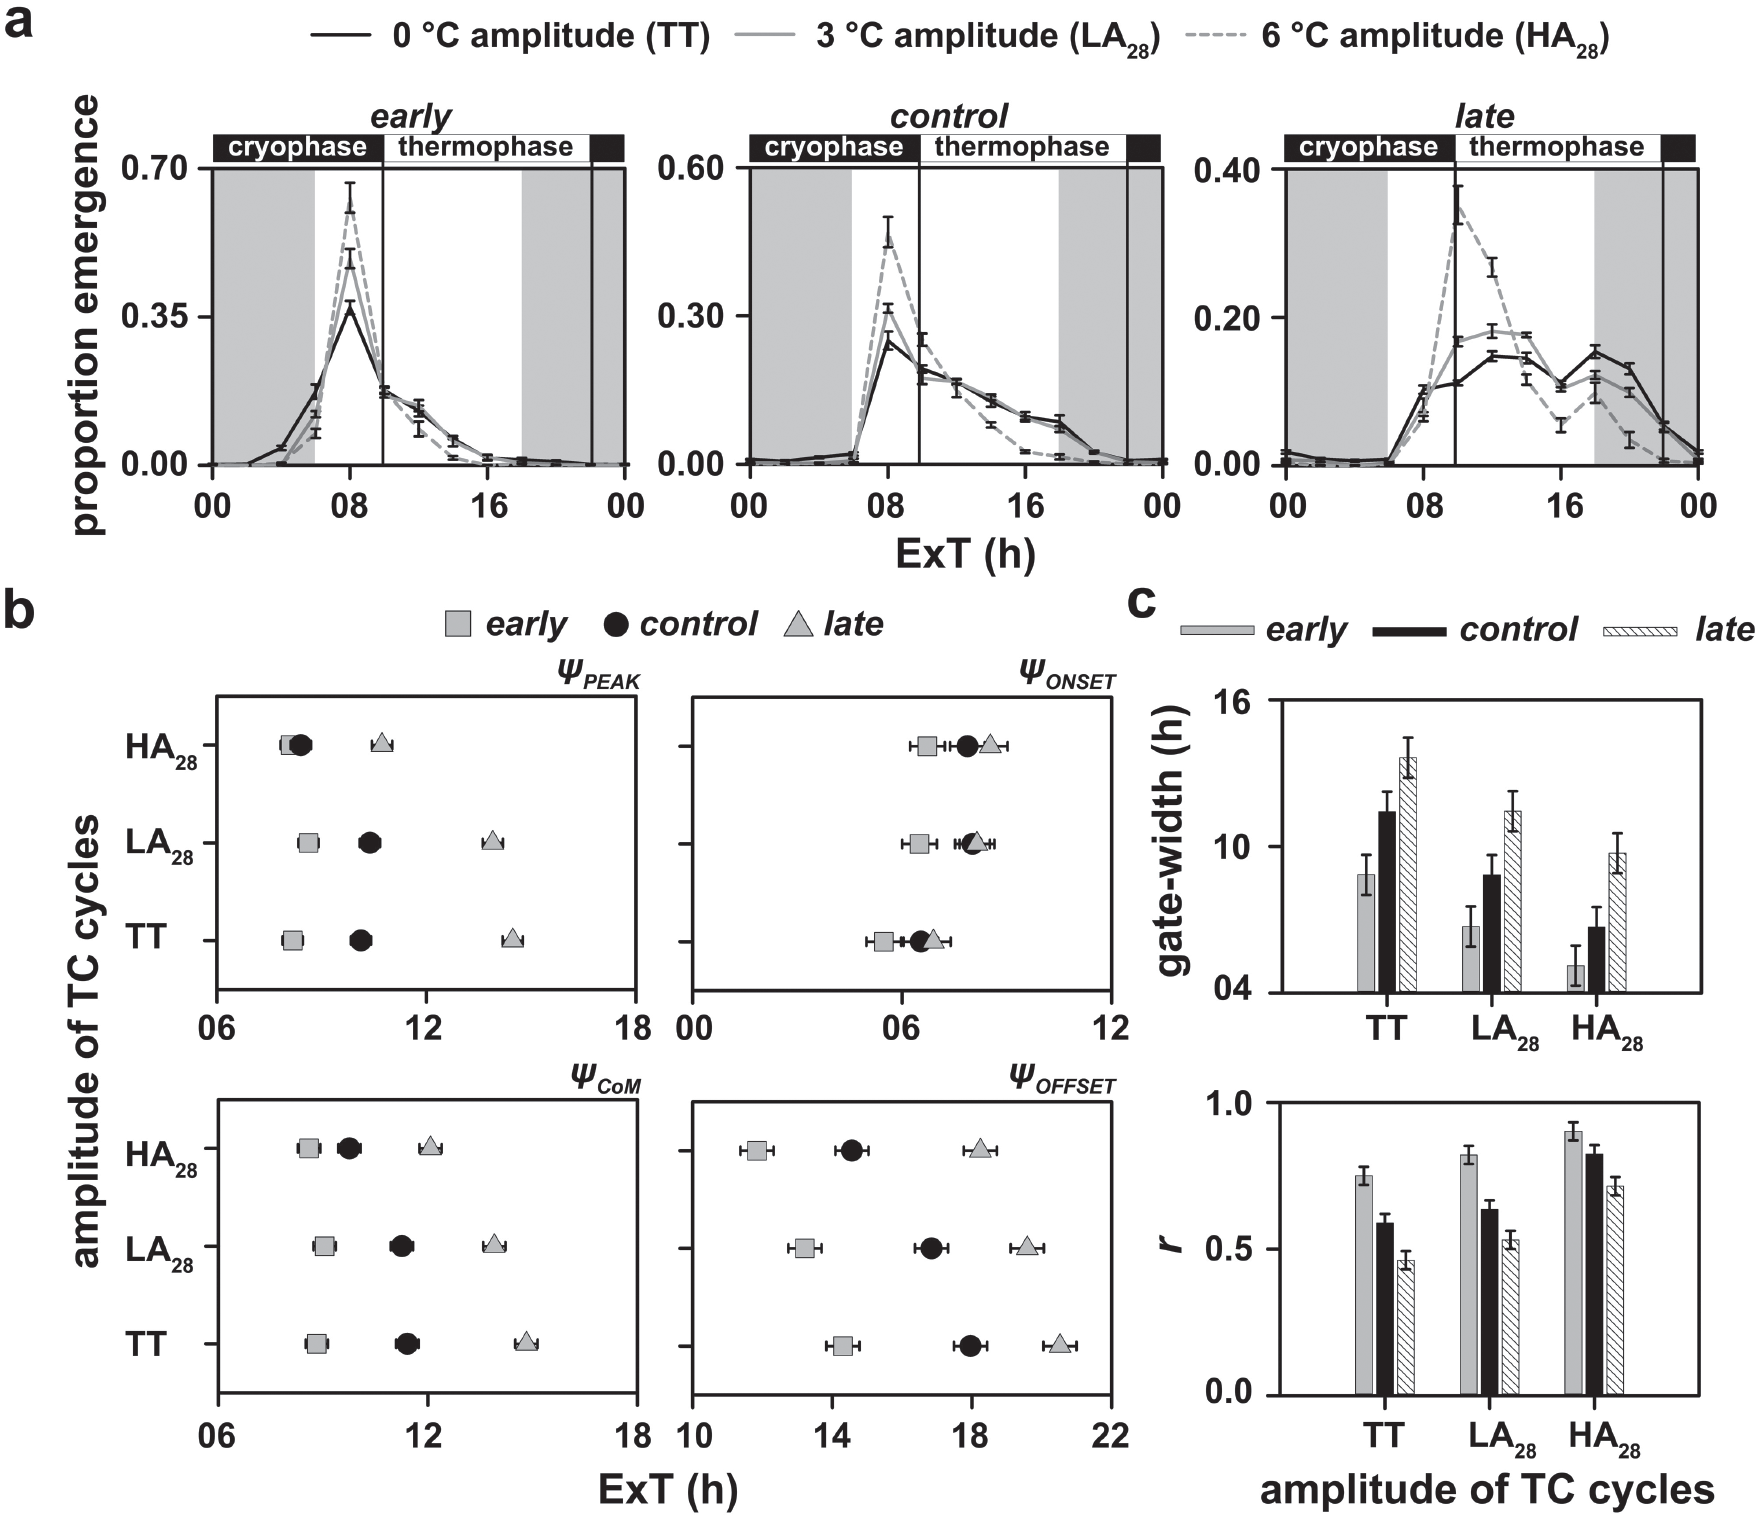
Depicted here are (a) eclosion rhythm profiles, (b) phase markers and (c) gate-width and normalized amplitude (r) for all stocks under LD12:12 and varying amplitudes of TC12:12 with an overall warm temperature. The temperature during the cryophase was 26.5 °C and 25 °C and that during the thermophase was 29.5 °C and 31 °C under the low- and high-amplitude TC cycles, respectively. Note that the eclosion profiles of early, control and late populations under 0 °C amplitude (TT-regime) are data obtained from experiments reported in Figure 1. All other details are the same as in Figure 2.
We found that the ΨPEAK of early populations was again robust, whereas both the control and late populations phase advanced their peak under HA28 relative to LA28 and TT (F4,12 = 75.74, p < 0.05; Suppl. Table S20; Fig. 3b, top left; Table 1). Results of the ΨCoM were similar to those under cool temperature TC cycles. While the early populations held similar phases under LA28 and HA28, the control and late populations phase advanced under HA28 relative to LA28 and TT. However, only the late populations phase advanced significantly even under LA28 compared with TT (F4,12 = 27.87, p < 0.05; Suppl. Table S21; Fig. 3b, bottom left; Table 1).
Unlike in the cool temperature TC cycles, ΨONSET and ΨOFFSET delayed and advanced, respectively, with increasing amplitude of TC cycles when the overall temperature was warm. This change, however, was similar for all populations (ΨONSET: F4,12 = 0.76, p > 0.05; Suppl. Table S22; Fig. 3b, top right; Table 1; ΨOFFSET: F4,12 = 3.35, p = 0.05; Suppl. Table S23; Fig. 3b, bottom right; Table 1).
Gating of rhythms was affected to similar extents in all 3 sets of populations under TT, LA28 and HA28 (F4,12 = 0.75, p > 0.05; Suppl. Table S24; Fig. 3c, top; Table 1). In addition, the relative difference in r between chronotypes seems to be significantly lower under HA28 relative to TT (F4,12 = 8.17, p < 0.05; Suppl. Table S25; Fig. 3c, bottom; Table 1).
It is important to note here the apparent discrepancy in the phase values for the peak in control populations in Figure 3a (middle) and Figure 3b (top left). Although it appears as if the peak occurs at the same phase for TT, LA28 and HA28, it is clear that the eclosion profiles of the control populations after the peak are flatter in TT and LA28. To gain clarity on this issue, we looked at blockwise profiles and the raw time-series values of all vials within a block and found a high degree of across-cycle and across-vial variation (Suppl. Fig. S26). This we believe contributes to the flatter profile under TT and LA28 and to the mean phase values that appear delayed as compared with what one would infer from the profiles.
In summary, we again find that the early populations are robust and the late populations are more labile than the control populations in response to changes in amplitude of TC28 cycles. In addition, we find that chronotype divergence is finely regulated depending on ambient temperature values and is largely brought about by the response of our late populations.
Chronotype Divergence
To understand the degree of difference in chronotype divergence/convergence that is brought about by different temperature regimes, we analyzed divergence values using ΨCoM. We found that the phase divergence between early and late stocks under LD12:12 and constant 19 °C (~4.37 h) was statistically significantly lower than the divergence under both 25 °C (~6.37 h) and 28 °C (~6 h; F2,6 = 11.66, p < 0.05; Fig. 4, left; Suppl. Table S27).
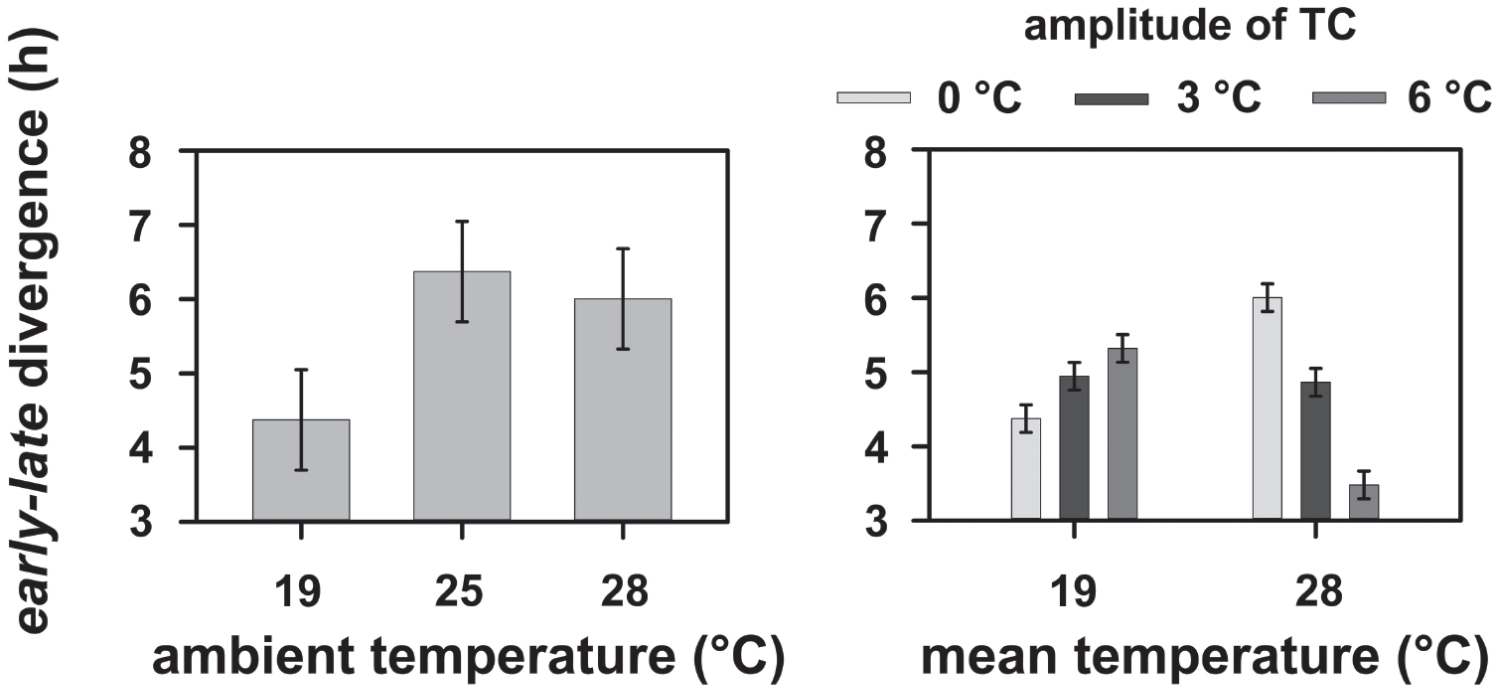
The phase divergence between early and late chronotypes estimated using the phase of center of mass (ΨCoM) under LD12:12 and different constant ambient temperatures (left) and LD12:12 and varying amplitudes of TC12:12 with different mean temperatures (right). Error bars denote the 95% confidence interval calculated using critical values from the Tukey’s HSD test. Therefore, all means with nonoverlapping error bars are statistically significantly different from each other. Please note that the data for divergence between early and late chronotypes under LD+TC with 0 °C amplitude in the right panel are the same data as those in the 19 and 28 °C category in the left panel. They are replotted here to facilitate appropriate analyses and visual comparisons. All mean values were derived as described in Figure 1.
Moreover, our analysis revealed a statistically significant interaction of mean temperature × amplitude of temperature cycle on early-late divergence using ΨCoM (F2,6 = 345.01, p < 0.05; Fig. 4, right; Suppl. Table S28). Under an overall cool temperature, the divergence between early and late stocks increased by ~1 h with increasing amplitudes of temperature cycles (Fig. 4, right). On the other hand, the divergence significantly reduced by ~2.5 h with increasing amplitude of temperature cycles under an overall warm temperature environment (Fig. 4, right).
Although earlier work from our laboratory showed that chronotype divergence enhances when presented simultaneously with both LD and TC cycles (Nikhil et al., 2014), we show here that (1) divergence increases depending on the overall temperature regime, (2) a change in entrained phase that contributes to divergence is affected at amplitudes of temperature cycles as low as 3 °C and (3) this difference in divergence is brought about only by the late chronotypes’ responses to different temperature regimes. These results, along with results under constant 19 °C and 28 °C ambient temperature, are suggestive of the fact that the late chronotypes have evolved enhanced temperature responsiveness in response to selection on timing of behavior under light cycles, perhaps via the change in their circadian clock structure/properties that is responsible for temperature sensing/entrainment. This, we speculate, may allow the late populations to restrict emergence to favorable times of the day by tracking temperature cycles, even in the presence of standard LD cycles. In addition, our results suggest the evolution of attenuated temperature sensitivity in the early populations, at least in the presence of LD cycles.
Discussion
While studies have been performed to understand the association between circadian clock properties and chronotype regulation and divergence, barring Nikhil et al. (2014), these studies have probed circadian clock properties using only 1 zeitgeber at a time (Bordyugov et al., 2015; Granada et al., 2013; Nikhil, Vaze, et al., 2016). Moreover, these studies have not explicitly attempted to understand the relative roles of light- and temperature-sensitive components of the circadian clock network in mediating chronotype divergence. In view of these observations and to understand the contributions of mean environmental temperature, amplitude of temperature cycles and temperature-sensitive modalities of the clock to chronotype divergence in a realistic environmental regime, we assayed the eclosion rhythm of early, control and late stocks under different temperature regimes in the presence of standard LD cycles.
We found that (1) phases of early populations are fairly robust and do not change much under different temperature regimes (Figs. 1-3), (2) phases of late populations appear to be more flexible and change readily (Figs. 1-3) and (3) as a consequence, chronotype divergence is different under different temperature regimes (Fig. 4). In our experiments, under overall cool TC cycles, the highest temperature reached was 22 °C, whereas the minimum was 16 °C, and under warm temperature TC cycles, while the highest temperature was 31 °C, the lowest was 25 °C. We think that the late populations delay their phase to avoid eclosing at times of the day when the temperature is too low and thereby enhance chronotype divergence under cool mean temperatures, and on the other hand, they advance their phase to avoid eclosing at times of the day when the temperature is too high and reduce chronotype divergence under warm mean temperatures. Moreover, we also find that while ΨPEAK and ΨCoM behave similarly, they differ from ΨONSET and ΨOFFSET in terms of their response, suggesting differential functional constraints on each phase marker (Figs. 1b, 2b, 3b; discussed later).
Why Are Timing of Eclosion and Temperature Responsiveness Associated? Reflections on How the Circadian Timekeeper Is Wired
Circadian programs are believed to have evolved in response to the complex “time structure of the environment” (Daan, 1981). This implies that behavioural routines, to enhance fitness in organisms, would require, in addition to a timekeeping device, adaptation at multiple levels that enabled individuals to capitalize on a specific temporal niche. For instance, adopting diurnality as a strategy would require adaptations to enable vision and/or to avoid desiccation in insects with thin integuments under high temperatures during the day as opposed to nocturnality (see Daan, 1981, and references therein).
We believe that evidence of co-evolution of traits from experimental evolution studies such as ours significantly enhances our understanding of what adaptations accompany the evolution of a different timing of behaviors. Despite selection acting on these populations under a constant temperature of 25 °C, enhanced sensitivity to temperature evolved in late populations and attenuated sensitivity evolved in the early populations, implying a genetic correlation between timing of eclosion and temperature sensitivity of the clock. A few previous studies have also shown a relationship between timing of eclosion and temperature sensitivity, albeit not in a similar way as ours. Kureck (1979) showed that midges (Chironomus thummi, Diptera) in cold water emerge during the early hours of the afternoon, but midges in warm water emerge only after dusk. Another study performed on the zygaenid moth (Pseudopidorus fasciata, Lepidoptera) showed that under natural conditions, these moths eclose predominantly during midday, and in the laboratory, their eclosion rhythm phase advances under warm temperature, in a manner somewhat similar to the behavior of our late populations (Fig. 3a; Wu et al., 2014). Such results strengthen our notion that the circadian network evolves as an ensemble, reflecting how it may have been shaped in the evolutionary past. There are other insect species that show eclosion predominantly in the evening or night, such as the flour moth and some chironomids (Saunders, 2002), but there is no specific information on the temperature sensitivity of their circadian clocks. Studies that probe into the temperature responses in these insects will prove to be a useful resource in understanding the relationship between temperature sensitivity and the timing of adult eclosion.
We think that it is crucial here to also ask why the early chronotypes do not seem to respond to such a wide range of temperature regimes, at least in the presence of LD cycles. One reason for this could be that there is inadvertent selection on the masking response to light in the early populations (see the Materials and Methods section). During our assays, we counted flies in 2-h intervals, and at the time point at which the lights turned on, we counted flies just before the transition. However, for the next time point, all flies that eclosed after lights turned on were counted; therefore, the large component of the number of flies that eclose in the time point after lights-on could be attributed to the masking response to this transition. Indeed, some preliminary results from our laboratory indicate that the early populations may have evolved a higher masking response (Arijit Ghosh and Vasu Sheeba, unpublished data). This may lead to a higher propensity of the early chronotypes to follow the dark-to-light transition and therefore be phase locked to dawn. Alternatively, the fact that the ΨENT of early populations is robust across different temperature regimes could imply that there is evolution of attenuated temperature responses in the early populations. There are some indications from prior studies in our laboratory that suggest early populations have enhanced light sensitivity compared with the late populations (Nikhil, Vaze, et al., 2016; Lakshman Abhilash and Vijay Kumar Sharma, unpublished data). Based on this result, one could speculate that there is perhaps a tradeoff between light sensitivity and temperature sensitivity of the circadian clock.
How Are the Late Chronotypes More Temperature Responsive?
From a Molecular Mechanism Perspective
The behavior of ΨENT of the late chronotypes under constant ambient temperatures is reminiscent of the behavior of the evening peak of activity/rest rhythms in D. melanogaster that phase delay under warm temperatures and advance under cool temperatures in an otherwise regular light/dark cycle (Helfrich-Förster, 2017; Majercak et al., 1999). We now know that cool and warm temperatures promote splicing of per (period) and tim (timeless), respectively. Moreover, we understand that full-length TIM has increased affinity toward CRY and therefore will promote earlier degradation of TIM. While cool temperatures lead to faster accumulation of per mRNA and reduced splicing of tim, and such conditions phase advance the activity/rest rhythms, the opposite occurs under warm temperatures. It is thought that such temperature-sensitive splicing events in core clock genes contribute to different phases under a wide range of constant and cycling temperature cues (Helfrich-Förster, 2017; Montelli et al., 2015). Given similar behavior of the phase of the eclosion rhythm of late chronotypes in our experiments, we hypothesize that differential propensity to splice per and/or tim may have evolved to facilitate enhanced phase lability in the face of temperature changes in the late flies. More recently, other studies have also revealed the importance of splicing events in regulating period and phase of the circadian rhythms and also entrainment under different temperature regimes (Evantal et al., 2018; Foley et al., 2018; Shakhmantsir et al., 2018), thereby providing substrate for our hypothesis that phase lability could be driven by changes in these intracellular mechanisms. However, it is important to note that it is not possible to directly comment on the exact role these mechanisms will have on phase lability of the eclosion rhythm without first establishing that differential splicing events may indeed regulate phases of the eclosion rhythm under different temperatures. Nevertheless, we feel that this is an open question and merits further investigation.
From an Organizational Perspective
Many studies on moths and Drosophila have indicated that adult eclosion timing is regulated by 2 processes, namely the developmental stage and the circadian clock (Newby and Jackson, 1991; Pittendrigh and Skopik, 1970; Qiu and Hardin, 1996). Subsequently, work in D. melanogaster has shown that the prothoracic gland (PG) has a self-sustained oscillation of PER and TIM, suggesting the presence of a second “clock” that is regulated by the central brain clock, thereby yielding physiological correlates of Pittendrigh’s A-B oscillator model (Emery et al., 1997; Morioka et al., 2012; Myers et al., 2003). More recently, Selcho et al. (2017) showed that the small ventral lateral neurons communicate timing information via the inhibitory Drosophila short neuropeptide F, which acts on the prothoracicotropic hormone (PTTH) neurons, which then relay this information to the PG clock. This information inhibits steroidogenesis, and the ecdysone titers drop below the threshold, which then leads to the commitment to emerge in the next available “gate.” Owing to the fact that the B-oscillator must be temperature sensitive to facilitate optimal phasing and temperature entrainment, we think that phases of processes downstream of the ventral lateral neurons, such as PTTH neurons’ sensitivity to short neuropeptide F or the period of the PG clock, are what have changed in the late chronotypes, thereby yielding flexible ΨENT. It is also possible that the changes in the PG clock in response to a variety of temperatures may render it more or less susceptible to temporal signals coming from the PTTH neurons. Although this is speculative, the circuitry downstream of the small ventral lateral neurons provides putative targets for further experiments to understand the mechanisms by which ΨENT of the late chronotypes is made highly flexible.
From a Theoretical Perspective
One can understand high phase lability in the late populations using either the slope of the temperature pulse PRC (Pittendrigh and Daan, 1976) or the amplitude model of limit-cycle oscillators (Lakin-Thomas et al., 1991). Although abstract, the limit-cycle model postulates that the amplitude of the limit cycle shrinks and expands under cool and warm temperatures, respectively, to maintain the periodicity of the circadian timekeeper, and this model has been validated in phase-response–based studies performed in Neurospora and Drosophila (Lakin-Thomas et al., 1991; Ruoff et al., 1999; Varma et al., 2013). In addition, the slope of the PRC contributes a great deal to the flexibility of ΨENT (Pittendrigh and Daan, 1976). Our results suggest that the high lability of phases in the late populations may stem from the larger amplitude of the PRC or higher sensitivity of the amplitude of the limit-cycle state variable to temperature, thereby yielding testable predictions for future experiments.
We integrated these mechanisms at different organizational levels into a speculative model for clarity and refer the reader to Supplementary Figure S29.
On the Differential Response of Different Phase Markers to Temperature Regimes
The importance of the choice of phase marker is highlighted by studies that showed opposite effects of light intensity on the precision of phases of the onset and offset of activity (Aschoff et al., 1971). Hence, we used multiple phase markers in our experiments to analyze the overall response of rhythms to different temperature regimes. In all of our experiments, different phase markers responded to different extents, either in the same direction or in the opposite direction (see Figs. 1b, 2b, and 3b). This pattern of differential response of phase markers suggests that optimal phasing and gating of the eclosion rhythm is brought about by the modulation of different phase markers, such that most eclosion happens around “favorable” times of the day.
In summary, we argue that low and high flexibility in the ΨENT of the early and late chronotypes, respectively, are perhaps a result of the genetic correlation between temperature responsiveness and timing of behavior. In addition, regulation of flexibility in ΨENT in our populations can occur at different levels of biological organization, which may be explored in future studies.
Supplemental Material
Abhilashetal_eclosion_temperature_SOM_revision2_15082019_1 – Supplemental material for Selection for Timing of Eclosion Results in Co-evolution of Temperature Responsiveness in Drosophila melanogaster
Supplemental material, Abhilashetal_eclosion_temperature_SOM_revision2_15082019_1 for Selection for Timing of Eclosion Results in Co-evolution of Temperature Responsiveness in Drosophila melanogaster by Lakshman Abhilash, Arijit Ghosh and Vasu Sheeba in Journal of Biological Rhythms
Footnotes
Acknowledgements
We are very grateful to late Professor Vijay Kumar Sharma for providing us with a beautiful model system to address such questions regarding phase of entrainment and circadian clock properties that may underlie such changes and for a wonderful work environment that enabled us to undertake this study. We thank K. L. Nikhil, Vishwanath Varma, 2 anonymous reviewers and the editor for carefully reading our article and suggesting some very useful changes. The authors also thank Saheli Roy for sharing the environmental light and temperature data that were recorded inside the incubator. We would also like to acknowledge financial support from the Science and Engineering Research Board, New Delhi, to Vijay Kumar Sharma (EMR/2014/001188); intramural funding from Jawaharlal Nehru Centre for Advanced Scientific Research (JNCASR), Bangalore; and the Council of Scientific & Industrial Research (CSIR), New Delhi, India, for a fellowship to A.G. and consumable grant from the Department of Biotechnology (DBT), Government of India, to V.S. (BT/INF/22/SP27679/2018).
Conflict of Interest Statement
The authors have no potential conflicts of interest with respect to the research, authorship, and/or publication of this article.
Notes
References
Supplementary Material
Please find the following supplemental material available below.
For Open Access articles published under a Creative Commons License, all supplemental material carries the same license as the article it is associated with.
For non-Open Access articles published, all supplemental material carries a non-exclusive license, and permission requests for re-use of supplemental material or any part of supplemental material shall be sent directly to the copyright owner as specified in the copyright notice associated with the article.