
Abstract
Although association of circadian clock properties with the timing of rhythmic behaviors (chronotype) has been extensively documented over several decades, recent studies on mice and Drosophila have failed to observe such associations. In addition, studies on human populations that examined effects of clock gene mutations/polymorphisms on chronotypes have revealed disparate and often contradictory results, thereby highlighting the need for a suitable model organism to study circadian clocks’ role in chronotype regulation, the lack of which has hindered exploration of the underlying molecular-genetic bases. We used a laboratory selection approach to raise populations of Drosophila melanogaster that emerge in the morning (early) or in the evening (late), and over 14 years of continued selection, we report clear divergence of their circadian phenotypes. We also assessed the molecular correlates of early and late emergence chronotypes and report significant divergence in transcriptional regulation, including the mean phase, amplitude and levels of period (per), timeless (tim), clock (clk) and vrille (vri) messenger RNA (mRNA) expression. Corroborating some of the previously reported light-sensitivity and oscillator network coupling differences between the early and the late populations, we also report differences in mRNA expression of the circadian photoreceptor cryptochrome (cry) and in the mean phase, amplitude and levels of the neuropeptide pigment-dispersing factor (PDF). These results provide the first-ever direct evidence for divergent evolution of molecular circadian clocks in response to selection imposed on an overt rhythmic behavior and highlight early and late populations as potential models for chronotype studies by providing a preliminary groundwork for further exploration of molecular-genetic correlates underlying circadian clock-chronotype association.
Circadian clocks time rhythmic behaviors in consultation with environmental (zeitgeber) cycles by establishing a stable and reproducible phase relationship (ψent), a trait known to vary considerably across species spanning invertebrates to humans (Aschoff and Pohl, 1978). Such variation in ψent is also observed across conspecific individuals, a well-known example of which is the variation for preferred sleep-wake timing in humans (termed as chronotypes; Roenneberg, 2012). Chronotypes are found to be associated with circadian clock period (τ) such that early chronotypes have shorter and late chronotypes longer τ (Duffy et al., 1999; Roenneberg, 2012). Such τ-ψent associations have been observed in a wide variety of species (Aschoff and Pohl, 1978), thus highlighting its evolutionarily conserved nature.
While it is encouraging that recent studies have proposed the use of mouse models for examining circadian clock–chronotype associations (reviewed in Pfeffer et al., 2015a), such models do not conform to the widely observed τ-ψent associations. For instance, in Wisor et al. (2007), mice that exhibited early chronotypes did not have shorter τ. Similarly, cry1 and cry2 knockout (KO) mice, despite having large differences in τ, did not show chronotype divergence (Spoelstra et al., 2004). In yet another study (Pfeffer et al., 2015b), it was reported that bmal KO mice resembled the late chronotypes but were arrhythmic under constant darkness (DD). In a recent study on inbred strains of Drosophila (DGRP), large-scale differences in transcriptional landscapes were reported between the strains exhibiting early and late emergence chronotypes (Pegoraro et al., 2015). Surprisingly, contrary to the widely reported circadian clock–chronotype associations, the authors did not report differences in the expression of any of the circadian genes. While these results raise serious doubts regarding the role of circadian clocks in the regulation of chronotype, it is also important to note that in several of these studies (Pegoraro et al., 2015; Spoelstra et al., 2004; Wisor et al., 2007), individuals exhibiting early and late chronotypes were derived from genetically different strains and therefore were of different genetic background, which is known to considerably modify circadian behaviors (Shimomura et al., 2001; Bittman, 2012, and citations therein). Furthermore, some of the mice strains were also deficient in one or more core circadian genes, an unlikely scenario in natural populations. In addition, since in many cases the strains were highly inbred (Spoelstra et al., 2004; Pegoraro et al., 2015; Pfeffer et al., 2015b) and therefore lacked genetic variation, they do not mirror natural populations, which are likely to be outbred and harbor large genetic variation (reviewed in Ellegren and Sheldon, 2008). Therefore, inferences drawn regarding the molecular-genetic bases of circadian clock–chronotype associations from such studies cannot be generalized.
With an intention to study the circadian clock properties underlying ψent variation, we initiated a long-term study wherein 4 populations each of the early (selected for emergence early in the morning) and the late (selected for emergence late in the evening) populations were raised by imposing artificial selection on 4 large (~1200 individuals each) control populations of D. melanogaster. The use of replicate, large populations would negate the possibility of the observed phenotypes arising due to random genetic drift and is likely to ensure maintenance of large genetic variation mirroring natural populations. In a previous study (Kumar et al., 2007), we had shown that at generation 55, the populations had diverged from each other such that they exhibited relatively higher emergence in the morning (the early emergence chronotype) or in the evening (the late emergence chronotype), and in addition, the early and the late populations evolved shorter and longer τ respectively, for both adult emergence and activity/rest rhythms, which is in agreement with the τ-ψent associations discussed earlier. Over the years, we have documented evolutionary divergence in several circadian clock properties such as photic phase response curves (PRCs) for both emergence and activity/rest rhythms, temporal light sensitivity, accuracy of entrainment, and circadian network coupling between the 2 populations (Kumar et al., 2007; Vaze et al., 2012; Nikhil et al., 2015a, b). These results strongly suggest that in addition to evolving divergent core circadian oscillators, the early and the late populations have also evolved differences in input and output pathways. In this study, we intended to explore molecular correlates of chronotype differences in the early and the late populations, and studied messenger RNA (mRNA) expression profiles of some of the core circadian genes—period (per), timeless (tim), and clock (clk). We also assessed mRNA profiles of cryptochrome (cry) and vrille (vri), which can be broadly classified as clock input and output components (reviewed in Hardin, 2011). Furthermore, in light of earlier studies suggesting the evolution of a weakly coupled circadian oscillator network in the late populations (discussed in Nikhil et al., 2015b), we also examined expression of the neuropeptide pigment-dispersing factor (PDF), which is known to function as a coupling factor in the Drosophila circadian clock network (reviewed in Yoshii et al., 2012). Since the early and the late populations have continued to experience selection for over 250 generations (14 years), we reassessed their circadian phenotypes to be able to better correlate the observed molecular clock differences with the expectation that the divergent behavioral phenotypes would be reflected in divergence in molecular components as well.
Materials And Methods
Deriving Populations Exhibiting early and late Emergence Chronotypes
The D. melanogaster populations used in this study were derived in a long-term study by imposing selection for emergence during morning and evening hours. From 4 independent large outbreeding replicate “controlj” (j = 1 . . . 4) populations (henceforth referred to as blocks), we selected only those individuals that emerged in the morning between zeitgeber time (ZT) 21-01 (ZT00 is the time of lights-on under light/dark cycles comprising 12 h of light and 12 h of darkness) to form the “earlyi” (i = 1 . . . 4) populations and those that emerged in the evening between ZT09-13 to form the “latek” (k = 1 . . . 4) populations, and flies collected in the respective windows formed the breeding pool for the subsequent generation, which was then subjected to the same selection protocol. The 4 replicate blocks each of the early and the late were selected such that populations sharing a given subscript were derived from the control population bearing the same subscript. For instance, the early1 and the late1 populations were derived from the control1 population and similarly for the other 3 sets (early2-4 and late2-4), therefore constituting a total of 12 populations. The parental populations were provided with yeast paste–supplemented banana-jaggery (BJ) medium for 3 days, after which it was replaced with fresh BJ medium for ~5 h for the flies to oviposit on. Eggs laid in this duration were collected and seeded into glass vials with ~6 mL BJ medium at a density of ~300 eggs/vial. These vials were then transferred to a light regime–controlled cubicle maintained under LD12:12 at 25 °C and 75% ± 5% relative humidity. Following initiation of emergence, flies emerging in the “morning/early” and “evening/late” selection windows were collected for 4 consecutive days to form the early and the late populations respectively, while flies that emerged throughout the day for the same 4 days formed the control populations, which did not experience any selection pressure for timing of emergence. All populations were housed in Plexiglas cages of dimension 25 × 20 × 15 cm provided with ad libitum medium. To nullify effects of nongenetic factors on the observed phenotypes arising due to the nature of selection, all populations were relaxed from selection for 1 generation prior to the experiments. This was achieved by collecting flies that emerged throughout the day for 4 consecutive days from all populations similar to the control populations with no selection for timing of emergence imposed, and were termed standardized populations, the progeny of which were used for the experiments. All populations were maintained on a 21 day non-overlapping generation cycle and had experienced ~250 generations (~14 years) of selection during the time of this study.
Adult Emergence Behavior Assay
Adult emergence assay was performed on all 12 populations under 3 photoperiods: LD12:12, LD06:18 (winter type), and LD18:06 (summer type) at 25 °C with light intensity during the photophase maintained at ~70 lux. Approximately 300 eggs were collected and dispensed into 6 replicate vials (per population) containing BJ medium, and the vials were transferred to the respective light regime for the assay. From the start of emergence, flies emerging from each vial were recorded at 2h intervals for 4 days, and only vials in which at least 30 flies emerged every day were considered for analyses. The mean phase of entrained rhythm for each population was calculated as has been described previously (Nikhil et al., 2014). This is considered a more reliable measure of the phase of the emergence rhythm since it encompasses the overall emergence waveform as opposed to just the peak or onset of emergence.
An assay to estimate τ of the emergence rhythm was also performed similarly with the only exception that for the first 8 days after egg collection, all vials (n = 10 vials/population) were maintained under LD12:12 and then transferred to constant darkness (DD) for the next 6 days. The τ of the emergence rhythm was estimated using COSINOR analysis (modified from Refinetti et al., 2007) implemented on MATLAB. The proportion of flies emerging per day was used to fit cosine curves with varying amplitude and period, and the combination that yielded the best fit as assessed by minimum sum-of-squared differences between the expected and experimental data was chosen to compute τ of the rhythm. τ values were computed separately for each replicate vial of all 12 populations and then averaged to obtain the block means.
Activity/Rest Behavior Assay
Activity/rest assay was performed on 3 to 5 day old males (n = 32 per population) under the same set of light regimes as described for the emergence assay. Activity data from the first 7 days of recording were used to plot averaged activity profiles and to estimate the mean phase of entrained rhythm by circular statistics (described in the “Statistical Analyses” section). The mean phase of activity/rest rhythm was estimated the same way as that for the emergence rhythm, but since the daily activity profile of Drosophila is bimodal, a transformation referred to as “angle doubling” was performed as described in Zar (2009). The results were back-transformed and rescaled to 24 h. Data from flies recorded similarly in DD for 10 consecutive days were used to estimate τ of activity/rest rhythm using the chi-square periodogram. Data recording and analyses were performed using Drosophila Activity Monitors (TriKinetics, Waltham, MA) and Clocklab (Actimetrics, Wilmette, IL) respectively.
mRNA Extraction and Quantitative Real-Time Polymerase Chain Reaction
The progeny of standardized populations was collected and housed in Plexiglas cages under LD12:12 for 3 to 4 days post-emergence. On day 5, ~90 flies/block/population were collected and frozen every 2 h (starting at ZT00) across a 24 h day from all 12 populations, following which the 90 flies collected at every time point were randomly distributed into 3 extraction replicates (a total of 432 replicates for all 12 populations) with approximately equal number of males and females. The flies were decapitated using liquid nitrogen, and total mRNA from the isolated heads was extracted using TRIzol reagent (Invitrogen, Carlsbad, CA) as per the manufacturer’s instruction. Then, 1 µg total mRNA was treated with DNase I for the removal of genomic DNA accumulated during the extraction, and the DNAse-treated mRNA served as a template for first-strand complementary DNA (cDNA) synthesis using the Maxima first-strand cDNA synthesis kit (Fermentas, Waltham, MA). In total, 1 µL of this served as the template for quantitative real-time polymerase chain reaction (qRT-PCR) carried out in the StepOnePlus Real Time PCR system using SYBR Green Real-Time PCR master mix (ABI, Waltham, MA) with standard reaction conditions and primer-specific annealing temperatures. All extraction replicates were treated independently, and qRT-PCR reactions were set in triplicates from each of the 3 extraction replicates, therefore making a total of 1296 reactions per gene for all 12 populations. The same protocol was used to estimate fold-mRNA levels for the per, tim, clk, vri, and cry genes relative to the housekeeping gene rp49. Three to 5 primer sets were designed for every gene using NCBI Primer-BLAST with default parameter values barring amplicon size which was restricted to 150 bp. Annealing temperature and concentration of all the primer sets were optimized to ensure minimal primer dimer formation and nonspecific amplification, and only the primer sets (sequences provided in Suppl. Table S1) with amplification efficiency of >90% were selected.
Immunocytochemistry (ICC)
Five day old adult male flies were collected at each time point (every 2 h between ZT22-10 and at ZT14 and ZT18; n = 6-10 fly brains per time point), immediately dissected in cold phosphate-buffered saline (PBS), and fixed in 4% paraformaldehyde solution for 30 min. The fixed brains were then washed in 0.5% PBT (PBS with 0.5% Triton-X), blocked using blocking solution (10% horse serum in PBT) for 1 h at room temperature (RT) followed by 5 h at 4 °C, and incubated with anti-PDF antibody (generated by Nitabach et al., 2006) at 1:30,000 dilution for 24 h at 4 °C. This was followed by six 15 min washes in PBT and incubation with appropriate secondary antibody for 1 h at RT and 16 h at 4 °C. The brains were then washed similarly and mounted onto glass slides for imaging. Brains were imaged using an Observer.Z1Axio (Zeiss, Oberkochen, Germany) microscope, and staining intensity in the small ventrolateral neuron (sLNv) terminals was quantified using ImageJ (National Institutes of Health, Bethesda, MD). Intensity measurements were performed for each hemisphere separately and statistically analyzed by analysis of variance (ANOVA) to test for the effects of population and time point. Quantification and analysis of amplitude and average PDF expression levels were performed similar to that for amplitude and average mRNA expression of the core clock genes. However, unlike the mRNA expression experiments, which were performed on individuals collected separately from every replicate population, individuals for ICC experiments were collected from a pool of all 4 replicate populations for each of the 3 (early, control, and late) populations. Due to this reason, data from this experiment were bootstrapped (described in the “Statistical Analyses” section) to facilitate statistical comparisons. ICC staining intensity profiles plotted from the raw experimental data closely resembled the bootstrapped data.
Statistical Analyses
The mean phase and τ of emergence and activity/rest rhythms were estimated separately for all 12 populations and served as data for a mixed-model randomized block design ANOVA to test for statistically significant differences among populations. All post hoc comparisons were performed using Tukey’s honestly significant difference (HSD) test at a significance level at α = 0.05.
The threshold cycle (CT) values obtained by qRT-PCR were used to estimate fold-mRNA expression at a given time point relative to rp49 using the comparative CT method (Schmittgen and Livak, 2008). The mean phase of mRNA expression was also calculated similar to that for emergence and activity/rest rhythms. Prior to calculating the mean phase of expression, mRNA levels across the day were subjected to Rayleigh test (α = 0.05), the results of which would help reject the null hypothesis that “expression is randomly distributed across the day,” thus indicating that there is a mean directionality/phase of expression (Batschelet, 1981; Jammalamadaka and SenGupta, 2001; Zar, 2009). Following Rayleigh test, statistical differences in the mean phase of expression between the populations were tested by nonparametric test for dispersion (NPTD) (Batschelet, 1981) and Rao’s test for homogeneity (Jammalamadaka and SenGupta, 2001), as has been used to analyze mean phase of the emergence (Nikhil et al., 2014). To ensure that probability of the total family-wise error rate did not exceed α = 0.05, all pairwise comparisons for differences in the mean phase of expression were performed at α = 0.01 (99% confidence interval [CI]) following Bonferroni corrections.
In addition to the mean phase, we also estimated the amplitude and average mRNA expression levels. The amplitude of mRNA oscillation was calculated as the difference between the peak and trough mRNA levels, while the average mRNA level was calculated by averaging mRNA levels across the day. Both measures were calculated separately for each of the 12 populations and analyzed as described for the emergence rhythm.
For the analysis of PDF staining intensity data, since the individuals were pooled across 4 replicate populations, the data could not be subjected to a randomized block design ANOVA as used for all other experiments. Therefore, the staining intensity data were bootstrapped using the R statistical language platform (R Development Core Team, 2011) to obtain 500 replicate values that were drawn from the experimental data. The bootstrapped data were then used to statistically analyze the difference in the mean phase, amplitude and average levels of PDF expression across populations using factorial ANOVA at α = 0.01 (99% CI).
Calculation of the mean phase of expression, Rayleigh test, Rao test and NPTD was implemented on the R statistical language platform (R Development Core Team, 2011) using custom written codes with the aid of “CircStats” (Jammalamadaka and SenGupta, 2001) and “Circular” packages (Agostinelli and Lund, 2013), while ANOVA and Tukey’s HSD were implemented on Statistica (StatSoft, Tulsa, OK).
Results
Emergence Chronotypes of early and late Populations Persist Robustly under Different Photoperiods
As reported earlier (Kumar et al., 2007), emergence waveforms of early and late populations under LD12:12 differed such that the early populations exhibited advanced onset of emergence with higher morning emergence, the late populations exhibited a delayed onset and higher evening emergence, and the control populations exhibited an intermediate emergence pattern (Figure 1a, top panel). This is reflected in their mean phase of emergence, with the early (θe = 1.84 h) and the late (θl = 8.39 h) populations being significantly advanced and delayed, respectively, compared to the control (θc = 5.01 h) populations (F2, 6 = 193.92; p < 0.05; Figure 1a, bottom panel).
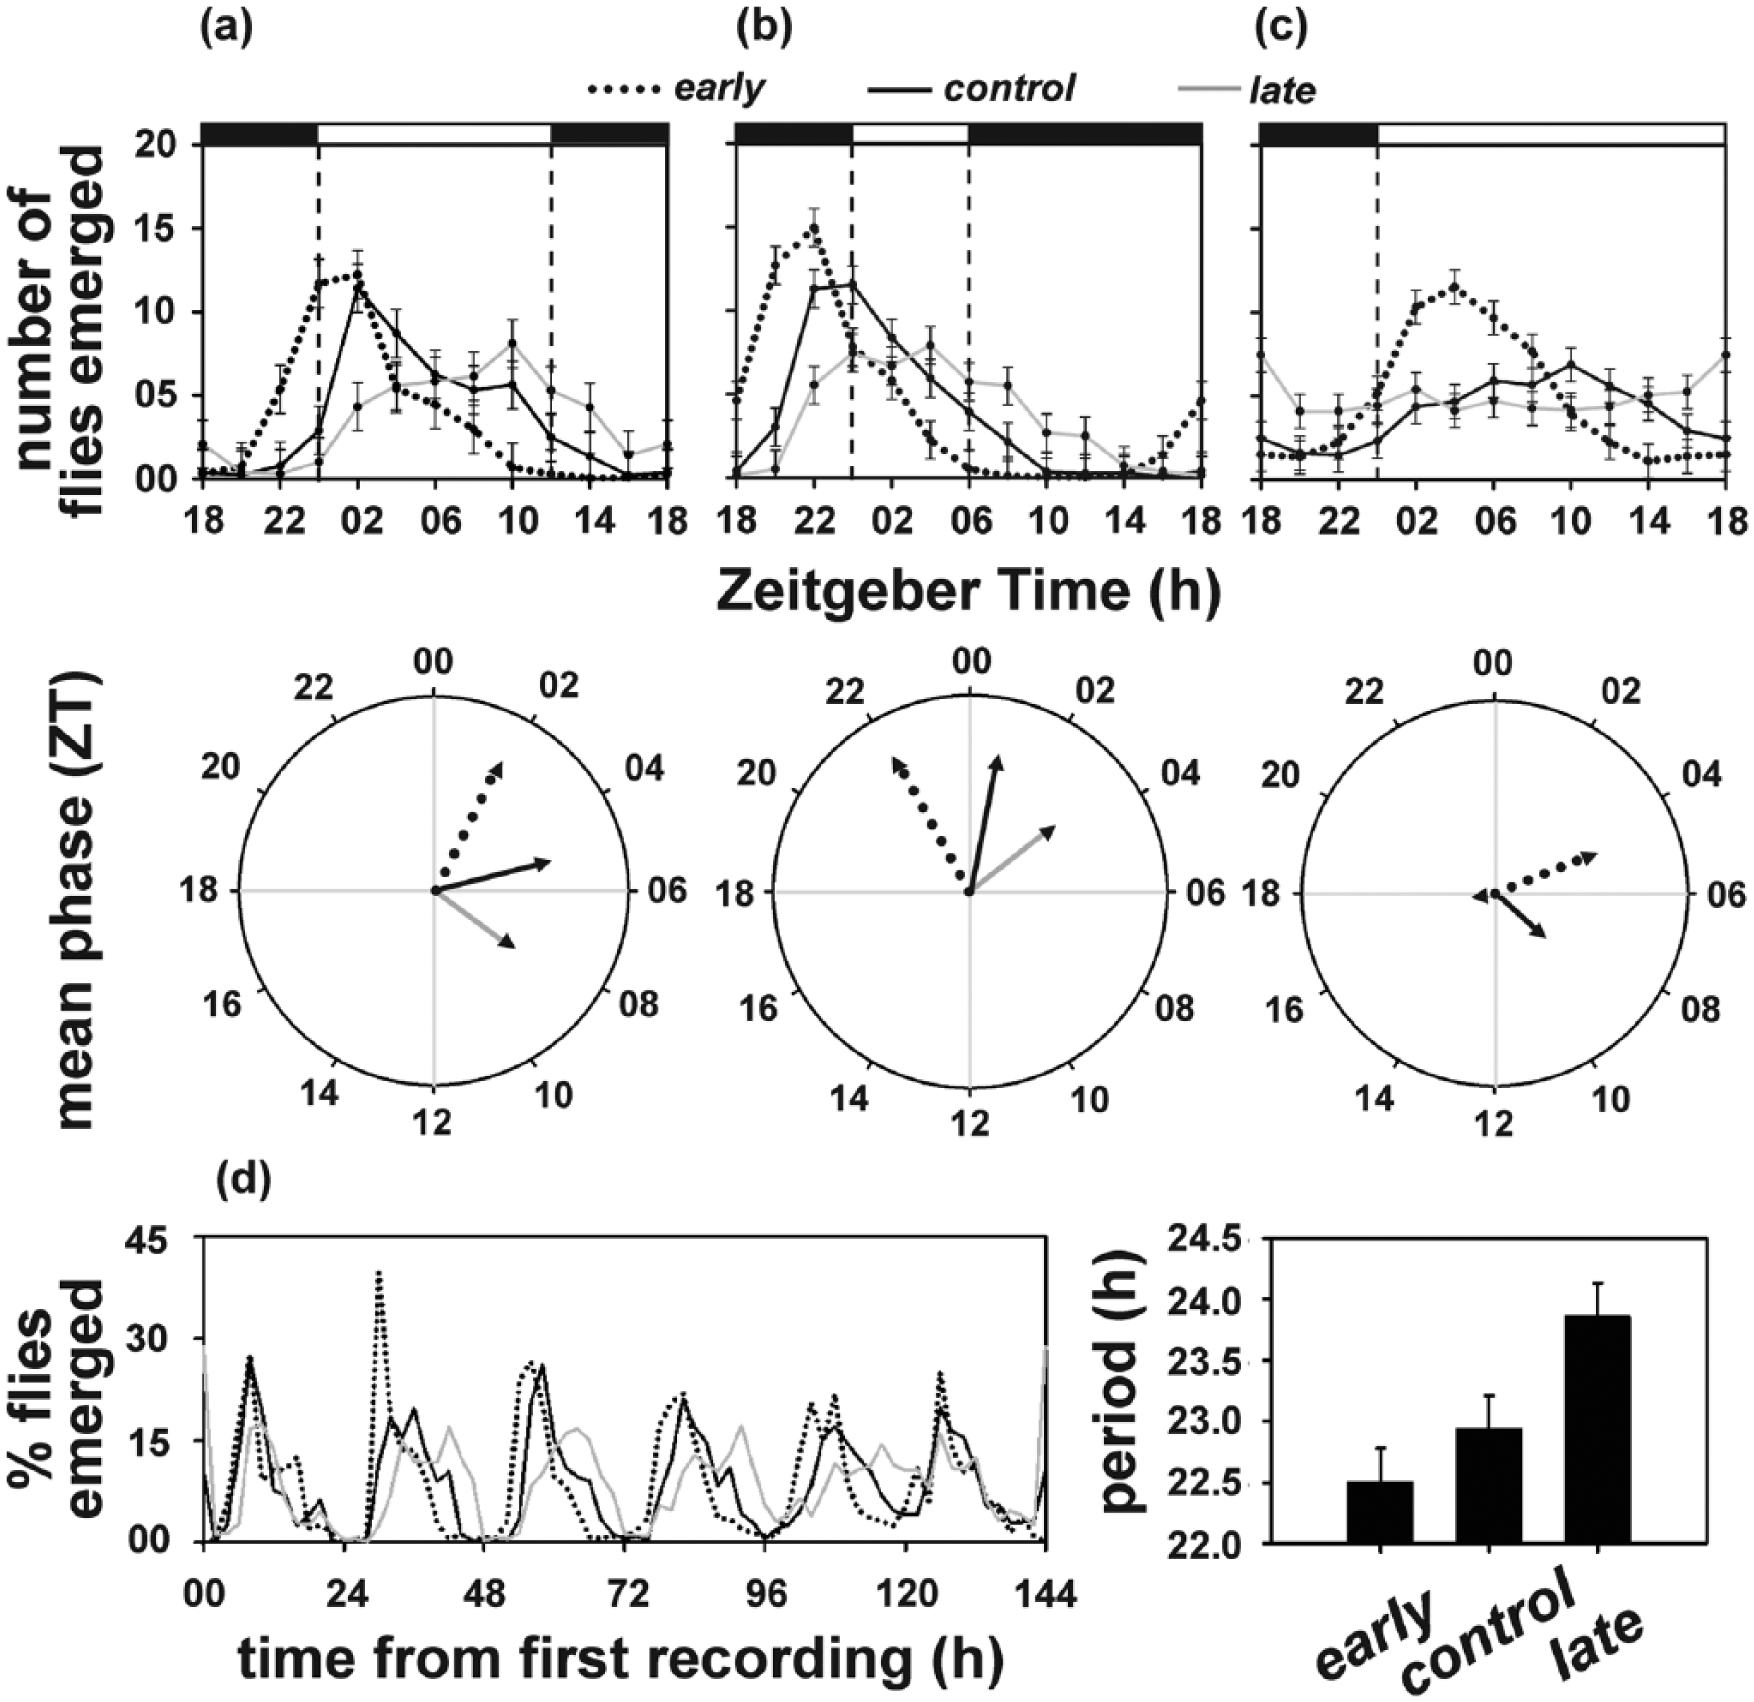
Adult emergence profiles (top panel) and mean phase of the emergence rhythm (bottom panel) of the early, control, and late populations under (a) LD12:12, (b) LD06:18, and (c) LD18:06. The shaded and unshaded regions represent dark and light phases, and dashed lines depict lights-on and lights-off. (d) Time series depicting adult emergence rhythm of all 3 populations under DD (left) and their respective circadian periods (right). Error bars depict 95% confidence interval calculated by Tukey’s honestly significant difference test following analysis of variance.
We further wished to test if the emergence chronotypes of the early and the late populations persist under winter-type (LD06:18) and summer-type (LD18:06) photoperiods. Under the winter-type photoperiod, the mean phase of emergence of the early populations was significantly advanced (θe = 21.98 h) and that of the late populations significantly delayed (θl = 3.48 h) compared to the control populations (θc = 0.77 h; F2, 6 = 10147.09; p < 0.05; Figure 1b). The emergence chronotypes of the 2 populations further diverged under the summer-type photoperiod, with the mean phase of emergence for the early (θe = 4.52 h), control (θc = 8.66 h), and late (θl = 17.60 h) populations being significantly different from each other (F2, 6 = 173.16; p < 0.05; Figure 1c).
Thus, the early and the late populations exhibit phase-advanced and phase-delayed emergence waveforms compared to the control populations, and this difference in timing of emergence robustly persists under winter- and summer-type photoperiods.
Period of the Emergence Rhythm Differs between early and late Populations
ANOVA on τ of the emergence rhythm revealed a statistically significant effect of “population” (F2, 6 = 30.10; p < 0.001), with the early (22.51 h) and the control (22.94 h) populations exhibiting significantly shorter τ compared to the late (23.86 h) populations (Figure 1d), while τ of early and control populations did not differ. Interestingly, we observed that the robustness of the emergence rhythm of the late populations diminished over time in DD, with the gate width of emergence increasing by day 4 and consequently, higher subjective nighttime emergence over days 5 to 6, leading to an apparent disruption of the emergence rhythm over time in DD (Figure 1d), which will be discussed later.
Thus, in agreement with the τ-ψent associations reported earlier, selection for early and late emergence chronotypes results in the coevolution of divergent τ of the emergence rhythm.
Activity/Rest Patterns of early and late Populations Differ under Different Photoperiods
Since common circadian oscillators have been attributed to regulate both emergence and activity/rest rhythms, we further wished to test if selection for divergent ψent of emergence has led to the coevolution of a divergent activity/rest rhythm.
When assayed under LD12:12, the mean phase of the activity/rest rhythm of the 3 populations (θe = 5.55 h, θc = 5.50 h, θl = 5.58 h) did not differ statistically (F2, 6 = 1.38; p > 0.05; Figure 2a). However, activity during the evening peak was significantly higher in the late populations compared to the early populations (Figure 2a, top panel).
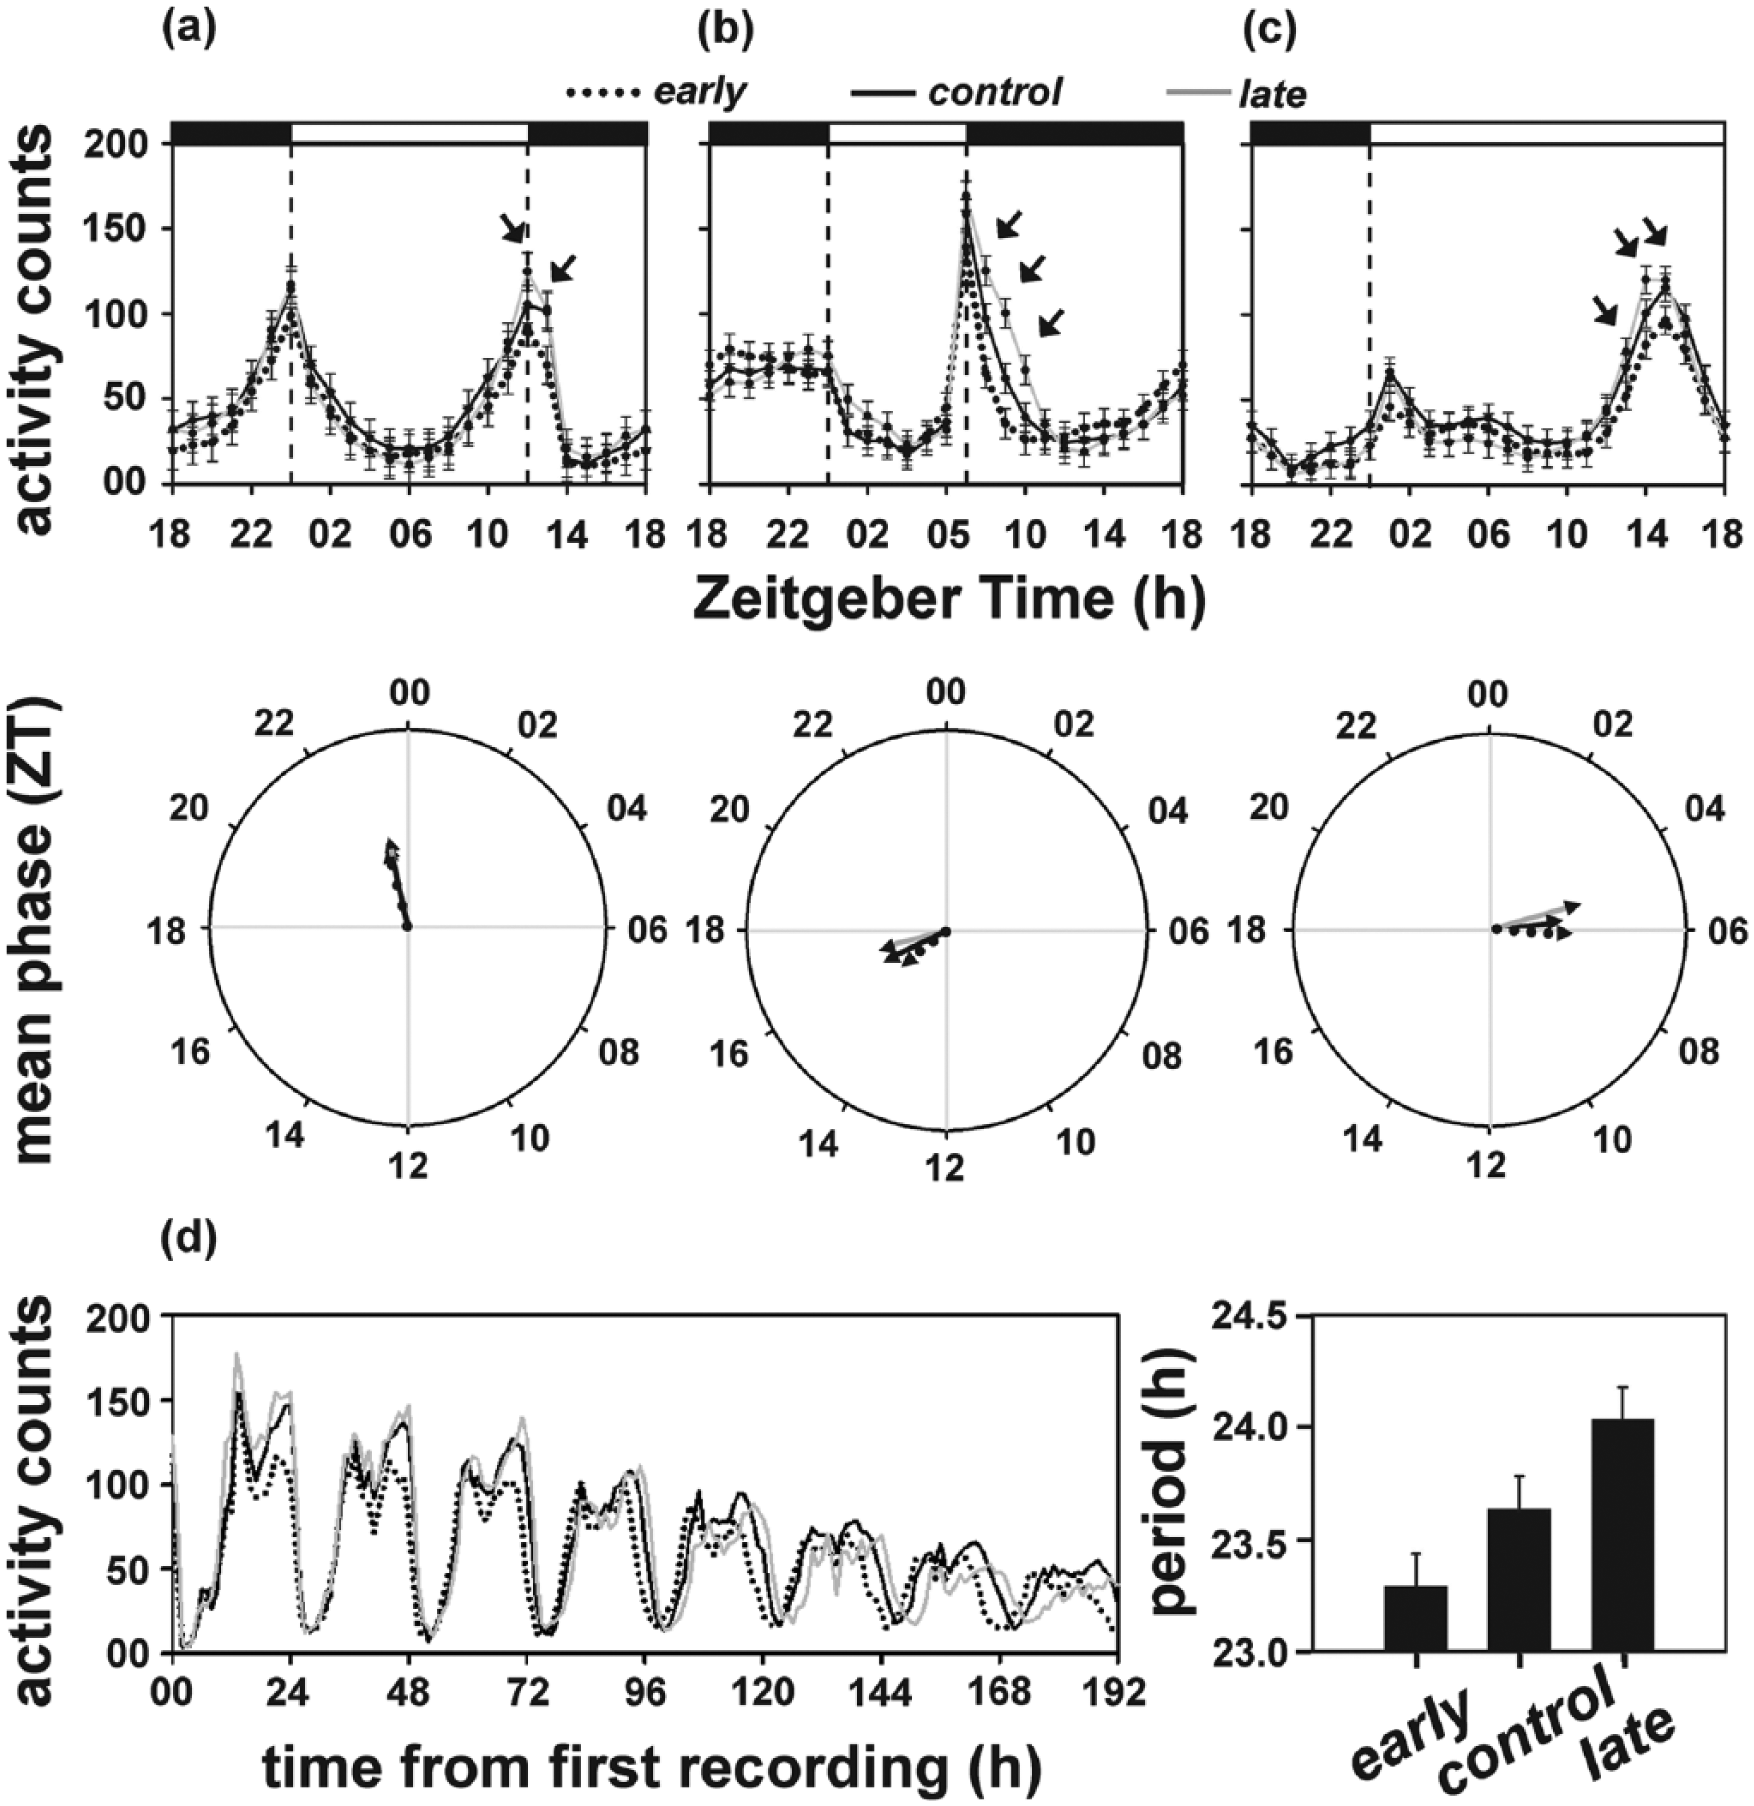
Average activity/rest profiles (top panel) and mean phase of activity/rest rhythm (bottom panel) of the early, control, and late populations under (a) LD12:12, (b) LD06:18, and (c) LD18:06. The arrows in panels (a) to (c) indicate significantly higher evening activity observed in the late populations compared to the early populations. (d) Time series depicting activity/rest rhythm of all 3 populations under DD (left) and their respective circadian periods (right). All other details are same as in Figure 1.
Under the winter-type photoperiod, the mean phase of the activity/rest rhythm differed statistically between the 3 populations, with the early populations (θe = 4.73 h) exhibiting a significantly advanced phase compared to the late populations (θc = 5.47 h), while that for the control populations (θc = 5.13 h) was intermediate (F2, 6 = 14.54; p < 0.05; Figure 2b). This probably is a consequence of advanced morning activity in the early populations, which was delayed in the late populations (Figure 2b, top panel). Activity around the evening peak was significantly higher in the late populations compared to the early populations (Figure 2b, top panel).
Interestingly, under the summer-type photoperiod, the mean phase of activity/rest rhythm for the late (θl = 17.47 h) populations was significantly advanced compared to the early populations (θe = 18.03 h), while that for the control (θc = 17.75 h) populations was intermediate (F2, 6 = 24.13; p < 0.05; Figure 2c, bottom panel). A closer examination of the activity profiles revealed that this surprising result stems from a marginally advanced evening peak in the late populations around the time when activity levels were significantly higher in the late populations (Figure 2c, top panel).
In summary, the mean phase of activity/rest rhythm of the early and the late populations differs significantly under winter- and summer-type photoperiods, but the evening peak of activity of the late populations was consistently higher than the early populations under all 3 photoperiods, the possible reasons of which will be discussed later.
Period of Activity/Rest Rhythm Differs between early and late Populations
ANOVA on τ of activity/rest rhythm revealed a statistically significant effect of “population” (F2, 6 = 29.71; p < 0.0001), with the early (23.28 h) populations exhibiting a significantly shorter τ compared to the control (23.63 h) populations, which in turn had a significantly shorter τ than the late (24.03 h) populations (Figure 2d; Suppl. Figure S1).
Thus, consistent with the difference in τ of emergence rhythm, selection for the early and the late emergence chronotypes results in the coevolution of divergent τ of activity/rest rhythm.
early and late Populations Differ in Phase and Level of per mRNA Expression
The per mRNA exhibited rhythmic expression in all 3 sets of populations, with relative mRNA levels in both the early and the control populations rising earlier than that in the late populations (Figure 3a, top panel). The mRNA levels in the early populations peaked at ZT14 followed by the control populations at ZT16 and then the late populations at ZT18 (Figure 3a, top panel; Suppl. Figure S2). Circular analysis revealed that with θl = 16.73 h, the mean phase of per mRNA expression in the late populations was significantly delayed by ~2.5 h compared to the early populations (θe = 14.50 h) and by ~1.5 h compared to the control (θe = 15.19 h) populations (Figure 3a, bottom panel; Suppl. Table S2), while the mean phase in the early and the control populations did not differ.
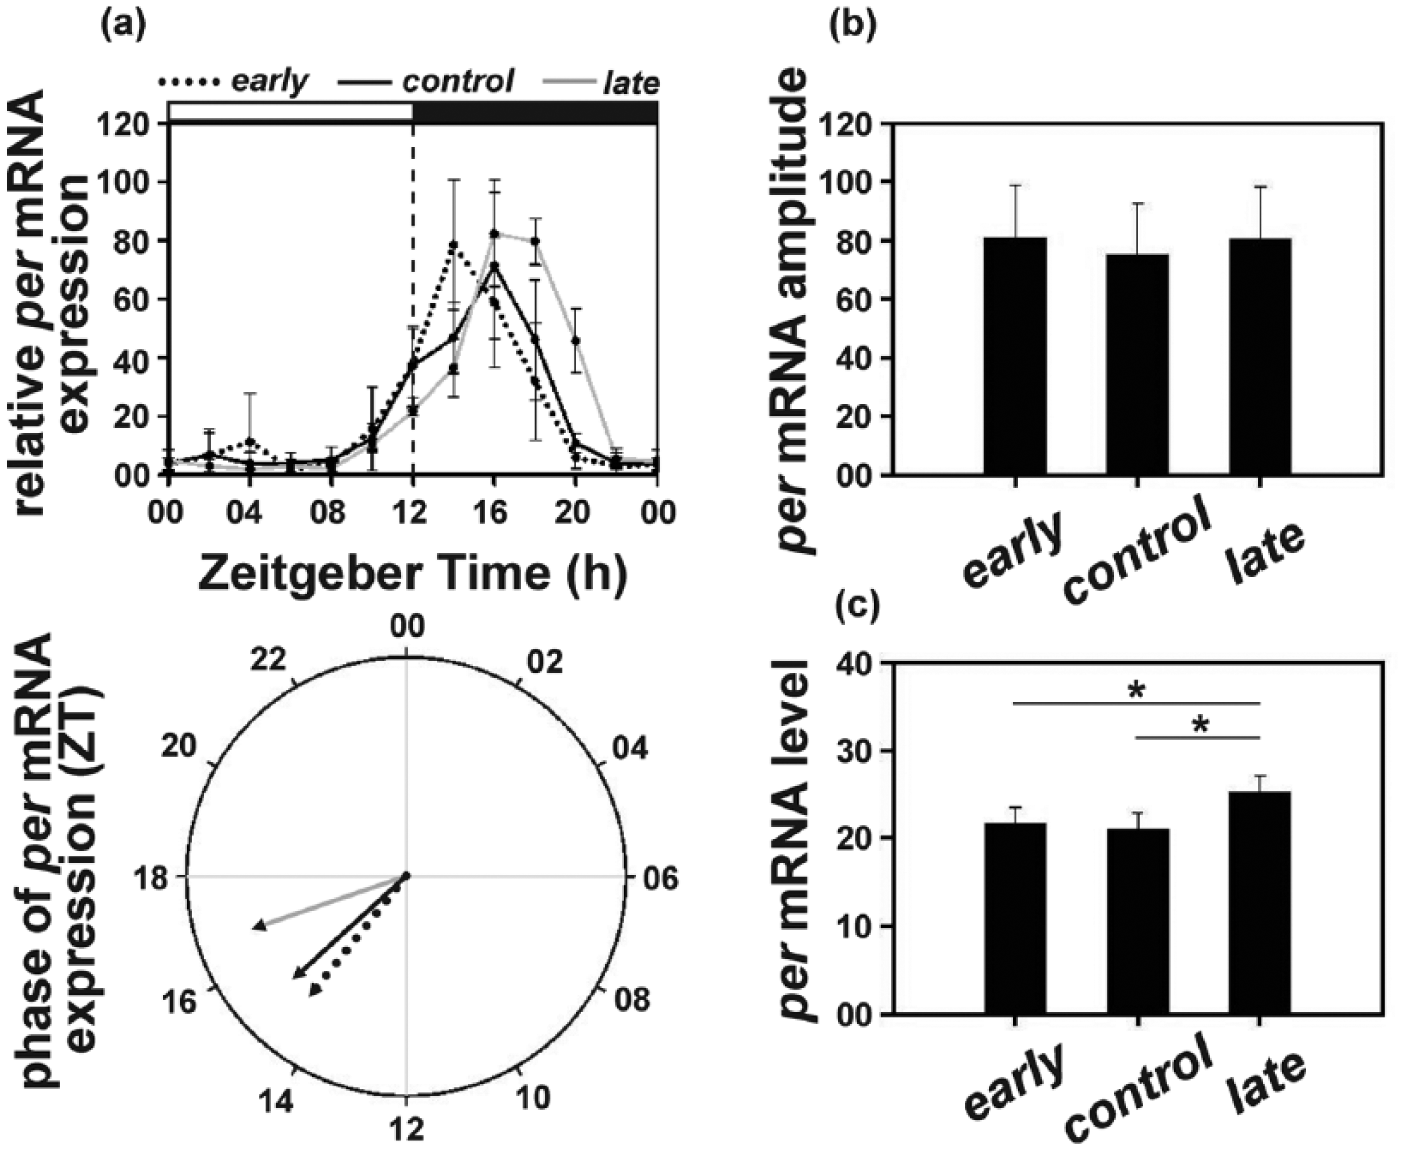
(a) Top panel: period (per) mRNA levels (relative to rp49) under LD12:12 in the early, control, and late populations across the day. Error bars depict SEM across the 4 replicate blocks. Bottom panel: the mean phase (in ZT) of per expression (relative to rp49) in the early (14.47 h), control (15.19 h), and late (16.73 h) populations. (b) Amplitude depicting difference between peak and trough and (c) average levels depicting mean per mRNA (relative to rp49) levels across the day in the early, control, and late populations. Asterisks (*) indicate statistically significant differences (p < 0.05). All other details are same as in Figure 1.
ANOVA on the amplitude of mRNA oscillation did not differ between the 3 populations (early = 80.98; control = 75.09; late = 80.51; F2, 6 = 0.61; p > 0.05; Figure 3b; Suppl. Table S2).
ANOVA on average mRNA levels revealed a statistically significant effect of “population” (F2, 6 = 6.87; p < 0.05) with the late (25.17) populations exhibiting ~16% higher levels compared to the early (21.55) and the control (21.01) populations, while the early and the control populations did not differ (Figure 3c; Suppl. Table S2).
early and late Populations Differ in Phase of tim mRNA Expression
The tim mRNA levels also exhibited an earlier increase as well as decrease in the early and the control populations compared to the late populations, with mRNA levels peaking at ZT14 and ZT16 in the early and the control populations while that in the late populations peaked at ZT18 (Figure 4a, top panel; Suppl. Figure S3). Accordingly, the mean phase of tim mRNA in the late populations (θl = 16.50 h) was significantly delayed by ~2.5 h compared to the early (θe = 14.08 h) and the control (θc = 14.35 h) populations, while the latter too did not differ (Figure 4a, bottom panel; Suppl. Table S3).
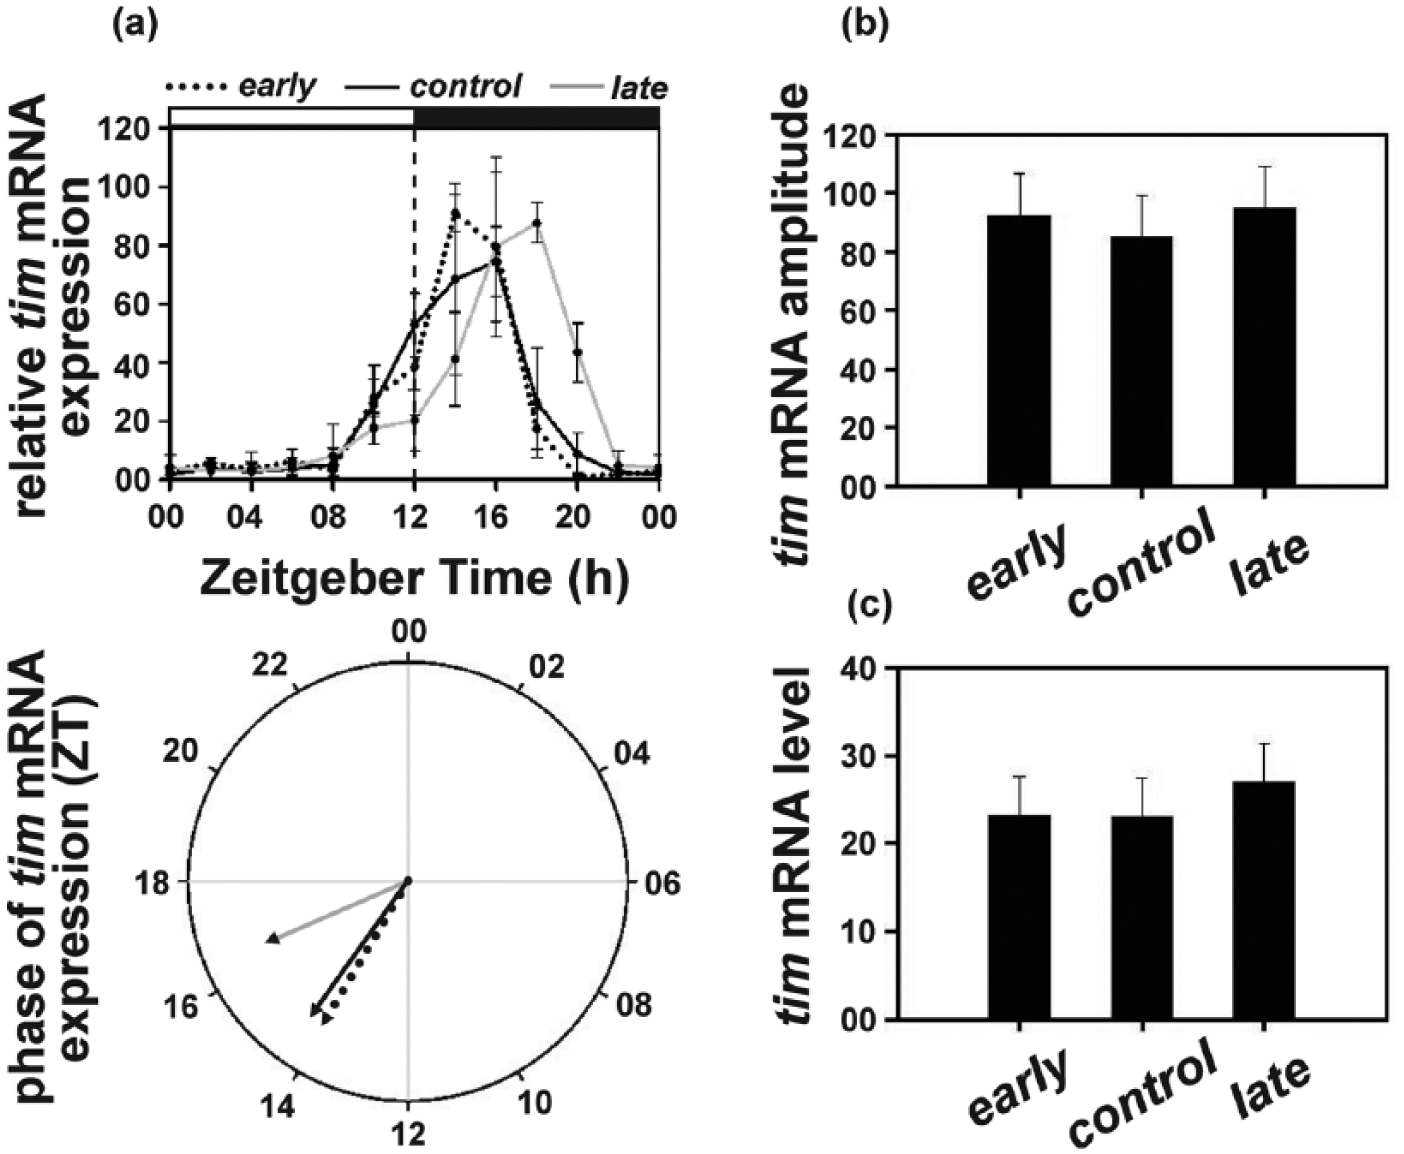
(a) Top panel: timeless (tim) mRNA levels (relative to rp49) under LD12:12 in the early, control, and late populations across the day. Error bars depict SEM across the 4 replicate blocks. Bottom panel: the mean phase (in ZT) of tim expression (relative to rp49) in the early (14.47 h), control (15.19 h), and late (16.73 h) populations. (b) Amplitude depicting difference between peak and trough and (c) average levels depicting mean tim mRNA (relative to rp49) levels across the day for the early, control, and the late populations. All other details are same as in Figure 1.
ANOVA revealed that the 3 populations did not differ in amplitude (early = 92.28; control = 85.13; late = 94.82; F2, 6 = 0.58; p > 0.05; Figure 4b; Suppl. Table S3) and average tim mRNA levels (early = 23.25; control = 23.04; late = 26.99; F2, 6 = 1.21; p > 0.05; Figure 4c; Suppl. Table S3).
early and late Populations Differ in Phase and Amplitude of clk mRNA Expression
The clk mRNA oscillation was antiphasic to that of per and tim, and showed an earlier increase in the early followed by the control and then the late populations. The peak of clk mRNA in the late populations occurred at ZT04, that is, 2 h after the control (ZT02) and 4 h after the early (ZT00) populations (Figure 5a, top panel; Suppl. Figure S4). Accordingly, the mean phase of clk mRNA oscillation in the late (θ = 4.23 h) populations was significantly delayed by ~2.5 h compared to the control and ~3.5 h compared to the early populations (Figure 5a, bottom panel; Suppl. Table S4).
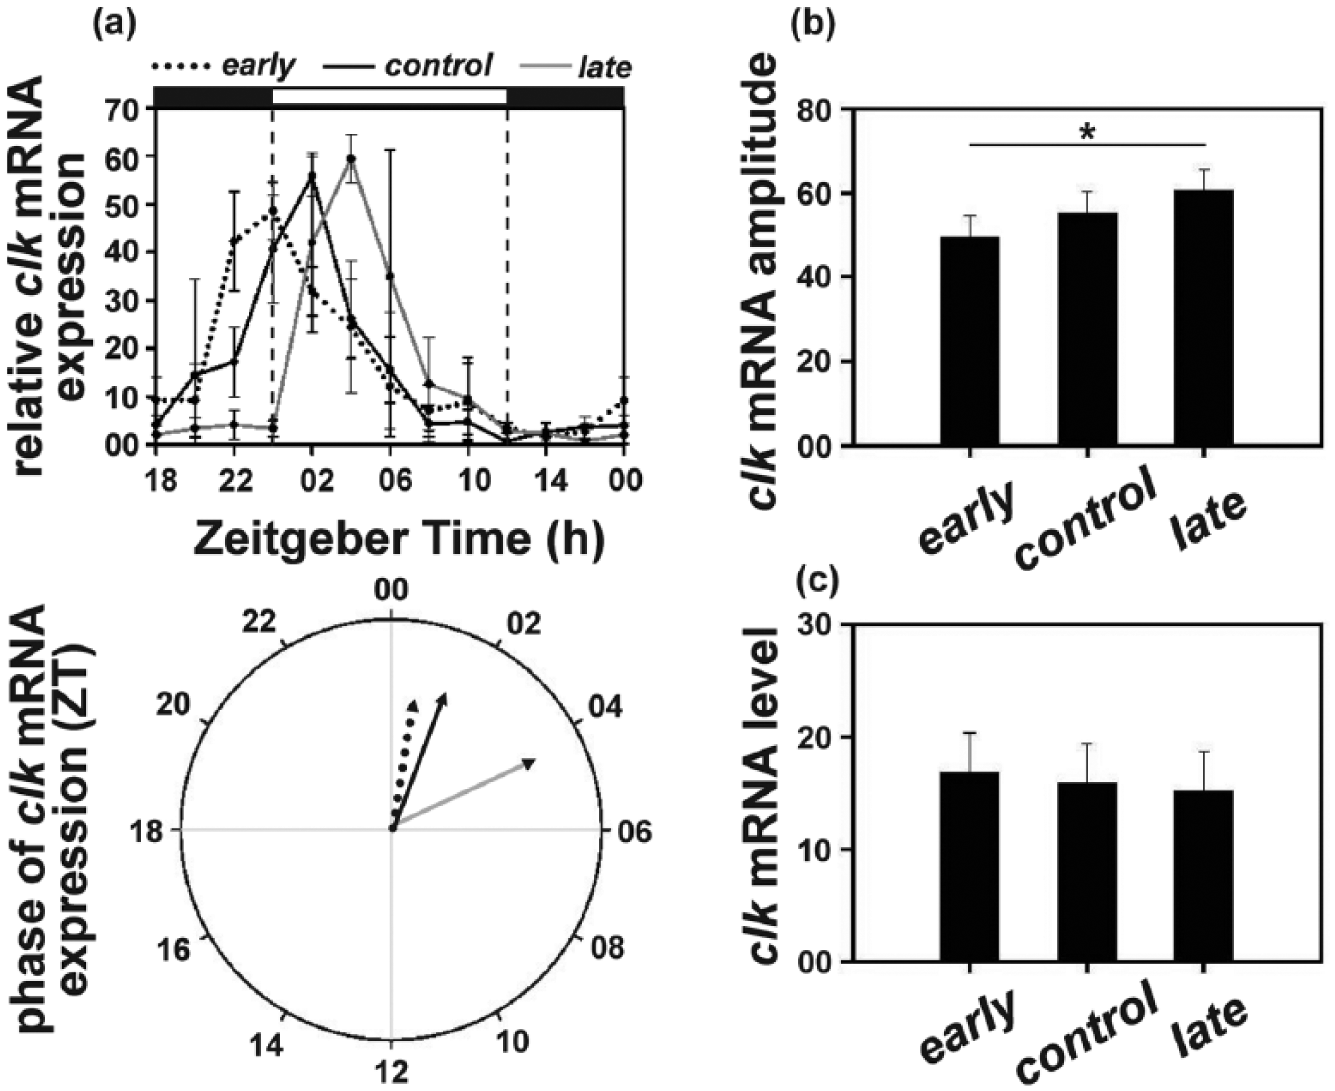
(a) Top panel: clock (clk) mRNA levels (relative to rp49) under LD12:12 in the early, control, and late populations across the day. Error bars depict SEM across the 4 replicate blocks. Bottom panel: the mean phase (in ZT) of clk expression (relative to rp49) in the early (14.47 h), control (15.19 h), and late (16.73 h) populations. (b) Amplitude depicting difference between peak and trough and (c) average levels depicting the mean clk mRNA (relative to rp49) levels across the day in the early, control, and late populations. Asterisks (*) indicate statistically significant differences (p < 0.05). All other details are same as in Figure 1.
ANOVA on the amplitude values revealed a statistically significant effect of “population” (F2, 6 = 5.84; p < 0.05). Post hoc multiple comparisons revealed that the late populations exhibited significantly higher amplitude clk mRNA oscillation (60.53) followed by the control (55.22) and then the early (49.50) populations (Figure 5b; Suppl. Table S4).
However, average clk mRNA levels did not differ between the 3 populations (early = 16.78; control = 15.82; late = 15.18; F2, 6 = 0.24; p > 0.05; Figure 5c; Suppl. Table S4).
early and late Populations Differ in Level and Amplitude of cry mRNA Expression
The cry mRNA levels remained high throughout the first half of the day, followed by a gradual decrease late in the evening and first half of the night. Therefore, no specific peak of expression could be detected, with all 3 populations exhibiting similar expression profiles (Figure 6a, top panel; Suppl. Figure S5). Consequently, the 3 populations (θe = 4.25 h; θc = 4.11 h; θl = 4.32 h) did not differ statistically in terms of the mean phase of cry mRNA oscillation (Figure 6a, bottom panel; Suppl. Table S5).
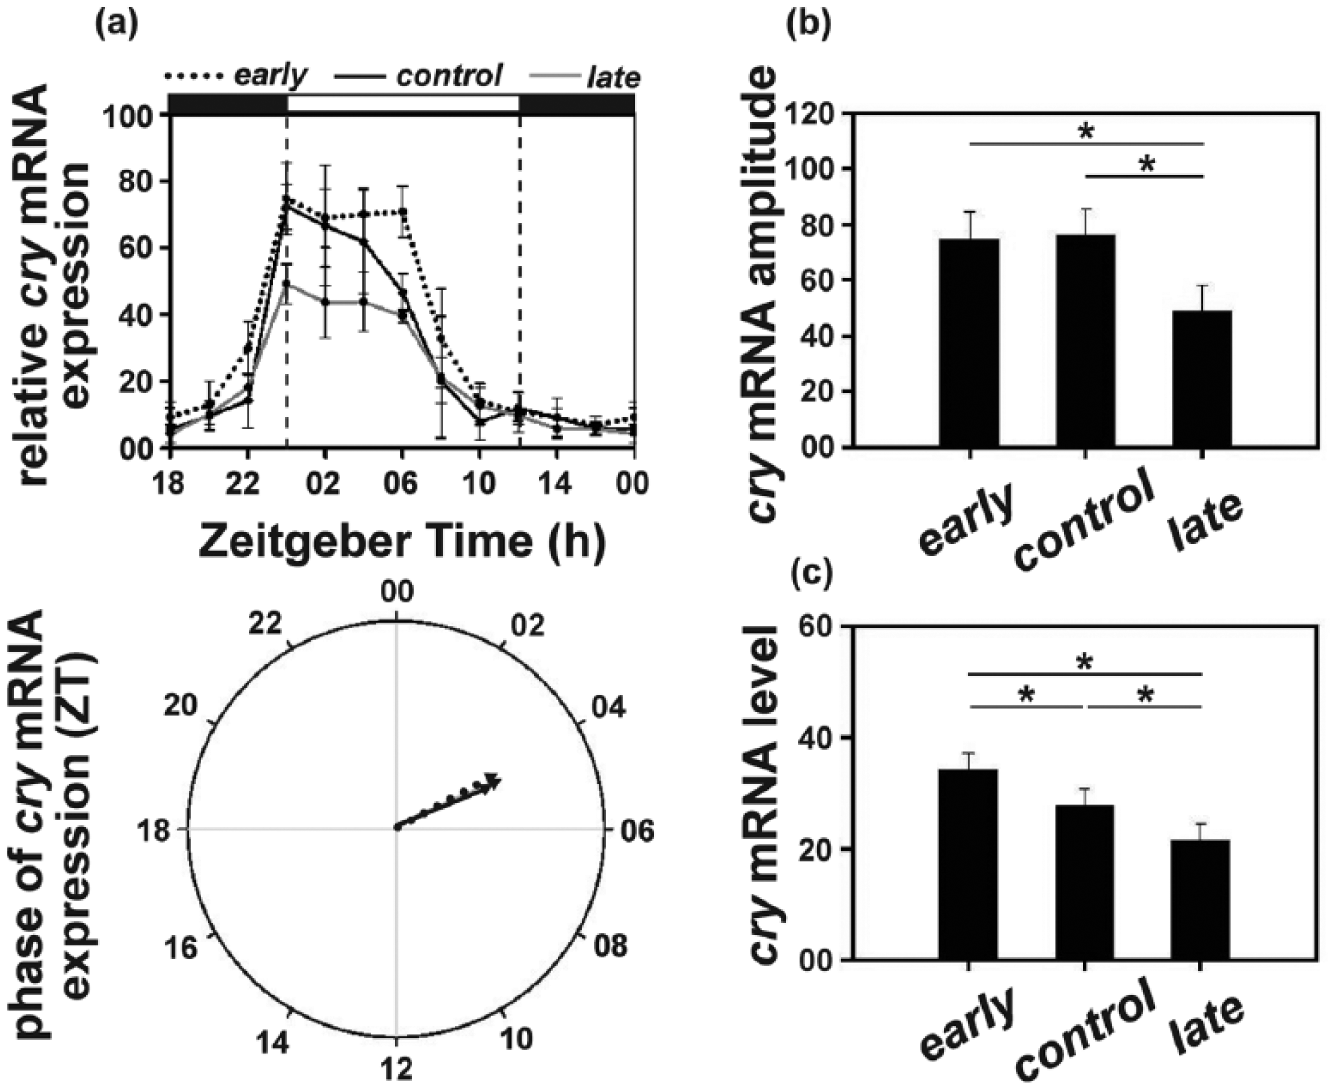
(a) Top panel: cryptochrome (cry) mRNA levels (relative to rp49) under LD12:12 in the early, control and late populations across the day. Error bars depict SEM across the 4 replicate blocks. Bottom panel: the mean phase (in ZT) of cry expression (relative to rp49) in the early (14.47 h), control (15.19 h), and late (16.73 h) populations. (b) Amplitude depicting difference between peak and trough and (c) average levels depicting mean cry mRNA (relative to rp49) levels across the day in the early, control, and late populations. Asterisks (*) indicate statistically significant differences (p < 0.05). All other details are same as in Figure 1.
ANOVA revealed a statistically significant effect of “population” for both amplitude (F2, 6 = 11.96; p < 0.05) and average cry mRNA levels (F2, 6 = 20.33; p < 0.05). The amplitude of cry mRNA in the late (48.62) populations was significantly lower compared to that of the other 2 populations (early = 74.99; control = 75.98; Figure 6b; Suppl. Table S5), while the early and the control populations did not differ. Additionally, the late (21.32) populations exhibited significantly attenuated (~35%) cry mRNA levels compared to both the early (34.14) and the control (27.60) populations, and its levels in the control populations were significantly lower than that in the early populations (Figure 6c; Suppl. Table S5).
early and late Populations Differ in Phase and Amplitude of vri mRNA Expression
The vri mRNA levels exhibited a trend similar to that of per and tim, with the levels remaining low during the day and peaking around the first half of the night. The peak of vri mRNA occurred at ZT12 for the early, at ZT14 for the control, and at ZT16 for the late populations (Figure 7a, top panel; Suppl. Figure S6). The phase of vri mRNA oscillation in the late populations was delayed by ~2.5 h (θl = 15.99 h) compared to that for the early (θe = 13.25 h) and by ~2 h compared to the control (θc = 13.83 h) populations (Figure 7a, bottom panel; Suppl. Table S6).
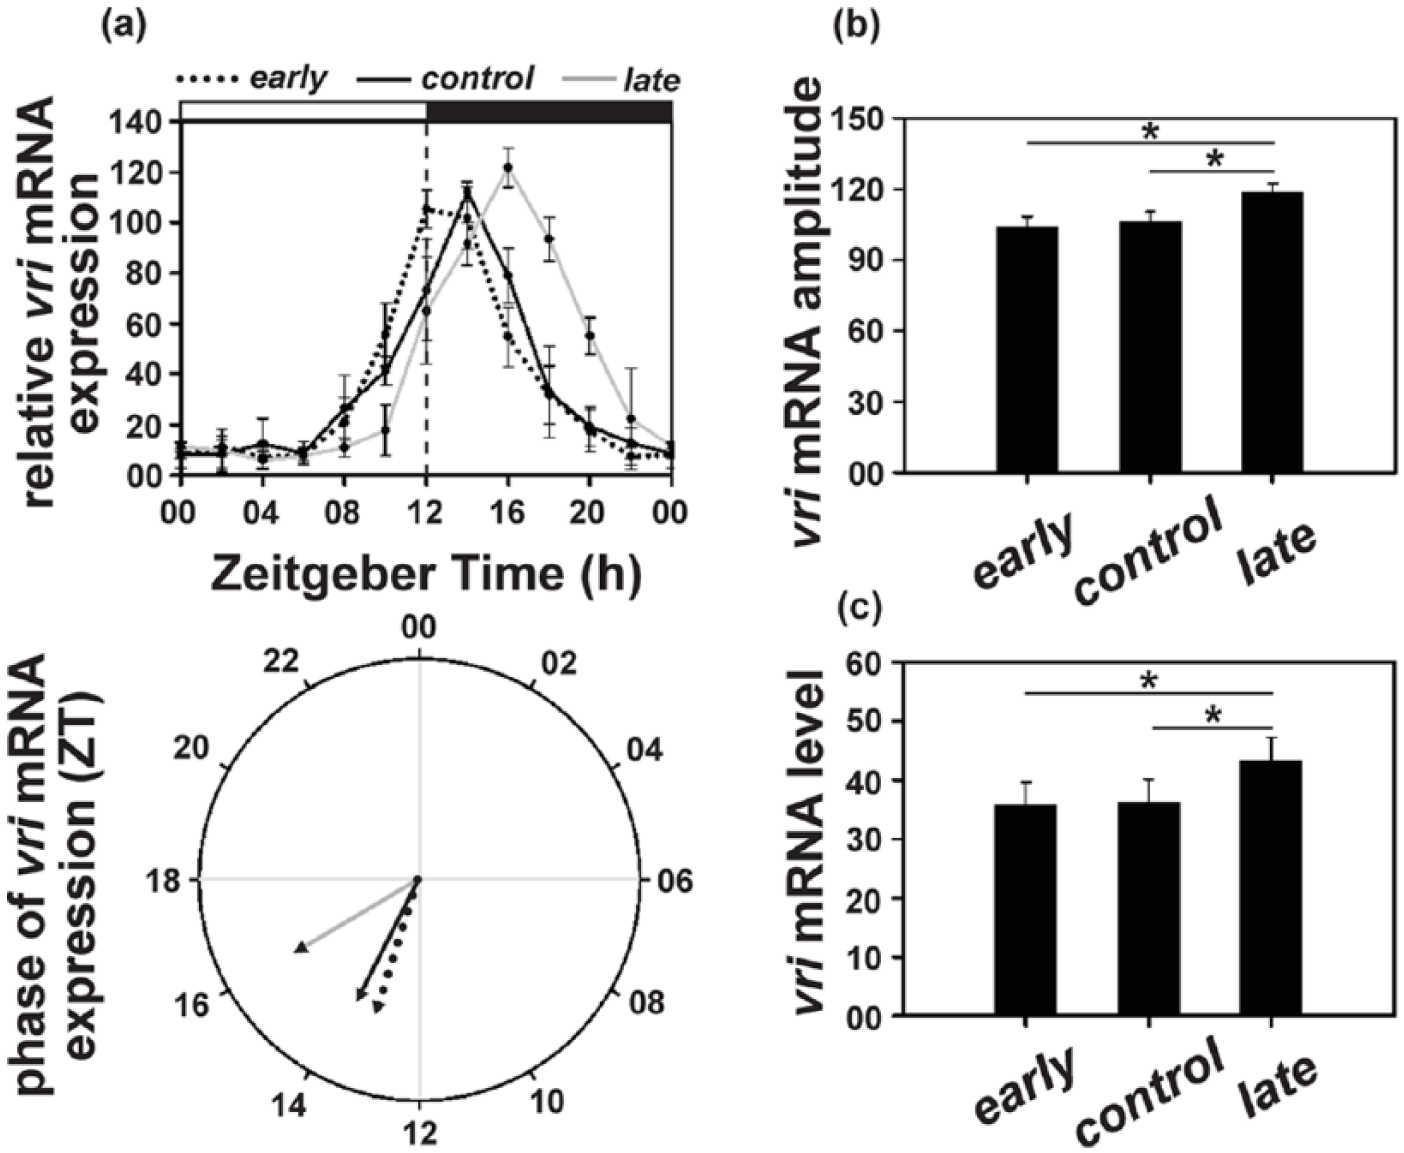
(a) Top panel: vrille (vri) mRNA levels (relative to rp49) under LD12:12 in the early, control, and late populations across the day. Error bars depict SEM across the 4 replicate blocks. Bottom panel: the mean phase (in ZT) of vri expression (relative to rp49) in the early (13.25 h), control (13.83 h) and late (15.99 h) populations. (b) Amplitude depicting difference between peak and trough and (c) average levels depicting mean vri mRNA (relative to rp49) levels across the day in the early, control, and late populations. Asterisks (*) indicate statistically significant differences (p < 0.05). All other details are same as in Figure 1.
In accordance with clk mRNA, amplitude of vri mRNA oscillation was significantly higher (~12.5%) in the late (118.40) populations compared to the early (104.22) and the control (106.44) populations (F2, 6 = 16.73; p < 0.01), while the latter 2 did not differ (Figure 7b; Suppl. Table S6); however, the average mRNA levels did not differ among the 3 populations (early = 35.78; control = 36.25; late = 43.38; Figure 7c; Suppl. Table S6).
Thus, similar to per, tim, and clk, the mean phase and amplitude of vri mRNA oscillation have diverged between the early and the late populations.
early and late Populations Differ in Phase, Amplitude and Levels of PDF Oscillation
In agreement with previous reports (Park et al., 2000), PDF levels exhibited clear diurnal oscillation in all 3 populations (Figure 8a,b-top panel), with peaks around morning and gradually falling throughout the day to low levels at night. Although the early and the late populations showed a similar trend, PDF levels fell more rapidly in the early populations and more gradually in the late populations (Figure 8b, top panel; Suppl. Figure S7).
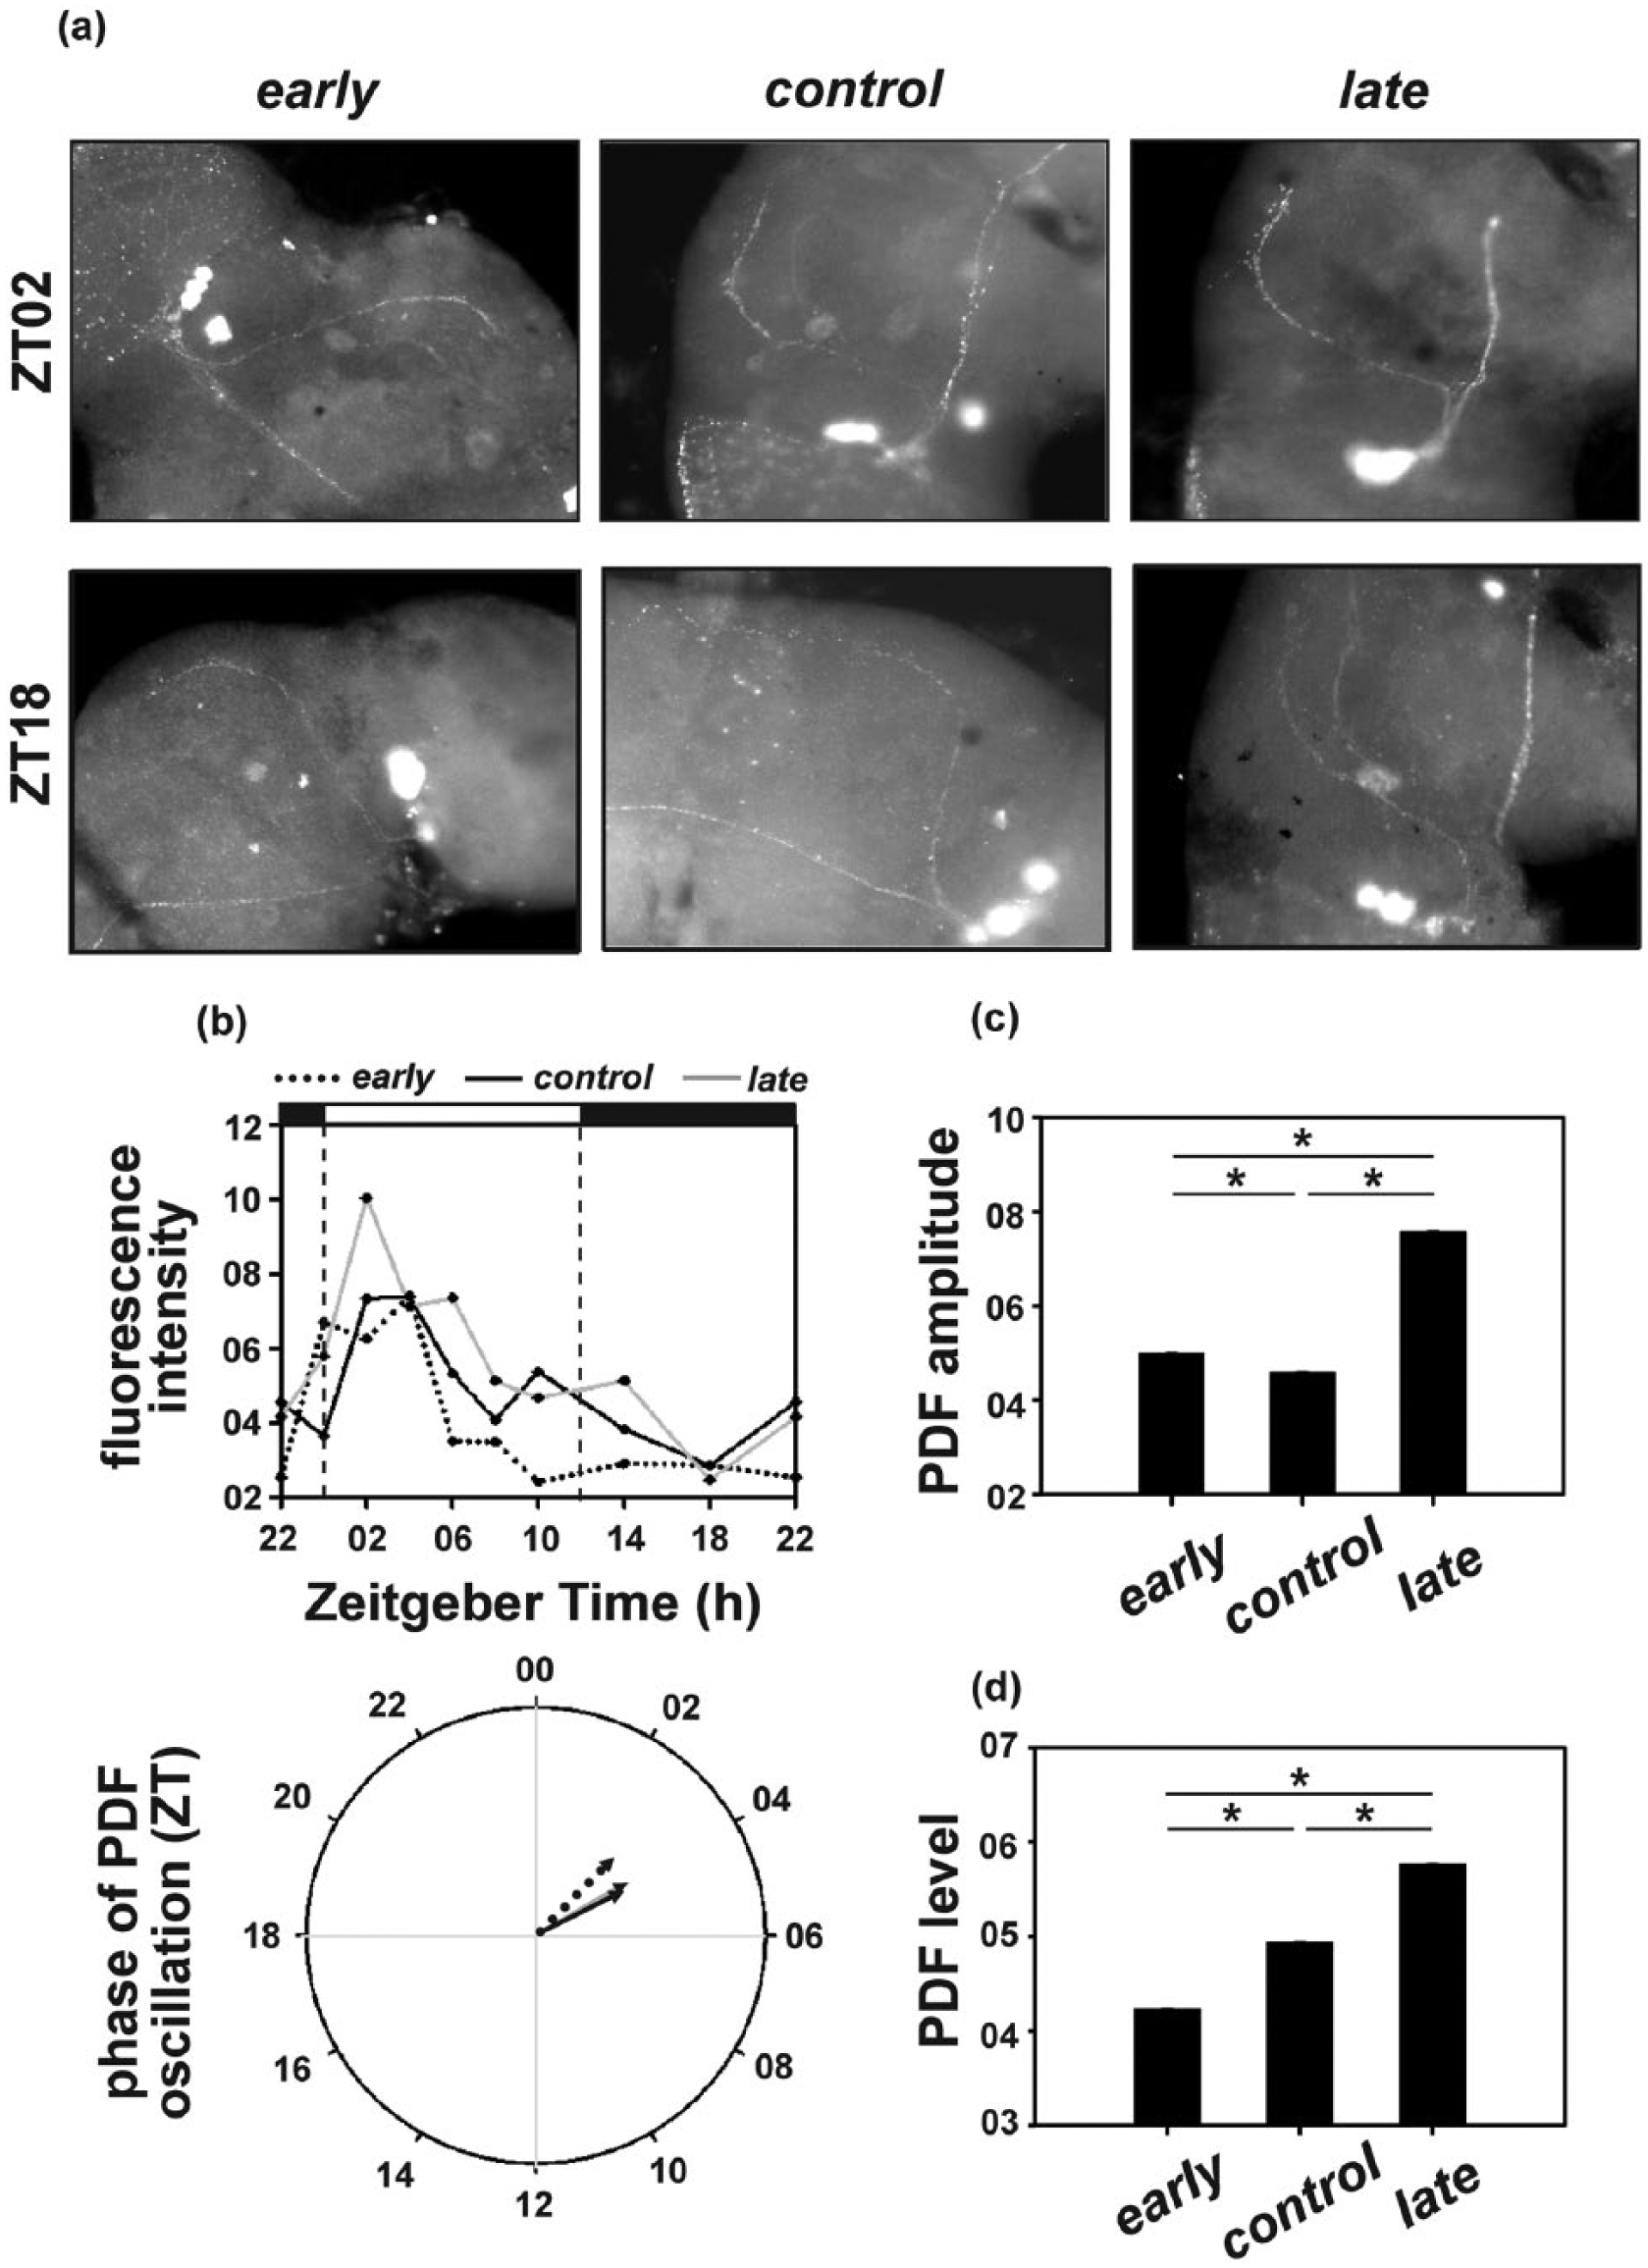
(a) Representative images depicting pigment-dispersing factor (PDF) levels in the small ventral-lateral neuron (sLNv) terminals at ZT02 (top panel) and ZT18 (bottom panel) in individuals sampled from the early, control, and late populations. The cell bodies appear to be blurred as they are present on a different stack/plane as the images are focused for clarity of sLNv terminals from which the florescence intensity was quantified. (b) PDF staining intensity in the sLNv terminals across the day (top panel) and corresponding mean phase of PDF oscillation (bottom panel) (n = 6-10 brains per time point). Note that fly brains were sampled at 2 h intervals between ZT22 and ZT10 and at 4 h intervals between ZT10 and ZT22. (c) Amplitude depicting difference between peak and trough and (d) average levels depicting mean PDF levels across the day in the brains of individuals sampled from the early, control, and late populations. Error bars depict 99% confidence interval calculated by Tukey’s honestly significant difference test, following analysis of variance, and asterisks (*) indicate statistically significant differences (p < 0.01). Data presented in panels (b) to (d) are bootstrapped from experimental raw data (presented in Suppl. Figure S7).
The mean phase of PDF oscillation in the late (θl = 4 h) populations was significantly delayed compared to the early (θe = 3 h) populations, while phase of the control (θc = 4.16 h) populations was close to but slightly delayed in comparison to the late populations (F2, 1497 = 130294.9; p < 0.01; Figure 8c).
The late (7.57) populations exhibited a significantly higher amplitude PDF oscillation compared to the early (4.99) populations, while amplitude of the control (4.58) populations was close to but significantly lower (F2, 1497 = 76115.16; p < 0.01; Figure 8d) than the early populations.
Also, the late (5.77) populations showed higher levels of PDF, differing significantly from both early (4.23) and control (4.94) populations, with the early populations exhibiting the lowest PDF levels (F2, 1497 = 362521.7; p < 0.01; Figure 8e).
Thus, early and late populations have evolved divergent mean phase, amplitude and average PDF levels.
Discussion
Despite widely observed circadian clock–chronotype associations, our understanding of the underlying molecular-genetic bases remains largely elusive primarily due to (a) unavoidable shortcomings of the existing methodologies for such studies in humans (reviewed in Levandovski et al., 2013) and (b) lack of suitable model systems. With these shortcomings in consideration, we raised D. melanogaster populations that exhibit early and late emergence chronotypes, and have reported the coevolution of divergent circadian clocks by generation 55 (Kumar et al., 2007). To examine if the circadian phenotypes of the early and the late populations persisted or have further diverged over 250 generations, we assayed the emergence rhythm of the 3 sets of populations under LD12:12 and winter- and summer-type photoperiods and observed that the mean phase of the emergence rhythm of the early and the late populations diverged by ~4 h under LD12:12, and the chronotype differences persisted robustly in winter-type and summer-type photoperiods (Figure 1a -c). However, under the summer-type photoperiod, gating of emergence was drastically affected in the late populations, with emergence spread throughout the day, unlike the other 2 populations, which exhibited clear gating of emergence (Figure 1c). In a previous study (Nikhil et al., 2015b), we had reported that under the dim-LL condition, the late populations exhibited a higher incidence of arrhythmicity in their activity/rest behavior compared to the 2 other sets of populations. These results collectively suggest that the late populations have evolved weaker gating/consolidation mechanisms, rendering them more vulnerable under unfavorable environments. The τ of the emergence rhythm in the early and the late populations diverged by 1.35 h, while that of activity/rest rhythm diverged by 0.7 h (~0.1 h and ~0.2 h greater than that reported in Kumar et al., 2007). Thus, while the phase of emergence drastically diverged between the early and the late populations, the circadian period exhibited a relatively smaller divergence. Interestingly, despite the divergence in τ of the activity/rest rhythm, the mean phase of the early and the late populations did not differ under LD12:12 but was different under winter- and summer-type photoperiods (Figure 2a,b). Under all 3 photoperiods, the late populations consistently exhibited higher evening activity compared to the early populations (Figure 2c). An interesting yet intriguing result was that of phase advancement of the evening activity peak in the late populations under the summer-type photoperiod. In Drosophila, the activity/rest rhythm is postulated to be controlled by a morning (M)–evening (E) oscillator network (Stoleru et al., 2007) which is coupled by PDF and mediates the morning and evening activity components (reviewed in Yoshii et al., 2012). Such population-dependent differences in activity/rest rhythm across photoperiods discussed above appear to suggest that the M-E oscillators might be differentially coupled in the early and the late populations and may possibly involve PDF (reviewed in Yoshii et al., 2012), as has been hypothesized in our recent study (Nikhil et al., 2015b).
We also studied the molecular correlates of the early and the late emerging populations, and found that the mean phase of mRNA expression of per, tim, and clk genes in the early and the late populations diverged significantly (Figures 3-5). In accordance with the differences in their circadian periods, the late populations exhibited a significantly delayed phase of per (~1.5 h) and tim (~2.5 h) mRNA expression compared to the early populations (Figures 3a and 4a), which is consistent with the results of a previous study that reported a delayed phase of per and tim mRNA oscillations in the long period mutant of Drosophila (Hardin et al., 1990; Rothenfluh et al., 2000). Accordingly, the late populations also exhibited a delayed (by ~2.5 h) phase of clk mRNA expression (Figure 4a) compared to the early populations, suggesting that the observed differences in the phase of per and tim mRNA oscillations might be due to divergent evolution of their transcriptional regulation by CLK. While CLK in association with CYC is known to mediate transcription of per and tim, cyc mRNA expression has not been observed to oscillate across the day, and therefore we did not assess cyc mRNA expression. We had previously reported that the late populations exhibit high-amplitude activity/rest rhythm under both dim-LD and DD conditions, which prompted us to hypothesize that these populations might have evolved high-amplitude circadian oscillators (Nikhil et al., 2015b), and this is corroborated by our findings of high-amplitude oscillations of per and clk mRNA in the late populations compared to the early populations (Figures 1b and 3b).
The early and the late populations show a clear difference in their circadian photosensitivity. To display their characteristic LD12:12 emergence waveform, the early populations require more light in the evening, while the late populations require more light in the morning (Vaze et al., 2012). To explore the molecular correlates of the observed differences in circadian photosensitivity, we assessed cry mRNA expression, and interestingly, although the late populations did not differ in the mean phase of mRNA expression, they exhibited significantly lower amplitude oscillation and reduced average levels of cry mRNA compared to the early populations (Figure 4). Lower cry mRNA level in the late populations is also consistent with the reduced ability of the late populations in recovering from jetlag (Nikhil et al., 2015b).
Since the experimental protocol employed to generate the early and the late emerging populations involved selection for timing of an overt circadian behavior (emergence rhythm), divergent evolution of molecular circadian clockwork in the early and the late populations can also arise due to differences in downstream effectors/pathways linking the circadian clocks to the emergence rhythm. Initiation of emergence in insects requires 20-hydroxyecdysone (20-HE), which acts via the Ecdysone Receptor/ Ultraspiracle (ECR/USP) receptors (Truman et al., 1983; Riddiford., 1993; Gilbert, 2011). Furthermore, another nuclear receptor, ecdysone-induced protein 75 (Eip75/E75), has been implicated in the maintenance of circadian rhythms in Drosophila linking the steroid hormone pathways with circadian clocks (Kumar et al., 2014). Since the early and the late populations exhibit significant differences in their egg-to-adult developmental rate (Kumar et al., 2006), which is known to be mediated by ecdysteroids, these results suggest that neuroendocrine factors might also mediate chronotype divergence between the early and the late populations. The clock gene vri, which is under the direct control of CLK and constitutes an additional interlocked loop of the core molecular clock, has been attributed as a downstream effector of circadian clocks, thereby mediating rhythmicity in overt behaviors (Cyran et al., 2003; Glossop et al., 2003; Zheng et al., 2009). vri is also one of the direct targets of ECR/USP (Beckstead et al., 2005), making it a putative candidate linking circadian clocks to the timing of emergence. Therefore, we assessed vri mRNA profiles in the early and the late populations and found that vri expression is significantly phase-delayed in the late populations compared to the early populations (Figure 7a -c). Furthermore, in corroboration with the clk mRNA oscillation, the late populations also exhibited higher amplitude and levels of vri expression compared to the early populations. Overexpression of vri is known to lengthen the clock period and causes a higher incidence of behavioral arrhythmicity (Blau and Young, 1999), a phenotype akin to the late populations (Figures 1 and 2; Nikhil et al., 2015b). These results suggest that selection for an altered phase of emergence leads to divergent expression of vri (and other possible downstream effectors), which, by virtue of its role as a transcriptional activator of clk, might have resulted in the divergent evolution of molecular circadian clockwork.
Furthermore, we have previously reported that some of the behavioral phenotypes observed in the late populations mirror the dynamics of a weakly coupled circadian network, including that of higher susceptibility to exhibiting complex and arrhythmic activity/rest behaviors (Nikhil et al., 2015b). While we hypothesized that lower PDF levels might drive reduced coupling, flies with null mutations for pdf (pdf01) are known to exhibit a shorter clock period (Renn et al., 1999), which is contrary to that observed in the late populations. Alternatively, overexpression of PDF has been reported to increase activity levels in DD, lengthen clock period (and shorten it in certain neurons), and induce complex and arrhythmic behaviors in Drosophila possibly due to mutual desynchronization of the constituent oscillators (Wülbeck et al., 2008). To gain further insights into the possible molecular correlates of such hypothesized coupling differences, we assessed PDF levels in sLNvs of the 3 sets of populations. Interestingly, we observed that the late populations exhibit significantly higher amplitude oscillation and levels of PDF, which is also phase-delayed compared to the early populations (Figure 8). In light of the reported effects of enhanced PDF levels by Wülbeck et al. (2008), PDF profiles of the late populations appear to corroborate their behavioral phenotypes including complex and arrhythmic behaviors, longer clock period, and high-amplitude activity/rest behavior. Furthermore, Helfrich-Förster et al. (2000) reported that overexpression of PDF leads to loss of gating in emergence rhythms shortly following transfer to DD, thereby resulting in apparent arrhythmic emergence profiles. Interestingly, we also observed a somewhat similar phenotype in the late populations with the emergence gate widening by day 4 following transfer to DD and relatively higher subjective nighttime emergence during days 5 to 6 (Figure 1d). Therefore, higher PDF levels in the late populations appear to underlie multiple behavioral phenotypes.
We report that evolutionary divergence of the early and the late emergence chronotypes is associated with correlated changes in the phase, amplitude and average levels of mRNA expression of the core clock genes per, tim, clk and vri. This is in striking contrast to the results of Pegoraro et al. (2015), who surprisingly did not observe a difference in the expression of any circadian genes in another set of the early and the late emerging Drosophila strains, possible reasons for which have been discussed earlier. In addition, we report differences in cry mRNA levels, which might underlie differential entrainment to LD cycles, thus contributing to divergent ψent between the 2 populations. Thus, we report that selection for the early and late phase of emergence leads to divergent evolution of molecular circadian clocks, and individuals with an advanced and delayed phase of entrainment (chronotypes) are associated with a similar advanced and delayed phase of entrained molecular oscillation of core clock genes, and we propose that such differences in entrained molecular oscillations might drive an advanced or delayed expression of output components such as vri and other downstream factors, thereby driving different phases of entrainment. Furthermore, in accordance with our previously reported behavioral differences, we observe that the divergent phase of entrainment is associated with the coevolution of differential photosensitivity and coupling of constituent oscillators, which appear to be driven by cry and PDF.
To our knowledge, ours is the first study of its kind to report the evolution of a divergent molecular circadian clockwork in response to artificial selection for the timing of emergence. Although it is likely that mRNA expression may not entirely reflect their respective protein profiles as differences in circadian phenotypes can also stem from differential post-transcriptional and post-translational regulations, in light of considerable variation exhibited by the outbreeding populations (compare across block variation in the supplementary figures), we adopted a more stringent quantitative method to assay the expression differences and therefore decided to assay mRNA and not protein expression as the latter would involve a semi-quantitative method that might reduce the chance of detecting interpopulation differences. Therefore, this would remain a caveat of the current study, which will be addressed in future studies, since the fact that mRNA level differences are by themselves statistically significant provides the motivation for future studies. Nevertheless, our study highlights the early and the late populations as a potential model system for the study of chronotypes and underlying molecular-genetic correlates, and with the preliminary groundwork established in the current study, future studies will help further elucidate several other molecular underpinnings of the clock-chronotype associations.
Footnotes
Acknowledgements
The authors thank P. Ganguly, R. Karatgi, R. Ramdas, T. V. Venkateshwaran, V. Yadav, S. Rao, and Y. Chakravarthy for their assistance with the experiments. The PDF antibody was kindly donated by Michael Nitabach to Sheeba Vasu. This project was funded by Science and Engineering Research Board (SERB), Government of India. We thank 2 anonymous reviewers and Dr. Sheeba Vasu for critical comments on the manuscript.
Conflict Of Interest Statement
The author(s) declared no potential conflicts of interest with respect to the research, authorship, and/or publication of this article.
Notes
References
Supplementary Material
Please find the following supplemental material available below.
For Open Access articles published under a Creative Commons License, all supplemental material carries the same license as the article it is associated with.
For non-Open Access articles published, all supplemental material carries a non-exclusive license, and permission requests for re-use of supplemental material or any part of supplemental material shall be sent directly to the copyright owner as specified in the copyright notice associated with the article.