
Abstract
Light is known as one of the most powerful environmental time cues for the circadian system. The quality of light is characterized by its intensity and wavelength. We examined how the phase response of Arabidopsis thaliana depends on the wavelength of the stimulus light and the type of light perturbation. Using transgenic A. thaliana expressing a luciferase gene, we monitored the rhythm of the bioluminescence signal. We stimulated the plants under constant red light using 3 light perturbation treatments: (1) increasing the red light intensity, (2) turning on a blue light while turning off the red light, and (3) turning on a blue light while keeping the red light on. To examine the phase response properties, we generated a phase transition curve (PTC), which plots the phase after the perturbation as a function of the phase before the perturbation. To evaluate the effect of the 3 light perturbation treatments, we simulated PTCs using a mathematical model of the plant circadian clock and fitted the simulated PTCs to the experimentally measured PTCs. Among the 3 treatments, perturbation (3) provided the strongest stimulus. The results indicate that the color of the stimulus light and the type of pulse administration affect the phase response in a complex manner. Moreover, the results suggest the involvement of interaction between red and blue light signaling pathways in resetting of the plant circadian clock.
Keywords
Circadian clocks that generate approximately 24-h rhythmicity are present in almost all living organisms. In higher plants, circadian clocks play a crucial role in the control of a variety of biological processes, including leaf movement, flowering, and photosynthesis (McClung, 2006). An important characteristic of the circadian clocks is their entrainment to environmental time cues (zeitgebers), such as changes in external light or temperature (Johnson et al., 2003). Coordination of the internal rhythm with the external cycle enhances plant growth (Dodd et al., 2005). The most consistent zeitgeber is the daily cycle of light and darkness (Devlin and Kay, 2001; Johnson et al., 2003). To respond to sunlight, whose spectrum covers a wide range of wavelengths, higher plants have evolved a number of photoreceptors. Phytochromes perceive red and far-red lights. Cryptochromes, phototropins, ZEITLUPE (ZTL), and the related family members FLAVIN-BINDING, KELCH REPEAT, F-BOX 1 (FKF1), and LOV KELCH PROTEIN 2 (LKP2) absorb blue light (Chen et al., 2004; Harmer, 2009). UV RESISTANCE LOCUS 8 (UVR8) senses ultraviolet-B (UV-B) radiation (Rizzini et al., 2011).
The response of circadian clocks to a pulse perturbation depends on the time at which the pulse is administered (Johnson, 1992). Typically, a pulse in subjective morning induces a phase advance of the circadian clock, whereas a pulse in subjective night induces a phase delay. Measurement of such phase shifts over the course of the day constitutes a phase response curve (PRC) or a phase transition curve (PTC) (Johnson, 1992). A number of studies have investigated the phase response of Arabidopsis thaliana to a light pulse. Covington et al. (2001) examined how plants kept under constant darkness (DD) respond to a red or blue light pulse. Nakamichi et al. (2004) observed the phase response of A. thaliana cell cultures incubated under DD to a white light stimulus.
Investigating the phase response of the plant circadian clock is of practical importance for its application in plant factories. By exploiting the phase response properties to various light inputs, the light condition can be designed so as to efficiently control the plant circadian rhythm in a closed system (Fukuda et al., 2013). At this point, 2 aspects of the plant circadian system should be noted. First, growth is enhanced when the plant is entrained to a 24-h zeitgeber period (Dodd et al., 2005). In particular, for species or individuals, who show only weak or damped circadian oscillations, entrainment is quite effective to recover their degraded productivity. For this entrainment, which is termed circadian resonance, a 12-h:12-h light/dark cycle has been used as the environmental cue. Second, plants grown under constant light (LL) accumulate higher biomass than those grown under various light/dark cycles (Fukuda et al., 2011). These properties imply that, to enhance productivity in plant factories, the plants should be entrained to a 24-h period under the LL condition. As a pulse stimulus to entrain the plants under the LL condition, either darkness or light of a color different from that of the constant light can be injected.
Since plants show distinct responsiveness to red and blue lights (Covington et al., 2001), dependence of the phase response property on the wavelength of the stimulus light should provide an important study. To our knowledge, however, few studies have investigated the phase response properties of plants under the LL condition. Devlin and Kay (2001) examined the phase response of A. thaliana grown under constant red light and stimulated by brighter red light and observed a typical shape to the PRC. Fukuda et al. (2008) studied the effect of a dark pulse on A. thaliana kept under constant red light and observed an inverse shape to the typical PRC.
We studied the phase response properties of A. thaliana kept under constant red light to 3 different types of light stimuli. Our aim was to quantify the 3 phase response properties and determine which condition elicited the strongest response. To quantify the stimulus strength, the PTCs obtained in the physiological experiments were fitted to a mathematical model for A. thaliana that describes the genetic network underlying the plant circadian system. The results indicated that both the color of the stimulus light and the type of the light perturbation affected the strength of the stimulation.
Materials and Methods
Plant Material and Bioluminescence Assays
To experimentally measure the phase response characteristics, we used transgenic A. thaliana expressing a firefly luciferase gene under the control of the CIRCADIAN CLOCK ASSOCIATED 1 (CCA1) promoter (CCA1::LUC) (Nakamichi et al., 2004). The plants were plated on solid Murashige and Skoog medium supplemented with 2% (w/v) sucrose. The seedlings were grown at 22 ± 1 °C in a 12 h:12 h light/dark photoperiod in 80 µmol·m−2·sec−1 white fluorescent light for 14 days.
About 2 days before commencing bioluminescence measurement, the plants were supplied with 5 mM luciferin in 0.01% Triton X-100. We measured the bioluminescence signals under constant red light (λ p = 660 nm, 80 µmol·m−2·sec−1). The bioluminescence rhythms were monitored by a Kondotron (Kondo et al., 1993) in a temperature-controlled chamber (MIR-553; SANYO Electric Co. Ltd., Osaka, Japan). Photons emitted by each plant were detected by a photomultiplier tube (Hamamatsu H7360-01MOD; Hamamatsu Photonics KK, Hamamatsu, Japan).
Phase Response Experiment
The plants kept under constant red light were perturbed for a 2-h duration by means of 3 light treatments: (1) increasing the photosynthetic photon flux density (PPFD) of the red light from 80 to 160 µmol·m−2·sec−1 (hereafter termed “add-Red”), (2) turning on a blue light (λ p = 470 nm, 80 µmol·m−2·sec−1) while turning off the background red light (“turn-Blue”), and (3) turning on a blue light (λ p = 470 nm, 80 µmol·m−2·sec−1) while keeping the background red light on (“add-Blue”). The light treatment was applied at 102 h, 108 h, 111 h, 114 h, and 120 h for the add-Red condition; at 102 h, 108 h, 114 h, 120 h, and 120 h for the turn-Blue condition; and at 102 h, 108 h, 113 h, 114 h, and 120 h for the add-Blue condition (each time indicates the time point from the start of bioluminescence monitoring). After perturbation for 2 h, the plants were returned to the constant red light condition.
To characterize the phase response properties, we used the PTC, which plots the phase after perturbation (new phase) as a function of the phase before perturbation (old phase). To investigate the phase shifts, we first defined the phase of the circadian oscillation as

where τ k denotes the time at which the kth peak of the oscillation was observed, and τ k ≤ t < τk+1 (Pikovsky et al., 2001). To reduce the noise effect, time points of {ϕ(t)} both before and after the light perturbation were fitted with a regression line by the least squares algorithm. Figure 1B displays the regression lines obtained from the bioluminescence data shown in Figure 1A. The light perturbation induced a discontinuity between the 2 regression lines, indicating the phase shift. To generate the PTC, the phase ϕ was normalized as

where the zero phase (θ = 0) was set to the fourth peak of the circadian oscillation. To locate the fourth peak, only the peaks observed after 12 h from the start of the monitoring were taken into account. Then, the old phase (θold) and the new phase (θnew) were calculated at the discontinuous points before and after the perturbation, respectively.
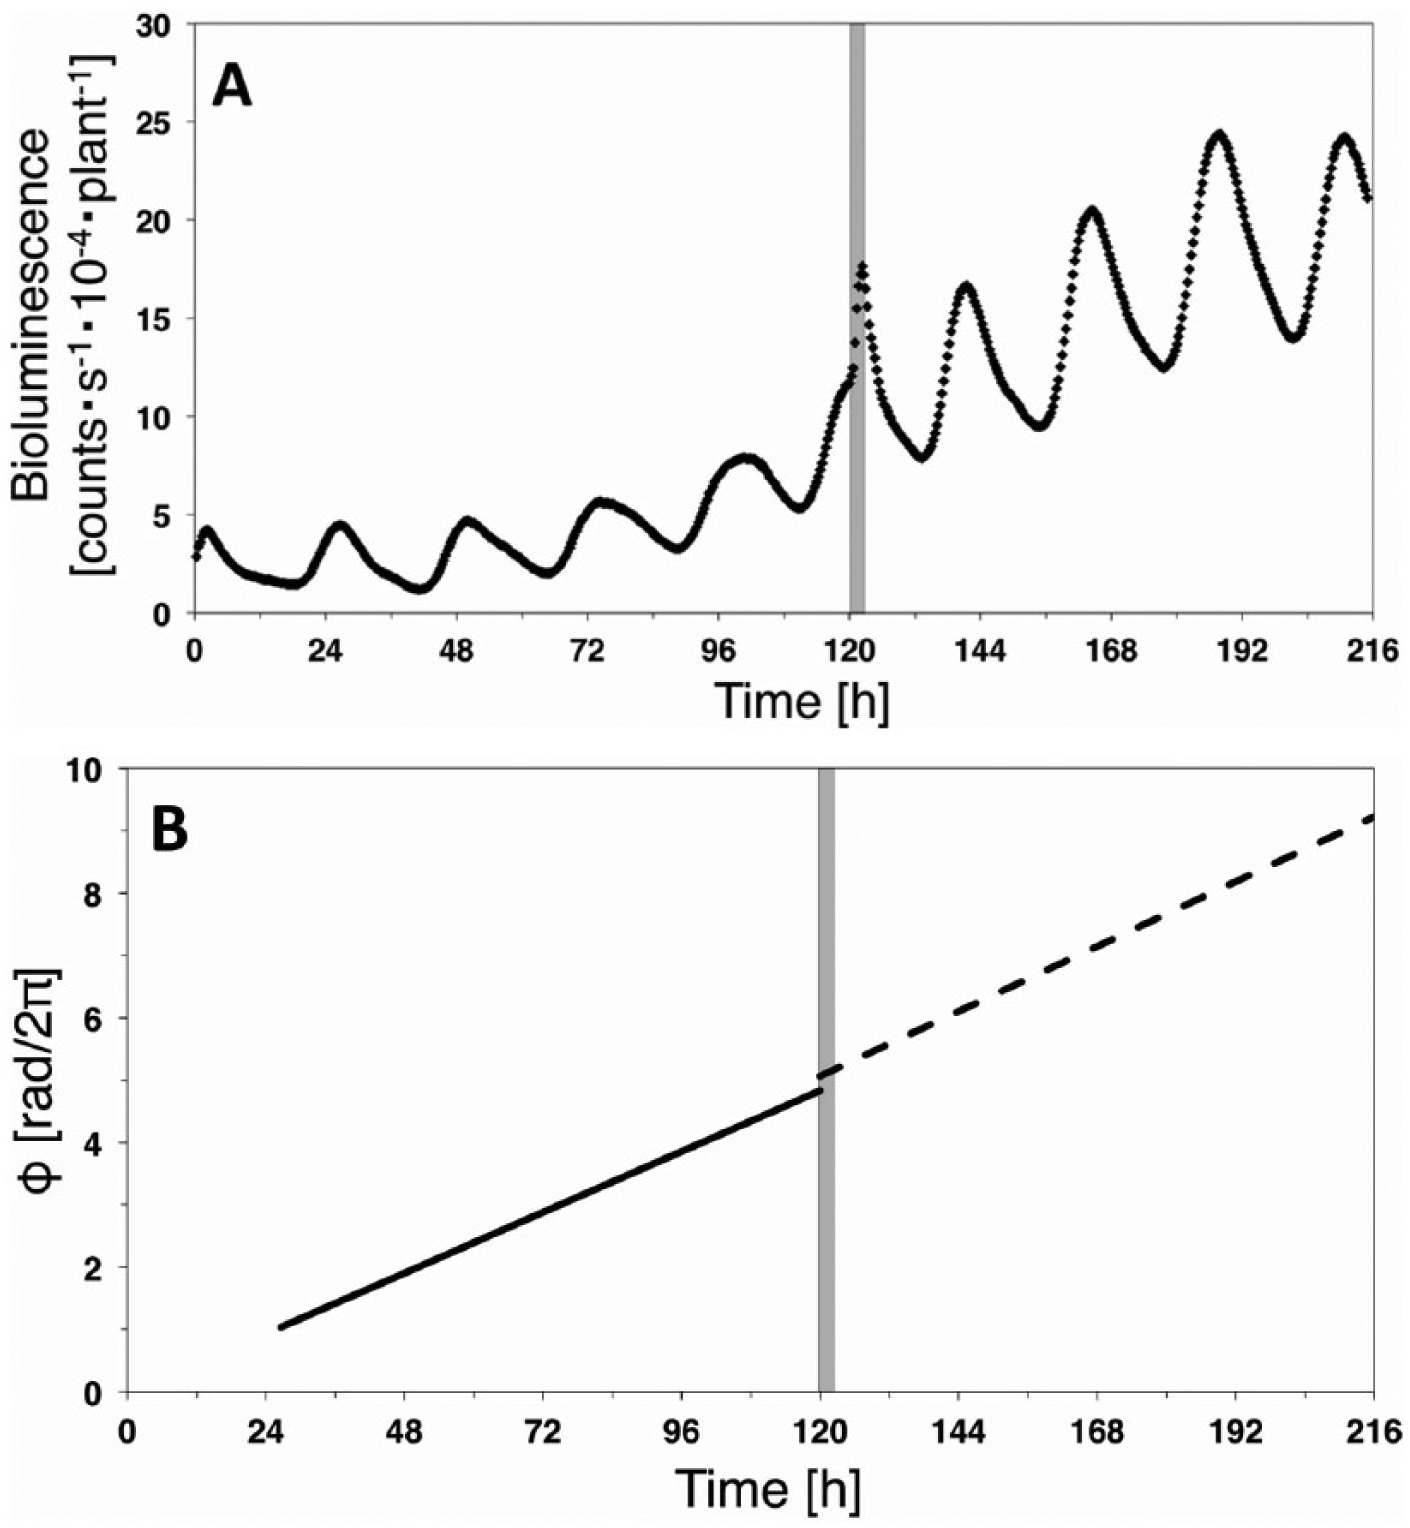
Phase response in the case of add-Blue experiment. (A) Time series of bioluminescence signal. (B) Fitted lines for the phase signals {ϕ(t)} extracted from (A). The solid and dashed lines indicate time evolution of the phase before and after the perturbation, respectively. The gray bars indicate the time of perturbation.
Numerical Simulation
To evaluate the strength of the light stimuli used in the experiment, a mathematical model that describes the network of clock genes in A. thaliana was fitted to the experimentally observed PTC. The circadian clock of A. thaliana comprises several transcriptional feedback loops (Harmer, 2009). Various mathematical models that take into account these loops have been proposed (Bujdoso and Davis, 2013). Because the light stimuli of our phase response experiments were characterized by changes in both intensity and wavelength, mathematical models that take into account either of these characteristics were desirable. However, no model that separates the effect of light at different wavelengths has been developed, although recent models include multiple light signaling pathways (Pokhilko et al., 2012). This limitation forced us to treat the strength of the light stimuli as a combined change in both intensity and wavelength of the input light. We chose a 1-loop model (see Supplementary Online Material S1), which includes CCA1, LATE ELONGATED HYPOCOTYL (LHY), and TIMING OF CAB EXPRESSION 1 (TOC1) as the core clock genes (Locke et al., 2005). Despite its simplicity, the model is capable of reproducing the PRC measured experimentally by Covington et al. (2001). Moreover, the parameter values have been well optimized by Locke et al. (2005) to fit into various key features of the experiment.
Advanced models, such as the interconnected feedback loop model (Pokhilko et al., 2012), can also reproduce the experimental PRC, but we considered it more appropriate to use a simple model. Since advanced models include detailed structure of the feedback loops, they contain a large number of unknown parameters whose values should be adjusted to fit to experimental data. The results obtained with such large models may strongly depend on the chosen parameter values. To obtain more general results, it is more advantageous to use a simplified model, which has far fewer parameters and thus shows a weaker dependence on the parameter setting.
The present model contains a parameter Θ, which indicates the condition of the light input. We set ΘLL = 0.1 for constant red light condition, while we increased it to another value Θstimulus during the 2-h light stimulus. The strength of the stimulation was defined as the difference between the 2 light intensities as ΔΘ = Θstimulus – ΘLL. By changing the stimulus strength from ΔΘ = 0.005 to ΔΘ = 0.08, various PTCs were simulated from the mathematical model. It should be noted that, although the original work of Locke et al. (2005) used values of 0 or 1 for Θ, setting the parameter ΘLL to 0.1 did not significantly change the behavior of the mathematical model. The endogenous period of the oscillation under ΘLL = 0.1 was about 24.6 h, which is similar to the period (about 24.9 h) under Θ = 0 or Θ = 1. Selection of alternative values for ΘLL did not alter the qualitative behavior of the model (the period was 24.4-24.8 h).
Parameter Matching
Phase transition curves obtained from the physiological experiments and from the numerical simulations were fitted by a Fourier series (second order) as

The 5 parameters

For each light condition, the simulation data that minimize W correspond to the experimental data. The strength of the experimental light stimuli can be finally evaluated as ΔΘ of the corresponding simulation data.
Results
Figure 2A-C shows PTCs measured under the 3 light conditions. The 3 PTCs exhibited a relatively noisy structure as in the previously observed PRC, which was measured using darkness as a pulse stimulus (Fukuda et al., 2008). The add-Red and turn-Blue PTCs overall displayed a small amount of phase shifts. In contrast, the add-Blue PTC showed larger amplitudes at around phase θ ≈ 0.6 rad/2π than the others. In general, 2 types of PTCs are observed: type 1 and type 0. The type 1 PTC shows relatively small phase shifts, lying close to a diagonal line (θold = θnew). The type 0 PTC, on the other hand, displays larger phase shifts and deviates from the diagonal line. It is often the case that the type 0 PTC is caused by a strong stimulus. In the sense that the 3 PTCs shown in Figure 2A-C are closely located on the diagonal line, they can be categorized as type 1.
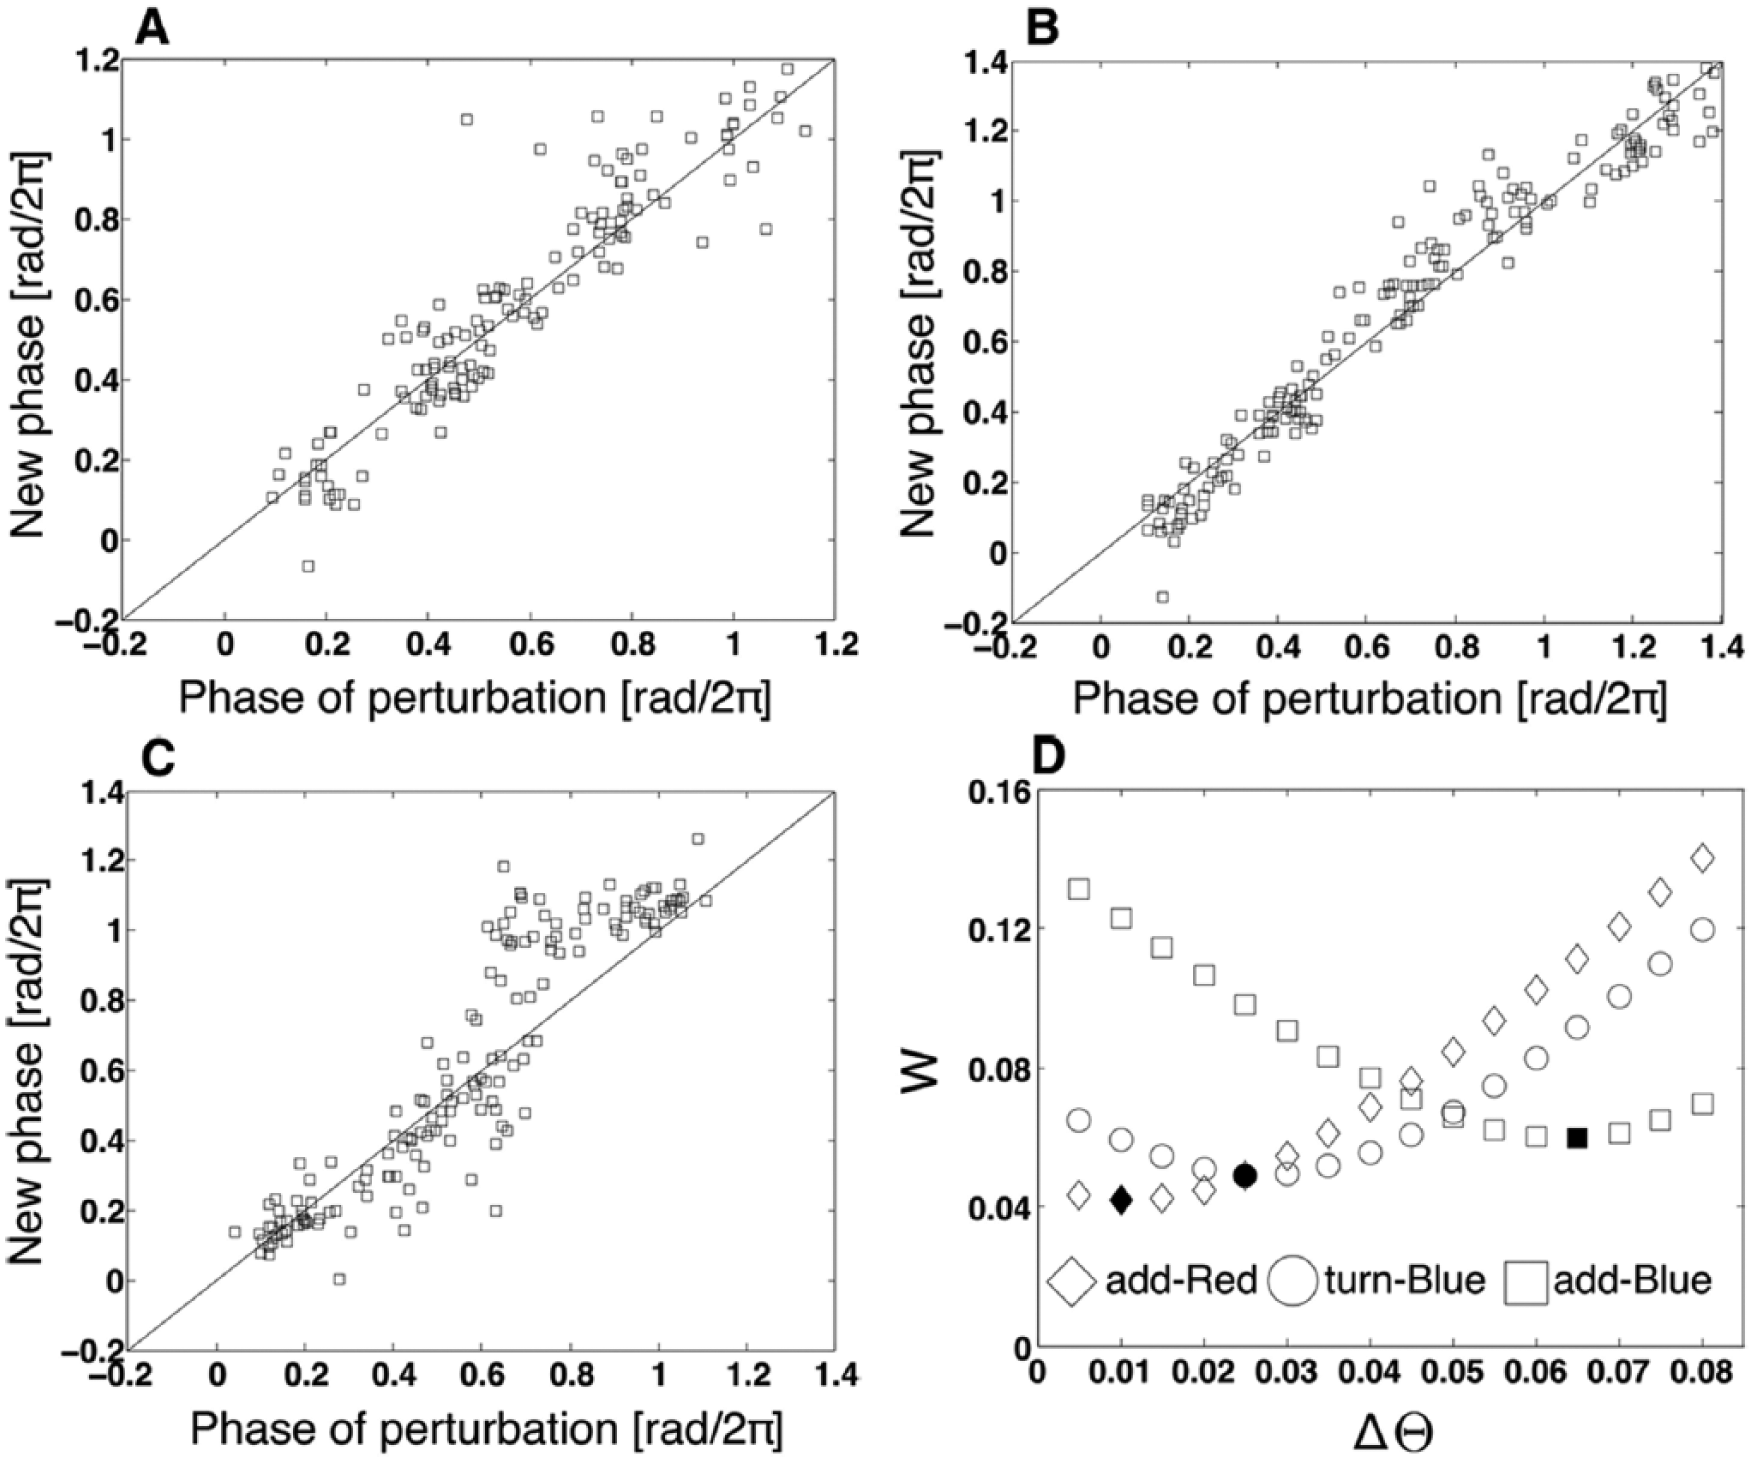
Phase transition curves under the condition of (A) add-Red (n = 136), (B) turn-Blue (n = 165), and (C) add-Blue (n = 161). (D) Dependence of the distance W between simulation and experiment (diamonds: add-Red; circles: turn-Blue; squares: add-Blue) on simulated light stimuli ΔΘ. The filled symbols correspond to the minimum distance W.
Figure 2D shows the outcome of parameter matching between the simulation data and the 3 experimental data sets. Each curve clearly gave rise to a minimum point in the middle region. The add-Red PTC (diamonds), turn-Blue PTC (circles), and add-Blue PTC (squares) showed the minimum distance W at ΔΘ = 0.01, ΔΘ = 0.025, and ΔΘ = 0.065, respectively (filled symbols in Fig. 2D). This result indicated that the add-Blue condition provided the strongest stimulus to induce phase shifts, whereas the turn-Blue and add-Red conditions gave moderate and weak stimuli, respectively. Figure 3 compares the experimental PTCs (A: add-Red; C: turn-Blue; E: add-Blue) with those of the simulations, which are matched to each experimental condition (B, D, F). The Fourier series captured essential features of the experimental PTCs reasonably well. Fitted curves of the add-Blue PTC and the simulation with ΔΘ = 0.065 showed a similar shape (Fig. 3F). On the other hand, weak similarities were observed between the add-Red PTC and the corresponding simulation with ΔΘ = 0.01 (Fig. 3B), as well as between the turn-Blue PTC and the corresponding simulation with ΔΘ = 0.025 (Fig. 3D). This was probably because the add-Red and turn-Blue PTCs showed only subtle changes in amplitude, which required more delicate fitting with the model simulation. In contrast, the add-Blue PTC showed a clear peak and trough, which were reproduced clearly by the model.
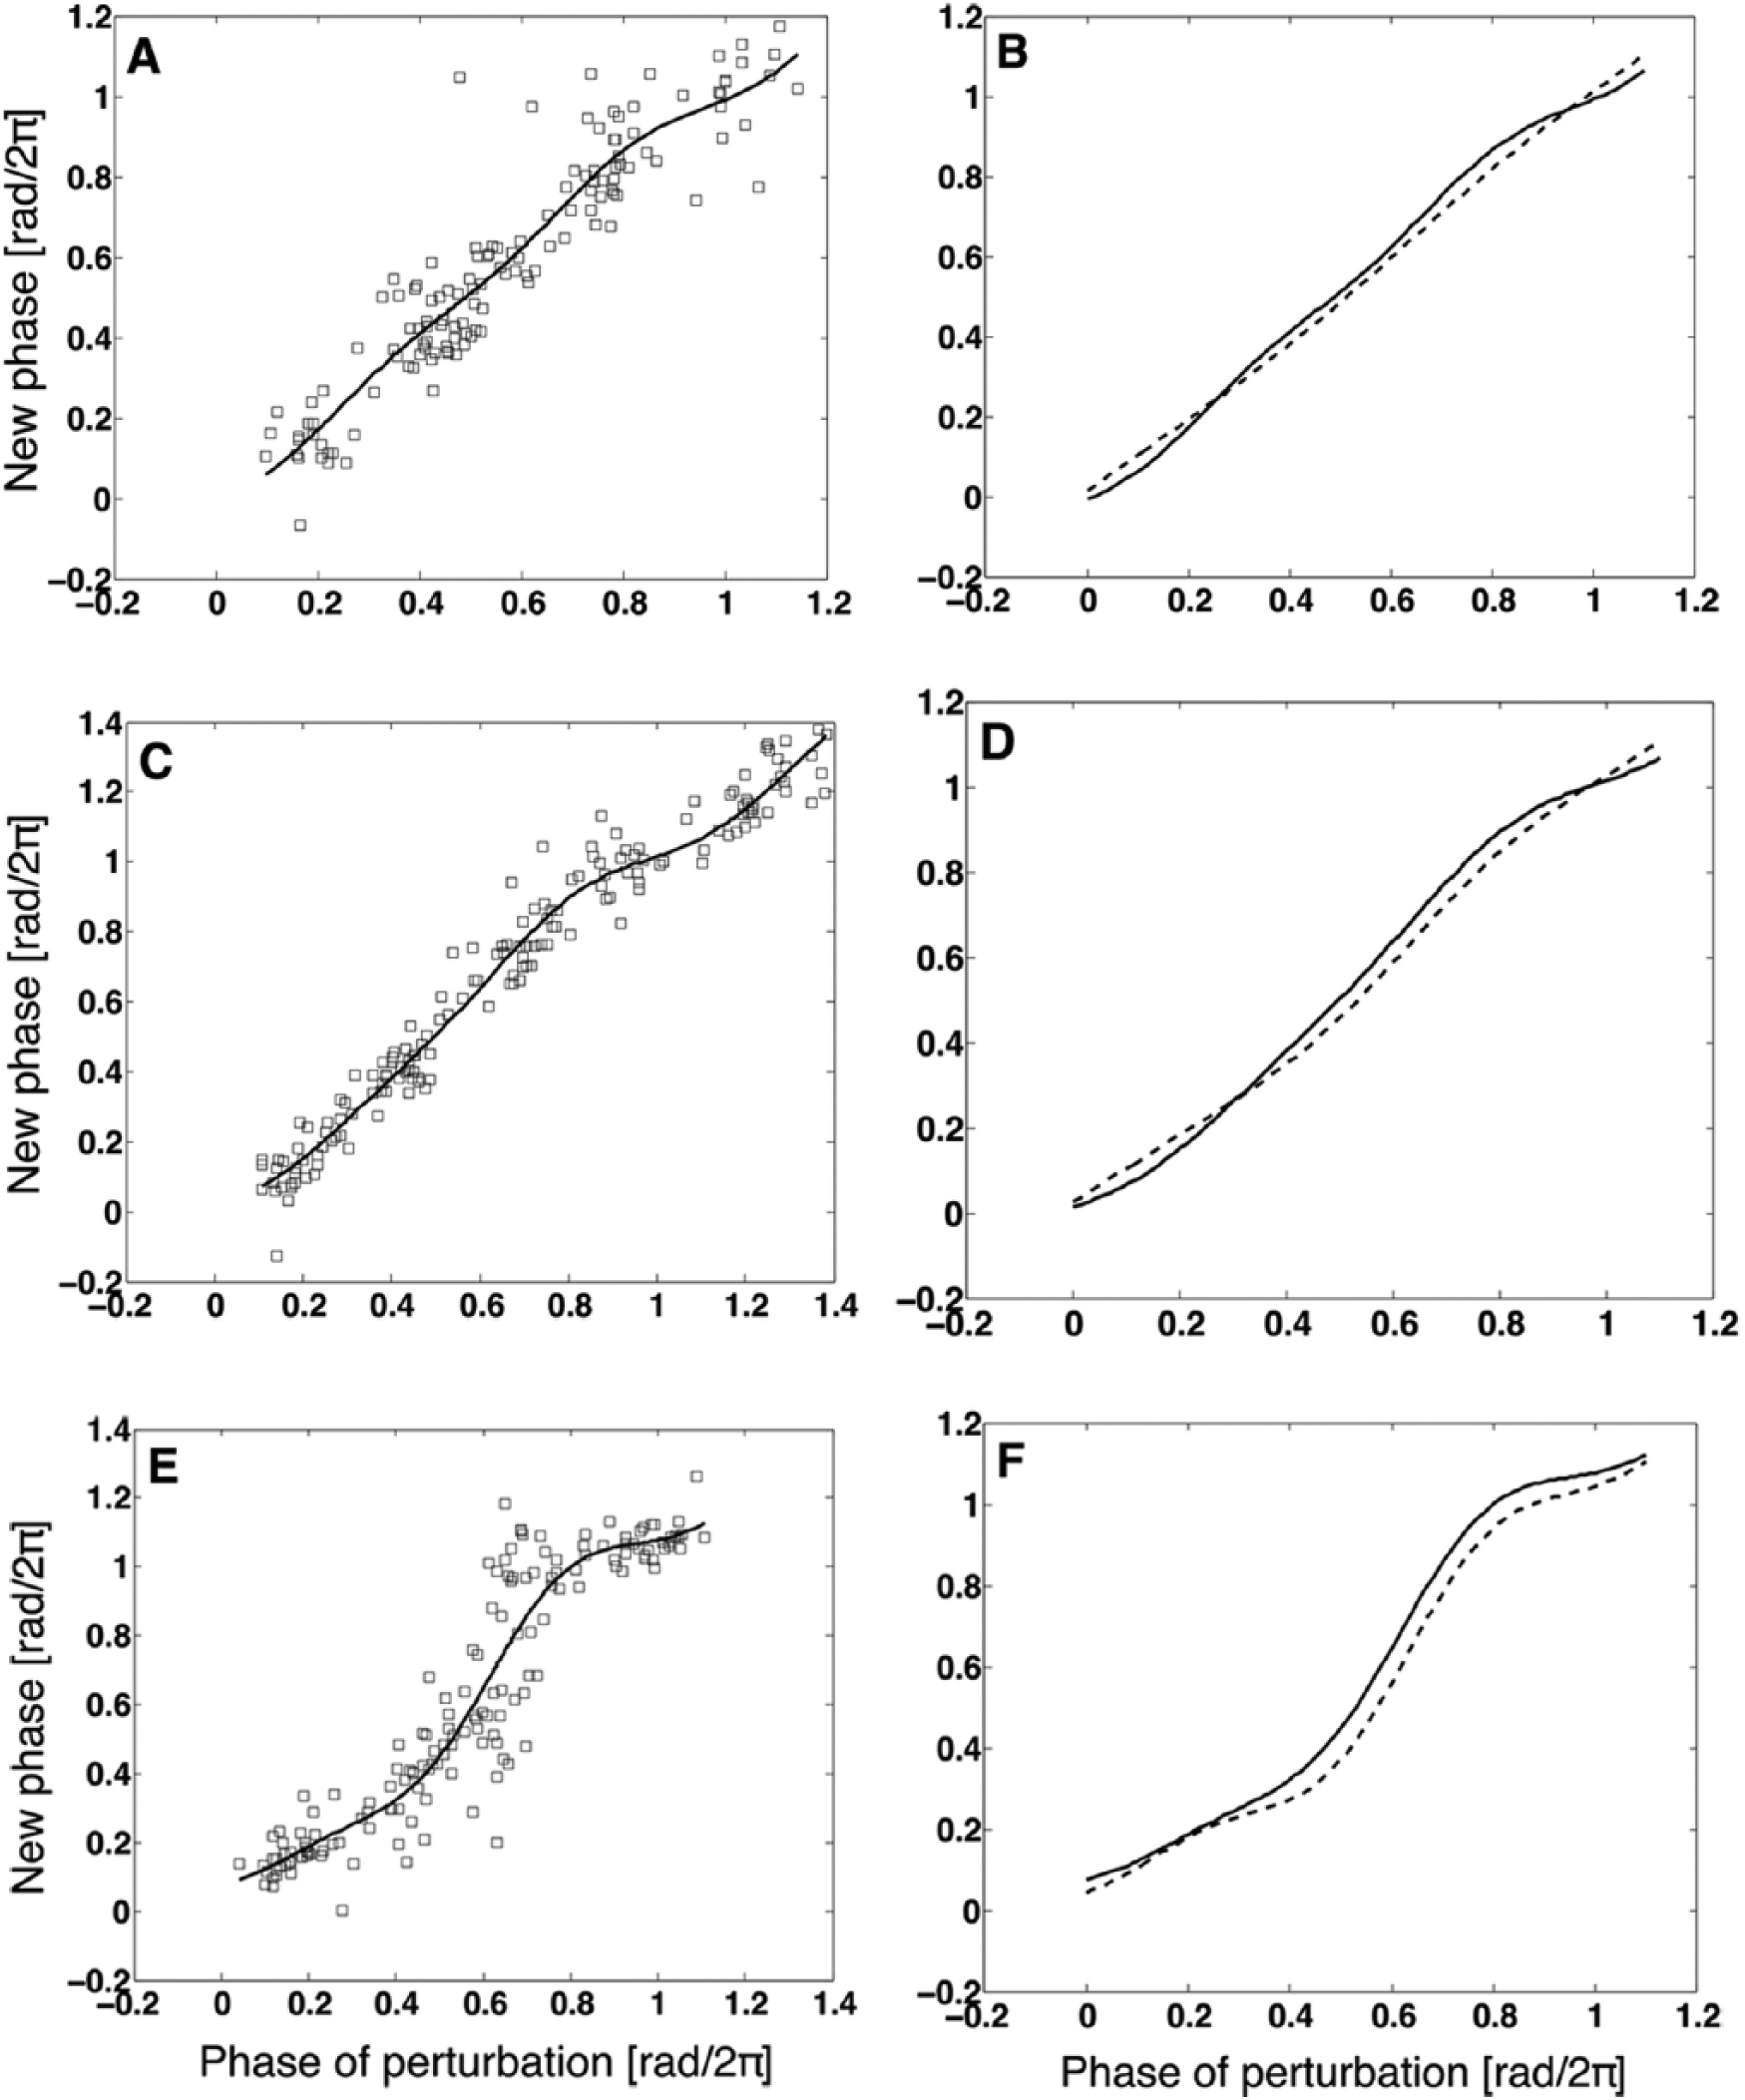
Comparison between experimental phase transition curves (solid lines) and those of the corresponding simulations (dashed lines). (A, B) add-Red experiment and simulation with ΔΘ = 0.01. (C, D) turn-Blue experiment and simulation with ΔΘ = 0.025. (E, F) add-Blue experiment and simulation with ΔΘ = 0.065.
It should be noted that the minimum value of W for the add-Blue condition was higher than those for the other conditions (Fig. 2D), meaning its poor fit between the simulation and the experiment. This finding is inconsistent with Figure 3F, which shows a strong similarity between the simulation and the experiment. The inconsistency was due to the fact that the experimental data of the add-Blue condition had a relatively larger value of the parameter
In addition, it should be noted that in the present analysis, the Fourier series up to the second order was used to fit the noisy PTCs. The obtained results were not overly sensitive to the choice of the Fourier order, because essentially identical results were obtained when the first-order Fourier approximation was used (see Supplementary Online Material S3).
Discussion
The present article studied the phase response properties of A. thaliana under constant red light. Three types of light stimulus—namely, the add-Red, turn-Blue, and add-Blue conditions—were compared by fitting their PTCs to the mathematical model of the plant circadian clock. The stimulus strength ΔΘ quantified for the 3 experimental data sets showed that the effect of the light pulse on the circadian phase depended on the wavelength of the stimulus light, as well as how the background light was treated during the perturbation.
Comparing the add-Blue and add-Red conditions, add-Blue showed a stronger light-perturbation effect than that of add-Red. In both conditions, the light stimuli were administered on a background of red light. This means that blue light elicited larger phase shifts than increased red light, even though the photon flux density of the light pulse was identical. According to previous experiments that investigated fluence rate-dependent shortening of the circadian period (Devlin and Kay, 2000; Hu et al., 2013), the effect of red light is saturated above 30 to 40 µmol·m−2·sec−1. The results obtained for the add-Red PTC, which showed only slight phase shifts, were consistent with these data because we used red light PPFD exceeding 80 µmol·m−2·sec−1.
The turn-Blue and add-Blue conditions induced smaller phase shifts than those induced by a blue light pulse applied to plants under DD (Covington et al., 2001), although the latter authors used a pulse of shorter duration (1 h) and lower PPFD (25 µmol·m−2·sec−1). This implies that the effect of the blue light pulse was inhibited when the red light was on before the stimulation. In the photomorphogenesis such as flowering, de-etiolation, and phototropism, irradiation with a combination of 2 different light wavelengths may be promotive or inhibitive (Casal and Boccalandro, 1995; Guo et al., 1998; Casal, 2000). However, no experimental study of the combined effect of different light radiations on the plant circadian clock has been undertaken previously. The current study showed that an interaction between the red and blue light signaling pathways acts in the resetting of plant circadian rhythms and, moreover, indicated that the interaction may be antagonistic rather than cooperative. We should be careful, however, about the interpretation, because saturation of the light inputs or similar response properties of the plant to red and blue lights can be an alternative cause of the diminished phase shifts observed in the experiments. Further study is needed to verify the underlying mechanism.
Comparing the add-Blue and turn-Blue conditions, turn-Blue showed a weaker effect than that of add-Blue. The turn-Blue experiment involved 2 aspects to the light treatment: turning off the red light, which might produce a dark signal in the red light signaling pathway, and then turning on the blue light. The response properties of A. thaliana to these types of light perturbations have been reported separately. As mentioned already, the PRC for a 1-h blue light pulse under the DD condition was studied by Covington et al. (2001), who reported somewhat larger phase shifts than those observed for the present turn-Blue PTC. Fukuda et al. (2008), on the other hand, measured a PRC for a 2-h dark pulse under constant red light and obtained an unusual curve shape that resembled an inverse of the usual plant PRC shape. Given that our assumption of the 2 aspects in the turn-Blue perturbation is correct, these data imply that the 2 light perturbations were antagonistic and, consequently, relatively small phase shifts were elicited.
In natural environments, the quality of sunlight changes not only in intensity but also in wavelength (e.g., at twilight transitions) (Roenneberg and Foster, 1997; Foster and Helfrich-Förster, 2001; Johnson et al., 2003). At twilight, sunlight is relatively rich in blue light over the sky, whereas it is rich in red light at the horizon. The present results showed that the phase response properties of plants depend on the composition of the light spectrum. Plants may use the information of both light intensity and its wavelength to ensure the entrainment of circadian rhythms to external cycles. It would be of interest to examine how the plant circadian system is optimized to entrain biological rhythms to natural light. Precise data on diurnal changes in the spectrum of sunlight that reaches the earth’s surface are needed to tackle this problem. In addition, it will be useful to investigate the phase response properties of plants kept under constant blue or white light conditions.
As mentioned in a previous study, controlling plant rhythms by pulse perturbation under LL is more suitable than that under DD (Fukuda et al., 2008), because plants grown under LL show enhanced accumulation of biomass (Fukuda et al., 2011). The present study showed that 3 types of pulse perturbations applied under LL can induce a variety of forms of PTCs ranging from small to large phase shifts. This knowledge can be used to develop a technique to control plant circadian rhythms. Perturbations with an appropriate combination of light wavelengths may optimize this control, which would not only enhance plant growth but also reduce the total quantity of light necessary to control the plant circadian rhythms, thus decreasing the running costs.
The present results showed that the simple 1-loop model, which includes the LHY/CCA1 component (Locke et al., 2005), was able to reproduce the experimental PTCs reasonably well. As suggested by Pokhilko et al. (2012), the PRC seems to be mostly determined by the acute light response in LHY/CCA1 expression via the light-sensitive activator protein P. This suggestion explains why a simplified model was adequate to reproduce the qualitative shape of the PTC or PRC. The advantage of using a simplified model, rather than complex models that take into account more detailed feedback loops, is that it requires determination of a relatively small number of parameters to fit to experimental data. Compared with complex models, which incorporate a large number of unknown parameters, a simplified model shows much weaker dependence on the parameter settings and thus can provide more generally applicable results.
The present mathematical model is still preliminary in the sense that it does not detect the light wavelength. In reality, however, higher plants are capable of differentiating the wavelength of input light, as observed in a previous study (Covington et al., 2001) as well as in the present investigation. Although advanced mathematical models include multiple light signaling pathways (Pokhilko et al., 2010, 2012), they do not separate the effects of light inputs of different wavelengths. Therefore, in a future study, we intend to construct a mathematical model that differentiates the effect of light inputs of different wavelengths so as to elucidate the responsiveness of plants under different irradiation conditions.
Footnotes
Acknowledgements
We thank Mr. Nobuya Okamura for assistance with the phase response experiments. This work was partially supported by a Grant-in-Aid for Scientific Research (no. 25293053 to I.T.T.; no. 23560446 to H.F. and I.T.T.; no. 25119721 to H.F.) from the Japan Society for the Promotion of Science (JSPS).
Notes
References
Supplementary Material
Please find the following supplemental material available below.
For Open Access articles published under a Creative Commons License, all supplemental material carries the same license as the article it is associated with.
For non-Open Access articles published, all supplemental material carries a non-exclusive license, and permission requests for re-use of supplemental material or any part of supplemental material shall be sent directly to the copyright owner as specified in the copyright notice associated with the article.