
Abstract
While previous studies have demonstrated short-wavelength sensitivity to the acute alerting effects of light during the biological night, fewer studies have assessed the alerting effect of light during the daytime. This study assessed the wavelength-dependent sensitivity of the acute alerting effects of daytime light exposure following chronic sleep restriction in 60 young adults (29 men, 31 women; 22.5 ± 3.1 mean ± SD years). Participants were restricted to 5 h time in bed the night before laboratory admission and 3 h time in bed in the laboratory, aligned by wake time. Participants were randomized for exposure to 3 h total of either narrowband blue (λmax 458-480 nm, n = 23) or green light (λmax 551-555 nm, n = 25) of equal photon densities (2.8-8.4 × 10¹³ photons/cm2/sec), beginning 3.25 h after waking, and compared with a darkness control (0 lux, n = 12). Subjective sleepiness (Karolinska Sleepiness Scale), sustained attention (auditory Psychomotor Vigilance Task), mood (Profile of Mood States Bi-Polar form), working memory (2-back task), selective attention (Stroop task), and polysomnographic and ocular sleepiness measures (Optalert) were assessed prior to, during, and after light exposure. We found no significant effect of light wavelength on these measures, with the exception of a single mood subscale. Further research is needed to optimize the characteristics of lighting systems to induce alerting effects during the daytime, taking into account potential interactions between homeostatic sleep pressure, circadian phase, and light responsiveness.
Ocular light exposure not only is essential for vision but also is a powerful modulator of a range of circadian, neuroendocrine, and neurobehavioral responses to light. In humans, these nonvisual, or non–image-forming, responses include circadian phase-shifting (Zeitzer et al., 2000), melatonin suppression, acute elevation of core body temperature and heart rate (Zeitzer et al., 2000; Cajochen et al., 2005), pupillary constriction (Zaidi et al., 2007), and clock gene expression (Cajochen et al., 2006).
Exposure to light also has immediate stimulating effects on both subjective and objective measures of sleepiness. Polychromatic white light during the night decreased subjective sleepiness, increased sleep onset latency, reduced electroencephalographic (EEG) correlates of sleepiness, and improved neurobehavioral performance and mood in a dose-dependent manner (Badia et al., 1991; Cajochen et al., 2000; Burgess et al., 2001). The mechanism(s) underlying the acute alerting effect of light are not yet fully understood. While it has been proposed that the alerting effect is a consequence of light-induced suppression of melatonin synthesis (Badia et al., 1991; Cajochen et al., 2000; Burgess et al., 2001), others report alerting effects independent of melatonin suppression (Phipps-Nelson et al., 2009; Chellappa et al., 2011) or, conversely, significant melatonin suppression without an associated alerting effect (Rüger et al., 2005). Similarly, the acute alerting effect of light has also been reported during the day, when circulating melatonin is undetectable (Phipps-Nelson et al., 2003; Rüger et al., 2006; Vandewalle et al., 2006). These findings suggest that the melatonin suppression and acute stimulant effects of light may be contemporaneous, but not causative, responses.
Action spectra for melatonin suppression (Brainard et al., 2001; Thapan et al., 2001) and studies of circadian phase resetting (Lockley et al., 2003; Revell et al., 2005) by light in humans show a greater sensitivity to short-wavelength light (λmax 450-480 nm). This short-wavelength sensitivity is thought to be conferred by melanopsin, a retinaldehyde-based short-wavelength (blue) light-sensitive photopigment (λmax 480 nm) expressed in a small subset of intrinsically photosensitive retinal ganglion cells (ipRGCs; Schmidt et al., 2011). Nonetheless, as suggested previously (Lockley et al., 2003), these studies do not preclude the involvement of the classical photoreceptor system, and dynamic interactions between the melanopsin-containing ipRGCs and the visual photoreceptors have been reported in both humans and nonhuman mammals (Hattar et al., 2003; Dkhissi-Benyahya et al., 2007; Gooley et al., 2010, 2012).
Consistent with a primary role for melanopsin-containing ipRGCs in circadian photoreception, short-wavelength sensitivity has been demonstrated for the acute alerting effects of light (Cajochen et al., 2005; Lockley et al., 2006; Revell et al., 2006; Lehrl et al., 2007; Phipps-Nelson et al., 2009; Sletten et al., 2009; Chellappa et al., 2011). Neuroimaging studies have also reported wavelength-dependent changes in neural activity in key regions involved in arousal and cognition (Vandewalle et al., 2007, 2011). In the majority of cases, however, light exposure occurred during the nighttime, and few studies have examined whether the short-wavelength sensitivity persists during the daytime following sleep loss, although there is limited evidence that light, and in particular short-wavelength light exposure, is effective in improving performance during the daytime (i.e., Vandewalle et al., 2007; Rahman et al., 2014).
The aim of this study was to assess the spectral sensitivity of the alerting effects of light during the daytime following 2 nights of sleep restriction. We tested the light intervention against a background of 2 nights of sleep restriction since others have shown that performance is substantially degraded after 2 consecutive nights of sleep restriction (Dinges et al., 1997; Van Dongen et al., 2003; Swann et al., 2006), and a substantial proportion of young adults are known to regularly restrict their sleep (National Sleep Foundation, 2005). Specifically, we examined the effects of a 3-h total exposure to narrowband blue (λmax 458-480 nm, n = 23) or green light (λmax 551-555 nm, n = 25), matched for photon density (2.8-8.4 × 10¹³ photons/cm2/sec), compared with a darkness control condition on subjective sleepiness, working memory, sustained attention and selective attention, inhibitory control, as well as EEG and ocular measures of drowsiness. It was hypothesized that 3 h of short-wavelength light during the biological day will be more effective at reducing sleepiness and enhancing mood and neurocognitive performance compared with a no-light control or green light of equal photon density. This study contributes to understanding the effects of light wavelength on neurocognitive function and the possible mechanisms underlying the acute alerting of light. The findings also have important practical implications given that polychromatic light systems enriched in short-wavelength light are already being marketed to counteract daytime sleepiness based on the findings from the nighttime studies.
Materials and Methods
Participants
A total of 60 participants (29 men, 31 women) aged between 18 and 31 years completed the multisite study (n = 42, Melbourne, Australia; n = 18, Boston, MA). Eligibility was assessed using computer and paper-based self-report questionnaires in addition to a comprehensive medical examination. Participants in the light exposure groups underwent a thorough opthalmalogic exam, and all participants were administered the Ishihara test (Ishihara, 1996) to rule out color blindness. Participants were deemed ineligible if they reported having diseases of the visual system or a history of a sleep disorder, psychiatric illness, or recent acute or chronic illness or if they regularly took medication. Participants reported consuming low-to-moderate amounts of alcohol (<14 U/wk) and caffeine (<300 mg/d), were nonsmokers, and had not taken any drugs of abuse in the previous 12 months.
Participants were required to have habitual bedtimes between 2100 h and 0200 h, wake times between 0500 h and 1000 h, and sleep durations of 7 to 9.5 h. None of the participants worked night shifts in the previous 2 years or traveled across more than 2 time zones in the previous 3 months. Those with extreme chronotypes (Horne and Östberg, 1976; scores <30 or >70) or scores above the cutoff on the Pittsburgh Sleep Quality Index (Buysse et al., 1989; scores >5), Epworth Sleepiness Scale (Johns, 1992; scores >10), Sleep Disorders Questionnaire (Douglass et al., 1994; positive on 1 or more subscales), Berlin Questionnaire (Netzer et al., 1999; positive on 2 or more categories), or Athens Insomnia Scale (Soldatos et al., 2000; scores >5) were excluded. This study was approved by the Monash University Human Research Ethics Committee, The Alfred Hospital Ethics Committee, and the Partners’ Institutional Review Board. All participants provided written informed consent and were reimbursed for their participation. The study was conducted between August 2008 and August 2011.
Study Protocol
Baseline and Initial Sleep Restriction
Participants maintained a set self-selected 8 h:16 h sleep:wake schedule in their own home for ~3 weeks (minimum 19 days). Compliance to the sleep schedule was monitored using sleep logs and calls to an automated date- and time-stamped answering machine at bed and wake time, while continuous actigraphy (Actiwatch-64, Mini-Mitter, Respironics, Bend, OR) was recorded for at least the last 7 days of the baseline episode. Participants were instructed to refrain from napping and abstain from alcohol, nicotine, prescription and nonprescription medications, supplements, and recreational drugs during the entire study. Caffeine use was prohibited for at least the last 4 days of the baseline phase until study completion. On the evening preceding the sleep laboratory visit, participants restricted their time in bed to 5 h, such that their sleep onset time was delayed by 3 h and wake time remained constant. Participants were asked to remain in dim light (i.e., no overhead lighting) from their usual bedtime until their delayed bedtime.
Laboratory Visit and Second Sleep Restriction Night
Participants attended the Monash University Sleep Laboratory (Melbourne, Australia; n = 42) or the Intensive Physiology Monitoring Unit in the Centre for Clinical Investigation at the Brigham and Women’s Hospital (Boston, MA; n = 18), during which they were studied in a light-proof, sound attenuated, and time-cue free environment for approximately 25 h. Participants arrived at the sleep laboratory approximately 8 h before their habitual baseline bedtime. Time in bed was restricted to 3 h in the laboratory visit, with the end of time in bed aligned by wake time.
On arrival at the laboratory, urine toxicology screening for drugs of abuse and review of actigraphy data were performed to confirm adherence to study protocol. EEG electrodes were applied to the scalp and face of all participants for continuous polysomnography recording. In Australia, participants were custom fitted with an Optalert device (Optalert Pty Ltd, Melbourne, Australia) for continuous recording of ocular drowsiness measures. From 2 h after arrival, participants remained in <3 lux ambient lighting conditions (measured in the vertical plane at a height of 54 inches) with the exception of the scheduled sleep episodes, when ambient light levels were 0 lux. In Melbourne, ambient lighting was generated using 36 W PL-L 840 ceiling-mounted fluorescent 4000 K lamps (Phillips Lighting, Eindhoven, the Netherlands) and Lee neutral-density filters (Lightmoves Pty Ltd, Melbourne, Australia). In Boston, ambient lighting was generated using ceiling-mounted 4100 K fluorescent lamps (F96T12/41U/HO/EW, 95 W; F32T8/ADV841/A, 32 W; F25T8/TL841, 25 W; Philips Lighting, Eindhoven, the Netherlands) with digital ballasts (Hi-Lume 1% and Eco-10 ballasts, Lutron Electronics Co., Inc., Coopersburg, PA) transmitted through a UV-stable filter (Lextran 9030 with prismatic lens, GE Plastics, Pittsfield, MA). Illuminance was measured using a Lumacolor J17 luxmeter (Tektronix, Beaverton, OR) or an IL1400 radiometer/powermeter (International Light Inc., Peabody, MA). Participants were allowed to pursue quiet activities between testing, and standardized meals were provided at scheduled times to participants throughout their laboratory stay.
On day 1 of the laboratory visit, participants performed hourly testing on a standardized neurobehavioral test battery, which included the Karolinska Sleepiness Scale (KSS), auditory Psychomotor Vigilance Task (aPVT), and Karolinska Drowsiness Task (KDT) to familiarize them with the tasks (see Fig. 1). Saliva samples were also collected every 30 to 60 min as described elsewhere or assessment of the timing of dim light melatonin onset (DLMO) (Sletten et al., 2010). Sleep was recorded using polysomnography.
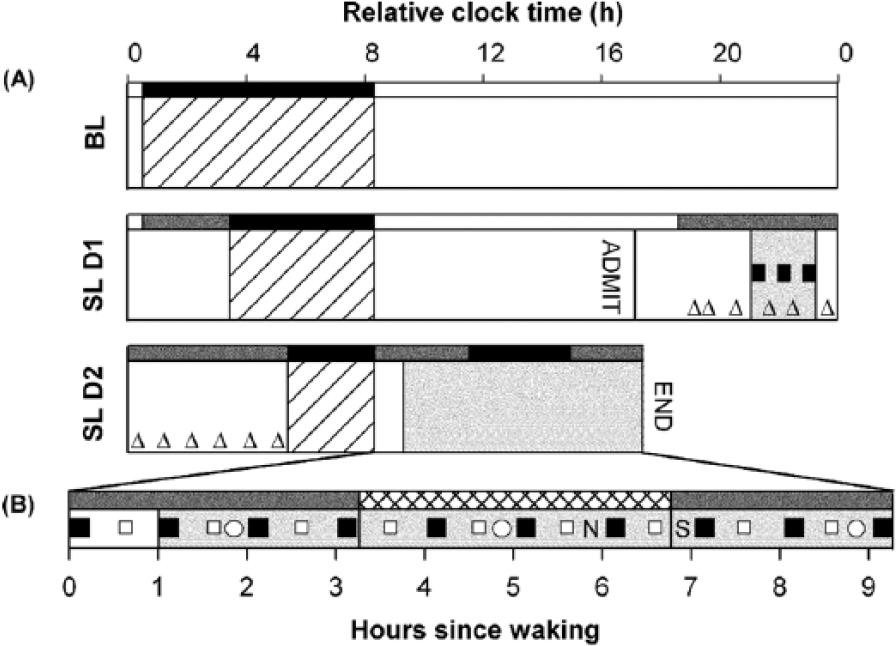
Schematic overview of the study protocol used to assess the acute alerting effects of daytime exposure to monochromatic light. (A) Study days are plotted on the vertical axis, and relative clock time is represented on the horizontal axis. Following baseline (BL), participants restricted their sleep (stippled bars). Participants were asked to remain in dim light (thin shaded bars) from their usual baseline bedtime until their delayed bedtime on the first night of sleep restriction. On the night of their laboratory stay (SL D1), saliva samples were collected (open triangles). (B) During the testing day (SL D2) of their sleep laboratory visit, participants underwent testing on the Psychomotor Vigilance Task (aPVT; closed squares) and Karolinska Sleepiness Scale (KSS), presented on its own (open squares), or in conjunction with the aPVT and Karolinska Drowsiness Task (closed squares), in addition to the Profile of Mood States Bipolar Form (open circles), 2-back task (N), and the Stroop task (S). During testing, participants were placed in modified constant routine conditions (wide shaded bars) under <2 lux light (thin shaded bars) until the conclusion of testing, with the exception of the sleep and light exposure periods (cross-hatched bars), when ambient light levels were 0 lux (black bars).
On day 2 of the laboratory visit, participants performed the standard neurobehavioral test battery immediately upon waking and then every 30 to 60 min, under modified constant posture conditions until 9.25 h after waking. Changes in mood were assessed at 1.75, 4.75, and 8.5 h after waking. In Melbourne, participants performed 2 additional cognitive tasks, the Stroop task and 2-back task, and had eye and eyelid movements recorded continuously using infrared reflectance oculography (Optalert, Optalert Pty Ltd). The study had a between-groups design. According to the original study design, participants were randomized to intermittent exposure over 3½ h (3 h light exposure, 30 min no exposure) of either narrowband blue (Melbourne: λmax 458 nm, n = 14; Boston: λmax 480 nm, n = 9) or green light (Melbourne: λmax 551 nm, n = 16; Boston: λmax 555 nm, n = 9), matched for photon density (Melbourne: 2.8 × 10¹³ photos/cm2/sec; Boston: 8.4 × 10¹³ photons/cm2/sec) beginning 3.25 h after wake time. This protocol was developed based on previous studies that also provided short breaks to participants during the light exposure period (Lockley et al., 2006; Rahman et al., 2014). In a follow-up to the original study, we recruited a further 12 participants and assigned them to a no-light treatment condition. Participants remained blinded to their light group allocation until the start of the planned light exposure period.
Sleepiness and Neurocognitive Assessments
Subjective sleepiness was measured using the KSS (Akerstedt and Gillberg, 1990) and a computerized, auditory version of the PVT was used to assess sustained attention (10 min, interstimulus interval 2-10 sec). The Profile of Mood States Bipolar Form (POMS-Bi; McNair et al., 1992) was used to assess changes in mood across 6 subscales including agreeable-hostile, composed-anxious, clearheaded-confused, confident-unsure, elated-depressed, and energetic-tired. Selective attention was evaluated using the Stroop task (adapted from Stroop, 1935). In this task, stimuli were composed of single words that were the names of colors (red, blue, green, or yellow), printed in 1 of 4 colors. In the congruent condition, the stimuli were presented in the color denoted by the word. In the incongruent condition, color words were presented in 1 of the 3 colors not denoted by the word. Participants were required to name the colors of stimuli, and voice latencies were recorded (Psychology Software Tools Inc., Pittsburgh, PA). In total, participants completed a practice block consisting of 8 trials and 96 test trials. The 2-back task is a computerized test of spatial working memory performance (Signal et al., 2012; Labview 8.5 software, National Instruments, North Ryde, NSW, Australia). During the task, participants were required to match the position of the current stimulus on the screen with the position of the stimulus that was presented 2 trials previously.
Electroencephalographic and electrooculographic (EOG) recordings were obtained using a digital polysomnographic wireless amplifier/recorder (Melbourne: Siesta 802, Compumedics Ltd., Melbourne, Australia; Boston: Vitaport-3 digital recorder, TEMEC Instruments B.V., Kerkrade, the Netherlands). In Boston, linked mastoid references were used for wake recordings from the z-line (Fz-Mx, Cz-Mx, Pz-Mx, and Oz-Mx). In Melbourne, EEG activity was recorded from electrode sites F3, F4, C3, C4, P3, P4, O1, and O2, referenced contralaterally to M1 and M2. Left and right EOG activity was also recorded, and bipolar electromyogram (EMG) was recorded from electrodes positioned on the mentalis muscle. Impedences for EEG and EOG were maintained at <10 kΩ. EEG signals were low-pass filtered (Melbourne: 30 Hz; Boston: 70 Hz), high-pass filtered (time constant Melbourne: 0.3 sec; Boston: 1.0 sec), and digitized online (Melbourne: sampling rate of 125 Hz; Boston: sampling rate of 256 Hz, storage rate at 128 Hz). The EOG (sampling rate in Melbourne: 125 Hz; Boston: 128 Hz) was digitally low-pass filtered (Melbourne: 30 Hz; Boston: 35 Hz) and high-pass filtered (time constant Melbourne: 0.3 sec; Boston: 1.0 sec).
To facilitate artifact-free recording of EEG and EOG, a KDT, which requires participants to remain still and fixate on a small white dot on the computer screen for 3 min with eyes open, was performed hourly during the testing day (Akerstedt and Gillberg, 1990).
Experimental Light Exposure
The experimental light exposure, which was timed to begin 3.25 h after waking on the testing day, was administered via a modified Ganzfeld dome coated with 96% to 99% reflective paint to ensure full field retinal illumination. During the experimental exposure, subjects were asked to focus on a spot at the back of the Ganzfeld dome. In Melbourne, light was generated using a mercury lamp (Focus 100R UHP, 100 W; Philips Lighting), together with ground glass diffusers, which provided uniform light distribution, and Lee neutral density filters, which were inserted to adjust the irradiance (ThorLabs Inc., Newton, NJ). In Boston, light was generated using a commercially available and adapted GoLITE for the short- and medium-wavelength light, respectively (Apollo Health, American Fork, UT). Irradiance levels were verified every 60 min during the light exposure using a spectrometer fixed at eye level (IL1400 radiometer/powermeter, International Light Inc., Peabody, MA). Participants were randomly assigned to exposure to either narrowband blue light (458 nm ± 15 nm half-peak wavelength [Melbourne] or 464 nm ± 14 nm half-peak wavelength [Boston]) or green light (551 nm ± 9 nm half-peak wavelength [Melbourne] or 560 nm ± 34 nm half-peak wavelength [Boston]) or to a no-light condition. The target irradiance at the level of the eye for the blue and green light conditions was 13.45 µW/cm2 (Melbourne)/35.3 µW/cm2 (Boston) and 11.01 µW/cm2 (Melbourne)/29.0 µW/cm2 (Boston), respectively, generating an equal photon density of 2.8 × 10¹³ photons/cm2/sec (Melbourne) and 8.4 × 10¹³ photons/cm2/sec (Boston) for both exposures. The measured irradiance, averaged between the start and end of each 60-min fixed-gazed period, was 13.24 µW/cm2 (Melbourne)/34.06 µW/cm2 (Boston) for the blue light condition and 10.99 µW/cm2 (Melbourne)/28.75 µW/cm2 (Boston) for the green light condition.
Fifteen minutes prior to the light exposure, a pupil dilator was administered (1 drop per eye, Minims Tropicamide 1% or ophthalmologic preparation of 0.5% cyclopentolate hydrochloride), after which participants wore black-out goggles until the start of the light exposure. During the monochromatic light exposure, participants were supervised continually and were asked to maintain a fixed gaze for 60 min in the Ganzfeld dome before a free gaze for 15 min, during which they moved away from the lighting unit. This sequence was repeated 3 times during the light exposure.
Sample Size
Based on effect sizes reported in a previous light exposure study (Lockley et al., 2006), a sample of 24 participants per condition was expected to yield 80% power to detect an average decrease in subjective sleepiness of 1.5 units (σ = 2.0) and 80% power to detect a decrease in the number of PVT lapses of 2.0 (σ = 2.7; α = 0.05, 1-sided).
Data Analysis
The primary outcomes of this study were changes in the aPVT and KSS as a function of light condition. Secondary outcomes included EEG, changes to mood, ocular drowsiness measures (as measured by Optalert), and higher-order cognition, as measured by the 2-back and Stroop tasks following exposure to monochromatic or no-light conditions.
Outcome measures of the aPVT included mean reaction time (RT) and number of lapses (RT >500 ms). False responses (RT <100 ms) and outliers, defined as RTs less or greater than 6 times the interquartile range, calculated for each participant and session, were excluded before the calculation of mean RT. To account for positive skew, data used in the mean RT analysis were also adjusted using the standard method of log, and PVT lapse data were adjusted using square root transformations (Dinges and Kribbs, 1991; Graw et al., 2001). We analyzed separately the interval during which participants were exposed to light and the 3-h postlight exposure in order to examine the acute alerting effects of light and whether these alerting effects persisted following the light exposure.
The waking EEG signals derived from C3/M2 (Melbourne) or Cz/Mx (Boston) during the KDT presented during dim light exposure 1 to 2 h after waking, as well as 2 h after light onset, were visually inspected for artifacts, including muscle activity, eye blinks, and saccade activity, which were subsequently removed prior to analysis. Two-second epochs were then subjected to spectral analysis by fast Fourier transform algorithm (10% cosine window), and power density data were subsequently exported for analysis in 0.5-Hz bins for frequencies between 1 and 20 Hz. Because of large interindividual differences, absolute power density during light exposure, which was used as an index of activation of the neurobiological sleep-wake regulatory system, was expressed for each participant as a percentage of the average power density during dim light exposure. EOG recordings during the KDT “eyes open” episode were also visually inspected in 30-sec epochs for incidences of slow eye movements (SEMs), defined as slow (<0.25 Hz), sinusoidal waves (>100 µV; Iber et al., 2007). The percentage of epochs containing 1 or more SEMs during the KDT 2 h after light onset was then calculated. The Optalert system provided a score on the Johns Drowsiness Scale (JDS; Johns, 1992). The mean JDS score for the last of 5 min of each aPVT was calculated, and an average was taken for each session. KSS, aPVT, POMS-Bi, JDS, and EEG (SEMs, spectral power) data were transformed to deviations from baseline for each participant. Baseline was calculated for the aPVT, KSS, JDS, and EEG as an average of the sessions 1 to 2 h after waking or the session carried out prior to the onset of light exposure (mood).
Variables of the Stroop task data included the mean RTs, calculated for congruent and incongruent stimuli separately, as well as a Stroop interference variable, which was calculated by subtracting the mean RT of congruent stimuli from the mean RT of incongruent stimuli for each participant. Error trials (i.e., trials in which the participant incorrectly named the stimuli color), trials with RTs less than 100 ms or greater than 1500 ms, were excluded prior to analysis of the mean RTs. For the 2-back task, the mean of the RT on correct match trials was used.
Statistical analyses were conducted using PASW Statistics 18 for Windows (SPSS Inc., Chicago, IL). Neurobehavioral performance measures were assessed by mixed-model analysis of covariance (ANCOVA) using light condition (independent groups) and time since light onset (repeated measures) as the independent variables, controlling for research site. To account for research site differences, site was included as a covariate. The time intervals during and after light exposure periods were assessed independently. Only significant main effect of light condition and light condition × time since light onset interactions were considered. Significant interaction effects were further subjected to Tukey honestly significant difference (HSD) test. Violations of sphericity were corrected using the Greenhouse-Geiser epsilon; however, the degrees of freedom reported in the text are based on the study design. All demographic (except for gender) and mood data were examined using 1-way analysis of variance (ANOVA), independent group t tests were used to compare the EEG power density bins between the light conditions, and chi-square test was carried out to compare gender distributions between conditions.
Of the 64 participants who began the sleep laboratory phase, 4 participants (3 of whom were randomized) were not included in the final analysis of the PVT and KSS data: 3 due to protocol violations and 1 because he or she became unwell during the blue light exposure period, deemed unrelated to the intervention. Of the remaining 60 participants, additional instances of data loss were noted due to technical difficulties or protocol violations (POMS-Bi, n = 2; Stroop, n = 3; 2-back, n = 1; Optalert, n = 6). Because of technical issues (electrical artifact), EEG data were available for spectral analysis only from a subset of participants in the blue and green light conditions (n = 14 in the green light condition, n = 13 in the blue light condition) and SEM scoring (n = 17 in the green light condition, n = 18 in the blue light condition). Insufficient data were available for analysis of EEG for the no light condition. DLMO could not be determined for participants whose melatonin levels remained less than 2.3 pg/mL during the sampling period (n = 13). DLMO could not be determined for 17 of the 60 participants. Saliva samples were not collected for 1 participant. In 1 participant, melatonin level was above the threshold (2.3 pg/mL) in the first sample, in 5 participants melatonin levels did not reach threshold, and in the remaining 10 participants, melatonin levels did not remain above threshold.
Results
Participant demographics and habitual sleep characteristics are summarized in Table 1.
Demographic and habitual sleep characteristics of participants in the blue, green, and no-light conditions.
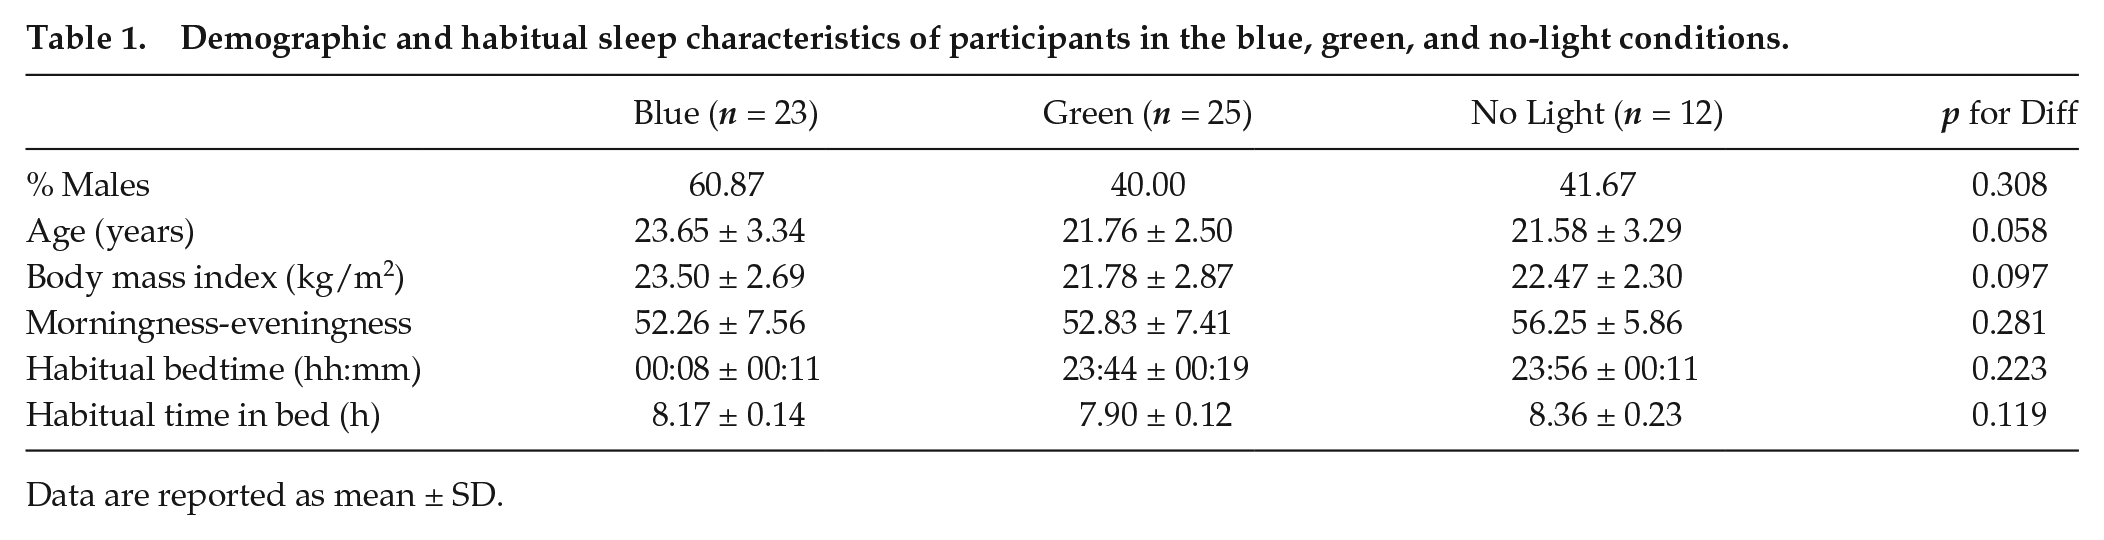
Data are reported as mean ± SD.
Circadian Timing of Light Exposure
To assess the circadian phase at which the light exposure was administered, the time of the participant’s salivary DLMO was subtracted from his or her light exposure onset time the following day. The mean ± SD time of light administration relative to DLMO did not differ between the blue (12.91 ± 1.33 h, n = 15), green (13.49 ± 0.82 h, n = 22) or no-light (13.47 ± 0.94 h, n = 6) conditions (1-way ANOVA: p = 0.239).
Auditory Psychomotor Vigilance Test
Two-way repeated-measures ANCOVA did not show a significant main effect of light condition or a significant light condition × time since light onset interaction for any aPVT measure during light exposure (i.e., mean Log RT [condition p = 0.170; interaction p = 0.126] or transformed lapses [condition p = 0.221; interaction p = 0.227]). Performance after light exposure was also not significantly affected by light condition or the interaction of light condition by time since light onset (i.e., mean Log RT [condition p = 0.794; interaction p = 0.566] or transformed lapses [condition p = 0.624; interaction p = 0.160; Fig. 2A, B]).
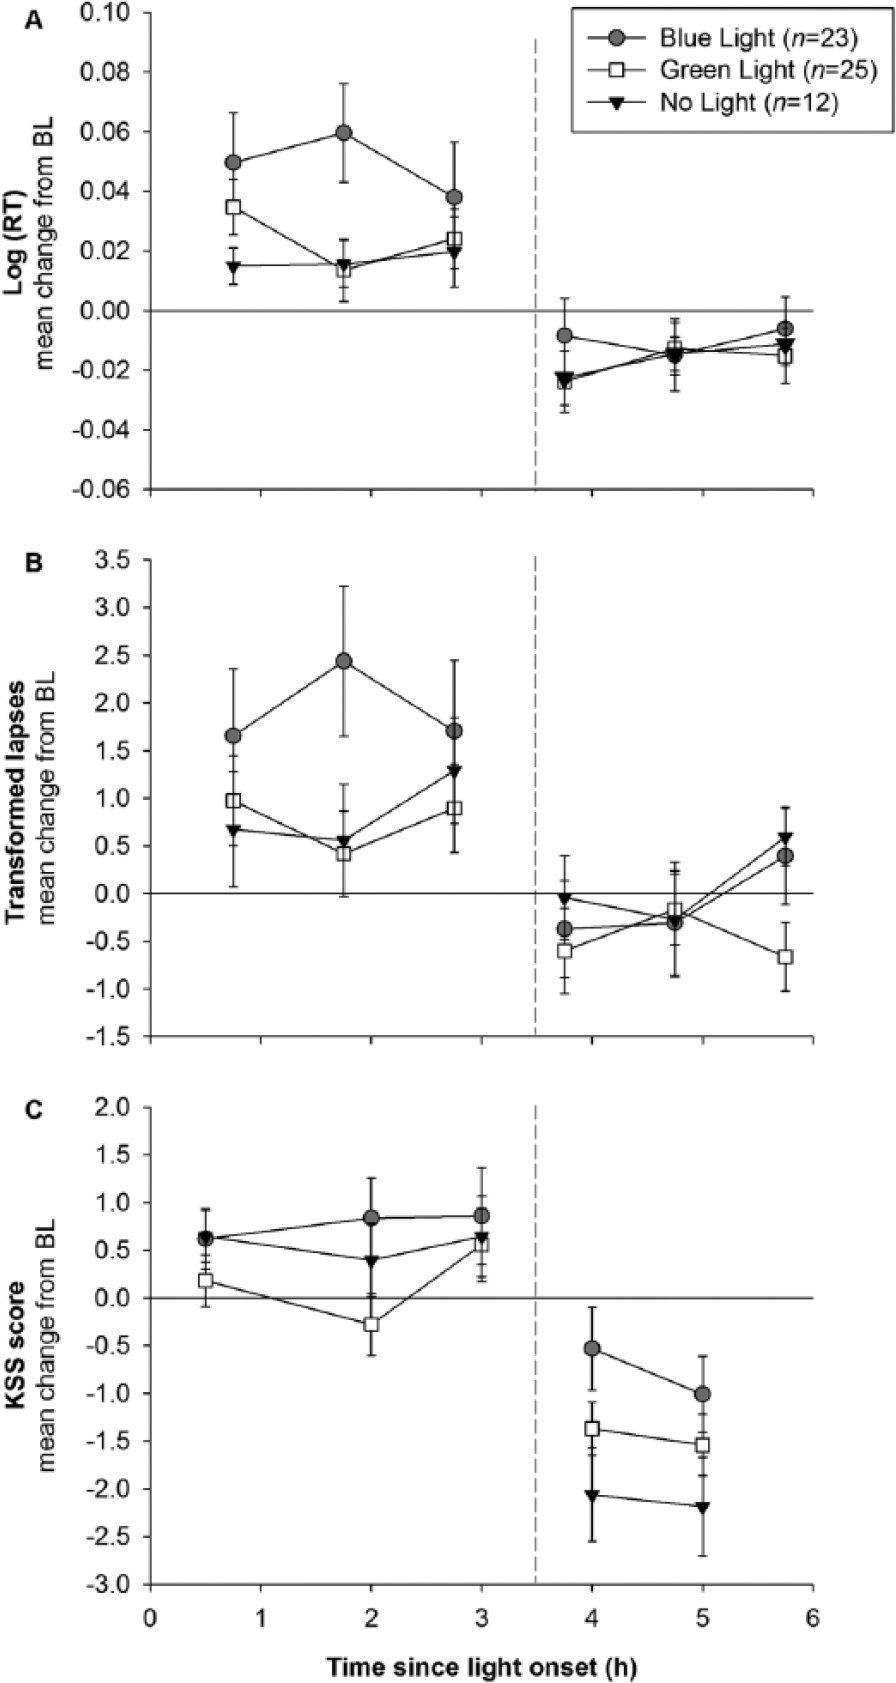
Effect of light condition on auditory psychomotor vigilance task (aPVT) performance and subjective sleepiness (Karolinska Sleepiness Scale [KSS]) during and after the light exposure period in the blue (n = 23), green (n = 25), and no-light (n = 12) conditions. Data are expressed as mean change (±SEM) from baseline (BL) in the (A) mean Log (RT) and (B) mean number of lapses (transformed √x + √x + 1) on the aPVT and (C) mean KSS score. Higher scores indicate worse performance on the aPVT and increasing levels of subjective sleepiness, respectively. BL is represented as a solid horizontal line, whereas the end of the light exposure period is represented as a vertical dashed line.
Subjective Sleepiness
The light exposure did not alter subjective sleepiness ratings. There were no main effects of light condition (during: p = 0.353, postlight: p = 0.070) or light condition by time interaction (during: p = 0.398, postlight: p = 0.601) on the KSS ratings during, or after, the light exposure (Fig. 2C).
Electrophysiological Sleepiness Measures
No significant differences in any of the EEG frequency bins were observed between the blue and green light conditions (all unpaired t tests p > 0.05; Fig. 3A), with the exception of the 11.00-Hz bin, which revealed a trend for greater power during blue as compared with green light exposure (p = 0.080). Similarly, the mean change in the percentage of epochs containing SEMs was not different between 2 light exposure groups (1-way ANOVA: p = 0.507; Fig. 3B). Finally, no significant effect of light condition was found on the JDS scores (1-way ANOVA: p = 0.458; Fig. 3C).
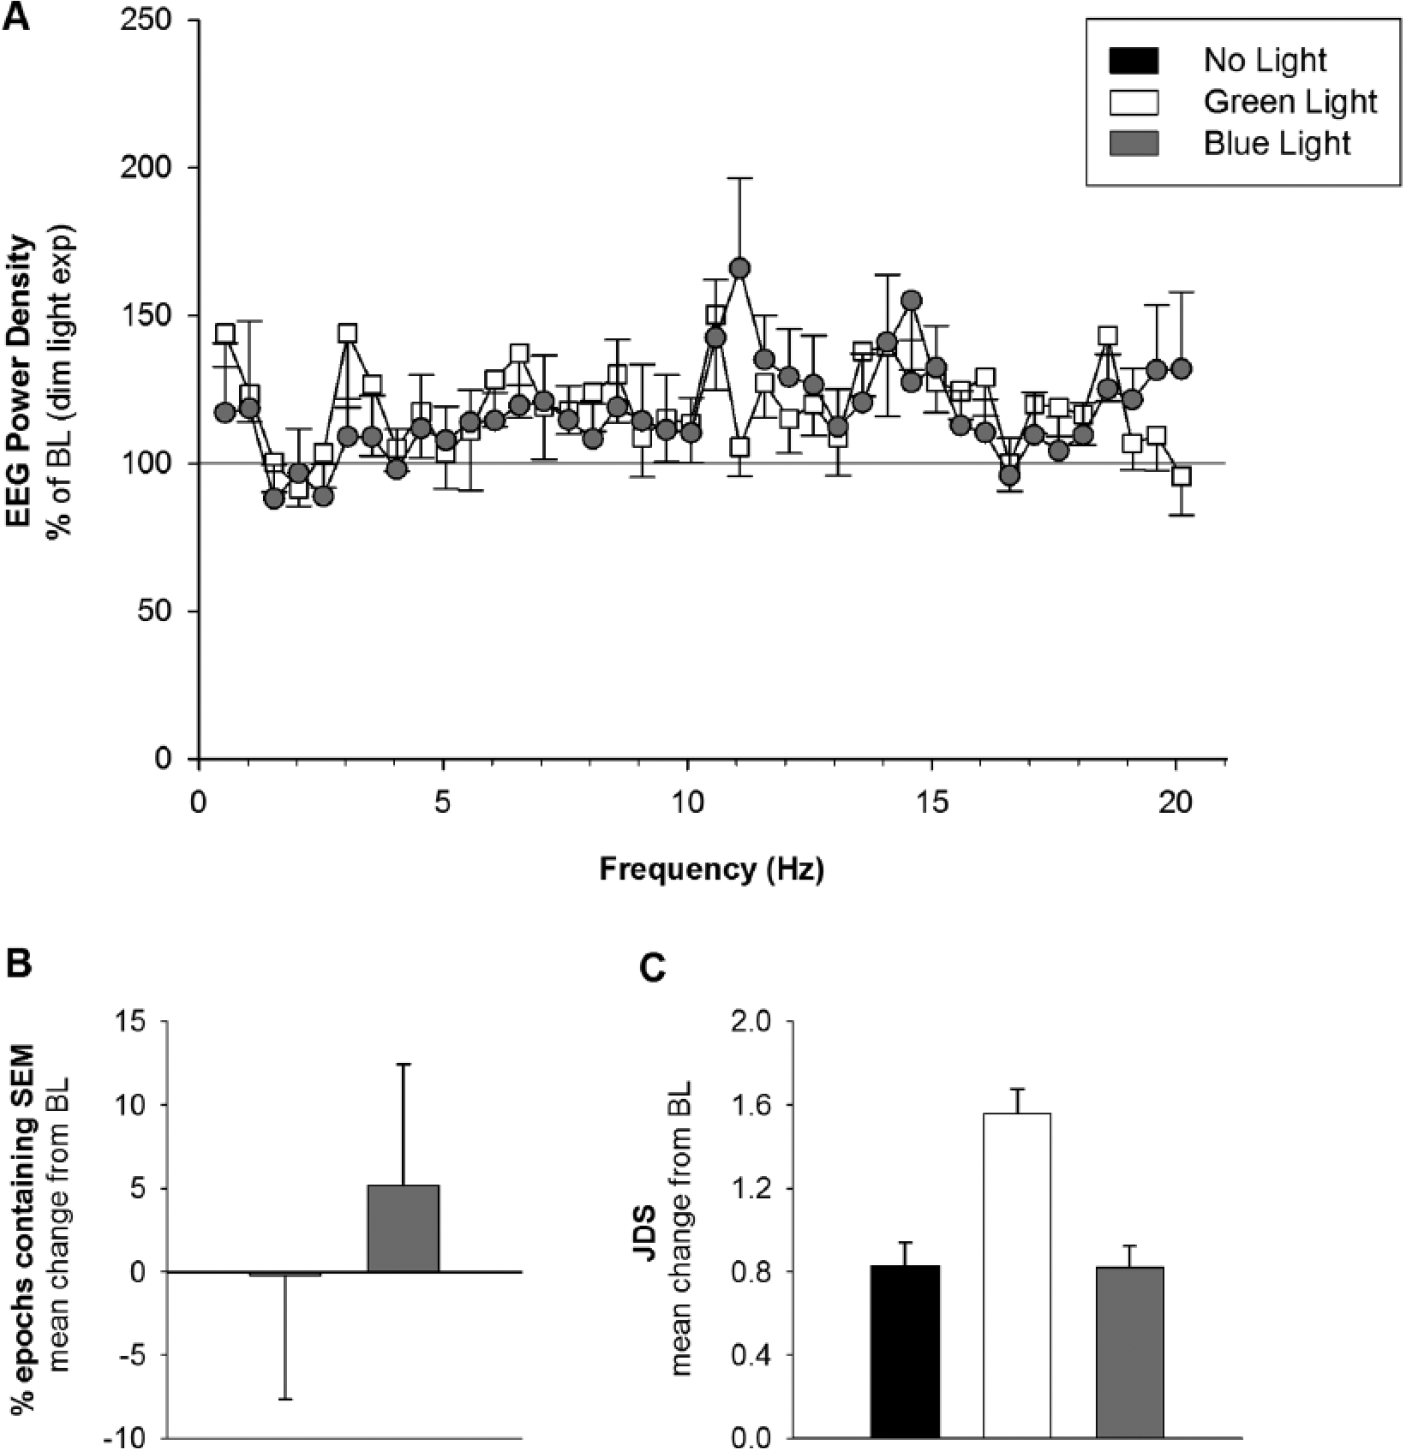
Effects of light condition on (A) electroencephalogram (EEG) profiles, (B) percentage of epochs containing slow eye movements (SEMs) during the Karolinska Drowsiness Task, and (C) mean Johns Drowsiness Scale scores during the light exposure period. Panels A and B compare data for the blue light (grey) and green light (white) conditions only; Panel C includes data for the no light (black) condition. Data are expressed as mean change (±SEM) from baseline (BL).
Mood
Self-reported mood scores on each of the POMS-Bi subscales during and after the light exposure period are represented in Figure 4. ANOVA showed a significant change from baseline in the agreeable-hostile subscale during the light exposure period (p = 0.037; Fig. 4A) but not for the other subscales. Post hoc comparisons using Tukey HSD indicated that the mean change from baseline for the blue condition (M = −1.55, SD = 1.16) was significantly different from the no-light condition (M = −2.33, SD = 0.64). The green light condition did not differ significantly from either the blue or no-light conditions.
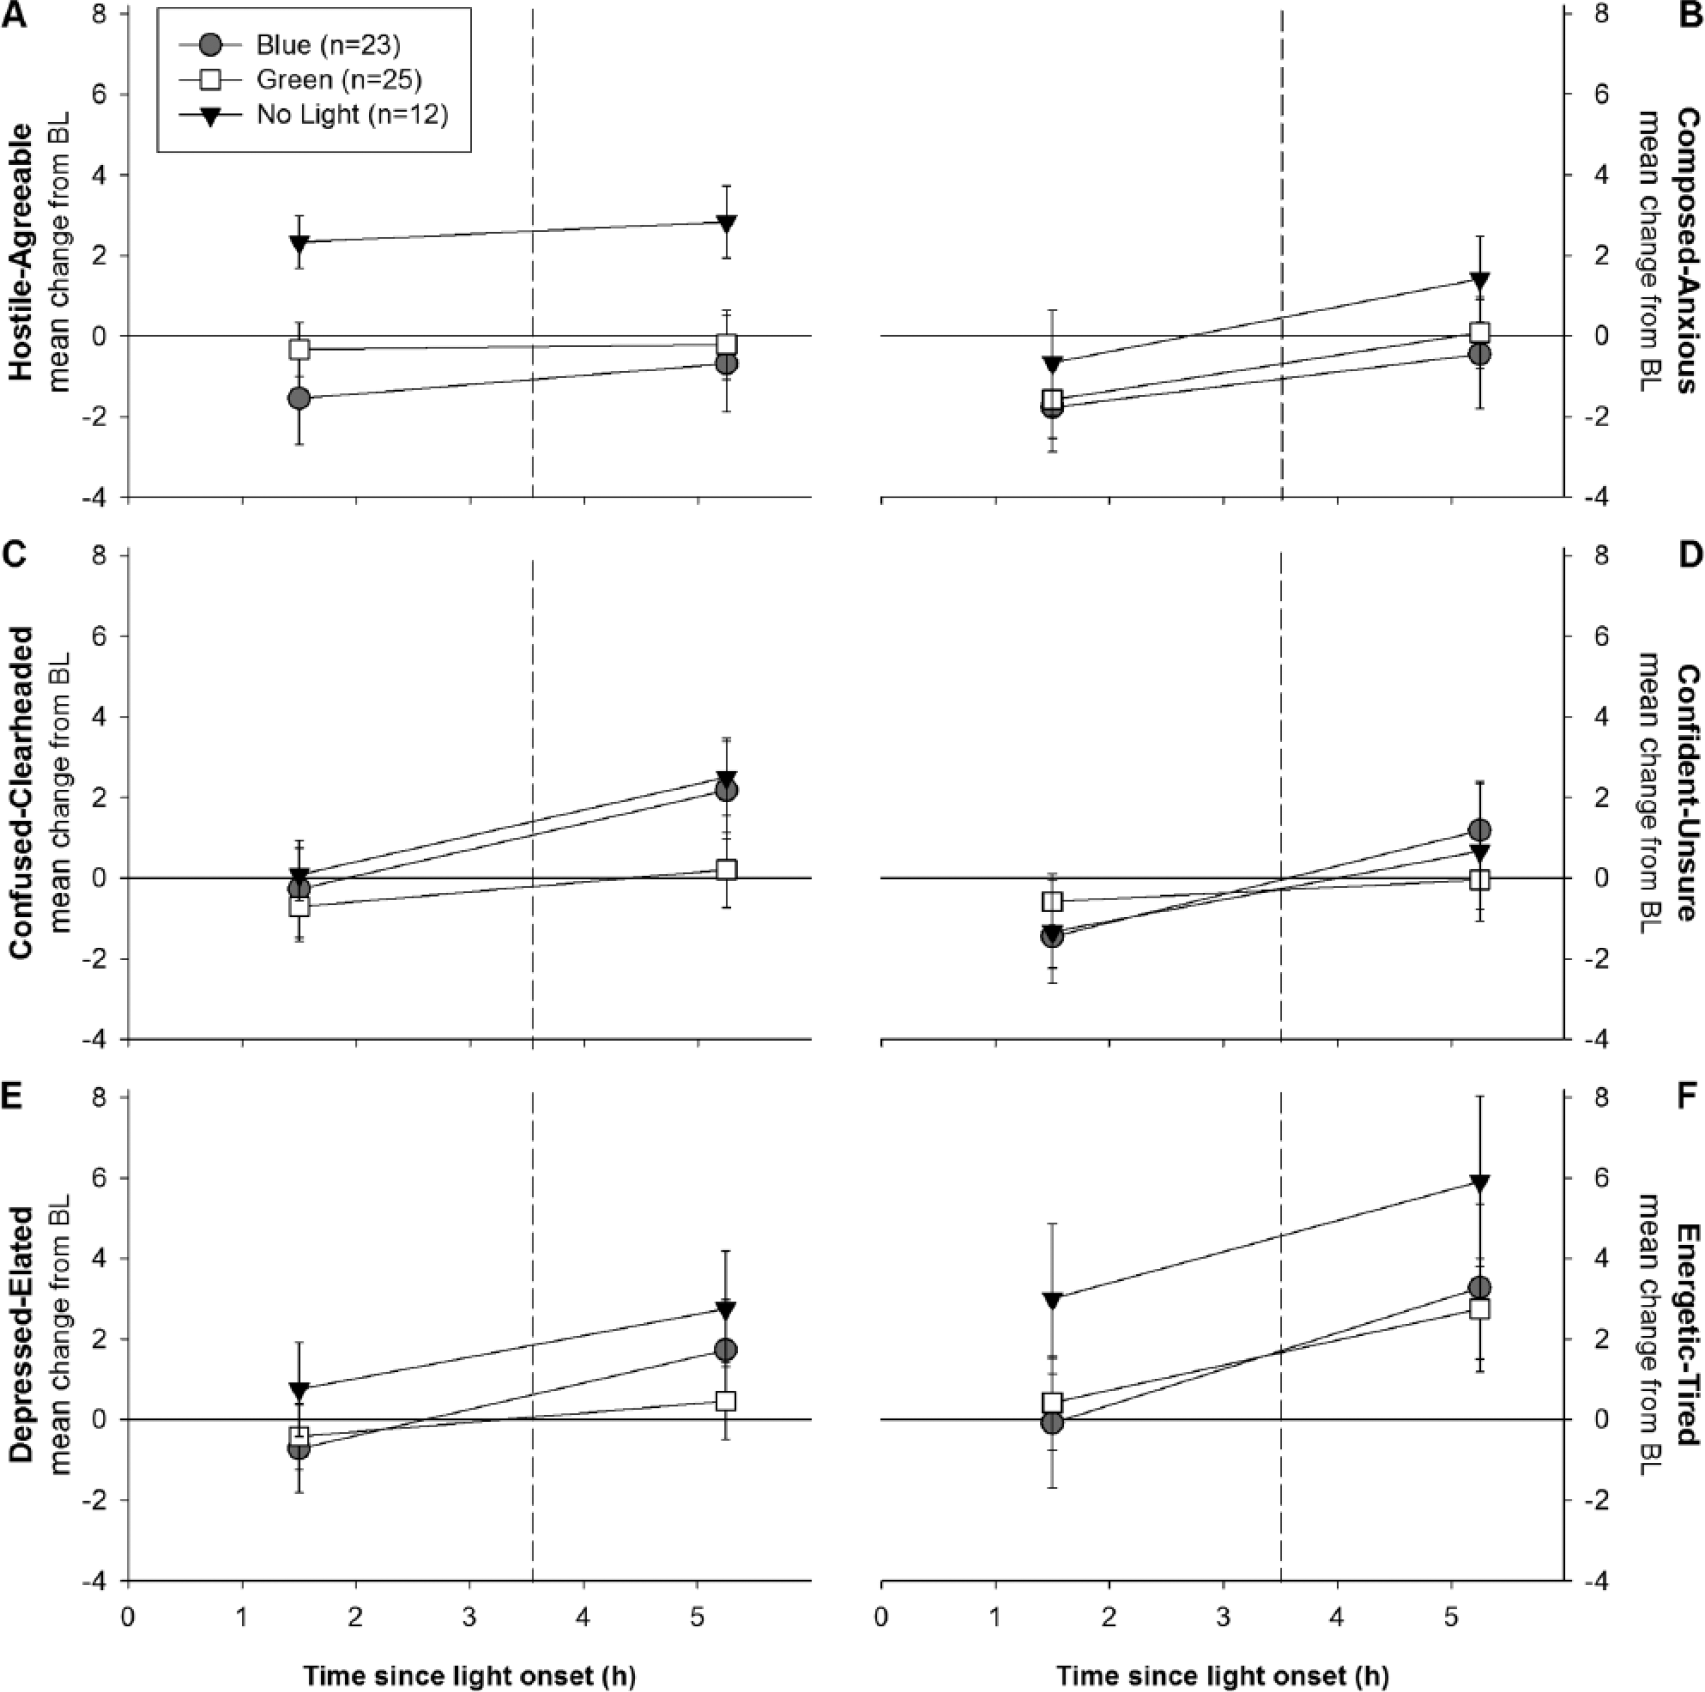
Mood during and after a 3-h exposure to blue, green, or no light. Data are expressed as mean change from baseline (±SEM) scores on the (A) Agreeable-Hostile, (B) Composed-Anxious, (C) Clearheaded-Confused, (D) Confident-Unsure, (E) Elated-Depressed, and (F) Energetic-Tired subscales of the POMS-Bi. Baseline is represented as a solid horizontal line, whereas the end of light exposure is represented as a vertical dashed line. Higher scores indicate higher levels of positive mood as illustrated by axis-label direction.
Cognitive Performance
The results from the Stroop and 2-back tasks are presented in Table 2. For the Stroop task, as expected, a significant main effect of congruency (p < 0.001) was found, such that participants experienced a significant increase in RT during incongruent trials as compared with congruent trials. The magnitude of this difference (Stroop interference) did not differ between light conditions (p = 0.168). For the 2-back task, examination of response times revealed that participants in the 3 light conditions did not differ significantly in their performance.
Reaction time on the Stroop and 2-back task in the blue, green, and no-light conditions.
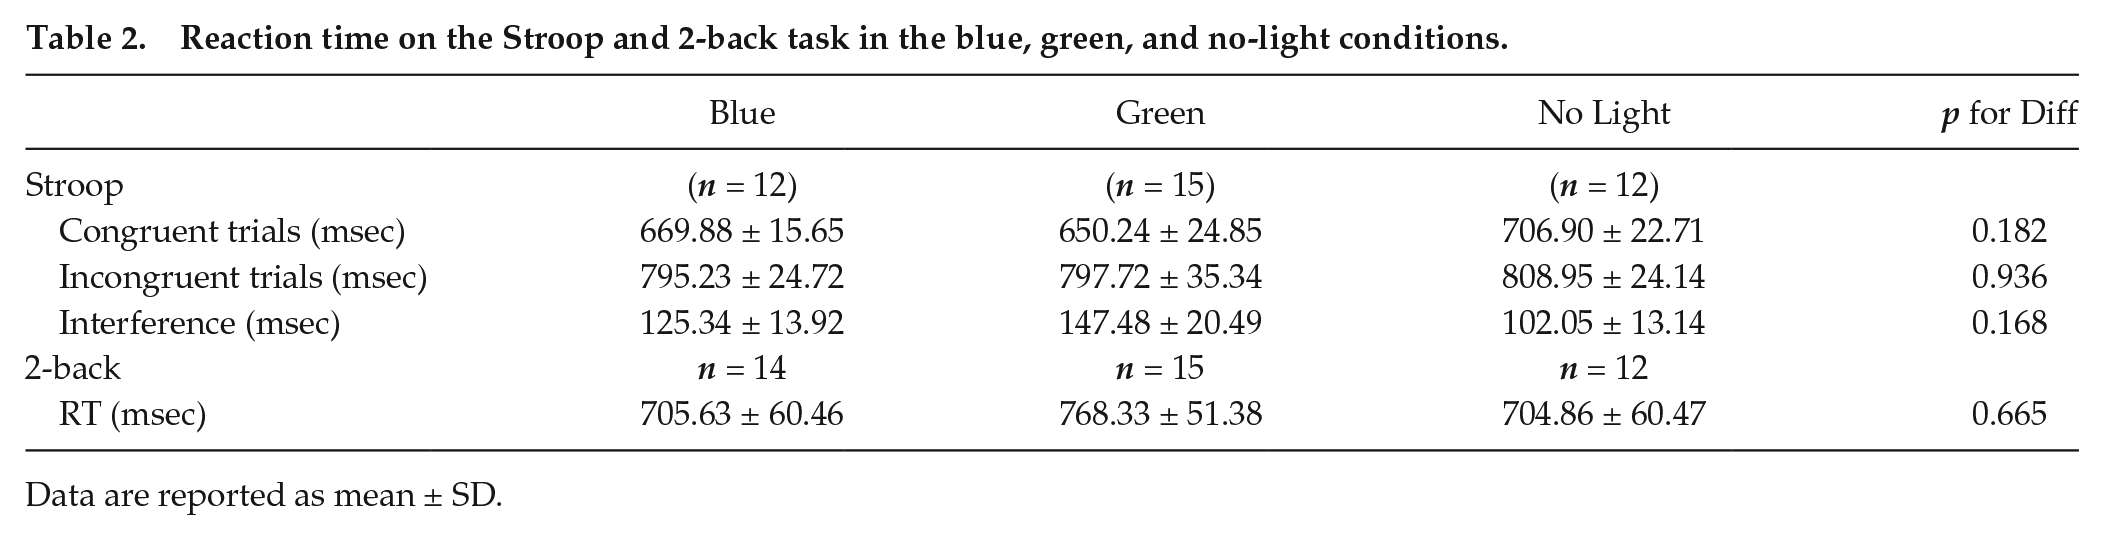
Data are reported as mean ± SD.
Discussion
The present study examined the acute alerting effects of daytime exposure to 3 h of narrowband light under controlled laboratory conditions. It was anticipated that this work would confirm previous studies that demonstrated the alertness-enhancing properties of polychromatic light (Cajochen et al., 2000; Phipps-Nelson et al., 2003) and extend findings of the short-wavelength sensitivity of the acute alerting effects of nighttime light (Cajochen et al., 2005; Lockley et al., 2006). Unexpectedly, we were not able to demonstrate a significant effect of light condition on sleepiness (as measured by KSS, JDS, and SEMs) or on psychomotor vigilance. Likewise, there were no significant effects of light on selective attention or working memory, or on self-reported mood, with the exception of the agreeable-hostile mood subscale. We did observe a nonstatistically significant trend for difference in 1 frequency bin in the high-alpha EEG band in the predicted direction.
We investigated the short-wavelength sensitivity in the alerting effects of daytime exposure to light compared with a no-light control following 2 nights of sleep restriction. The unexpected absence of any effect of narrowband light on daytime alertness may be attributable to several possible factors. These include the sample size, properties of the light exposure (i.e., timing, spectral composition, intensity, duration), and sleep-wake history (i.e., 5 h followed by 3 h time in bed, with wake time remaining constant).
While, overall, our study did not show a significant effect of light condition on alertness, performance, cognition, or mood, these results should be interpreted with caution. Because of a paucity of daytime narrowband light exposure studies at the study’s conception, preexperimental size calculations were based on previously published data from nighttime studies (Lockley et al., 2006). Empirical evidence suggests that the effects of light can be more readily observed during the nighttime as compared with the daytime (Rahman et al., 2014). This difference can be explained by the 2-process model of sleep regulation: during the night, the circadian drive for sleepiness is maximal (Dijk and Czeisler, 1994), and therefore light has more opportunity to improve alertness. During the biological day, however, arousal levels are relatively high, since the circadian system promotes alertness during the day, and the homeostatic drive for sleepiness is low based on a limited time awake (Dijk and Czeisler, 1994). It can therefore be argued that our study may have lacked sufficient power to observe differences between the light conditions, since a larger number of participants would be required during the daytime than would be estimated from nighttime data. On the other hand, work by Rahman et al., (2014), who tested the alerting effects of daytime light (460-nm vs 555-nm light; 2.8 × 10¹³ photons/cm2/sec; 6.5 h) following a 40-h constant routine and 8-h recovery sleep, demonstrated a significant improvement in psychomotor vigilance performance with 8 participants per condition, although it is noted that our studies differed in a number of important variables, including the protocols used to induce sleep loss and the timing and duration of light exposure.
Although we found a trend for difference (p = 0.08) in only a single bin in the high-alpha (11.0 Hz) region of the EEG, this finding is of interest since power density in the high-alpha range is considered a specific marker of the circadian drive of alertness (Lockley et al., 2006). Rahman et al., (2014), however, found that nighttime but not daytime exposure to blue light (460 nm) resulted in increased high-alpha power when compared with green light (555 nm), suggesting that daytime exposure to light improves alertness through its effects on homeostatic sleep drive. Further work is needed to understand the mechanisms by which light improves alertness during the daytime.
Participants in this study were subjected to 2 nights of sleep restriction to maximize the likelihood of detecting a response to the light intervention (Lafrance et al., 1998). This more severe sleep restriction paradigm differs from the majority of studies investigating the alerting effects of daytime light (e.g., Phipps-Nelson et al., 2003; Revell et al., 2006; Vandewalle et al., 2007; Sletten et al., 2009; Rahman et al., 2014). This is significant given that an emerging body of evidence indicates that chronic sleep restriction may interact with the circadian system to reduce the effectiveness of daytime light exposure with respect to other non–image-forming responses (Burgess, 2010). Consequently, our sleep restriction protocol may have unintentionally reduced the sensitivity of the circadian system to the alerting effects of light as well. It may also be possible that the sleep restriction protocol that we implemented affected homeostatic sleep pressure in a manner that reduced the ability of light to counteract this change. These protocol differences may explain the differences in our findings and those of previous studies.
Light, including short-wavelength light, is an antidepressant in some affective disorders (Glickman et al., 2005; Anderson et al., 2009) and may acutely activate the amygdala and other brain regions typically associated with emotional regulation (Glickman et al., 2005; Vandewalle et al., 2007; Anderson et al., 2009; Vandewalle et al., 2010). Our results indicate that short-wavelength (blue) light caused participants to feel more hostility, which may reflect increased arousal or activation. It has also been reported that light exposure in sleep-restricted individuals can be distressing (Horne et al., 1991). Given that we did not observe light-induced effects on other mood parameters, these findings should be considered speculative. Along with overall mood, the n-back and Stroop tasks also showed no significant effects. These findings should be interpreted with caution, however, since the study was designed to examine the primary outcomes of performance (PVT) and sleepiness (KSS) and not these secondary cognitive outcomes. Given that the sample sizes for the cognitive tasks were much smaller, it is probable that there was insufficient power to assess the secondary outcomes.
In conclusion, we found that 3 h of narrowband light, beginning 3.25 h after waking, did not influence subjective or objective measures of alertness, mood, or performance on tasks involving higher-order cognitive functions, with the exception of a single mood subscale, after 2 nights of sleep restriction. We also recognize that the experimental conditions of this study aimed to maximize the likelihood of detecting an effect of light exposure (e.g., substantial sleep restriction, fixed gaze during light exposure through a Ganzfeld dome) and used pupil dilation. These elements of the protocol would not normally be experienced under real-world conditions. Therefore, further research is needed to optimize the characteristics of lighting systems to induce alerting effects during the daytime, taking into account potential interactions between homeostatic sleep pressure, circadian phase, and light responsiveness.
Footnotes
Acknowledgements
The authors thank the research staff within the School of Psychological Sciences, Monash University, and the Division of Sleep Medicine, Brigham and Women’s Hospital, for their assistance with data collection. Special thanks to Associate Professor David Kennaway and his team (University of Adelaide) for performing the melatonin radioimmunoassay, Professor Philippa Gander and her group (Massey University) for the provision of the computerized 2-back task, and to Dr. Jennifer Redman for her invaluable assistance in the conception of this study. Optalert equipment was kindly provided by Optalert Pty Ltd (Melbourne, Australia). Phillips Lighting (Melbourne) and Apollo Lighting (Boston) provided the lighting devices. This research was supported by a National Health and Medical Research Council project grant (436758; principal investigator [PI]: Rajaratnam), a U.S. Air Force Office of Scientific Research STTR phase I grant (83337, PI: Adams, site PI: Lockley), and an investigator-initiated research grant from Apollo Health Inc. (PI: Lockley). The work conducted at Brigham and Women’s Hospital was supported by a General Clinical Research Center grant from the National Center for Research Resources (M01-RR02635). Ms. Segal received financial support through a Faculty of Medicine, Nursing and Health Science scholarship, Monash University. Dr. Flynn-Evans was supported in part by a fellowship from the Harvard Medical School Division of Sleep Medicine T32 Training Program in Sleep, Circadian and Respiratory Neurobiology (T32-HL-07901).
Conflict of Interest Statement
A.Y.S. reports no conflicting interests. T.L.S. reports that her institution has received equipment donations or other support from Philips Lighting, Philips Respironics, Optalert, and Compumedics. She serves as a project leader in the Cooperative Research Centre for Alertness, Safety and Productivity. E.E.F.-.E. reports that she is a consultant for Baby Sleep Science. S.W.L. reports that, in the past 12 months, he has received consulting fees from Serrado Capital and Atlanta Hawks and currently consults with Headwaters Inc.; Wyle Integrated Science and Engineering; PlanLED; Delos Living LLC; Environmental Light Sciences LLC; Hintsa Performance AG; Pegasus Capital Advisors LP; Akili Interactive; Focal Point LLC; OpTerra Energy Services Inc.; and Light Cognitive. He has received unrestricted equipment gifts from Bionetics Corporation and Biological Illuminations LLC and has equity or stock options in iSLEEP, Pty, Melbourne, Australia, and Akili Interactive. He has received advance author payment and/or royalties from Oxford University Press; honoraria plus travel, accommodation, or meals for invited seminars, conference presentations, or teaching from Lightfair; Informa Exhibitions (USGBC); travel, accommodation, and/or meals only (no honoraria) for invited seminars, conference presentations, or teaching from FASEB; Lightfair; and USGBC. S.W.L. holds a process patent for the use of short-wavelength light for resetting the human circadian pacemaker and improving alertness and performance, which is assigned to the Brigham and Women’s Hospital per Hospital policy (2005); has also served as a paid expert on behalf of several public bodies on arbitrations related to sleep, light, circadian rhythms and/or work hours; provided expert opinion in legal proceedings related to light, sleep, and health (confidential); and is also a program leader for the Cooperative Research Centre for Alertness, Safety and Productivity. S.M.W.R. reports that he has served as a consultant through his institution to Vanda Pharmaceuticals, Teva Pharmaceuticals, Philips Respironics, EdanSafe, The Australian Workers’ Union, National Transport Commission, and Transport Accident Commission and has through his institution received research grants and/or unrestricted educational grants from Vanda Pharmaceuticals, Takeda Pharmaceuticals North America, Philips Lighting, Philips Respironics, Cephalon, and ResMed Foundation, Rio Tinto, and reimbursements for conference travel expenses from Vanda Pharmaceuticals. His institution has received equipment donations or other support from Optalert, Compumedics, and Tyco Health-care. He has also served as an expert witness and/or consultant to shift work organizations. S.W.R. serves as a program leader and a consultant to the Cooperative Research Centre for Alertness, Safety and Productivity.