
Abstract
Relative abundance of planktic foraminifera from Eastern Arabian Sea (EAS) deep-sea sediment Core SK291/GC17 suggests surface water palaeoceanographic shifts in the EAS during ~25–3.5 calibrated kilo years before present (cal ky BP). The chronology of the studied core is established based on fifteen AMS 14C dates derived from a mixed planktic foraminiferal assemblage and using the ‘Bacon R’ statistical package. Between ~21 and 19 ky BP, the mixed-layer oligotrophic planktic foraminifera, such as Globigerinoides ruber and Trilobatus spp. show higher abundance, whereas eutrophic species like Globigerina bulloides and Globigerinita glutinata show a decreasing trend. Pulleniatina obliquiloculata, which thrives in the deeper segment of the thermocline, shows consistently low abundance in the same interval. These changes in planktic foraminiferal abundance imply that upwelling-related productivity declined due to a subdued Indian Summer Monsoon (ISM) during the Last Glacial Maximum. Following the LGM, a significant shift in monsoon-induced productivity occurs at ~11.0 kyr BP, overlapping with the onset of the early Holocene. The low relative abundances of oligotrophic planktic foraminifera and an increase in eutrophic species, including P. obliquiloculata, indicate an increasing influence of the strong ISM in the EAS during the early Holocene. Another significant change in planktic foraminifera is observed from ~6.0 to 3.5 kyr BP, where the abundance of G. bulloides and P. obliquiloculata drastically reduces in this interval, suggesting a weakening of ISM winds and thermocline deepening/or a possible shifting of the upwelling centre due to sea-level rise. A decrease in G. bulloides mean abundance—from ~11.3% in the early Holocene to ~6.9% in the mid-late Holocene—indicates a regional contrast. Correlation with other Arabian Sea datasets suggests that spatial hydrographic variability in the EAS is linked to changes in ISM intensity.
INTRODUCTION
The monsoonal winds play a crucial role in driving upwelling in the Eastern Arabian Sea (EAS) along the western coast of India. In this region, due to the impact of strong Indian Summer Monsoonal winds, nutrient-rich subsurface water comes up to the surface (Wyrtki, 1973). Back in 1985, Zhang conducted the first detailed study about the spatial distribution of living planktic foraminiferal assemblages in the water column of the EAS (~10°N–15°N), which revealed higher planktic foraminiferal abundance, mainly in the upper water column. The variation in the abundance and assemblage of living planktic foraminifera in the EAS seemed to be driven more by upwelling rather than seasonal changes in temperature and salinity (Zhang, 1985). Later on, Naidu et al. (1992) observed a decreasing trend of G. bulloides in the surface sediment samples from the southern to northern coastal regions of the EAS and suggested that the intensity of upwelling is relatively weaker along the Goa coast (~15°N), compared to the southern EAS. Gupta et al. (2011) reconstructed the intensity of upwelling since the LGM on the basis of the relative abundance of G. bulloides in the northern EAS and found regional incoherency in upwelling intensity across the Arabian Sea. Therefore, the variation in planktic foraminiferal abundance in the EAS can serve as a proxy for reconstructing monsoonal variability during the late Quaternary. However, only a few studies have been conducted on the late Quaternary planktic foraminiferal assemblage in the shallow waters of the EAS (e.g., Saravanan et al., 2019, 2020; Singh, 1998). Here, based on Core SK291/GC17, we examine whether temporal changes in outer-shelf planktic foraminiferal assemblages off Goa track Indian Summer Monsoon (ISM)-driven upwelling and associated productivity since ~25,000 cal yr BP. This study utilises a higher sampling resolution combined with updated taxonomy and groupings of planktic foraminifera. Also, it represents a north-south comparison of published G. bulloides records in the EAS.
STUDY AREA
The deep-sea core sediment (Core SK291/GC17) was collected from off the coast of Goa, EAS (15°07.64′N;72°56.69′E), at a water depth of ~182 m (Figure 1) during the Sagar Kanya expedition number 291 ORV. In the EAS, upwelling generated by the ISM spans from the southernmost margin of the western Indian coastline (~8°N) to the offshore sector of Goa (~15°N) (Rao et al., 2008; Smitha et al., 2008). This process is accompanied by a seasonal shoaling of the thermocline during summer and its subsequent deepening in winter (Antoine et al., 1996).
(a) Chlorophyll a concentration in the EAS in the summer and winter seasons. Maps are prepared using chlorophyll data from NASA Aqua-MODIS Level 3 (https://oceandata.sci.gsfc.nasa.gov/l3/ ) (NASA Goddard Space Flight Centre, Ocean Biology Processing Group, 2023), downloaded from https://oceancolor.gsfc.nasa.gov , in SeaDAS 9.0.1 (NASA Goddard Space Flight Centre, Ocean Biology Processing Group, 2023). (b) A zoomed-in site map showing the bathymetric contours based on ETOPO1 Global Relief Model (Amante & Eakins, 2009). Base map prepared in Ocean Data View software (Schlitzer, Reiner, Ocean Data View, https://odv.awi.de , 2022). (c) Summer monsoon wind vectors from July to September 2017 (Data Set: CCMP monthly v2 (Atlas et al., 2011). Asia-Pacific Data Research Centre (APDRC) Live Access Service (LAS8.6) (https://apdrc.soest.hawaii.edu/las86/ )). The location of Core SK291/GC17 is shown with a solid black square, and the nearby site locations are marked with blue-coloured circles.
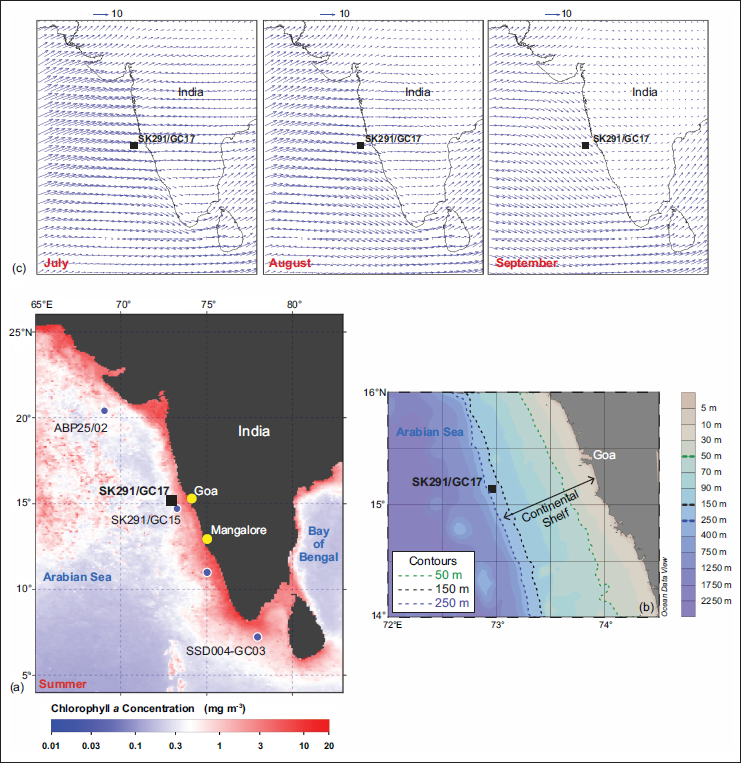
In the offshore waters of Goa, a mature stage of upwelling was observed during the peak and waning stages of the ISM (Habeebrehman et al., 2008). Weak to moderately intense upwelling is reported along the coastal sector between Mangalore and Goa, spanning approximately 13°N to 15°N and is mainly confined to the coastal belt (Smitha et al., 2008). As a consequence of ISM wind-induced upwelling, a higher chlorophyll a concentration is seen in summer months, whereas a low chlorophyll a concentration is witnessed during winter months (Figure 1). Additionally, the existence of an intermediate nepheloid layer was found to be associated with high microbial metabolic rates in the EAS (Naqvi et al., 1993) and a benthic nepheloid layer was observed at ~70 m depth on the inner shelf off the Goa coast (Desa et al., 2005). Earlier studies based on the clay mineralogy and sediment transport from the western continental shelf of India suggest long-distance transport of fine-grained sediment along the shelf. In contrast, cross-shelf transport is relatively much less (Ramaswamy & Nair, 1989).
MATERIAL AND METHODOLOGY
A total of 137 samples from the top 1.78 m Core SK291/GC17 (subsampled at 1 cm intervals from top to 100 cm and subsampled at 2 cm intervals from 100 to 178 cm) were analysed to investigate the planktic foraminiferal assemblage. Sediment samples were processed using the method mentioned in Saravanan et al. (2019). The relative abundance studies of major planktic foraminifera species were obtained from an aliquot of around 300 individuals from the >149 µm size fraction (Saravanan et al., 2019). As Peeters et al. (1999) stated that most planktic foraminifera species with a size greater than 149 µm reach the adult stage of ontogeny in the Arabian Sea, we preferred to use this size fraction for our study. Moreover, this standard method has been followed by previous researchers to study planktic foraminiferal assemblages in the western (e.g., Gupta et al., 2003; Ivanova et al., 2003; Naidu & Malmgren, 1995) as well as the EAS (Ivanova et al., 2003; Naik et al., 2017; Saravanan et al., 2020). However, one of the shortcomings of using the >149 µm fraction is the underestimation of both small and large planktic foraminiferal species (Peeters et al., 1999). The taxonomy and census counting of planktic foraminiferal species were performed under a stereo zoom microscope following the methods of Kennett and Srinivasan (1983) and Hemleben et al. (2012). The updated nomenclature of planktic foraminifera species was carried out by using the online database ‘Mikrotax’ (Huber et al., 2017;
The age model for Core SK291/GC17 was established based on 15 14C dates using a mixed planktic foraminiferal assemblage (Majumder, Gupta, Kumar, et al., 2022; Majumder et al., 2024). The raw dates were run in ‘R’ using the ‘Bacon R’ package (Blaauw, 2010; Blaauw & Christen, 2013; Blaauw et al., 2018; R Core Team, 2013). The ‘Bacon R’ package uses an in-built Marine20 calibration curve (Heaton et al., 2020). To account for regional correction, ∇R = 84 ± 51 years (Southon et al., 2002) was applied before running the age-depth model. The mean age per sample is ~120 years. The raw and calibrated ages (see Supplemental Table S1) and the age-depth model discussed by Majumder et al. (2024) are discussed in detail.
RESULTS AND DISCUSSION
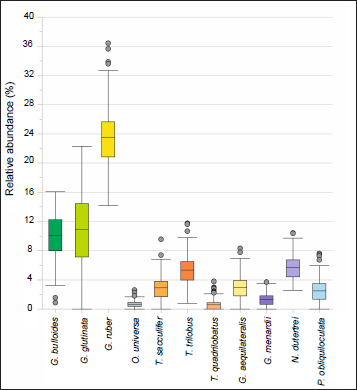
In Core SK291/GC17, the major planktic foraminifera species identified and counted are G bulloides (d’Orbigny, 1826), G glutinata (Egger, 1893), Gruber (d’Orbigny, 1839), O. universa (d’Orbigny, 1839), T.sacculifer (Brady, 1877), T. trilobus (Reuss, 1850), T. quadrilobatus (d’Orbigny, 1846), Globigerinella siphonifera (d’Orbigny, 1839) (Synonym, Globigerinella aequilateralis (Brady, 1879)), G. menardii (Parker, Jones & Brady, 1865, after d’Orbigny, 1826 nomen nudum), N. dutertrei (d’Orbigny, 1839), P. obliquiloculata (Parker, Jones & Brady, 1865). The planktic foraminiferal SEM images are shown in Plates 1 and 2. A box-and-whisker plot is used to depict the range, mean and outliers in the relative abundances (%) of planktic foraminiferal species. In this plot, the whiskers represent the farthest data points that lie within 1.5 times the interquartile range (IQR) of both the lower and upper quartiles. The data points outside this range were identified as outliers. 137 samples represent each taxon (Figure 2). In terms of mean and maximum values of relative abundance, G. ruber is the most dominant species in the planktic foraminiferal assemblage in Core SK291/GC17. Its relative abundance varies from ~14.2% to 36.4% (Figure 2), with a mean abundance of 23.6 ± 4.4% (1 SD). The second most frequent species is G. glutinata with a mean abundance of 10.9 ± 4.5% (1 SD), and its abundance varies between zero and ~22.3% in the entire time slice (Figure 2). The third most abundant planktic foraminifer is G. bulloides, showing a mean abundance of 10.0 ± 3.0% (1 SD). The rest of the planktic foraminifera species show much less mean abundance (<5%) in the studied interval (Figure 2).
Box and whisker plot showing the range of relative abundance and mean values of planktic foraminiferal species in Core SK291/GC17, from ~25,000 to 3,500 cal yr BP. Solid grey circles represent the outliers.
Temporal variation in planktic foraminiferal relative abundances
The widespread occurrence of G. bulloides and its linkage to coastal upwelling in the Arabian Sea is well established. Although G. bulloides is primarily a temperate to subpolar taxon, it also thrives in tropical upwelling regions where cold, nutrient-rich subsurface waters rise toward the surface (Kucera, 2007; Schiebel & Hemleben, 2017). In such environments, particularly along coastal zones influenced by strong monsoonal winds, this species often becomes a dominant component of planktic foraminiferal assemblages (Kroon, 1991; Prell & Curry, 1981).
Schulz et al. (2002) found the highest abundance and flux of G. bulloides from August to October (during the ISM) in the northern Arabian Sea. Based on these rationales, the variation in the relative abundance of G. bulloides has been used to reconstruct long-term to short-term variation in ISM-driven upwelling in different parts of the Arabian Sea (Anderson & Prell, 1993; Gupta, 2008; Gupta et al., 2003, 2011; Ivanova et al., 2003; Majumder et al., 2024). In the present study, however, it would be trivial to distinguish the different driving mechanisms of productivity by the relative abundance of G. bulloides alone. In Core SK291/GC17, between ~22.0 and 19.0 Kyrs BP, the relative abundance of G. bulloides is relatively low with an average value of ~9%. Afterwards, this species shows a mean value of ~12% between ~12.0 to 6.0 Kyrs BP, which coincides with the early Holocene wet interval. G. bulloides percentage declined between ~6.0 and 3.5 Kyr BP (Figure 3a). In the EAS off the Goa coast, the intensity of upwelling decreased at the beginning of the LGM and showed a slight increase in the early Holocene. However, the strength of upwelling was significantly reduced during the mid-late Holocene, coinciding with a weak phase of the ISM (Figure 3a), as suggested earlier by Majumder et al. (2024). A Wilcoxon rank-sum test was performed between these intervals. The test shows that the relative abundance (±SD) was 10.4% ± 2.1% during the LGM and 11.3% ± 2.4% during the early Holocene, with no statistically significant difference (p > .05) between the two intervals. In contrast, the difference in mean abundance between the early Holocene (11.3% ± 2.4%) and mid-late Holocene (6.9% ± 3.3%) is statistically highly significant (p < .001).
Relative abundance of planktic foraminifera from Core SK291/GC17: (a) Globigerina bulloides (Majumder et al., 2024), (b) Globigerinita glutinata, (c) Oligotrophic group of planktic foraminifera (Globigerinoides ruber + Trilobatus spp.), and (d) Pulleniatina obliquiloculata (Majumder, Gupta, Sanyal, et al., 2022). (e) δ13C (‰, VPDB) of G. ruber in Core SK291/GC17 (Majumder et al., 2024). (f) δ18O (‰, VPDB) of speleothem MWS-2 from Mawmluh cave (Jaglan et al., 2021). (g) G. bulloides (%) in ODP 723A, western Arabian Sea (Gupta, 2008). (h) Relative sea level (m) curve (De Boer et al., 2014) and July solar insolation curve at 65°N (Berger & Loutre, 1991) are shown at the top. Five-point running averages are shown with thick lines (except the topmost panel). Mean values are shown with dotted horizontal lines. The cold intervals are marked with light grey bars, and the warm interval is marked with a light orange bar. The radiocarbon-dated horizons are marked with inverted black triangles.
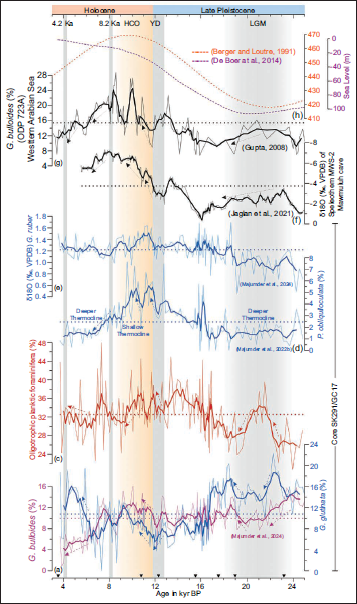
The second most abundant species in Core SK291/GC17 (Figure 2) is G. glutinata. The relative abundance of G. glutinata is superimposed on the G. bulloides curve to understand their differential responses to the strong and weak phases of upwelling and productivity. G. glutinata is capable of surviving across broad temperature and salinity ranges (Bé & Hutson, 1977) and is also associated with marginal upwelling in low-latitude oceans (Fairbanks et al., 1982; Pflaumann & Jian, 1999; Thunell & Reynolds, 1984). Recently, Bali et al. (2020) linked the temporal distribution of G. glutinata to reconstruct productivity during the Pliocene-Pleistocene transition in the western equatorial Pacific. G. glutinata is an opportunistic planktic foraminifer which preferentially dwells in the nutrient-rich waters and mixed layer of the water column (Crundwell et al., 2008; Mohtadi et al., 2005). In the upwelling system along the Peru and Chile coast, the presence of G. glutinata closely follows the response of G. bulloides to the nutrient-rich upwelled waters. However, unlike G. bulloides, the abundance of G. glutinata is concentrated chiefly away from the coastal region (Mohtadi et al., 2005). In the northern part of the Arabian Sea, the high abundance of G. bulloides was seen from August to October, whereas the high flux of G. glutinata peaked between September and November (Schulz et al., 2002). In the studied core, G. glutinata shows higher values during two intervals: from ~24.0 to 18.0 and ~6.0 to 3.5. kyr BP in comparison to the relative flux of G. bulloides. Though the relative abundance of G. glutinata shows an increasing trend from ~12.0. to 8.5. kyr BP, the overall abundance during this interval is much less compared to the former two intervals mentioned (Figure 3b). In the Arabian Sea waters, G. glutinata is known to harbour facultative symbionts (i.e., either lack or contain symbionts (Hemleben et al., 2012). This can allow G. glutinata to either effectively utilise high-nutrient conditions or thrive in oligotrophic, nutrient-deficient conditions (Seears et al., 2012), which complicates the use of this species as a palaeoproductivity proxy.
The most frequent planktic foraminifer in the studied core was G. ruber, a warm mixed-layer species that thrives in oligotrophic waters in tropical to subtropical regions. This species is abundantly found in stratified waters outside of the upwelling zone (Bé & Tolderlund, 1971). G. ruber occurred in the warm surface water column throughout the year (Farmer et al., 2007; Thirumalai et al., 2014). Zhang (1985) found that G. ruber dominated over T.sacculifer and other species in a sediment-flux study in the offshore waters of Goa. At the studied site, the other important oligotrophic species of planktic foraminifera are T sacculifer, T. quadrilobatus and T. trilobus (Figure 2). They are all tropical, warm, mixed-layer and shallow-dwelling in nature (Bé & Hutson, 1977; Bé & Tolderlund, 1971) and are frequently found in poor-nutrient environments (Bijma et al., 1990).
Variability in oligotrophic surface waters off Goa was inferred from the distribution of G. ruber and Trilobatus spp. (Figure 3c). The oligotrophic assemblage shows an increasing trend from ~23.0 to 21.0 kyr BP, followed by a decline between ~21.0 and 19.0 kyr BP. A similar reduction occurs again during the interval ~12.0–8.0 kyr BP (Figure 3c).
In the studied core, though with a low mean abundance (~2.5%), P. obliquiloculata shows quite interesting trends during the cold intervals. This species varies from 0% to ~7.6% over the entire studied interval, with very low values during the periods of ~24.0 to 18.0 and 7.0 to 3.5 kyr BP (Figure 3d). In modern oceans, P. obliquiloculata thrives in the upper thermocline water (Ravelo et al., 1990); so, its variation in abundance can indicate shoaling and deepening of the thermocline (Li et al., 1997). A sudden decrease of P. obliquiloculata during the late Holocene (~4.5 to 3.5 ka) was observed in the western Pacific Ocean, which was referred to as the Pulleniatina Minimum Event (PME) and was mainly driven by changes in the Kuroshio Current or the reduced winter SSTs (e.g., Jian et al., 2000; Li et al., 1997; Lin et al., 2006). Similarly, in the Andaman Sea, distinctly low values of P. obliquiloculata were observed between ~4.5 and 3.0 ka, as well as in the LGM. However, unlike the western Pacific, the PME in the Andaman Sea was driven by the deepening of the thermocline (Sijinkumar et al., 2011). Low relative values of P. obliquiloculata in the EAS during the LGM and mid-late Holocene, including the 4.2 ka event (Figure 3d), were possibly driven by reduced upwelling intensity and the associated deepening of the thermocline.
From ~6.0 to 3.5 kyr BP, the relative population of G. glutinata and G. bulloides show a diverging trend (Figure 3a and 3b). The opposing trend in these two species in the middle to late Holocene could be attributed to the shifting of the upwelling zone, resulting in a decline in G. bulloides populations and a subsequent increase in G. glutinata populations. Moreover, these two species are also reported to occupy different realms in an active upwelling zone. A rise in sea level during the early to middle Holocene may have shifted the core of the upwelling zone towards the coast and away from the studied site, leading to a change in the flux of G. bulloides and G. glutinata.
Upwelling along the western coast of India
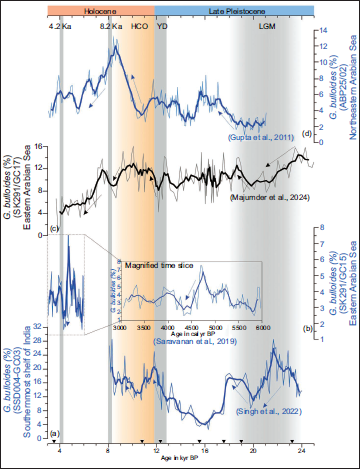
G. bulloides is widely considered as an upwelling indicator in the Arabian Sea (Kroon, 1991; Prell & Curry, 1981), where its relative abundance has been used to understand variations in upwelling and ISM winds strength during different time scales (Anderson & Prell, 1993; Gupta, 2008; Gupta et al., 2003, 2011; Ivanova et al., 2003; Majumder et al., 2024). We have correlated the relative population of G. bulloides and δ13C (‰, VPDB) of G. ruber (Figure 3e) from Core SK291/GC17 (Majumder et al., 2024) with other published records of δ18O (‰, VPDB) of speleothem MWS-2 (Figure 3f) from Mawmluh cave (Jaglan et al., 2021), relative abundance of G. bulloides (Gupta, 2008, Figure 3g) from nearby sites in the EAS (Supplemental Table S2) also with the relative sea level (m) curve (De Boer et al., 2014) along with solar insolation curve at 65°N (Figure 3h) observed during July (Berger & Loutre, 1991). At the beginning of the LGM, the intensity of upwelling was relatively higher in the southernmost part of the EAS. We have compared the relative abundance of G. bulloides from different locations along the western continental margin of India [Figure 4 (a) SSD004-GC03, southernmost EAS, Singh et al., 2022; (b) Core SK291/GC15, EAS, Saravanan et al., 2019; (c) Core SK291/GC17, EAS, Majumder et al., 2024; (d) ABP25/02, northern EAS (Gupta et al., 2011)]. As we gradually move toward the central EAS, the intensity of upwelling decreases. During the LGM, the overall intensity of upwelling in the southernmost region was higher compared to the central and northern EAS (Figure 4).
Relative abundance of G. bulloides from different locations along the western continental margin of India. (a) SSD004-GC03, southernmost EAS (Singh et al., 2022), (b) Core SK291/GC15, EAS (Saravanan et al., 2019), (c) Core SK291/GC17, EAS (Majumder et al., 2024), (d) ABP25/02, northern EAS (Gupta et al., 2011). Five-point running averages are shown with thick lines. The cold intervals are marked with light grey bars, and the warm interval is marked with a light orange bar. The radiocarbon-dated horizons are marked with inverted black triangles.
CONCLUSIONS
Relative abundances of planktic foraminiferal records from the studied Core from EAS suggest a substantial shift in surface palaeoceanographic conditions from ~25.0 to 3.50 kyr BP. Between ~21.0 and 19.0 kyr BP, which concurs with the LGM, the oligotrophic, mixed-layer planktic foraminifera like G. ruber and Trilobatus spp. show high abundances, whereas eutrophic species G. bulloides and G. glutinata show a decreasing trend. These trends in planktic foraminiferal abundance suggest a decreased surface productivity linked to a weak ISM during the LGM. A significant shift in the monsoon-induced productivity occurs at ~11.0 kyr BP, coinciding with the beginning of the early Holocene. During this interval, a decreasing trend in oligotrophic planktic foraminifera (G. ruber and Trilobatus spp.), an increase in eutrophic species (G. bulloides) and P. obliquiloculata indicate that the ISM strengthened in the EAS. The last significant change is observed from ~6.0 to 3.5 kyr BP. The lower relative abundance of G. bulloides and P. obliquiloculata suggests a weak ISM wind strength and thickening of the warm mixed layer. Compared to the southern and central EAS, G. bulloides abundance in the northern EAS shows markedly low values during the LGM. Most likely, the overall intensity of the ISM was not much reduced in the southern EAS during the glacial phase. However, it is difficult to conclude whether the G. bulloides in the southern EAS reflected less weakening of the ISM or strengthening of the winter monsoon. In this context, mixed signals of a weak ISM and strong winter monsoon would be challenging to resolve.
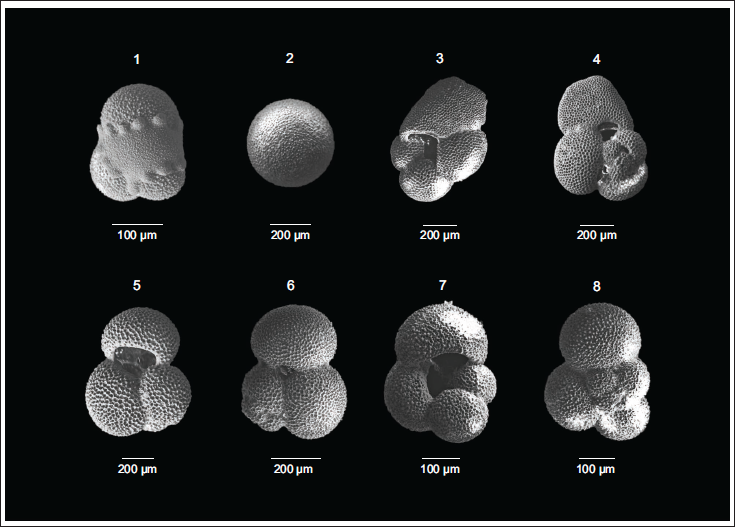
The SEM images of (1) Globigerinita glutinata (Umbilical view), (2) Orbulina universa (Side view), (3) Trilobatus sacculifer (Umbilical view), (4) Trilobatus sacculifer (Spiral view), (5) Globigerinoides ruber (Umbilical view), (6) Globigerinoides ruber (Spiral view), (7) Globigerina bulloides (Umbilical view), (8) Globigerina bulloides (Spiral view), from Core SK291/GC17.
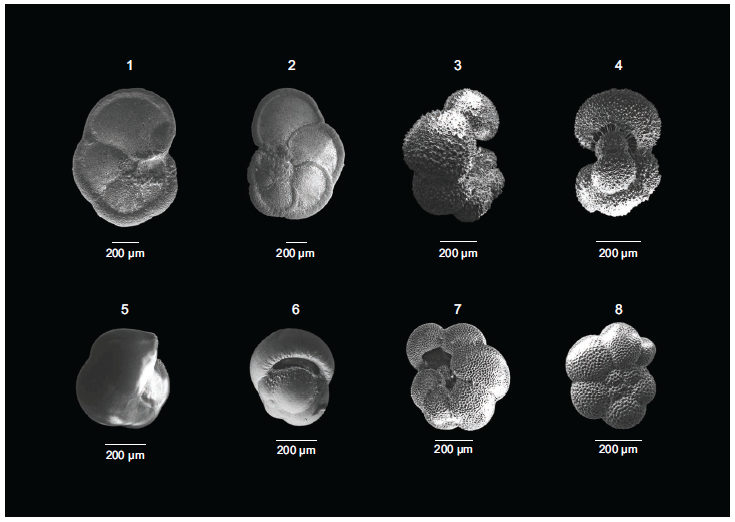
The SEM images of (1) Globorotalia menardii (Umbilical view), (2) Globorotalia menardii (Spiral view), (3) Globigerinella siphonifera (Side view), (4) Globigerinella siphonifera (Apertural view), (5) Pulleniatina obliquiloculata (Side view), (6) Pulleniatina obliquiloculata (Apertural view), (7) Neogloboquadrina dutertrei (Umbilical view), (8) Neogloboquadrina dutertrei (Spiral view), from Core SK291/GC17.
Footnotes
Acknowledgements
The authors express their gratitude to NCPOR, Goa, for supplying the samples used in this investigation, collected during the Sagar Kanya research cruise SK291. We are thankful to A.D. Singh for his assistance in the taxonomic identification of planktic foraminifera. A.K.G. also acknowledges the support received from ANRF, New Delhi, through the Sir J. C. Bose Fellowship (Grant No. JBR/2021/000019).
Data Availability Statement
All datasets produced from Core SK291/GC17 and used in this study are available through the Zenodo digital repository (Majumder et al., 2025). Previously published information includes the relative abundance of G. bulloides and the δ¹³C (‰, VPDB) values of G. ruber from the upper 1.78 m of the same core (Majumder et al., 2024). Additional paleoclimate datasets employed for comparison were sourced from existing literature: July insolation at 65°N (Berger & Loutre, 1991), global sea-level estimates (De Boer et al., 2014), speleothem δ¹⁸O (‰, VPDB) record from MWS-2 in Mawmluh cave, northeast India (Jaglan et al., 2021) and G. bulloides relative abundance records from cores SSD004-GC03 (Singh et al., 2022), SK291/GC15 (Saravanan et al., 2019) and ABP25/02 (Gupta et al., 2011).
Declaration of Conflicting Interests
The authors declared no potential conflicts of interest with respect to the research, authorship and/or publication of this article.
Funding
The authors disclosed receipt of the following financial support for the research, authorship and/or publication of this article: JM gratefully acknowledges the Council of Scientific and Industrial Research (CSIR), New Delhi, for awarding the fellowship (SPM-06/081(0258)/2017-EMR-I). AKG appreciates the support received through the Sir J. C. Bose Fellowship (JBR/2021/000019), funded by the Anusandhan National Research Foundation (ANRF), Department of Science and Technology, Government of India, which facilitated this research.
Supplemental Material
References
Supplementary Material
Please find the following supplemental material available below.
For Open Access articles published under a Creative Commons License, all supplemental material carries the same license as the article it is associated with.
For non-Open Access articles published, all supplemental material carries a non-exclusive license, and permission requests for re-use of supplemental material or any part of supplemental material shall be sent directly to the copyright owner as specified in the copyright notice associated with the article.