
Abstract
Chilika Lagoon, the largest brackish water lagoon in India and a Ramsar site, exhibits a highly dynamic ecology primarily governed by shifts in its sea mouth, which regulate freshwater–seawater exchange and influence sedimentation and faunal diversity. This study assessed ecological variability in the Chilika Lagoon over the last 200 years using a foraminifera record retrieved from a 72 cm sediment core recovered from the seaward region of the lagoon. The sediment deposition rate was ascertained using the 210Pb value. Principal component analysis of foraminifera abundance data, added with cluster analysis, suggests the prevalence of four major ecological phases in the lagoon over the last 200 years. Between 1820 and 1940
INTRODUCTION
Coastal lagoons are dynamic landforms that link mainland river systems to the open sea through multiple channels. It is typically separated from the ocean by extensive barrier spits punctuated by small tidal inlets (Pradhan et al., 2022). The morphology and hydrodynamics of lagoons are strongly influenced by the periodic opening and closing of tidal inlets, which play a pivotal role in maintaining ecological balance by regulating salinity regimes, sedimentation patterns, water circulation, and energy fluxes within the lagoon system (Chacón Abarca et al., 2021).
Chilika Lagoon, situated on the eastern coast of India, is Asia’s largest brackish water lagoon, recognised as one of the most geomorphologically and ecologically dynamic coastal systems (Mishra et al., 2022). This extensive shallow basin undergoes marked seasonal fluctuations in area and water volume, influenced by monsoonal freshwater input and marine tidal inflow (Barik et al., 2019; Das et al., 2024). Over the last century, Chilika has experienced substantial ecological and hydrological transformations, driven by natural forces and increasing anthropogenic pressures (Mishra et al., 2022; Sahu et al., 2014). The frequent opening and closing, as well as morphological instability, of its sea mouths have significantly altered tidal connectivity, disrupting salinity distributions and circulation patterns, which in turn have contributed to episodic variations in the lagoon ecosystem (Sahu et al., 2014). These environmental challenges have drawn considerable attention at the international level, resulting in Chilika’s designation as a Ramsar Wetland of International Importance in 1981 and its subsequent listing in the Montreux Record in 1993—a register of wetlands facing significant ecological threats—highlighting the urgent need for informed conservation efforts (Sarkar et al., 2012).
Microfaunal assemblages, particularly benthic foraminifera, have proven to be highly sensitive bioindicators of environmental changes in coastal lagoons (Nigam, 2005). Previous studies (Barik et al., 2019, Barik et al., 2022a; Das et al., 2024) have documented the impact of seasonal variations in salinity, wave action, and tidal regimes on the abundance and diversity of foraminifera in Chilika Lagoon. The distribution and composition of foraminifera provide significant insights into environmental parameters, including salinity variations, oxygen concentrations, sediment properties, and organic matter content, rendering them reliable proxies for reconstructing historical ecological conditions (Barbieri et al., 2019; Barik et al., 2019, 2022a). Hence, this study focuses on reconstructing ecosystem variability over the last two centuries and the role of sea mouth dynamics using benthic foraminifera assemblages.
STUDY AREA
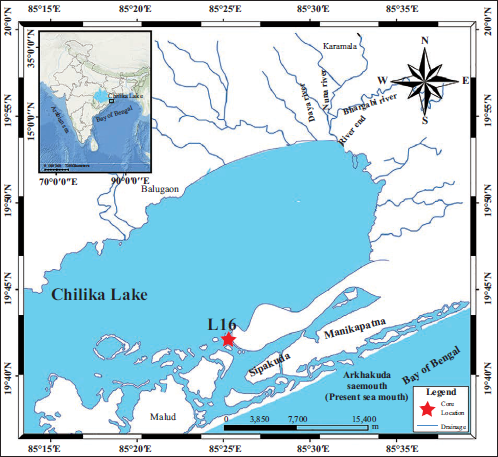
Chilika Lagoon, located between 85°06′ and 85°35′ E and 19°28′ and 19°54′ N (Figure 1). This shallow lagoon with an average water depth of 2.5 m covers an area of over 1,100 km2 during the monsoon. It shrinks to ~900 km2 in the dry season, demonstrating significant seasonal and spatial variability (Barik et al., 2019). The northern portion of the lagoon receives considerable freshwater and sediments from the distributaries of the Mahanadi River system, including the Daya, Bhargavi, and Nuna Rivers (Figure 1). The lagoon is separated from the Bay of Bengal by a 65 km long barrier spit (Baral et al., 2023). Active sea inlets, shaped and altered by natural processes and human activities, maintain tidal exchange (Figure 1; Baral et al., 2023; Panigrahi et al., 2007). The saline water of the bay mainly influences the seaside region/the outer channel of the lagoon. The lagoon is globally recognised for its rich biodiversity that supports extensive seagrass meadows, over 200 species of fish, 263 species of holoplankton, large populations of migratory birds, and threatened species such as the Irrawaddy dolphin, diverse benthic foraminifera, ostracods and other microbial communities (Barik et al., 2022b; Ghosh et al., 2006; Srichandan & Rastogi, 2021). This complex ecology underscores the lagoon’s value as an ideal site for understanding cross-ecosystem interactions in this brackish wetland environment.
Study area map showing Chilika lagoon in India, Chilika lagoon with its major tributaries, the core location, and the present mouth. The default topographic base map of the region is taken from ArcGIS 10.4.
METHODOLOGY
Sample collection
A 72 cm long gravity sediment core was collected from the seaside region of the Chilika Lagoon in May 2016 using a gravity corer from the L16 monitoring station of Barik et al. (2019) (henceforth L16 core; 85º24′12.3′′E, 19º42′7.6′′N, water depth ~1.8 m). The core was divided into two halves, which were further subsampled at 1 cm intervals. One-half of the sample was used for micropaleontological analysis, while the other half was preserved/used for sedimentological and geochemical studies.
Age model
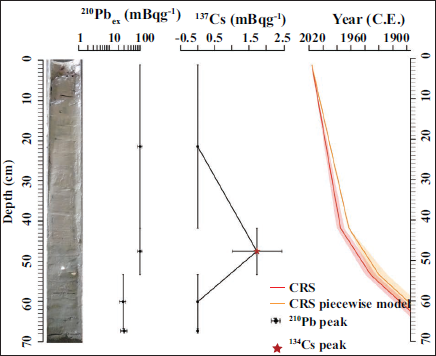
The age model for the L-16 sediment core was established using a combination of 210Pb-derived sedimentation rates and the 137Cs activity peak at 41.5 cm, which served as a chronological marker for the 1963 nuclear fallout event (Aravind et al., 2024). Approximately 10 grams of freeze-dried sediment sample from depths of 15–17, 26–27, 32–33, 42–43, 54–55, and 68–69 cm were processed and analysed for 210Pb activity using Mirion High Purity Germanium (HPGe) gamma spectrometry with a broad energy detector BE-6530 at the Sediment Laboratory of Nanyang Technological University, Singapore. All radionuclide activities were decay-corrected to 2016. Sediment ages were determined using the constant rate of supply (CRS_PW) model, implemented via the R package Serac (Bruel & Sabatier, 2020). The CRS model assumes a constant flux of excess 210Pb to the sediment surface while allowing for temporal variation in sediment accumulation rates, following the approach described by Appleby and Oldfield (1978). The resulting age-depth model was cross-validated using the 137Cs activity profile to ensure chronological accuracy.
Benthic foraminifera abundance and diversity calculation
The standard method described in Barik et al. (2019) is followed for micropaleontological analysis. Approximately 20 gm of freeze-dried samples were taken and wet sieved over a 63 µm sieve, and manually analysed under the stereo zoom microscope. Individual specimens of benthic foraminifera are identified up to genus and, wherever possible, up to species level following Loeblich and Tappan (1988) and Scott (2000). The number of foraminifera specimens in the samples is counted and converted to foraminifera specimens per gram of dry sediment. Samples with fewer than 15 specimens are considered foraminifera-free in statistical analysis. Furthermore, in each sample, the number of species (S) and species diversity, measured in terms of the Shannon diversity index H(S), were calculated using Shannon and Wiener’s equation (Shannon & Weaver, 1949).

Where S is the species richness (species present in the sample), pi is the proportion of the ith species in the sample, and ln is the natural logarithm.
STATISTICAL ANALYSIS
Principal Component and Cluster Analysis
Principal component analysis (PCA) was carried out on selected data (i.e., major benthic foraminifera species, total calcareous foraminifera per gram of dry sediment, total agglutinated foraminifera per gram of dry sediment, Shannon diversity index, and coarse fraction of processed sediments, i.e., >63 µm) using the FactoMineR package in R software (Lê et al., 2008; RStudio Team, 2023) to identify the key factors influencing faunal distribution and sediment characteristics. Variables were grouped by k-means clustering to assess the ecological association. Furthermore, the samples (temporal data) were grouped using Q-mode cluster analysis, which was performed using Ward’s minimum linkage method in R software (RStudio Team, 2023).
RESULTS
Age model data interpretation
The age model data of the studied sediment core were developed using a combination of excess 210Pb and 137Cs activities. The excess 210Pb activity was observed in three samples (from depths 42–43, 54–55, and 68–69 cm). In contrast, a distinct 137Cs activity in one sample at 41.5 cm was assigned to 1963
Short-lived radionuclide measurements and age-depth model for the core (L16) of the Chilika Lagoon sediment. From left to right: core photo, 210Pbex activities, 137Cs activities, and the age model (CRS and CRS_pw).
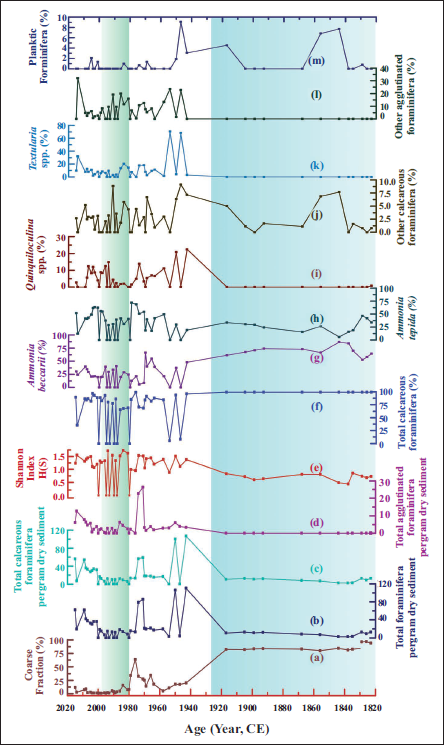
Foraminifera variability over the last ~200 years
The coarse fraction (%) was high from 1820 to 1920
Variation of (a) Processed coarse sediment fraction (>63 µm; %), (b) Total foraminifera per gram dry sediment, (c) Total calcareous foraminifera per gram dry sediment, (d) Total agglutinated foraminifera per gram dry sediment, (e) Shannon Diversity Index, (f) Total calcareous foraminifera (%), (g) Ammonia beccarii (%), (h) Ammonia tepida (%), (i) Quinquiloculina spp. (%), (j) Other calcareous foraminifera (%), (k) Textularia spp. (%), (l) Other agglutinated foraminifera (%), (m) Planktic foraminifera (%) over the last 200 years in L16 core. The blue region indicates restricted lagoon conditions; the green denotes the most ecologically dynamic phase.
Statistical data interpretation
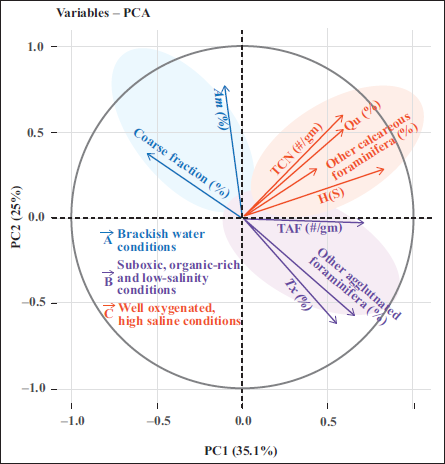
The first two principal components (PC1 and PC2) in PCA accounted for 60.1% of the overall variance. The k-means clustering of variables suggests the existence of three ecosystems of foraminifera over the last 200 years (Figure 4). Group ‘A’ is characterised by Ammonia spp. and a higher coarse fraction (%), indicative of brackish water conditions with restricted seawater inflow into the lagoon. Group ‘B’ comprises total agglutinated foraminifera (TAF, #/gm), Textularia spp. (%), Moreover, other agglutinated taxa, reflecting a low-salinity environment with minimal marine influence or a stagnant water regime. Group ‘C’ comprises total calcareous foraminifera (TCF, #/gm), Quinqueloculina spp., other calcareous foraminifera, and species diversity, suggesting a high-salinity and productive marine-influenced environment.
Principal Component Analysis of the major microfauna assemblages (Ammonia spp. (Am, %), Quinquiloculina spp. (Qu, %), other calcareous foraminifera (%), Textularia spp. (Tx, %), other agglutinated foraminifera (%)), total calcareous foraminifera per gram dry sediment (TCN, #/gm), total agglutinated foraminifera per gram dry sediment (TAN, #/gm), Shannon Diversity Index (H(S)), and coarse fraction (%).
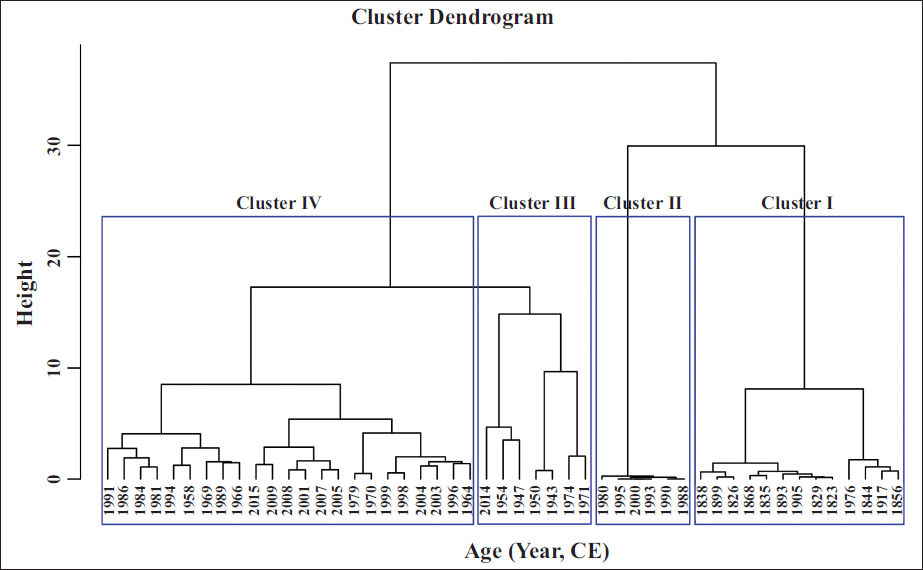
The Q-mode cluster analysis categorised the samples into four significant clusters, each corresponding to specific ecological phases (Figure 5). Cluster I comprises the sample between 1826 and 1940
Q-mode cluster analysis of L16 core based on the microfaunal data.
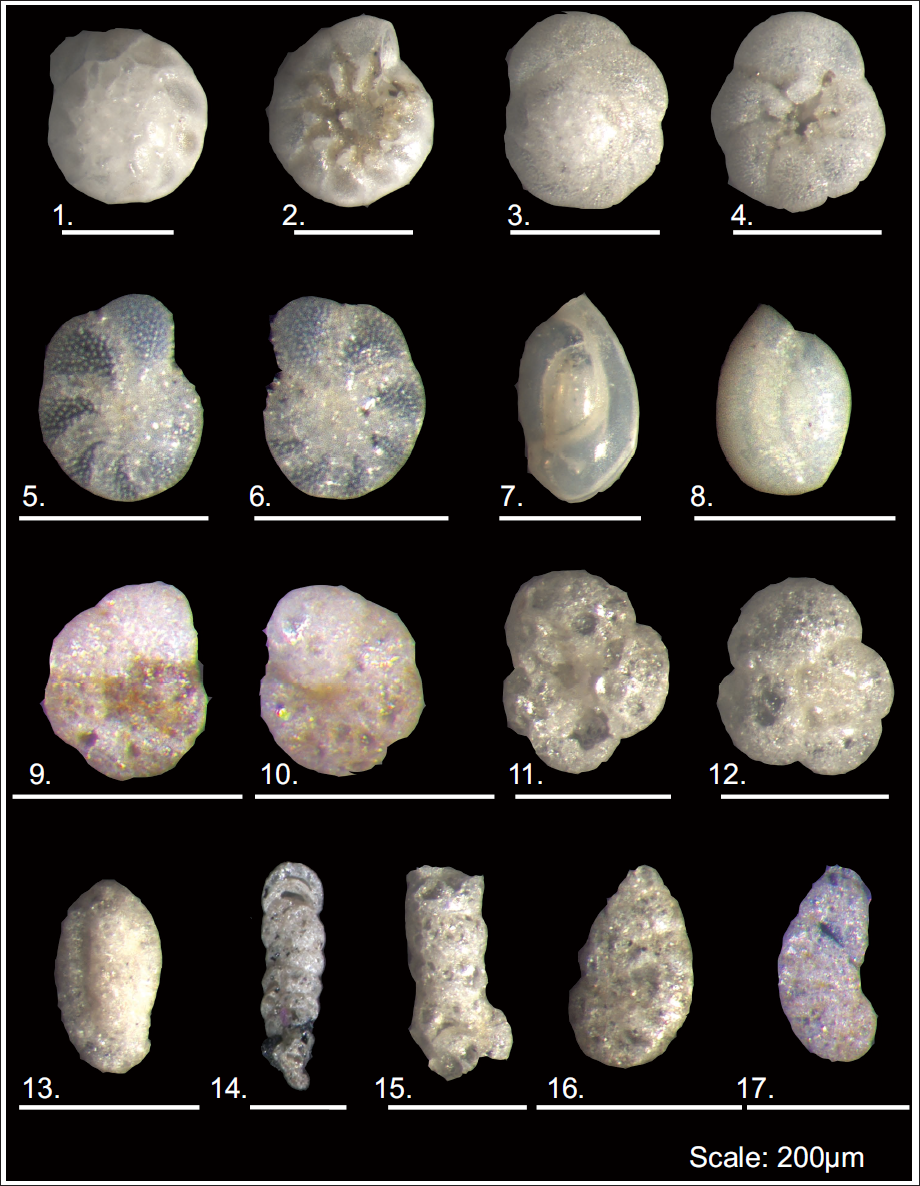
1. Ammonia beccarii (spiral view); 2. Ammonia beccarii (umbilical view); 3. Ammonia tepida (spiral view); 4. Ammonia tepida (umbilical view); 5-6. Elphidium excavatum (side view); 7. Quinqueloculina seminulum (side view); 8. Quinqueloculina sp. (side view); 9-10. Haphlophragmoides sp. (side view); 11. Trochammina inflata (apertural view); 11. Trochammina inflata (side view); 13. Miliammina fusca (side view); 14. Textularia sp. (side view); 15. Ammobacculite sp. (side view); 16. Ammotium sp. (side view); 17. Ammotium sp. (side view). Scale: 200 µm.
DISCUSSION
The seaward region of the lagoon is influenced by wave action and experiences two distinct conditions seasonally, namely brackish and marine environments (Barik et al., 2019; Das et al., 2024). Over the last 200 years, the barrier spit and lagoon sea mouth have experienced repeated transformations (Mishra & Jena, 2014; Mishra et al., 2022; Panda et al., 2013). It is driven by large volumes of sediment carried by distributaries of the river Mahanadi and the wave and tide actions from the Bay of Bengal (Mishra & Jena, 2014; Mishra et al., 2022; Sahu et al., 2014). The occurrences of periodic cyclones also influence the sea mouth position and its width. The periodic closing, shifting, and formation of new inlets and freshwater cause a major impact on the lagoon’s hydrological dynamics, resulting in notable shifts in salinity levels and affecting the ecological balance (Gopikrishna et al., 2014; Pradhan et al., 2017; Sahu et al., 2014). The frequent changes in the lagoon’s hydrological dynamics directly affect the population dynamics, distribution, and diversity of benthic foraminifera over time (Nigam, 2005).
Cluster I, comprising periods of 1820–1940
From the early 1940s to the late 1990s
However, between 1958 and 1970
Cluster II corresponds to the period between 1980 and 1995
The Cluster IV, which encompasses the brief periods between 1958 and 1970 and the post-2000 phase (Figure 5), is characterised by elevated species richness, higher abundances of calcareous foraminifera (Figure 3), and is consistent with well-flushed, oxygenated, and moderately to highly saline conditions. This interval reflects the period of ecological improvement characterised by enhanced salinity, increased hydrodynamic exchange, and overall habitat recovery. The assemblage represented by the group ‘C’ of the PCA (Figure 4) includes taxa such as Quinqueloculina spp., and other calcareous foraminifera (%), which are known to thrive in marine-influenced environments with high saline conditions, low organic matter content, and stable oxygen levels (Narciso-Mezones et al., 2025). These ecological signals suggest hydrological and geomorphological transitions, either through natural mouth realignments or anthropogenic interventions, which facilitated enhanced seawater inflow and sediment export, reversing the earlier phases of ecological stress. Notably, the most significant recovery occurred after the artificial mouth opening at Sipakuda in 2000 CE, an intervention that restored lagoon sea connectivity, increased tidal flushing, stabilised salinity gradients, and improved oxygen availability, thereby fostering a resurgence in benthic foraminifera productivity and biodiversity (Figure 3; Panda et al., 2013; Tripati & Vora, 2005). This period marks a critical phase in the ecological restoration of Chilika Lagoon, as evidenced by both biotic and physicochemical indicators.
Overall, the L16 core data suggest a shift from a low-diversity, stressed, restricted ecosystem during 1830–1920
CONCLUSIONS
The dynamic nature of the Chilika Lagoon is primarily governed by the shifting, opening, and closing of the lagoon inlet, which exerts significant control over its ecological and hydrodynamic regime. These geomorphological changes have resulted in three distinct environmental phases. From 1820 to 1940
Footnotes
Acknowledgements
We are grateful to Prof. Ashutosh K. Singh for the kind invitation to publish in the 29th ICMS special issue and to both anonymous reviewers for their constructive suggestions.
Data Availability Statement
Data are available and will be sent on request.
Declaration of Conflict of Interests
The authors declared no potential conflicts of interest with respect to the research, authorship and/or publication of this article.
Funding
The authors disclosed receipt of the following financial support for the research, authorship and/or publication of this article: DST-INSPIRE; NRSC – ISRO; Ministry of Earth Science. SR acknowledges DST-INSPIRE (IF200111) for the financial support. Indian Institute of Technology Bhubaneswar is acknowledged for providing infrastructure and financial support to SSB and SD. RKS acknowledges NRSC- ISRO (RP-359) and MoES (RP-88) for financial support.