
Abstract
The Pliocene, although predominantly warm, experienced four major glacial events at 4.8, 4.0, 3.3, and 2.7 million years ago (Ma), altering ice sheet dynamics and ocean circulation. This study reconstructs Agulhas Current (AC) variability using planktic foraminiferal census and stable oxygen isotope data from IODP Hole U1474A. Eleven AC weakening events were identified—five in the Early Pliocene (4.35–3.6 Ma) and six in the Late Pliocene (3.4–2.67 Ma). These coincide with glacial expansions and the growth of the Antarctic Ice Sheet, which likely shifted the polar fronts northward, reducing AC strength and Agulhas Leakage. This weakening may have had a significant impact on global thermohaline circulation during the Pliocene.
INTRODUCTION
The Pliocene Epoch was significantly warmer, with temperatures ~2°C–4°C higher than today (Dowsett et al., 2016), and acted as a precursor to the Quaternary glaciations (Westerhold et al., 2020). The Early Pliocene began with warm conditions (Larivière et al., 2012), peaking during the Pliocene Climate Optimum (PCO; 4.4–4 Ma), when global temperatures were ~4°C above present (Fedorov et al., 2013). Another warm interval, the mid-Piacenzian Warm Period (mPWP; 3.29–2.97 Ma), also saw temperatures rise 2°C–4°C above modern levels (Haywood et al., 2013). Despite a warmer climate, multiple glacial events occurred during the Pliocene (De Schepper et al., 2014; McClymont et al., 2023).
Four major glaciations marked the Pliocene—two in the Early Pliocene and two in the Late Pliocene (De Schepper et al., 2014). The first event, between 4.9 and 4.8 Ma, triggered bipolar expansion of ice sheets (De Schepper et al., 2014), and the second (~4 Ma) mainly affected the Northern Hemisphere (Japsen et al., 2006), with some evidence of Antarctic Ice Sheet (AIS) expansion (Passchier, 2011). The Late Pliocene began with the onset of Northern Hemisphere Glaciation (NHG) around 3.6 Ma (McClymont et al., 2023), supported by the expansion of the North American ice sheet (Gao et al., 2012) and increased ice-rafted debris (IRD) in the Southern Ocean (De Schepper et al., 2014).
The first Late Pliocene glaciation at ~3.3 Ma (MIS M2) saw significant North Atlantic cooling (De Schepper et al., 2013), extensive NHG (Jansen et al., 2000; Kleiven et al., 2002), and AIS expansion (Brigham-Grette et al., 2013). The second glaciation (~2.7 Ma) featured a sharp IRD rise (Teschner et al., 2016) due to intensification of NHG (McClymont et al., 2023). Southern Ocean records also show increased sea ice and progressive AIS growth (Hillenbrand & Ehrmann, 2005; Naish et al., 2009). These events were interrupted by the mPWP, when polar ice caps shrank below the modern size (Dolan et al., 2011; Hill et al., 2007) and global mean temperatures rose significantly (Dowsett et al., 2012; Haywood et al., 2009). The mPWP serves as a key analogue for studying future climate change (Haywood et al., 2016).
AIS expansion shifted polar fronts northward (Taylor-Silva & Riesselman, 2018), weakening the Agulhas Current (AC; Bard & Rickaby, 2009). Enhanced albedo during glaciations cooled Antarctica (Huybers & Denton, 2008), intensified pole-to-equator temperature gradients, and strengthened westerly winds, further displacing oceanic fronts (Bard & Rickaby, 2009; Beal et al., 2011; Toggweiler & Russell, 2008). These shifts disrupted AC strength and reduced Agulhas Leakage (AL), impacting global thermohaline circulation (Caley et al., 2012; Weijer et al., 2002).
The AC, the largest western boundary current (Lutjeharms, 2006), transports warm water southward into the Atlantic via AL, sustaining the global ocean conveyor belt (Beal et al., 2011). During the Quaternary, the strength of AC and consequently the AL varied with polar front migrations, particularly the subtropical front (Bard & Rickaby, 2009; Beal et al., 2011; Caley et al., 2014; Peeters et al., 2004; Singh et al., 2023). Similar dynamics likely affected the strength of the AC during the Pliocene, also.
Planktic foraminifera, due to their latitudinal provincialism and passive mode of life (Bé, 1977), are ideal for palaeoceanographic reconstructions. Their stable isotopic signatures are crucial for studying the past SST. This study uses planktic foraminiferal census data and δ¹⁸O records from IODP Hole U1474A to investigate Pliocene variations in AC strength and their climatic drivers.
STUDY AREA
The IODP Hole U1474A is located in the path of the upstream AC (Figure 1) (Hall et al., 2017). The core recovered from this site has yielded well-preserved planktic foraminiferal assemblages.
Modern ocean circulation of the Agulhas Current system in the SW Indian Ocean (after Lutjeharms, 2006). The location of the study area is shown by a solid black circle (Hall et al., 2017) and the position of the Southern Ocean Fronts (after Orsi et al., 1995). The Sv values indicate the contribution of various currents to the Agulhas Current. Abbreviations: AC: Agulhas Current; AL: Agulhas Leakage; ARC: Agulhas Return Current; MC: Mozambique Current; NEMC: North East Madagascar Current; SEMC: South East Madagascar Current; SEC: South Equatorial Current; STF: Sub Tropical Front; SAF: Sub Antarctic Front; APF: Antarctic Polar Front. The map depicts the SST (World Ocean Atlas, Locarnini et al., 2018) and is drawn using Ocean Data View Software version 5.6.3 (Schlitzer, 2022).
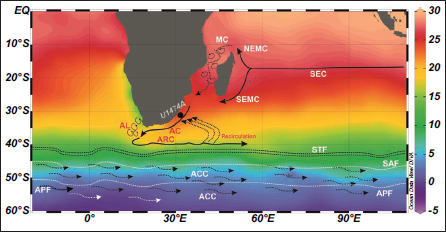
The AC starts at 27ºS latitude and moves along the African coastline till ~40ºS, after which, it retroflects into the Indian Ocean to constitute the Agulhas Return Current (ARC) (Lutjeharms, 2006; Lutjeharms & Ansorge, 2001). Of the total transport of ~70 Sv (Simon et al., 2013), the AC derives ~25 Sv from the SE Madagascar Current, ~5 Sv from the Mozambique Current and ~40 Sv from the recirculated part of the ARC (Figure 1) (Lutjeharms, 2006). Some part (~2–10 Sv) of the AC leaks into the Atlantic Ocean via the Indo-Atlantic gateway in the form of AL (Lutjeharms, 2006).
MATERIALS AND METHODS
Age Model
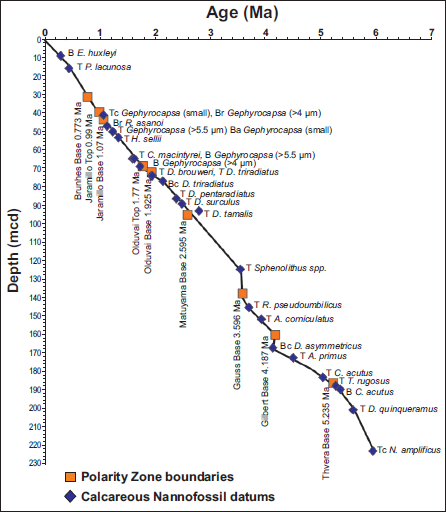
The age model was derived by integrating the polarity zone boundaries and the calcareous nannofossil datums from Hole U1474A (Hall et al., 2017). The absolute ages for palaeomagnetic events were taken from Ogg (2020). We calculated the rate of sedimentation and interpolated the ages for each sample, assuming a uniform rate between the recorded events (Figure 2).
Age versus depth plot of the IODP Hole U1474A by integrating the polarity zone boundaries and the calcareous nannofossil datums. Palaeomagnetic stratigraphy and the nannofossil datums are taken from Hall et al. (2017). The revised ages of the palaeomagnetic events are after Ogg (2020).
Planktic foraminiferal census count data
We processed 255 deep-sea samples using the wet-sieving method to extract the microfossil assemblage. The planktic foraminiferal assemblage of size ≥150 µm was used for the census study, following the standard procedure (Imbrie & Kipp, 1971). The taxonomic identification was conducted to species level following Kennett & Srinivasan (1983) and Lam & Leckie (2020). The census data were converted into percentages, and relative abundance curves for the key species were plotted.
Stable isotope analysis
Stable oxygen isotope analysis was performed on the surface-dwelling planktic foraminifer Trilobatus quadrilobatus, a mixed-layer species suitable for reconstructing surface water conditions (Chaisson & Ravelo, 1997), from 115 samples. For each of the analysed samples, spaced ~10–12 kyr apart, 4–5 ultrasonically cleaned specimens were picked. Analyses were conducted at the Stable Isotope Laboratory, Department of Earth Sciences, Indian Institute of Technology Roorkee, India. Samples were washed with Millipore water, oven-dried at 50°C, and reacted with orthophosphoric acid at 70°C using a Thermo Fisher Kiel IV carbonate device connected to a MAT 253 Plus mass spectrometer. Analytical precision was ensured through repeated measurements of laboratory standards. Calibration was performed using in-house MERCK (δ¹⁸O: –28.23‰; δ¹³C: –13.88‰) and NBS18 (δ¹⁸O: –23.19‰; δ¹³C: –5.016‰). The precision of δ¹⁸O and δ¹³C measurements was better than 0.1‰. All isotope values are reported relative to the Vienna Pee Dee Belemnite (VPDB) scale.
Species groups for palaeoceanographic reconstruction
Species with >5% relative abundance in at least 10 samples were used and grouped based on ecological preferences and abundance:
Tropical Group (TG)—characteristic of the AC, includes Globigerinoides ruber, Trilobatus sacculifer, Globoturborotalita rubescens, Neogloboquadrina acostaensis, Globigerinella calida, and Globorotalia menardii;
Southern Ocean Group (SOG)—indicative of cold Southern Ocean water, includes Globoconella inflata, G. puncticulata, Neogloboquadrina incompta, and Orbulina suturalis;
Upwelling Group (UG)—includes Globigerina bulloides, Globigerinita glutinata, and Neogloboquadrina dutertrei. Taxonomic details and photomicrographs are provided in the supplementary material (Plates 1–7).
RESULTS
Planktic foraminiferal abundances from IODP Hole U1474A show significant variability during the Pliocene, indicating changes in AC strength and polar front migration (Figure 3). The TG was dominant throughout, averaging ~60% in the Early Pliocene but declining to ~40% in the Late Pliocene. Eleven distinct events of decline in TG were identified—five in the Early Pliocene (4.35, 4.2, 4.05, 3.88, and 3.6 Ma) and six in the Late Pliocene. These events coincided with sharp increases in the subpolar group (SOG), often exceeding 10%, and in the UG, which surpassed 20%.
The relative abundances of the planktic foraminifera from IODP Hole U1474A: (a) Tropical Group (TG); (b) Southern Ocean Group (SOG); (c) Upwelling Group (UG), correlated with (d) δ18O of Globigerinoides quadrilobatus from U1474A and (e) the LR04 stack. The grey bars indicate the episodes of reduced AC.
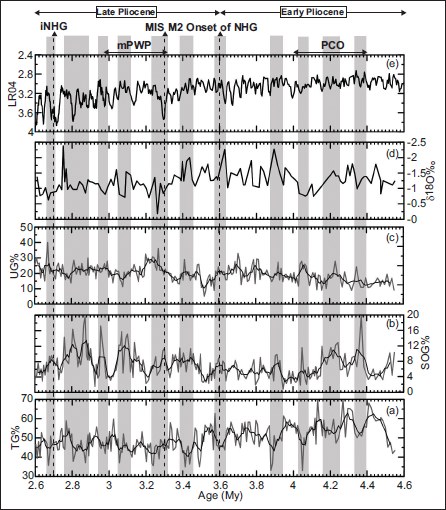
Following a peak (~55%) at 3.5 Ma, TG declined again at 3.4 Ma as SOG rose to ~12%. During the mPWP (3.3–2.9 Ma), TG abundance increased, reaching >55% at ~3 Ma. However, declines at 3.23, 3.05, and 2.96 Ma were accompanied by SOG increases (8%–10%) and a UG maximum of 40% at 3.26 Ma.
Post-mPWP, TG abundance decreased during two episodes—between 2.9 and 2.8 Ma and at 2.67 Ma—showing 15%–20% reductions. SOG peaked at 2.85 Ma (~20%), while UG remained stable (~20%).
The δ¹⁸O data from T. quadrilobatus (Figure 3d) and the LR04 benthic stack (Lisiecki & Raymo, 2005; Figure 3e) show synchronous positive excursions during TG decline events, supporting cooler conditions at the site during reduced AC strength. The combined faunal and isotopic records thus indicate climate-driven shifts in ocean circulation during the Pliocene.
DISCUSSION
Planktic foraminiferal records from IODP Hole U1474A provide evidence of AC variability during the Pliocene, primarily influenced by glacial events. Fluctuations in the TG and SOG reflect changes in the strength of the AC, while variations in the UG indicate productivity changes. Positive δ¹⁸O excursions during TG declines suggest cooler sea surface temperatures (SSTs), implying AC weakening.
From 4.6 to 4 Ma, three events at 4.35, 4.2, and 4.05 Ma show SOG increases and TG declines, indicating reduced AC strength. These events coincide with high UG abundance, suggesting enhanced productivity due to colder, nutrient-rich waters. Although broader records indicate AIS reduction during 4.5–4.1 Ma (De Schepper et al., 2014), two of these events (4.35 and 4.2 Ma) likely reflect temporary AIS expansion, as supported by positive δ¹⁸O excursions and LR04 stack trends (Lisiecki & Raymo, 2005). The third event at 4 Ma coincides with global ice volume expansion, likely forcing polar fronts northward and weakening the AC.
Another glaciation between 3.9 and 3.8 Ma (MIS Gi14–Gi12) (De Schepper et al., 2014) is represented at U1474A by SOG increase and TG decline, indicative of AC weakening. The final Early Pliocene event at 3.6 Ma corresponds to the onset of NHG (Mudelsee & Raymo, 2005; Ravelo et al., 2004), with a major AIS expansion and poleward frontal shift (Gao et al., 2012), significantly affecting the AC.
The Late Pliocene begins with a strong AC, indicated by high TG abundance up to 3.4 Ma. This period coincides with a substantial AIS retreat (Levy et al., 2012; McKay et al., 2012; Naish et al., 2009), resulting in low SOG and UG. This warm period ended abruptly at 3.3 Ma (MIS M2) with a major glaciation (De Schepper et al., 2014), reflected in a sharp δ¹⁸O increase and LR04 coherence. This cooling led to a major AIS advance (Andreev et al., 2013; Brigham-Grette et al., 2013; McKay et al., 2012) and reduced TG to a minimum at 3.2 Ma, indicating a weak AC.
This was followed by the mPWP (3.3–2.9 Ma), characterised by warmer global conditions and retreat of both Antarctic and Greenland ice sheets (Dolan et al., 2011; Hill et al., 2010). Consequently, the polar fronts shifted southward, allowing for a stronger AC, reflected in TG abundance peaking around 60%.
Post-mPWP, a cooling event at 2.8 Ma (MIS G10) (Martinez-Boti et al., 2015) marks the onset of sustained Late Pliocene glaciation. High-latitude cooling (McClymont et al., 2016) and AIS expansion (De Schepper et al., 2014) reduced AC strength, evident from TG decline and δ¹⁸O excursion.
A major glacial event at 2.7 Ma (MIS G6/G4) (De Schepper et al., 2014), coinciding with intensified NHG (McClymont et al., 2016), further weakened the AC. At U1474A, TG declined, SOG increased, and δ¹⁸O showed a significant positive shift, consistent with LR04 values and lower SSTs.
CONCLUSIONS
Planktic foraminiferal assemblages and oxygen isotope data from IODP Hole U1474A reveal significant fluctuations in the strength of the AC during the Pliocene. Five weakening events occurred in the Early Pliocene (4.35–3.6 Ma) and six in the Late Pliocene (3.4–2.67 Ma). These reductions align with major glacial episodes, suggesting that expansion of the AIS and poleward migration of fronts weakened the AC. This likely reduced AL into the Atlantic, impacting thermohaline circulation and contributing to the broader climatic shifts during the Pliocene.
Footnotes
Acknowledgements
The authors thank the International Ocean Discovery Program (IODP) and Kochi Core Centre, Japan, for providing the samples of the Hole U1474A (request no. #85276IODP). VPS thankfully acknowledges the National Centre for Polar and Ocean Research (NCPOR)-IODP India, Goa, for providing financial assistance for this work (Grant No.: NCPOR/IODP/E.3947/2021). RD thanks NCPOR for the financial support in the form of a JRF. SP was financially supported by a fellowship from IGNTU. VPS, SP and RD thank IGNTU for the lab facilities and logistic support. ASM is thankful to IIT Roorkee for the lab facilities for conducting stable oxygen isotope analyses.
Declaration of Conflicting Interests
The authors declared no potential conflicts of interest with respect to the research, authorship and/or publication of this article.
Funding
The authors disclosed receipt of the following financial support for the research, authorship and/or publication of this article: The present work has been funded by the National Centre for Polar and Ocean Research (NCPOR)-IODP India, Goa (Grant No.: NCPOR/IODP/E.3947/2021).
Supplemental Material
References
Supplementary Material
Please find the following supplemental material available below.
For Open Access articles published under a Creative Commons License, all supplemental material carries the same license as the article it is associated with.
For non-Open Access articles published, all supplemental material carries a non-exclusive license, and permission requests for re-use of supplemental material or any part of supplemental material shall be sent directly to the copyright owner as specified in the copyright notice associated with the article.