
Abstract
Keywords
Introduction
In comparison to intracranial tumors, spinal cord tumors are infrequent, constituting less than 10% of central nervous system neoplasms. 1 Among spinal cord tumors, spinal cord gliomas (SCG) make up only 22% of the total cases. 2 Due to the limited understandings about the molecular pathology mechanism and the high heterogeneity of SCG, the treatment effect for SCG patients is often disappointing. 3 Patients with spinal cord glioblastoma had an overall survival rate of approximately 10–14 months.4,5 Currently, the primary method for treating SCG is still surgical resection, but positive surgical treatments are unable to extend the survival time of high-grade SCG (grade 3 and grade 4) for tumor metastasis. Some views even suggest that tumor resection can increase the likelihood of SCG cells spreading into the spinal subarachnoid space via cerebrospinal fluid (CSF), resulting in intracranial metastasis. Brain and bone are the common site of the metastasis from high-grade SCG.6–8 Surviving patients usually suffer from severe neurologic deficits and poor quality of life. Therefore, it is necessary to investigate the mechanism of SCG to develop new treatment strategies.
The activation of EMT process could be the predominant factor responsible for the infiltrative growth of glioma and tumor metastasis. In recent years, EMT has emerged as a key focus in cancer research for the involvement in therapeutic resistance, metastasis, and tumor progression. It was reported that glioma cells exhibited EMT-like characteristics, such as the suppression of epithelial proteins (E-cadherin) and the augmentation of mesenchymal proteins (Vimentin and N-cadherin).9,10 Research also found that EMT-related genes were associated with survival and immune microenvironment of glioma patients.11,12 Owing to the delayed initiation of research on EMT in glioma, the current comprehension of the underlying mechanism of EMT in SCG remains limited. Therefore, it is imperative to comprehend the relationship between SCG and EMT in order to develop new therapeutic approaches.
In this research, we analyzed the roles of EMT in glioma and screened out the most associated gene with EMT using bioinformatic analysis. GSEA and unsupervised cluster analysis revealed the critical role of EMT for glioma progression. By using differently expressed gene (DEG) and correlation analysis, we found that RDH10 had the highest correlation with EMT process. Previous research found an upregulation of RDH10 in glioma tissue, and demonstrated that knockdown of RDH10 in glioma cells inhibited cell growth via the TWEAK-NF-κB axis both in vitro and in vivo experiments. 13 In 2019, the researchers found that knockdown of RDH10 also decreased the migration and invasion capabilities of glioma cells through the TGF-β/SMAD axis. 14 Although these studies revealed the pro-tumor effect of RDH10 in glioma, the biological effects of RDH10 remain unclear in SCG. Based on bioinformatic analysis, in vivo and in vitro experiments, we aim to explore the function of RDH10 in SCG and elucidated its potential mechanism in promoting EMT in SCG cells.
Methods
Public data source
The glioma cohorts from public database including clinical and sequence data were acquired from Gliovis platform. 15 The inclusion and exclusion criteria for glioma cohorts were as follows: (1) The sample size of glioma cohorts should be over 200 cases; (2) The data of glioma cohorts should include survival data, tumor histology, tumor grade and sequence data. Finally, we obtained 4 glioma cohort (Rembrandt: 397 cases; Gravendeel: 270 cases; TCGA: 663 cases; CGGA: 983 cases). The sequence data of 2642 normal tissues were acquired from GTEx platform (https://www.gtexportal.org/home/datasets).
Tissue samples
This is a retrospective study lasting 5 years. Samples of SCG and normal spinal cord tissues were acquired from 35 individuals undergoing surgery at Beijing Sanbo Brain Hospital between 2020 and 2023. (normal tissue: 3 cases, Grade 1: 11 cases, Grade 2: 7 cases, Grade 3: 5 cases, Grade 4: 9 cases). Grade 2 and Grade 1 are referred as low-grade SCG (LSCG), while Grade 4 and Grade 3 are referred as high-grade SCG (HSCG). The inclusion and exclusion criteria for samples were as follow: (1) Samples were diagnosed pathologically as SCG; (2) The clinic records of samples were complete; (3) Samples that received chemotherapy or radiotherapy previously should be excluded. Based on Helsinki Declaration, the Ethics Committee of Sanbo Brain Hospital approved this study.
We calculated that group sample sizes of 32 patients would provide 80% power to reject the null hypothesis of equal survival time when the median survival times are 91 months for low-RDH10 samples and 25 months for high-RDH10 samples (according to TCGA glioma cohort; TCGA glioma samples were divided into high-RDH10 and low-RDH10 samples based on the median level of RDH10) at a two-sided alpha of 0.05. Our study planned to enroll 32 SCG patients, assigned equally to the high- and low-RDH10 group based on the median RDH10 level.
Bioinformatic analysis
A flowchart was created show the identification of RDH10 as the potential gene which may promote EMT in SCG (Figure 1). Initially, we performed Cox regression analysis of the clinical characteristics in TCGA glioma cohort and constructed a predictive risk model based on WHO grade, IDH status, 1p/19q codeletion and age using multivariate Cox regression analysis. In this particular model, 663 samples of TCGA glioma cohort were categorized into high- and low-risk patients based on their risk score. Enrichment analysis was conducted using GSEA (Gene Set Enrichment Analysis) to explore whether EMT gene set was enriched in high-risk group based on hallmark (h.all.v2022.1. Hs.symbols.gmt). Phenotypic labels used were high-risk versus low-risk, and the permutations were set to 1000. The rest of the options were kept default. The flowchart showed the identification of RDH10 as the potential gene which may promote EMT in SCG.
NMF clustering was performed using gene set ‘HALLMARK_EPITHELIAL_ MESENCHYMAL_TRANSITION.’ Unsupervised clustering analysis was conducted utilizing the ‘NMF’ R software package, incorporating 1000 replicate samples and a maximum of five clusters. TCGA glioma samples were divided into two clusters (cluster 1: EMT-activating group, cluster 2: EMT-inhibiting group) based on correlation degrees with EMT using NMF rank survey and consensus heatmap. Survival analysis was conducted in the two clusters.
DEGs were identified by applying the ‘limma’ package in R, 16 using the criteria of |log2FC (Fold Change)| >1 and adj. p < .05. We collected intersection of DEGs among DEGs (Tumor vs Normal), DEGs (GBM vs LGG) and DEGs from a previous study (DEGs from Wang). 17 Survival analysis was performed in the intersection DEGs to screen out the candidate genes for further investigation.
For the correlation analysis of RDH10 expression with clinicopathological characteristics, the ‘ggpubr’ R package was utilized. We then used boxplots to show the relationship between RDH10 and clinical characteristics of glioma, such as tumor grade, age and IDH status. Survival analysis was performed to evaluate the prognostic value of RDH10 in glioma. To avoid bias, we performed survival analysis in different glioma subgroups (according to the 2021 WHO Classification of CNS tumors) and multiple glioma cohorts (Rembrandt, Gravendeel, TCGA and CGGA). Moreover, we conducted univariate and multivariate Cox analysis of RDH10 and clinical features in TCGA glioma cohort. A median RDH10 expression level of 663 TCGA glioma patients was used to classify them into high- and low-RDH10 subgroups. DEGs were acquired using ‘limma’ package between the two groups. To investigate the potential mechanism of RDH10, KEGG analysis was performed and then visualized using ‘ggplot2’ R package.
The DEGs between high- and low-RDH10 subgroups were used to construct a PPI (protein-protein interaction) network. The CytoHubba in Cytoscape app is used to confirm the hub genes. The overlapping genes of the top 20 genes are determined by a Venn diagram using 5 different algorithms: Degree, Closeness, Radiality, Betweenness, and Stress. The hub genes are these overlapping genes.
Cell isolation and cultures
In accordance with a previous study, SCG cells have been isolated. 18 We cut fresh human HSCG tissue into 1 mm3 fragments and washed in PBS with 1% penicillin/streptomycin (Gibco; ThermoFisher Scientific). At 37°C in a water bath for 30 min, the tumor tissue mass was digested with 0.25% trypsin. A 100 mesh steel strainer was used to prepare a suspension of tumor cells, which was then transferred to a centrifuge tube for 5-min centrifugation at room temperature. We subsequently resuspended the cells in RPMI1640 medium (Gibco) containing 10% FBS (Gibco) and 1% penicillin/streptomycin solution, and then incubated them at 37°C in 5% CO2. SCG cells isolated from two HSCG tissues were named SCG1 and SCG2.
Cell transfection
To construct RDH10 overexpression plasmid (pcRDH10), Han Biotechnology (Shanghai, China) synthesized and cloned RDH10-coding sequence into pcDNA 3.1. The pcDNA3.1 was utilized as negative control (pcNC). Short hairpin RNA (shRNA) of RDH10 and control (shNC) were procured from Thermo Fisher Scientific. The sequences of shRNA were as following: shRDH10 (5′-TACGATGCTGGAGATTAAT-3′) and shNC (5′-TTCTCCGAACGTGTCACGT-3′). According to the product instruction of Lipofectamine2000 kit, vectors or shRNAs were transfected into cells. The cells that had been transfected were collected for additional analysis after 48 to 72 h.
Western blot
The cells were collected and lysed in SDS buffer with protease inhibitor cocktail, and protein quantification was measured by BCA (bicinchoninic acid) method. SDS-PAGE was used to separate the protein sample and transfer it to polyvinylidene difluoride membranes (ThermoFisher Scientific). To prevent non-specific binding on the membrane, a protein blocker (bovine serum albumin) was applied. Next, the membranes were hatched with primary antibodies against GAPDH (Abcam, ab8245, 1:8000), RDH10 (ThermoFisher Scientific, PA5-106,301, 1:1000), Vimentin (Abcam, ab92547, 1:1200), N-cadherin (Abcam, ab207608, 1:1000), E-cadherin (Abcam, ab231303, 1:1000), mTOR (Abcam, ab2732, 1:1500), AKT (Abcam, ab18785 1:1000), p-P70S6K (Cell Signaling Technology, #9205, 1:1000), p-AKT (Abcam, ab38449, 1:1500), p-mTOR (Abcam, ab109268, 1:1500) and P70S6K (Cell Signaling Technology, #2708, 1:1000). After washing, the membranes were hatched with goat anti-rabbit antibody (Abcam, ab216773, 1: 10,000) for 2 h away from the light. The membrane detection and visualization were conducted using infrared imaging scanning instruments (Odyssey LI-COR, USA).
Migration and invasion assays
The upper chamber of a trans-well membrane held 1 × 10⁵ tumor cells and 300 μL of medium without serum. The lower chamber held 700 μL of medium containing serum. After being incubated for a day, the chambers were rinsed with PBS, followed by fixation using 4% paraformaldehyde and staining with crystal violet. We then washed the cells with PBS and photographed them after they dried out.
Wound healing assays
Cells were seeded in a 6-well plate, scratched with a pipette tip, and cultured in medium without FBS. Electron microscope images were taken at 0, 24, and 48 h. By using Image J software, we measured the changes in width of cells to evaluate their migration capabilities.
RNA extraction and reverse transcription-polymerase chain reaction (RT-PCR)
The TRIzol method was used to extract total RNA. Reverse transcriptase was used to synthesize complementary DNA. We measured mRNA levels of the target gene by RT-PCR amplification using GAPDH as the internal control. The primers used for quantification of relative mRNA expression were as follows: GAPDH (5′-TGACTTCAACAGCGACACCCA-3′ and 5′-CACCCTGTTGCTGTAGCCAAA-3′) and RDH10 (5′-TGGGACATCAACACGC-AAAGC-3′ and 5′-TGCAAGTTACAGTGGGGCAGA-3′).
Xenograft experiment
Four-week-old male athymic BALB/c nude mice were obtained from the Animal Center of Hebei Medical University. The animal protocol was approved by the Ethics Committee of the Second Hospital of Hebei Medical University. Tumor cells (5 × 10⁶ per mouse) were injected subcutaneously into the mice. After 4 weeks, the mice were euthanized and subcutaneous xenografts were harvested for additional investigation.
Statistical analysis
We repeated all experiments three times, and results were displayed as the mean values ± standard deviation (SD). To compare the variations among groups, a one-way ANOVA and student's t-test were conducted with R software (version 4.2.2) and Prism 8 (GraphPad Inc, USA). p-values less than 0.05 were used to establish statistical significance.
Results
EMT is a critical factor resulting in dismal prognosis of glioma
We performed Cox analysis of multiple clinical features using TCGA glioma data, and found that tumor grade, age, IDH status and 1p19q status were independent prognostic factors of glioma (Figure 2(A)). Next, WHO grade, IDH status, 1p/19q codeletion and age were used to develop a predictive risk model by multivariate Cox regression analysis. Using median risk scores as threshold, TCGA glioma patients were categorized into high- and low-risk patients. Survival analysis indicated that high-risk patients had a worse prognosis than low-risk patients EMT is the critical element resulting in dismal prognosis of glioma. (A) Multivariate univariate Cox analysis of clinical features using TCGA glioma data. (B) ROC curves of the established model in predicting 1-year, 3-years and 5-years prognosis of glioma. (C) GSEA analysis showed that the gene set of EMT was enriched in high-risk group of the risk model. (D) Unsupervised clustering results from the NMF rank survey. (E) Based on the unsupervised clustering, we produced a consensus matrix heatmap showing two clusters. (F) Heatmap showed the expression of EMT-related genes in the two clusters. (G) Survival analysis showed the prognosis of patients in cluster 1 and cluster 2. (H) The enrichment scores of EMT gene set in cluster 1 and cluster 2.
As a non-negative matrix analysis, NMF was performed on the TCGA glioma data using the gene set: HALLMARK_EPITHELIAL_MESENCHYMAL_TRANSITION. We selected two clusters as an acceptable criterion after comparing the different cluster sizes (Figure 2(D) and (E)). Cluster 1 exhibited elevated levels of EMT-related genes compared to cluster 2 (Figure 2(F)). Survival analysis indicated that cluster 1 had a poorer outcome compared to cluster 2 (Figure 2(G)). The EMT scores from ssGESA analysis based on EMT gene set demonstrated that cluster 1 had higher EMT scores compared to cluster 2 (Figure 2(H)). These results suggested that EMT played key roles in glioma progression and was closely associated with glioma prognosis.
Screening and identification of DEGs
To screen out the associated genes with EMT in glioma, we performed DEG analysis using gene expression data in TCGA and GTEx database. The results revealed the upregulation of 5961 genes and the downregulation of 920 genes in glioma compared to normal brain tissue (Figure 3(A), |log2FC| >1 and adj. p < .05); upregulation of 1349 genes and downregulation of 905 genes between GBM and LGG (Figure 3(B), |log2FC| >1 and adj. p < .05). We also obtained the DEGs between HSCG and LSCG from a previous study, with 193 upregulated genes and 222 downregulated genes (Figure 3(C), |log2FC| >1 and adj. p < .05). Identification of DEGs in glioma. (A) DEGs between glioma and normal brain tissue from TCGA and GTEx database. (B) DEGs between GBM and LGG in TCGA database. (C) DEGs between HSCG and LSCG from a previous study. (D) Venn diagram showed the intersected DEGs of 3 analytic methods, 36 genes in total. (E) Venn diagram showed the intersection of prognosis-related genes in LGG and GBM, a total of 8 genes. (F-G) Bar plot and scatter plot showed the correlation between the 8 genes and EMT scores in TCGA glioma.
GO and KEGG enrichment analysis were performed to explore the functions of these upregulated/downregulated genes. 5961 upregulated genes (Tumor vs Normal) were enriched in ribonucleoprotein complex biogenesis, transcription coregulator activity, cellular senescence, hippo signaling pathway, herpes simplex virus 1 infection (Figure S2A-B). 920 downregulated genes (Tumor vs Normal) were enriched in regulation of trans-synaptic signaling, metal ion transmembrane transporter activity, pathways of neurodegeneration, neuroactive ligand-receptor interaction (Figure S2C-D). 1349 upregulated genes (GBM vs LGG) were enriched in extracellular matrix organization, enzyme inhibitor activity, focal adhesion, human papillomavirus infection (Figure S3A-B). 905 downregulated genes (GBM vs LGG) were enriched in regulation of trans-synaptic signaling, passive transmembrane transporter activity, neuroactive ligand-receptor interaction, cAMP signaling pathway, calcium signaling pathway (Figure S3C-D).
We then drew a Venn diagram to get the intersection of DEGs in the 3 parts, a total of 36 genes (Figure 3(D)). The prognostic value of the 36 genes were investigated using survival analysis in TCGA, and we found that among the 36 genes, 28 genes were associated with LGG prognosis and 9 genes were associated with GBM prognosis. We subsequently get the intersection of the 2 prats and 8 candidate genes were obtained: RDH10, PDLIM1, SERPINE1, TNFRSF12A, IQGAP2, TMSB10, HOXB7 and FABP5 (Figure 3(E)). After analyzing the relationship between EMT scores and the expression of 8 potential genes, it was determined that RDH10 exhibited highest correlation with EMT scores (R = 0.882, p < .001) (Figure 3(F) and (G)).
High level of RDH10 is related to high tumor grade and poor prognosis of SCG
We investigated expression of RDH10 in glioma using GEPIA online tool,
19
and found that GBM and LGG had higher level of RDH10 than normal tissue (Figure 4(A)). RT-PCR indicated that RDH10 expression was increased with advanced tumor grade in SCG (Figure 4(B)). A cohort of 24 SCG samples was stratified into high-RDH10 and low-RDH10 groups according to the median RDH10 level. Survival analysis showed a close association between elevated RDH10 expression and unfavorable prognosis in SCG (Figure 4(C)). Subsequently, an examination was conducted on the prognostic significance of RDH10 within four publicly available glioma cohorts (TCGA, CGGA, Rembrandt, Gravendeel), revealing that individuals in the high-RDH10 group exhibited a decreased survival duration than those in low-RDH10 group (Figure 4(D)–(G)). Univariate and multivariate Cox analysis showed that RDH10 was not an independent risk factor for glioma (Table S1). High expression of RDH10 is associated with increased tumor grades and poor prognosis. (A) Expression of RDH10 in glioma using GEPIA. (B) Expression of RDH10 in normal tissue (normal spinal cord tissue), LSCG and HSCG using PCR analysis. (C) Survival analysis in high-RDH10 SCG and low-RDH10 SCG. (D-G) Survival analysis of RDH10 in 4 public glioma cohorts (TCGA, CGGA, Rembrandt, Gravendeel). *p < .05; **p < .01; ***p < .001.
The 2021 WHO Classification of CNS tumors has contributed to the advancement of our knowledge regarding glioma. Survival analysis was performed on various subtypes of glioma based on this updated classification. Our results suggested that RDH10 might serve as a favorable prognostic marker in glioblastoma (IDH-wildtype) and astrocytoma (IDH-mutant), however, its prognostic value in oligodendroglioma (IDH-mutant and 1p/19q-codeleted) remains inconclusive due to the extended survival duration and limited sample size (Supplemental Figure S4).
RDH10 promotes EMT process, invasion and migration of SCG cells
We performed cell experiment to investigate the relationship between RDH10 and EMT in SCG. RT-PCR showed that RDH10 expression decreased in SCG1 and SCG2 cells after shRNA transfection and increased after plasmid transfection (Figure 5(A)). Western blot analysis demonstrated that knockdown of RDH10 in SCG1 and SCG2 cells led to the upregulation of E-cadherin and the downregulation of vimentin and N-cadherin. Conversely, the overexpression of RDH10 resulted in the downregulation of E-cadherin and the upregulation of vimentin and N-cadherin (Figure 5(B)). RDH10 promotes EMT process in SCG cells. (A) RDH10 knockdown and overexpression in SCG1 and SCG2 cells. (B) Western blotting showed the levels of, E-cadherin, vimentin and N-cadherin after transfection in SCG1 and SCG2 cells. *p < .05; **p < .01; ***p < .001.
Additionally, trans-well and wound healing experiments indicate that the upregulation of RDH10 enhanced the invasion and migration capabilities of SCG cells, while the downregulation of RDH10 suppressed these abilities (Figure 6(A) and (B)). RDH10 enhances migration and invasion in SCG cells. (A) Representative data from trans-well migration and invasion assays after upregulation and downregulation of RDH10 in SCG cells. (B) Representative data from wound healing assays after upregulation and downregulation of RDH10 in SCG cells. *p < .05; **p < .01; ***p < .001.
RDH10 activates PI3K-AKT pathway in SCG cells
DEGs were examined in TCGA glioma cohort to investigate the potential roles of RDH10 in SCG by comparing the high-RDH10 and low-RDH10 groups (|log2FC| >1 and adj. p < .05). High-RDH10 and low-RDH10 groups were determined using the median level of RDH10. We finally acquired 3584 DEGs, with upregulation of 2448 genes and downregulation of 1136 genes (Figure 7(A)). KEGG and GO analysis showed that DEGs were involved in signaling receptor activator activity, neutrophil migration, MAPK and PI3K-AKT signaling pathway (Figure 7(B) and (C)). The DEGs were used to construct a PPI (protein-protein interaction) network, and the connectivity between these genes was determined using the cytoHubba app in Cytoscape. Our analysis identified 9 hub genes that play an important role in these genes due to their high connectivity (Figure S5A). Among the 9 genes, IL6 had the highest scores of Degree, Closeness, Radiality, Betweenness, and Stress, suggesting that IL6 might be the most impotent for the biological functions of RDH10 in glioma (Figure S5B). RDH10 regulates PI3K-AKT pathway in SCG cells. (A) DEGs between high-RDH10 and low-RDH10 groups in TCGA. (B) DEGs for GO enrichment analysis. (C) DEGs for KEGG enrichment analysis. (D-E) Heatmap showed the relation between RDH10 level and multiple cancer-related pathways. (F) RDH10 was positively corelated with scores of PI3K-AKT pathway. (G) PI3K-AKT pathway was inhibited after RDH10 knockdown and enhanced after RDH10 overexpression in SCG1 cells. (H) PI3K-AKT pathway was inhibited after RDH10 knockdown and enhanced after RDH10 overexpression in SCG2 cells. *p < .05; **p < .01; ***p < .001.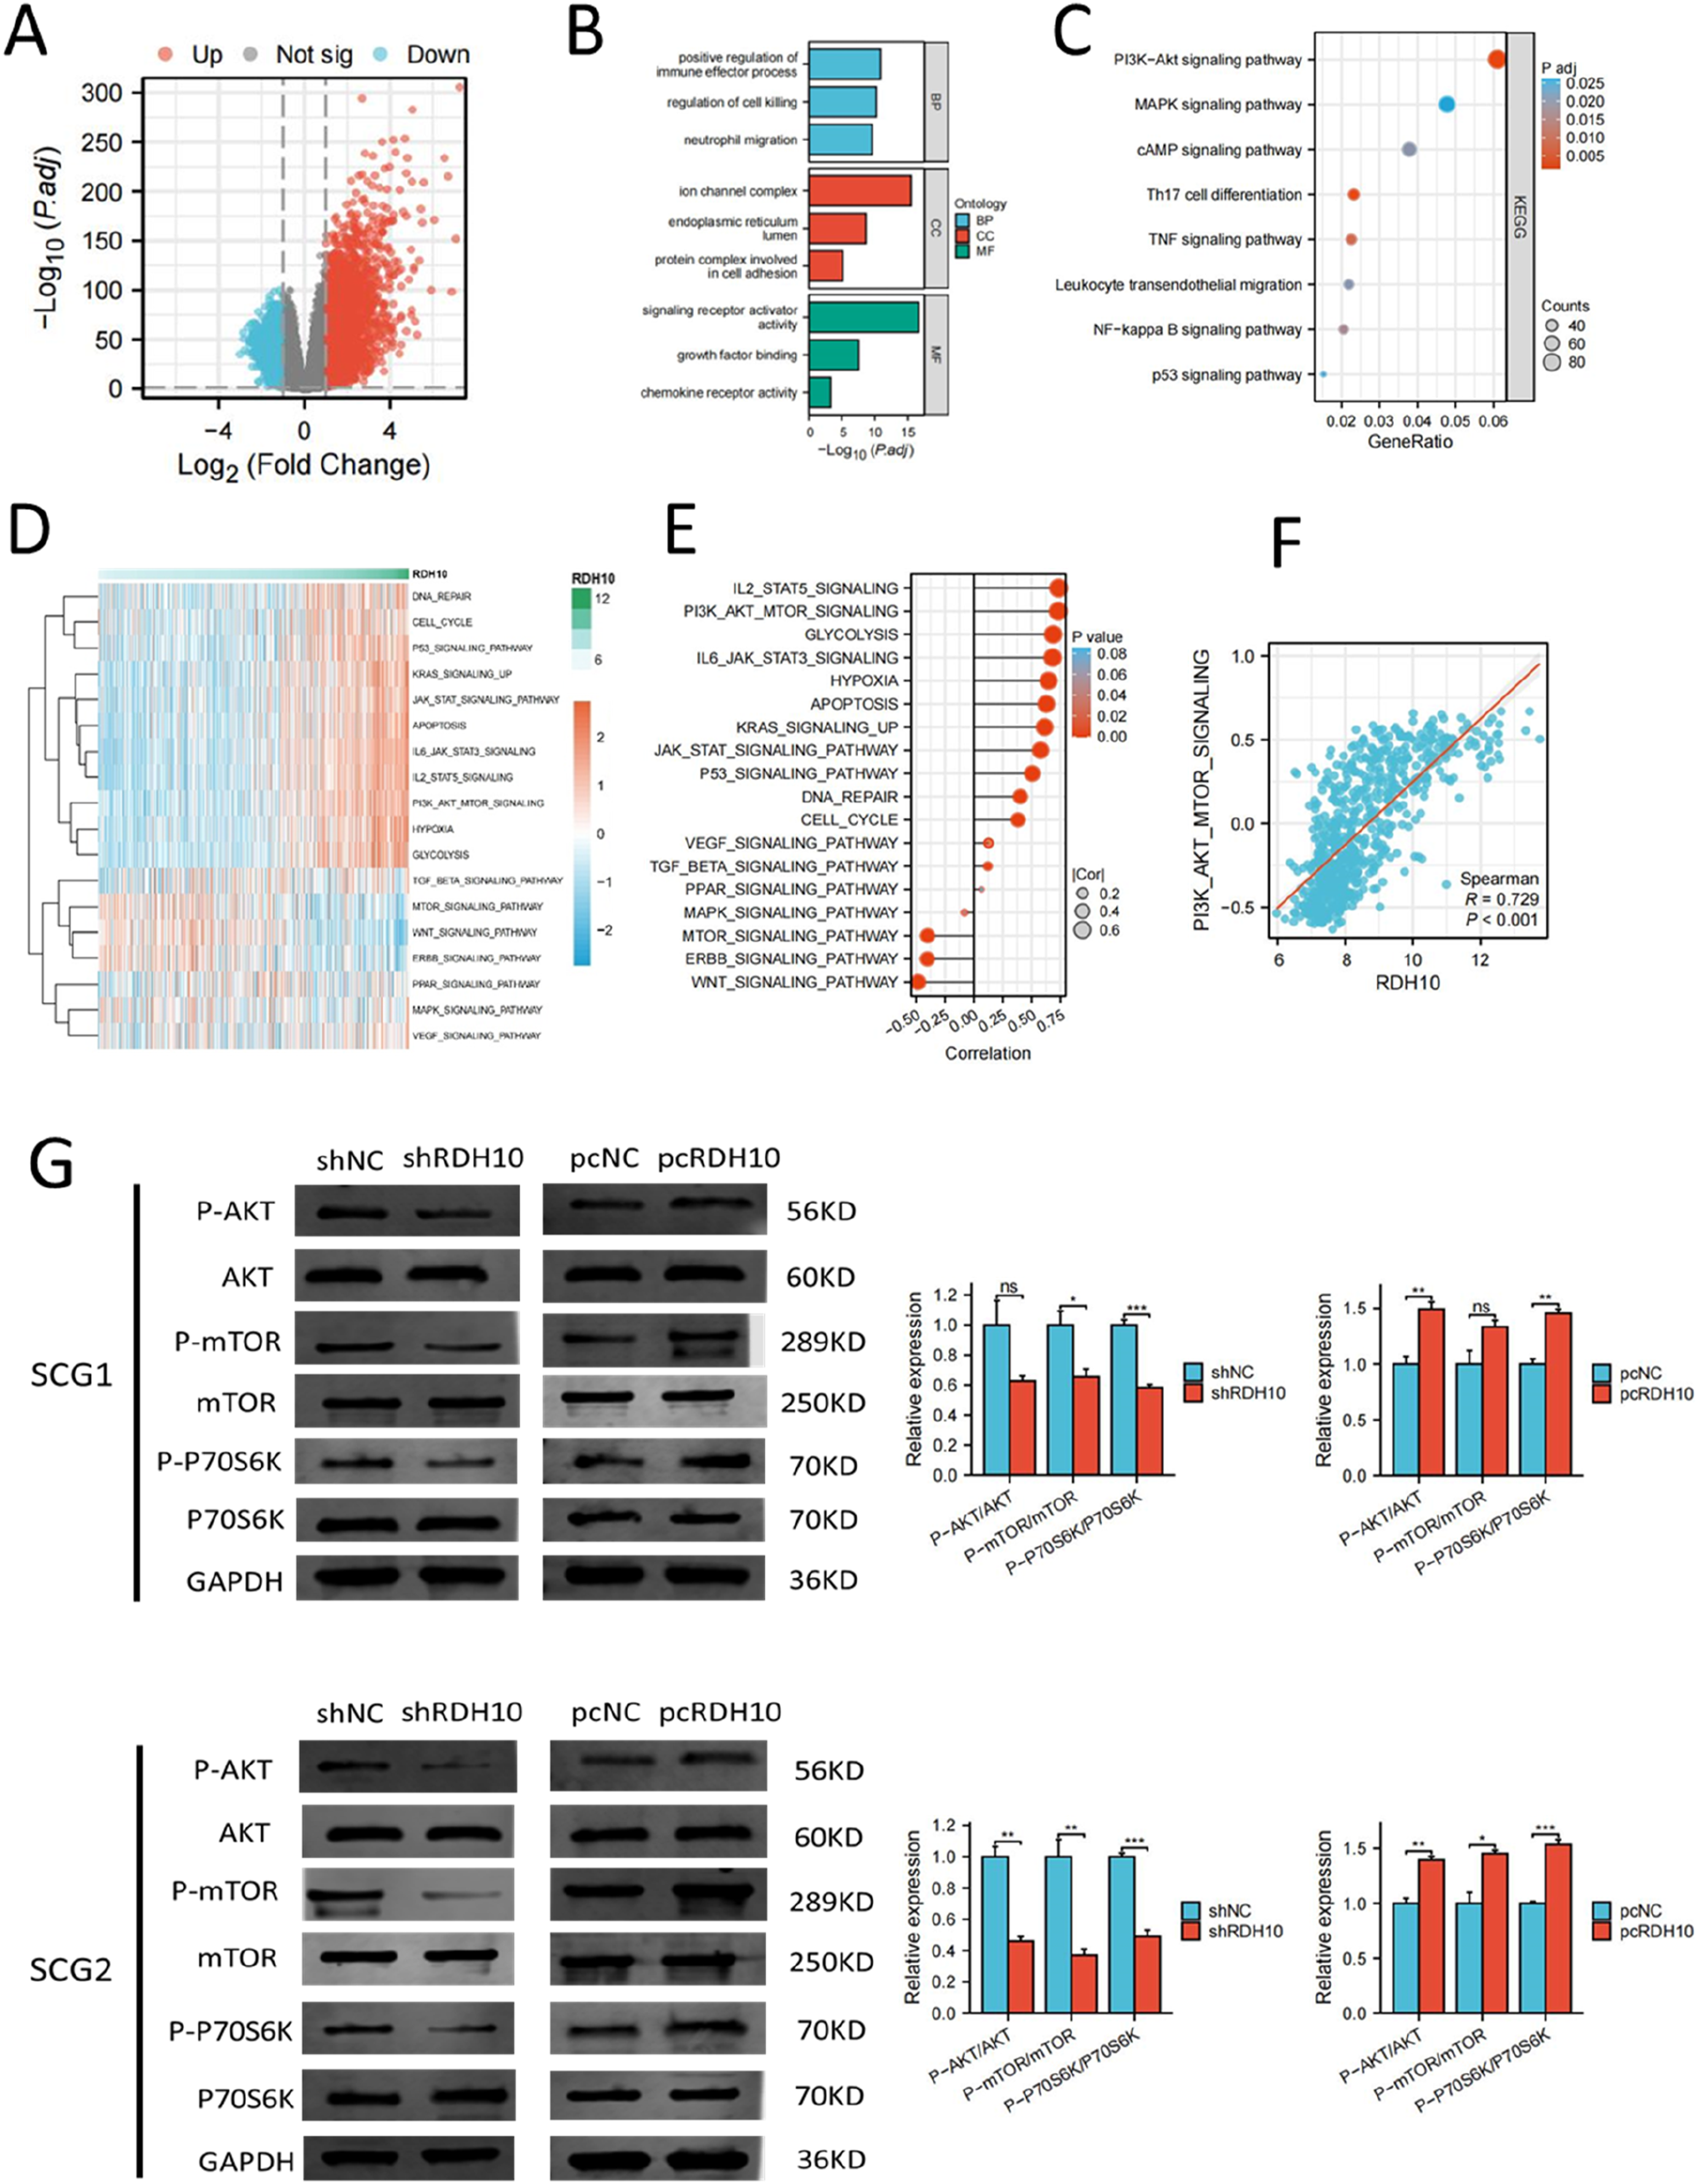
The result of GSVA analysis revealed the close association between RDH10 and multiple cancer-related pathways (Figure 7(D) and (E)). The enrichment scores of PI3K-AKT pathway were positively correlated with the level of RDH10 (Figure 7(F)). Western blot indicated that PI3K-AKT pathway was blocked after RDH10 knockdown and enhanced after RDH10 overexpression in SCG1 and SCG2 cells (Figure 7(G)). These results suggested that RDH10 can regulate PI3K-AKT pathway in SCG cells.
RDH10 promotes EMT process in SCG via PI3K-AKT pathway
To confirm whether PI3K-AKT pathway activation was necessary for RDH10-mediated EMT process in SCG, RDH10-overexpressed cells were were exposed to PI3K-AKT pathway inhibitor (LY294002). The level of p-AKT, p-mTOR, p-P70SK, vimentin and N-cadherin were reduced with LY294002 treatment in RDH10-overexpressed cells, while the level of E− cadherin increased with LY294002 treatment (Figure 8(A) and (B)). Trans-well and wound healing assays illustrated that LY294002 reversed the increased ability of invasion and migration in SCG cells caused by RDH10 overexpression (Figure 9(A) and (B)). Our findings suggested that RDH10 regulates EMT by activating PI3K/AKT pathway in SCG cells. RDH10 activates EMT process by PI3K-AKT pathway in SCG cells. (A) Relative expression of p-P70S6K, p-mTOR, p-AKT, N-cadherin, Vimentin, E-cadherin and GAPDH in SCG1 cells treated with pcNC, pcRDH10 and the combination of pcRDH10 and LY294002 respectively. (B) Relative expression of p-P70S6K, p-mTOR, p-AKT, N-cadherin, Vimentin, E-cadherin and GAPDH in SCG2 cells treated with pcNC, pcRDH10 and the combination of pcRDH10 and LY294002 respectively. *p < .05; **p < .01; ***p < .001. RDH10 promotes invasion and migration of glioma cells via PI3K-AKT pathway. (A) Representative images from Trans-well invasion assays conducted in SCG1 and SCG2 cells treated with pcNC, pcRDH10 and the combination of pcRDH10 and LY294002. (B) Representative images from wound healing migration assays conducted in SCG1 and SCG2 cells treated with pcNC, pcRDH10 and the combination of pcRDH10 and LY294002. *p < .05; **p < .01; ***p < .001.

RDH10 promotes EMT process of SCG cells in vivo
For further validation of RDH10′ functions in SCG, we established a tumor transplantation model by injecting stable transfected SCG1 cells subcutaneously into immunodeficient mice (n = 5 for each group). After 4 weeks, we found that the growth of tumors in RDH10 overexpressed group was faster than the control group, and the tumor growth was inhibited with LY294002 treatment (Figure 10(A)). Western blot for the tumor tissues in these groups indicated that LY294003 reversed the increase of Vimentin and N-cadherin level caused by pcRDH10 (Figure 10(B)). These results demonstrated that RDH10 could regulate EMT process in vivo via PI3K-AKT pathway. Animal experiment verified the functions of RDH10 for EMT process in SCG. (A) LY294002 blocked the enhancement of tumor development by pcRDH10. (B) Western blot of tumor tissues from in vivo experiment demonstrated that LY294003 reversed the increase of Vimentin and N-cadherin level caused by pcRDH10. *p < .05; **p < .01; ***p < .001.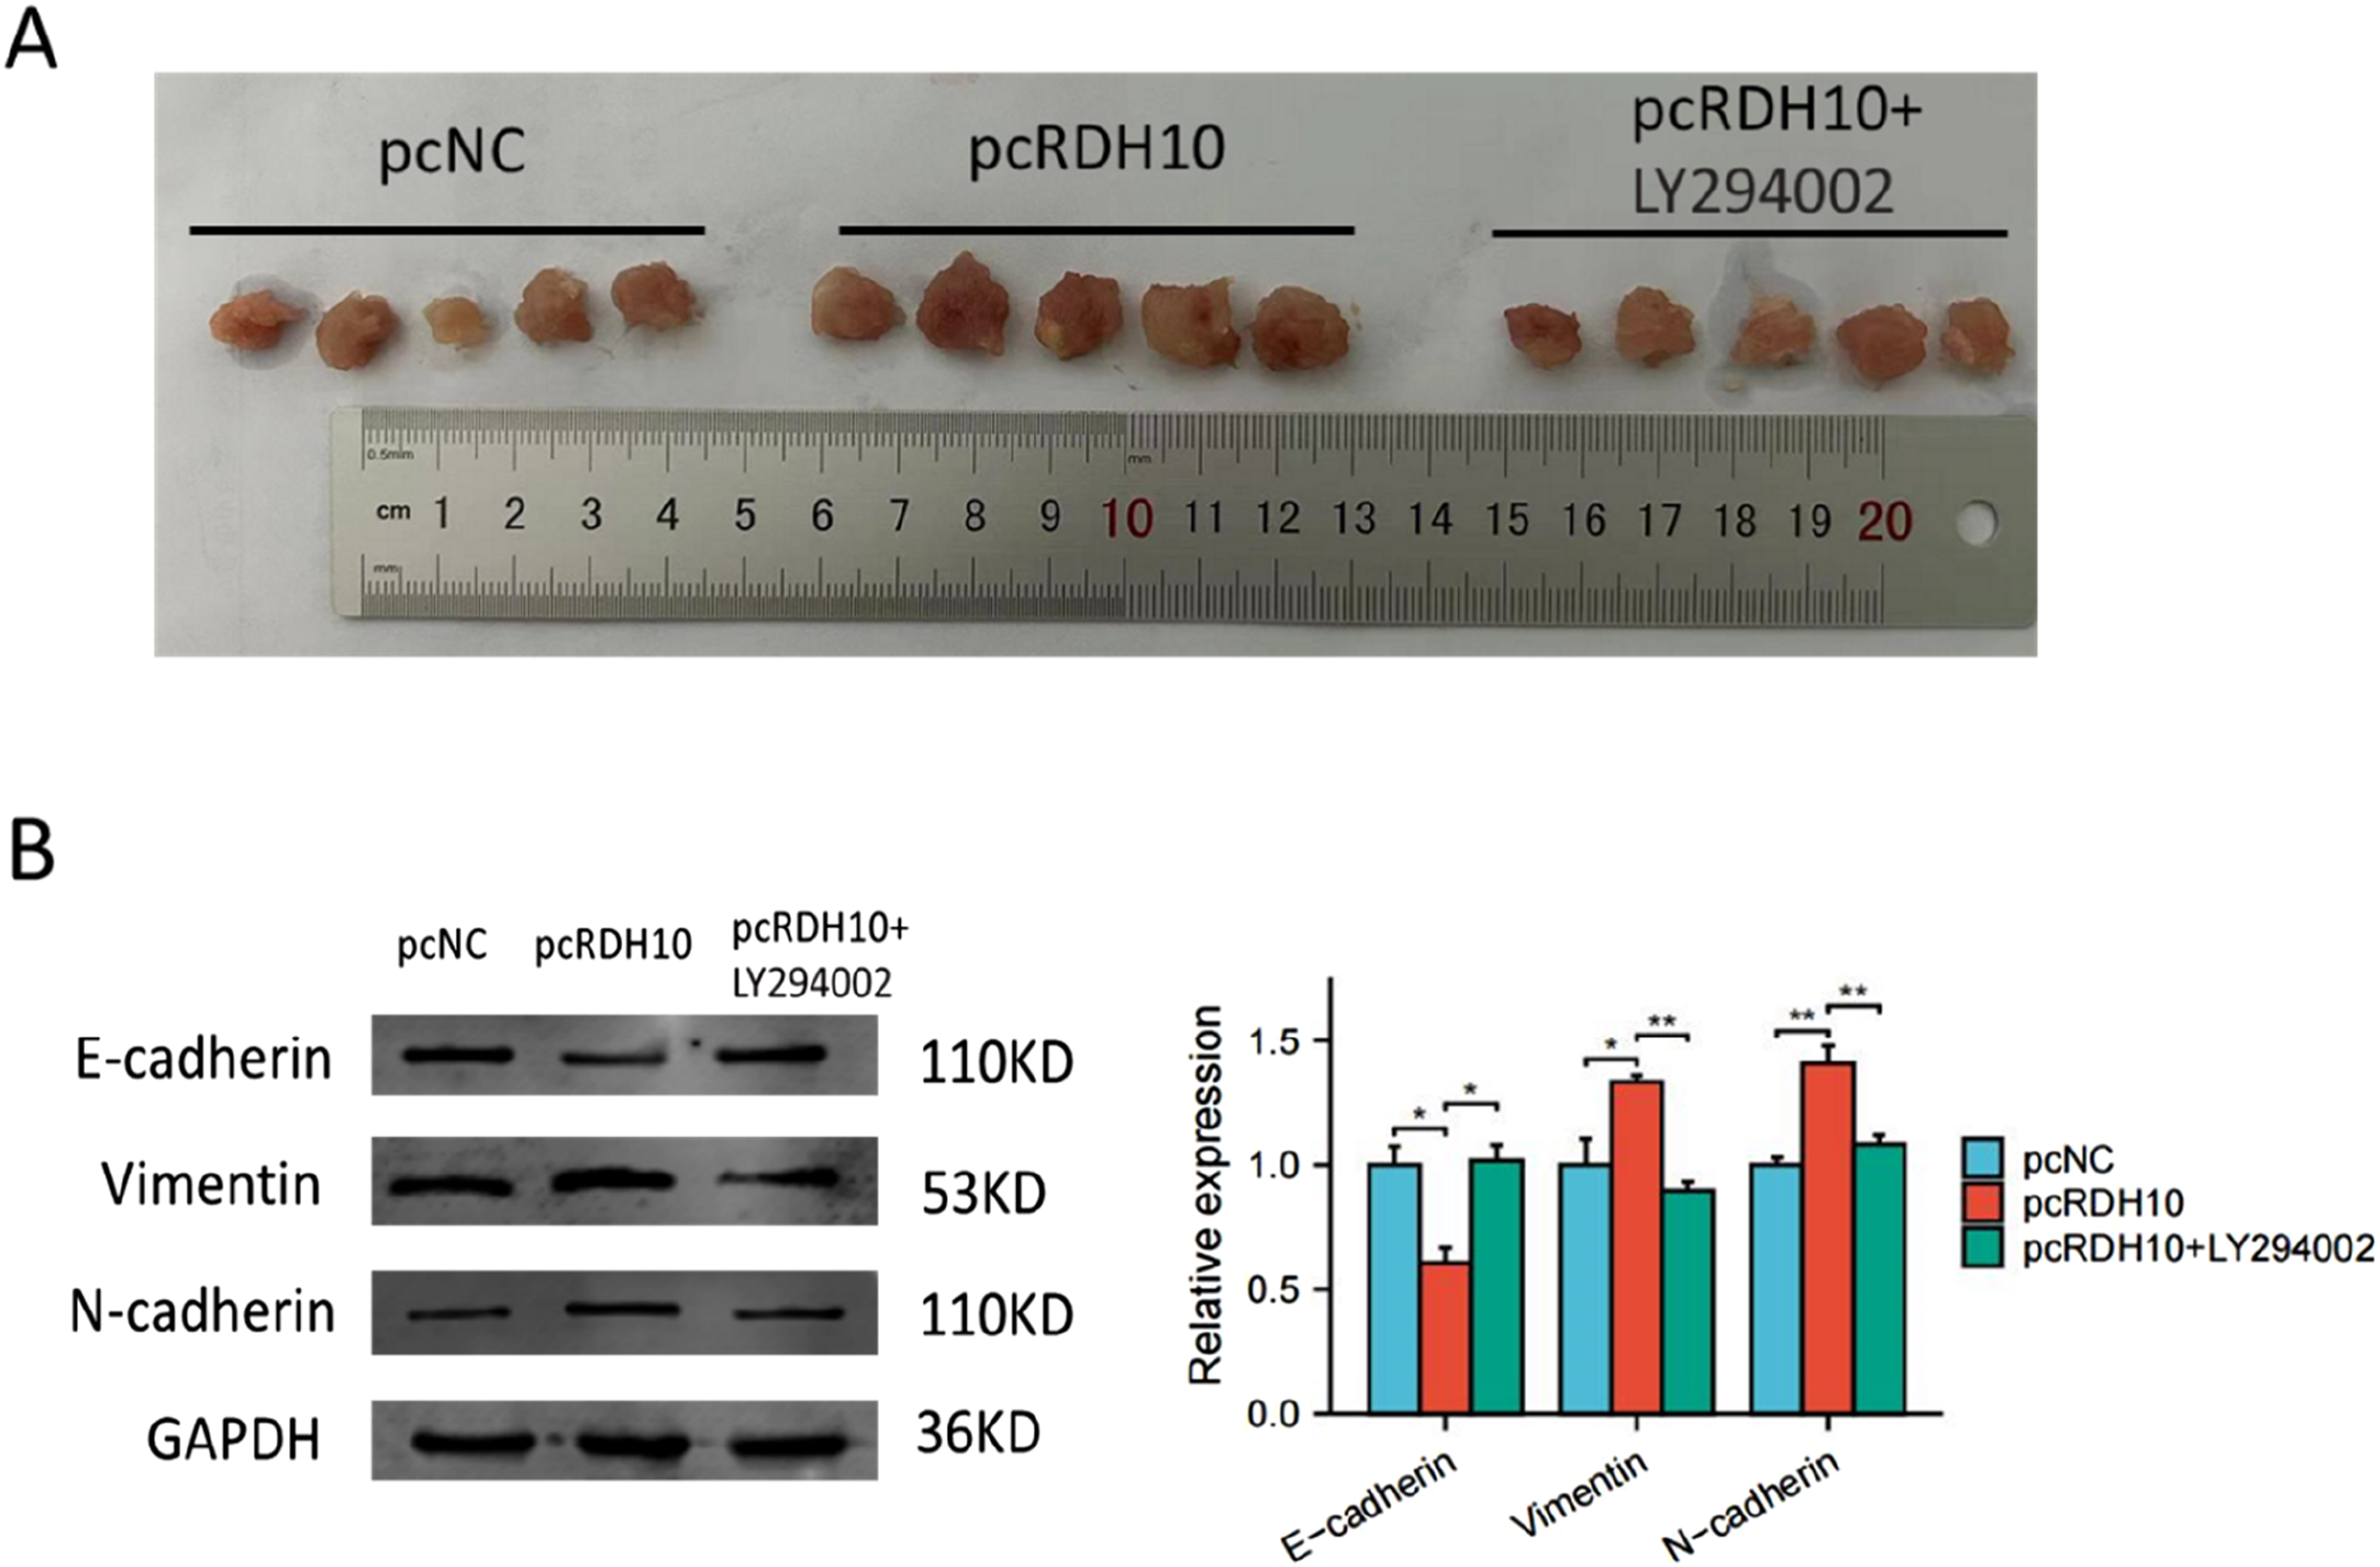
Discussion
At present, there are no more effective treatment for SCG, and SCG patients undergoing surgery often have a disappointing outcome for serious complications. Radiotherapy is predominantly preferred in numerous instances, although there remains a debate regarding the most effective radiotherapy approaches. 20 SCG has a tendency to metastasize to brain, and EMT has been shown to be the key step of metastatic process. Therefore, understanding the mechanism of EMT process in SCG has great significance for developing novel therapies.
In past research, it was found that EMT has a significant impact on tumor occurrence, malignant progression, tumor cell migration, intravascular invasion, metastasis, recurrence, and resistance to treatment. However, effect of EMT in gliomas has been relatively nascent, leaving numerous questions unanswered. In the present research, we identified EMT as a critical factor which was closely associated with poor prognosis in glioma. Using DEG and ssGSEA analysis, RDH10 was screen out as the most related gene to EMT process in SCG.
RDH10 is responsible for converting all-trans-retinol to all-trans-retinal using NADP as a cofactor. Research conducted on mice indicated that this particular protein plays crucial roles in the production of embryonic retinoic acid and is necessary for the development of limbs, craniofacial features, and organs.21,22 Supplementing the embryo with retinoic acid during pregnancy could prevent the embryonic lethality of mice that express a missense mutation in RDH10. 23 Recent research has documented the impact of RDH10 on tumor progression. It was reported that RDH10 mutations were commonly found in malignant non-small-cell lung cancer.24,25 In ovarian clear cell carcinomas, RDH10 was found upregulated in tumor tissue, and modulated PCK1 expression to promote stemness and intracellular carbohydrate storage of tumor cells. 26 RDH10 Overexpression in liver cancer led to an increase in retinoic acid receptor b/p21(Cip), ultimately suppressing HepG2 cells growth. 27 Despite several studies in recent years highlighting the tumor-promoting role of RDH10 in glioma, its biological functions in SCG remain unclear. Combining with the results in past research and our bioinformatic analysis, we inferred that RDH10 might have an important role in SCG. Herein, our research revealed that RDH10 was overexpressed in SCG tissue, and correlated with tumor grade. SCG cells with reduced RDH10 expression showed higher level of E-Cadherin and lower levels of N-Cadherin and Vimentin. Trans-well and wound healing assays demonstrated migration and invasion abilities of SCG cells reduced after RDH10 knockdown, and enhanced after RDH10 overexpression.
PI3K-AKT signaling is implicated in initiation and progression of cancer in multiple processes. It is well acknowledged that invasion, metastasis, and neovascularization of tumor cells are facilitated by PI3K-AKT pathway activation. 28 Growing evidence suggested a strong connection between EMT process and PI3K-AKT pathway. Studies indicated that activated p-AKT promotes the progression of EMT by decreasing E-cadherin and β-catenin levels, and increasing Vimentin levels. 29 AKT activation can inhibit cell migration and reduce E-cadherin expression by triggering Twist activation. 30 It was reported that AKT might be activated by growth factors, abnormal tumor suppressors, and certain proteins that lead to transcription factor expression and EMT activation. By activating PI3K-AKT pathway, circZNF139, TEAD4, ZNF139 and GAL1 promoted tumor cell invasion and EMT in bladder cancer.31–33 Research have shown that inhibition of the PI3K-AKT pathway led to reduced expression of downstream target genes, thereby impeding EMT and the invasive behavior of gastric cancer cells. 34 In this research, enrichment analysis was conducted to investigate the mechanism by which RDH10 induces EMT, revealing significant correlations between RDH10 and the PI3K-AKT pathway. This suggested that PI3K-AKT pathway might be involved in the regulation of RDH10-induced EMT. Western blot analysis demonstrated that the levels of p-mTOR and p-AKT decreased following RDH10 knockdown, indicating that RDH10 acted as a modulator of PI3K-AKT pathway in SCG cells. Furthermore, treatment with PI3K-AKT pathway inhibitor LY294002 was able to reverse the effects of RDH10 overexpression in SCG cells. These results demonstrated that the regulatory effects of RDH10 for EMT in SCG, depended on PI3K-AKT pathway.
It is crucial to understand how tumor invasion relates to EMT in order to develop effective cancer-prevention strategies. However, few studies have examined the molecular mechanisms behind the EMT process in glioma. Our bioinformatic analysis and published research indicated that RDH10 played an important role for EMT in SCG. RDH10 was previously investigated in cerebral glioma, but its impact on SCG remained unclear. Our study demonstrated that RDH10 facilitated the migration and invasion of SCG cells through EMT process, and elevated RDH10 expression was correlated with higher tumor grade. Further investigation revealed that RDH10-mediated EMT was regulated by PI3K-AKT pathway. Treatment targeting RDH10 might provide potential therapeutic approaches to inhibit SCG invasion and metastasis.
There were also some shortcomings in our study. First, our research indicated that RDH10 promotes EMT process by PI3K-AKT pathway, but the specific and direct targets of RDH10 controlling PI3K/AKT pathway and the manner how RDH10 regulates PI3K-AKT pathway are not interpreted here and need to be studied further. Secondly, it is unclear whether the molecular markers of intracranial glioma can apply to SCG due to molecular characteristic difference between SCG and intracranial glioma. Substantial numbers of SCG sample in our research lack the information of molecular pathological diagnosis according to the 2021 WHO Classification of CNS tumor. Our follow-up work aims to explore the accurate diagnosis of our SCG samples by multiple technologies including genetic testing and DNA methylation analysis. Thirdly, the limited sample size of patients with SCG in this study was due to the low incidence of the condition, making it challenging to estimate the clinical significance of RDH10 in SCG. Future research should involve larger, multicenter clinical cohorts should be conducted to explore the clinical significance of RDH10. Moreover, for the fact that it is currently very difficult to establish the tumor model of cerebrospinal fluid metastasis, our in vivo experiment only preliminarily explored the functions of RDH10 in SCG using subcutaneous xenografts.
Conclusion
RDH10 was identified as an oncogenic gene in SCG, facilitating the EMT process through the PI3K-AKT pathway. This study offers new perspectives on the molecular mechanisms of EMT and potential therapeutic targets for SCG.
Supplemental Material
Supplemental Material - Retinol dehydrogenase 10 promotes epithelial-mesenchymal transition in spinal cord gliomas via PI3K/AKT pathway
Supplemental Material for Retinol dehydrogenase 10 promotes epithelial-mesenchymal transition in spinal cord gliomas via PI3K/AKT pathway by Zijun Zhao, Zihan Song, Zairan Wang, Fan Zhang, Ze Ding, Zongmao Zhao, Liqiang Liu and Tao Fan in International Journal of Immunopathology and Pharmacology.
Footnotes
Acknowledgments
We are very grateful to the authors of the databases used in this article, and their data facilitated our research.
Author contributions
Zijun Zhao, Zihan Song: Conceptualization, Data curation, Formal analysis, Methodology, Project administration, Resources, Visualization, Writing - original draft. Zongmao Zhao, Zairan Wang, Ze Ding, Fan Zhang: Software, Validation. Tao Fan, Liqiang Liu: Funding acquisition, Investigation, Supervision, Writing - review & editing.
Declaration of conflicting interests
The author(s) declared no potential conflicts of interest with respect to the research, authorship, and/or publication of this article.
Funding
The author(s) received no financial support for the research, authorship, and/or publication of this article.
Ethical statement
Data availability statement
Supplemental Material
Supplemental material for this article is available online.
References
Supplementary Material
Please find the following supplemental material available below.
For Open Access articles published under a Creative Commons License, all supplemental material carries the same license as the article it is associated with.
For non-Open Access articles published, all supplemental material carries a non-exclusive license, and permission requests for re-use of supplemental material or any part of supplemental material shall be sent directly to the copyright owner as specified in the copyright notice associated with the article.