
Abstract
Introduction
With the increase in China’s aging population, the prevalence and disability rates of stroke are increasing year by year. A survey showed that stroke was the leading cause of death in Chinese adults, with acute ischemic stroke (AIS) accounting for about 80% of cases, resulting in a significant burden on both society and the economy. 1 Recombinant tissue plasminogen activator (rt-PA) is an effective therapy for AIS, and intravenous thrombolysis within 4.5 h has been demonstrated to significantly reduce disability following AIS.2,3 However, not all patients benefit from intravenous thrombolytic therapy. A significant number of patients, even after receiving thrombolytic therapy, are at increased risk of hemorrhage transformation and fatal intracranial hemorrhage, often leading to poor prognosis. 4 The efficacy of intravenous thrombolytic therapy is significantly related to the time of administration. Before treatment, assessment of the risks and benefits of thrombolytic therapy may delay the timely vascular recanalization of patients and hinder the recovery of neurological function. Therefore, an accurate early assessment of the prognosis of patients with AIS within the time window of intravenous thrombolytic therapy would be helpful for decision-making regarding treatment, thereby reducing time delay. In recent years, there have been numerous studies describing predictive models for the prognosis of patients receiving intravenous thrombolysis for AIS. The early and accurate prediction of the long-term prognosis of AIS is not only helpful to guide the decision-making of clinicians but can also provide an objective reference for the expectations of patients and their families.
A nomogram is a statistical tool used to predict the probability or risk of a specific event. It provides more accurate and personalized predictions by the comprehensive consideration of multiple factors, assisting clinicians in understanding the potential risks of patients, thus leading to more informed clinical decisions. Nomograms are often used to predict disease risk, treatment effects, and survival rates. 5 The model is presented in a graphical visualization that allows doctors and researchers to quickly estimate risk without the need for complex calculations. For example, a nomogram based on the baseline NIH Stroke Score (NIHSS), blood sugar, and blood cholesterol level for patients with partial-and full anterior circulation infarction (OCSP type) were used to predict patient outcomes following intravenous thrombolysis. It was found that the areas under the receiver operating characteristic (ROC) curve (AUCs) for the training and validation cohorts were 0.767 (95%CI, 0.653-0.772) and 0.836 (95%CI, 0.697-0.847), respectively, showing good predictive accuracy. 6 For AIS, early rehabilitation has been shown to positively affect functional outcomes at 3 months.7,8 However, there is a lack of research on the diagnosis, rehabilitation, and prognosis of stroke recovery, which are currently mainly based on the doctor’s experience.9,10 Therefore, researchers have used the TOAST classification, antihypertensive drugs, 15-day Barthel Index score, and 15-day mRS score to predict adverse functional outcomes in the recovery of patients after AIS. A nomogram based on these factors was found to have good predictive ability in both the training (AUC = 0.950) and test (AUC = 0.942) groups. 11 At present, most prognostic nodes for AIS use the time point of 3 months, and there are few studies on longer prognosis. Multivariate regression analysis of 149 patients with acute ischemic stroke showed that physical inactivity, neutrophil count, cerebrovascular disease score, and length of hospital stay were independent risk factors for poor 6-month functional recovery. The AUC for the nomogram based on the above indicators was 0.936, and had a good internal validation consistency index. 12 However, these models tend to involve many variables, have complex calculation formulae, low predictive efficacies, or require the use of specialized software, and thus present challenges for their application in clinical practice. Ideally, the main indicators involved in a predictive model should be clinical data and imaging information that can be easily and rapidly obtained.13–15
The randomized controlled trial design is regarded as the most scientific and rigorous research design method, but such trials are often difficult to conduct in the real world due to medical ethical issues and complex operational difficulties, and observational methods are thus used in most investigations. 16 Observational studies have the disadvantage that the allocation of study groups is not random, and their allocation is affected by the characteristics of individual patients and patient selection by the investigators, which inevitably leads to differences in some baseline covariates between the study group and the validation group, potentially leading to bias and research results that do not accurately reflect the real situation. Statistical methods are needed to reduce confounding. 17 Propensity Score Matching (PSM) computes a score from a baseline covariate that varies among subjects and rebalances it between the study and validation groups, so that measured and unmeasured confounders are evenly distributed in both groups, making the results more reliable. 18
In this study, the PSM method was used for the accurate identification of factors related to poor prognosis after intravenous thrombolysis of alteplase in AIS. A nomogram was then constructed to predict the risk of poor prognosis in patients with AIS, to provide a more accurate basis for clinical decision-making.
Data and methods
General information
The study retrospectively enrolled 254 patients with AIS who underwent rt-PA intravenous thrombolysis in the Department of Neurology of Deyang People’s Hospital from January 2018 to December 2020.
Inclusion criteria: (1) Symptoms of neurological impairment and diagnosis of AIS; (2) Alteplase intravenous thrombolytic indication 19 ; (3) Symptom onset time <4.5 h; (4) Aged 18 or above.
Exclusion criteria: (1) Patients with intravenous thrombolysis contraindications in alteplase; (2) Patients with incomplete clinical data and those lost to follow-up; (3) An mRS score ≥2 points before intravenous thrombolysis; (4) Patients with severe heart, liver, and renal insufficiency; (5) Patients with infections, blood diseases, malignant tumors. or rheumatic immune system diseases.
Data collection
The clinical characteristics of each patient were collected, consisting of the following three types: (1) General data, including age, sex, weight, and smoking; (2) Comorbidities and history, including hypertension, hyperlipidemia, diabetes, atrial fibrillation, previous stroke history, congestive heart failure history, and coronary heart disease; (3) Other indicators, including DNT, ONT, baseline systolic and diastolic blood pressure, baseline blood glucose, white blood cell count, red blood cell count, neutrophil ratio, hemoglobin, platelet count, PT, APTT, INR, fibrinogen, D-dimer, Na, K, urea nitrogen, baseline mRS Score, baseline NIHSS score, and mRS Score at 3 months after the disease. 20 All blood samples were collected at the time of hospital admission but before alteplase intravenous thrombolytic therapy.
Intravenous thrombolysis
All patients were treated with intravenous thrombolysis with recombinant tissue plasminogen activator (rt-PA) manufactured by Boehringer Ingelheim (Germany). The therapeutic dose of rt-PA was 0.9 mg/kg, of which 10% of the dose was injected intravenously within 1 min, and the remaining 90% was pumped intravenously within 60 min. The maximum dose of rt-PA should not exceed 90 mg.
Grouping, observation indicators and related definitions
The main outcome index of the study was the mRS score at 3 months. This score was used as an indicator to evaluate the good/poor outcome after intravenous thrombolysis (mRS scores were 0, 1, 2, 3, 4, 5, and 6, with 6 representing death), and the patients were divided into the good prognosis group (mRS Score ≤2, assigned a value of 0) and the poor prognosis group (mRS Score >2, assigned a value of 1).
21
The general data (potential confounding factors) of the two groups were matched using PSM to achieve a balance in the general data of the two groups. The two matched patient groups were compared, and statistically different risk factors were included in a multifactorial logistic regression model to further identify risk factors for poor prognosis following alteplase intravenous thrombolysis in AIS. The results of the matched logistic regression analyses were then used to construct a nomogram to predict poor prognosis in patients with AIS following alteplase intravenous thrombolysis, together with validation of the findings in the validation group, while receiver operating characteristic (ROC) curves, decision curve analysis (DCA), and calibration curves were used to evaluate the predictive performance of the model (Figure 1). Flowchart.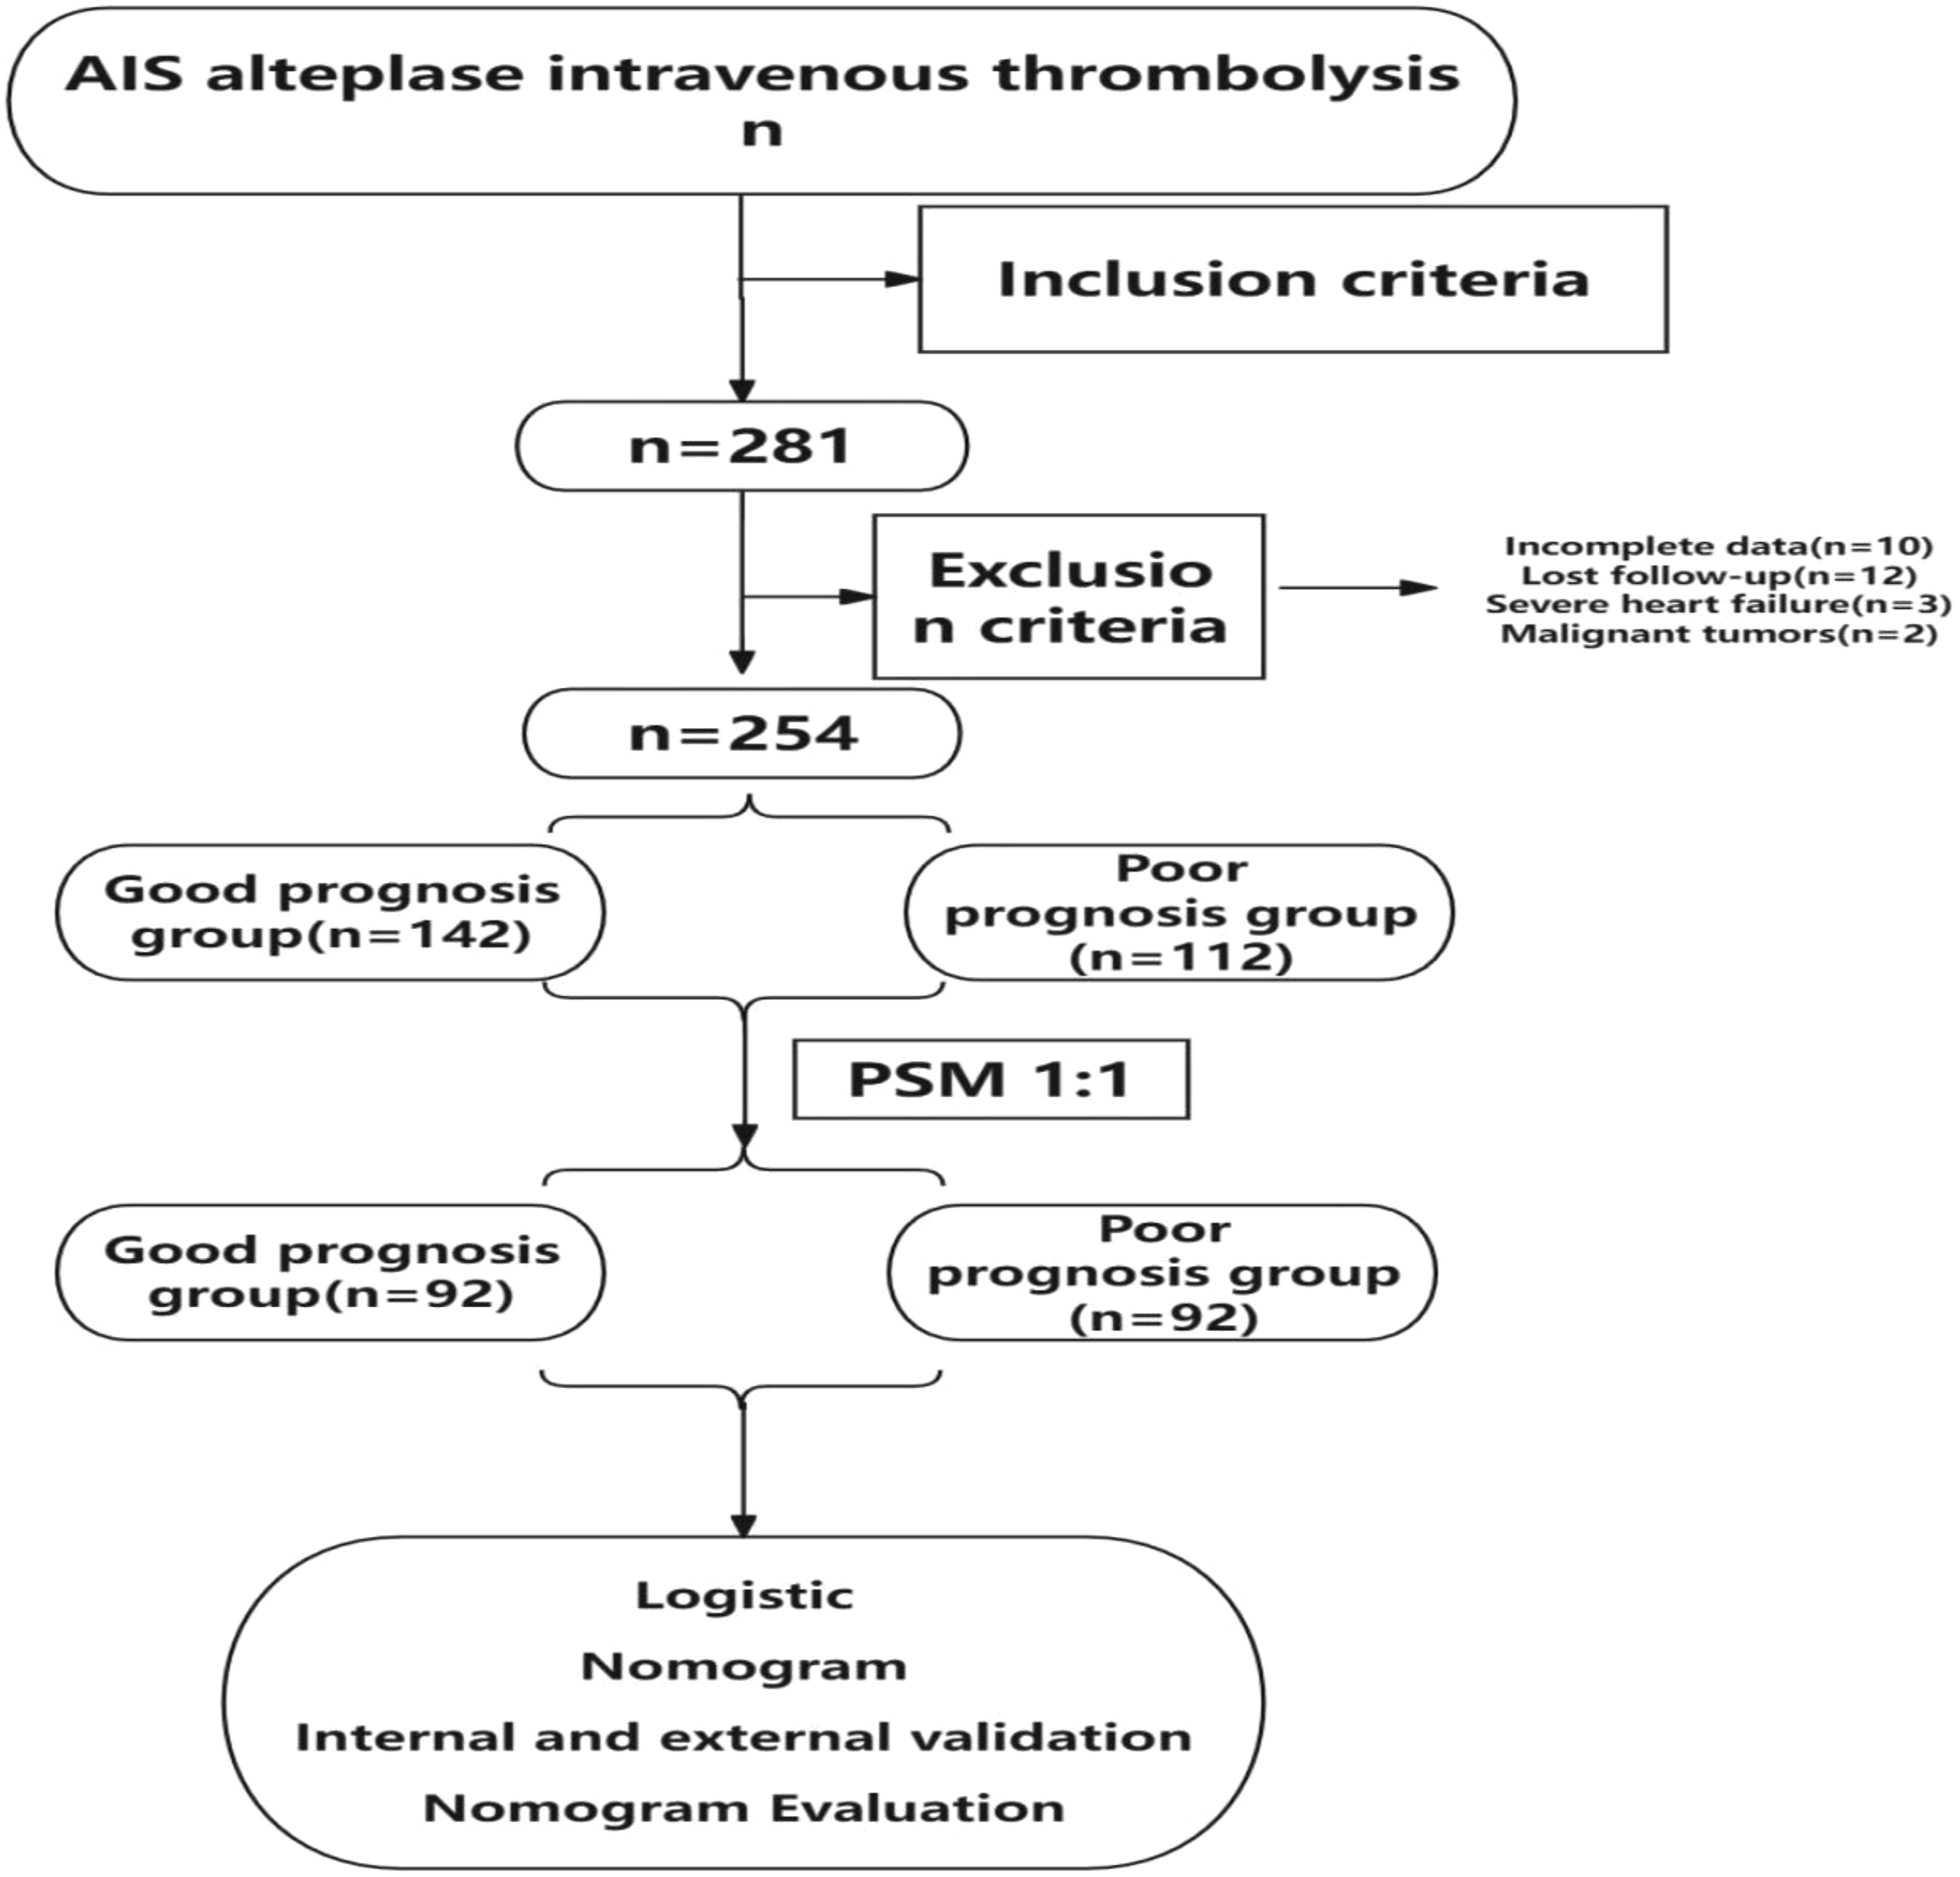
Statistical analysis
In this study, R version 4.3 and SPSS 25.0 were used for statistical analysis. Normally distributed data were analyzed using t-tests and are presented as means and standard deviations (x ± s). Non-parametric tests were used for the analysis of non-normally distributed data and the data are shown as medians M (P25,P75). Clinical features were compared using chi-square, Mann-Whitney U, Kruskal-Wallas, or Fisher’s exact tests, and are expressed as n(%). In the orientation score matching, Age, Weight, Sex and Smoke were used as matching variables, the matching ratio was set to 1:1, and the caliper value was set to 0.02. With outcome indicators as dependent variables, univariate analysis was performed on the matched data, variables with P < 0.05 were included in univariate and multivariate Logistic regression, and the risk factors for poor prognosis were screened by backward method based on Wald statistics. Based on the above risk factors, Rstudio software (Data processing and analysis were performed using R(4.3), along with Zstats V1.0) was used to establish the Normograph and complete the internal and external verification web page. Receiver operating curve (ROC curve), clinical decision curve (DCA) and calibration curve were used to evaluate the prediction effect of the model. An inspection level of α = 0.05 and P < 0.05 were considered statistically significant.
Results
Comparison of general information before PSM
Comparison of general information between the two groups before PSM.

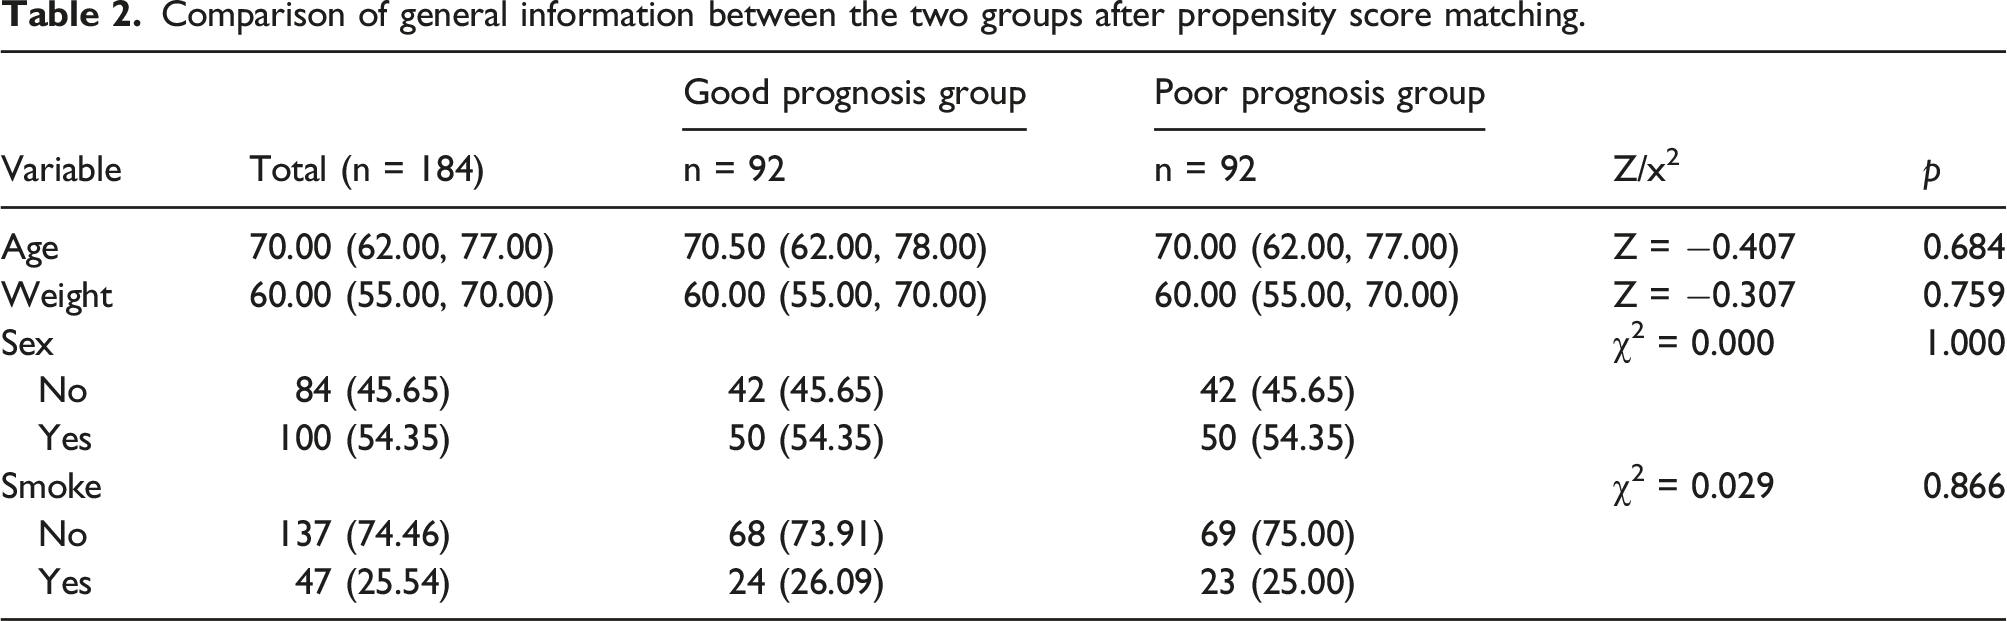
Comparison of general information between the two groups after propensity score matching
Comparison of general information between the two groups after propensity score matching.
Propensity score matching equilibrium test
The standardized mean (SMD) was used for the balance test. As shown in Figure 2, the SMD of each continuous variable after PSM was less than 10%, and it could thus be considered that the two groups of patients reached equilibrium in terms of baseline clinical characteristics. Equilibrium test.
Common support test for propensity score matching
The co-support test is another important hypothesis test used in PSM.
18
This is performed using kernel density plots, essentially observing that the two groups have the same propensity score value. As shown in Figure 3, in terms of the pre-matching kernel density (left part), there was a large difference in the distribution of the P score values between the good and poor prognosis groups, which if ignored (without PSM and direct analysis of the difference), is likely to lead to biased conclusions in the study. At the same time, it is also evident that there was an overlap between the two groups, indicating that the two groups were eligible to use the PSM model. From the nuclear density after matching (the right part), it can be seen that after matching, the two groups appeared to cover and approach each other, with a large common value interval, indicating that the two groups were very close to one another in terms of clinical characteristics, with good matching, and thus passed the co-support test. Co-support test.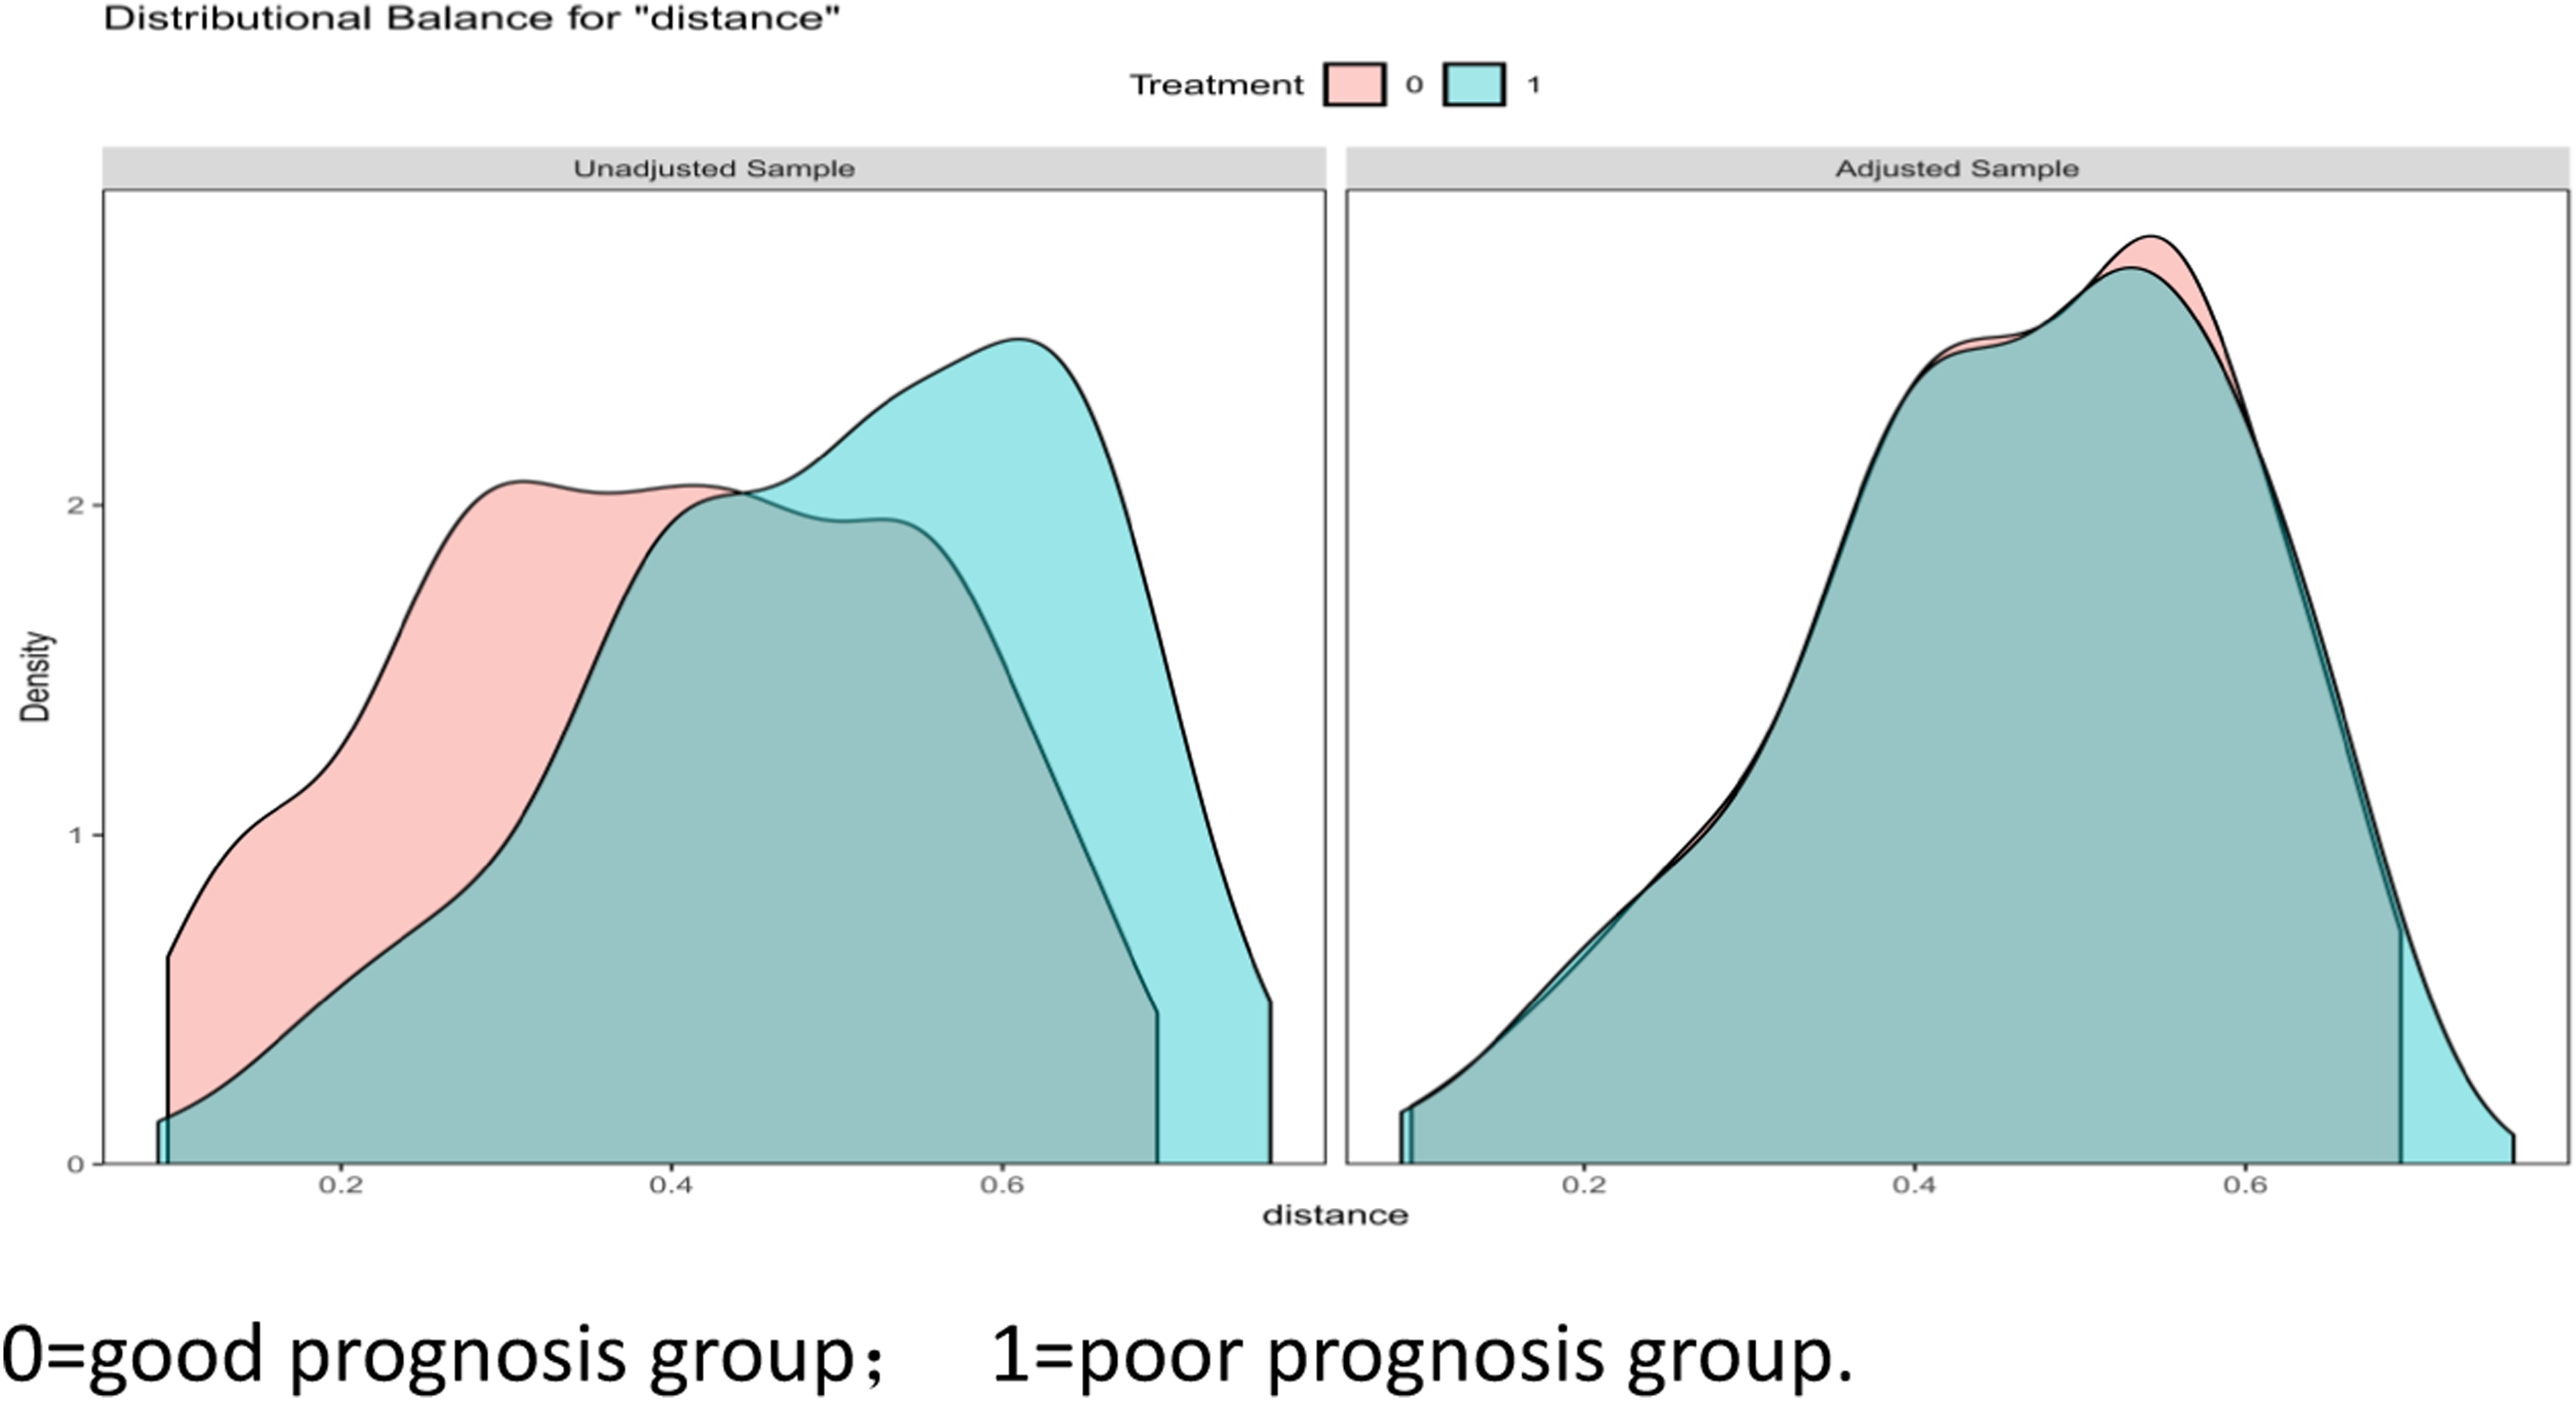
One-way analysis of the clinical characteristics of the two groups after matching
One-way analysis of the clinical characteristics of the two groups after matching.

APTT: activated partial thromboplastin time;DNT: Door to Needle Time; ONT: Onset to Needle Time;PT: ProthrombinTime;INR: international normalized ratio;K: potassium.
Logistic analysis of risk factors for poor prognosis
Risk Factors for Poor Prognosis.

Construction of the nomogram for the prediction of poor prognosis
Based on the results of the multivariate logistic regression analysis, a nomogram was constructed for the prediction of poor prognosis following intravenous thrombolysis with alteplase after AIS, as shown in Figure 4. When determining the risk of poor prognosis for a specific patient, it is first necessary to determine the values of each variable included in the study. Different values of variables can yield corresponding scores at the corresponding positions in the nomogram. The scores of all the variables included in the study are then summed to obtain the total score. Based on the total score, the risk axis (Risk axis) at the bottom of the column chart can be predicted and thus the corresponding probability of poor prognosis after intravenous thrombolysis with ateplase in AIS. Nomogram model.
Nomogram evaluation
Internal and external validation and calibration curves
Comparison of clinical characteristics between the training and validation groups.

APTT: activated partial thromboplastin time;DNT: Door to Needle Time; ONT: Onset to Needle Time;PT: ProthrombinTime;INR: international normalized ratio;K: potassium.
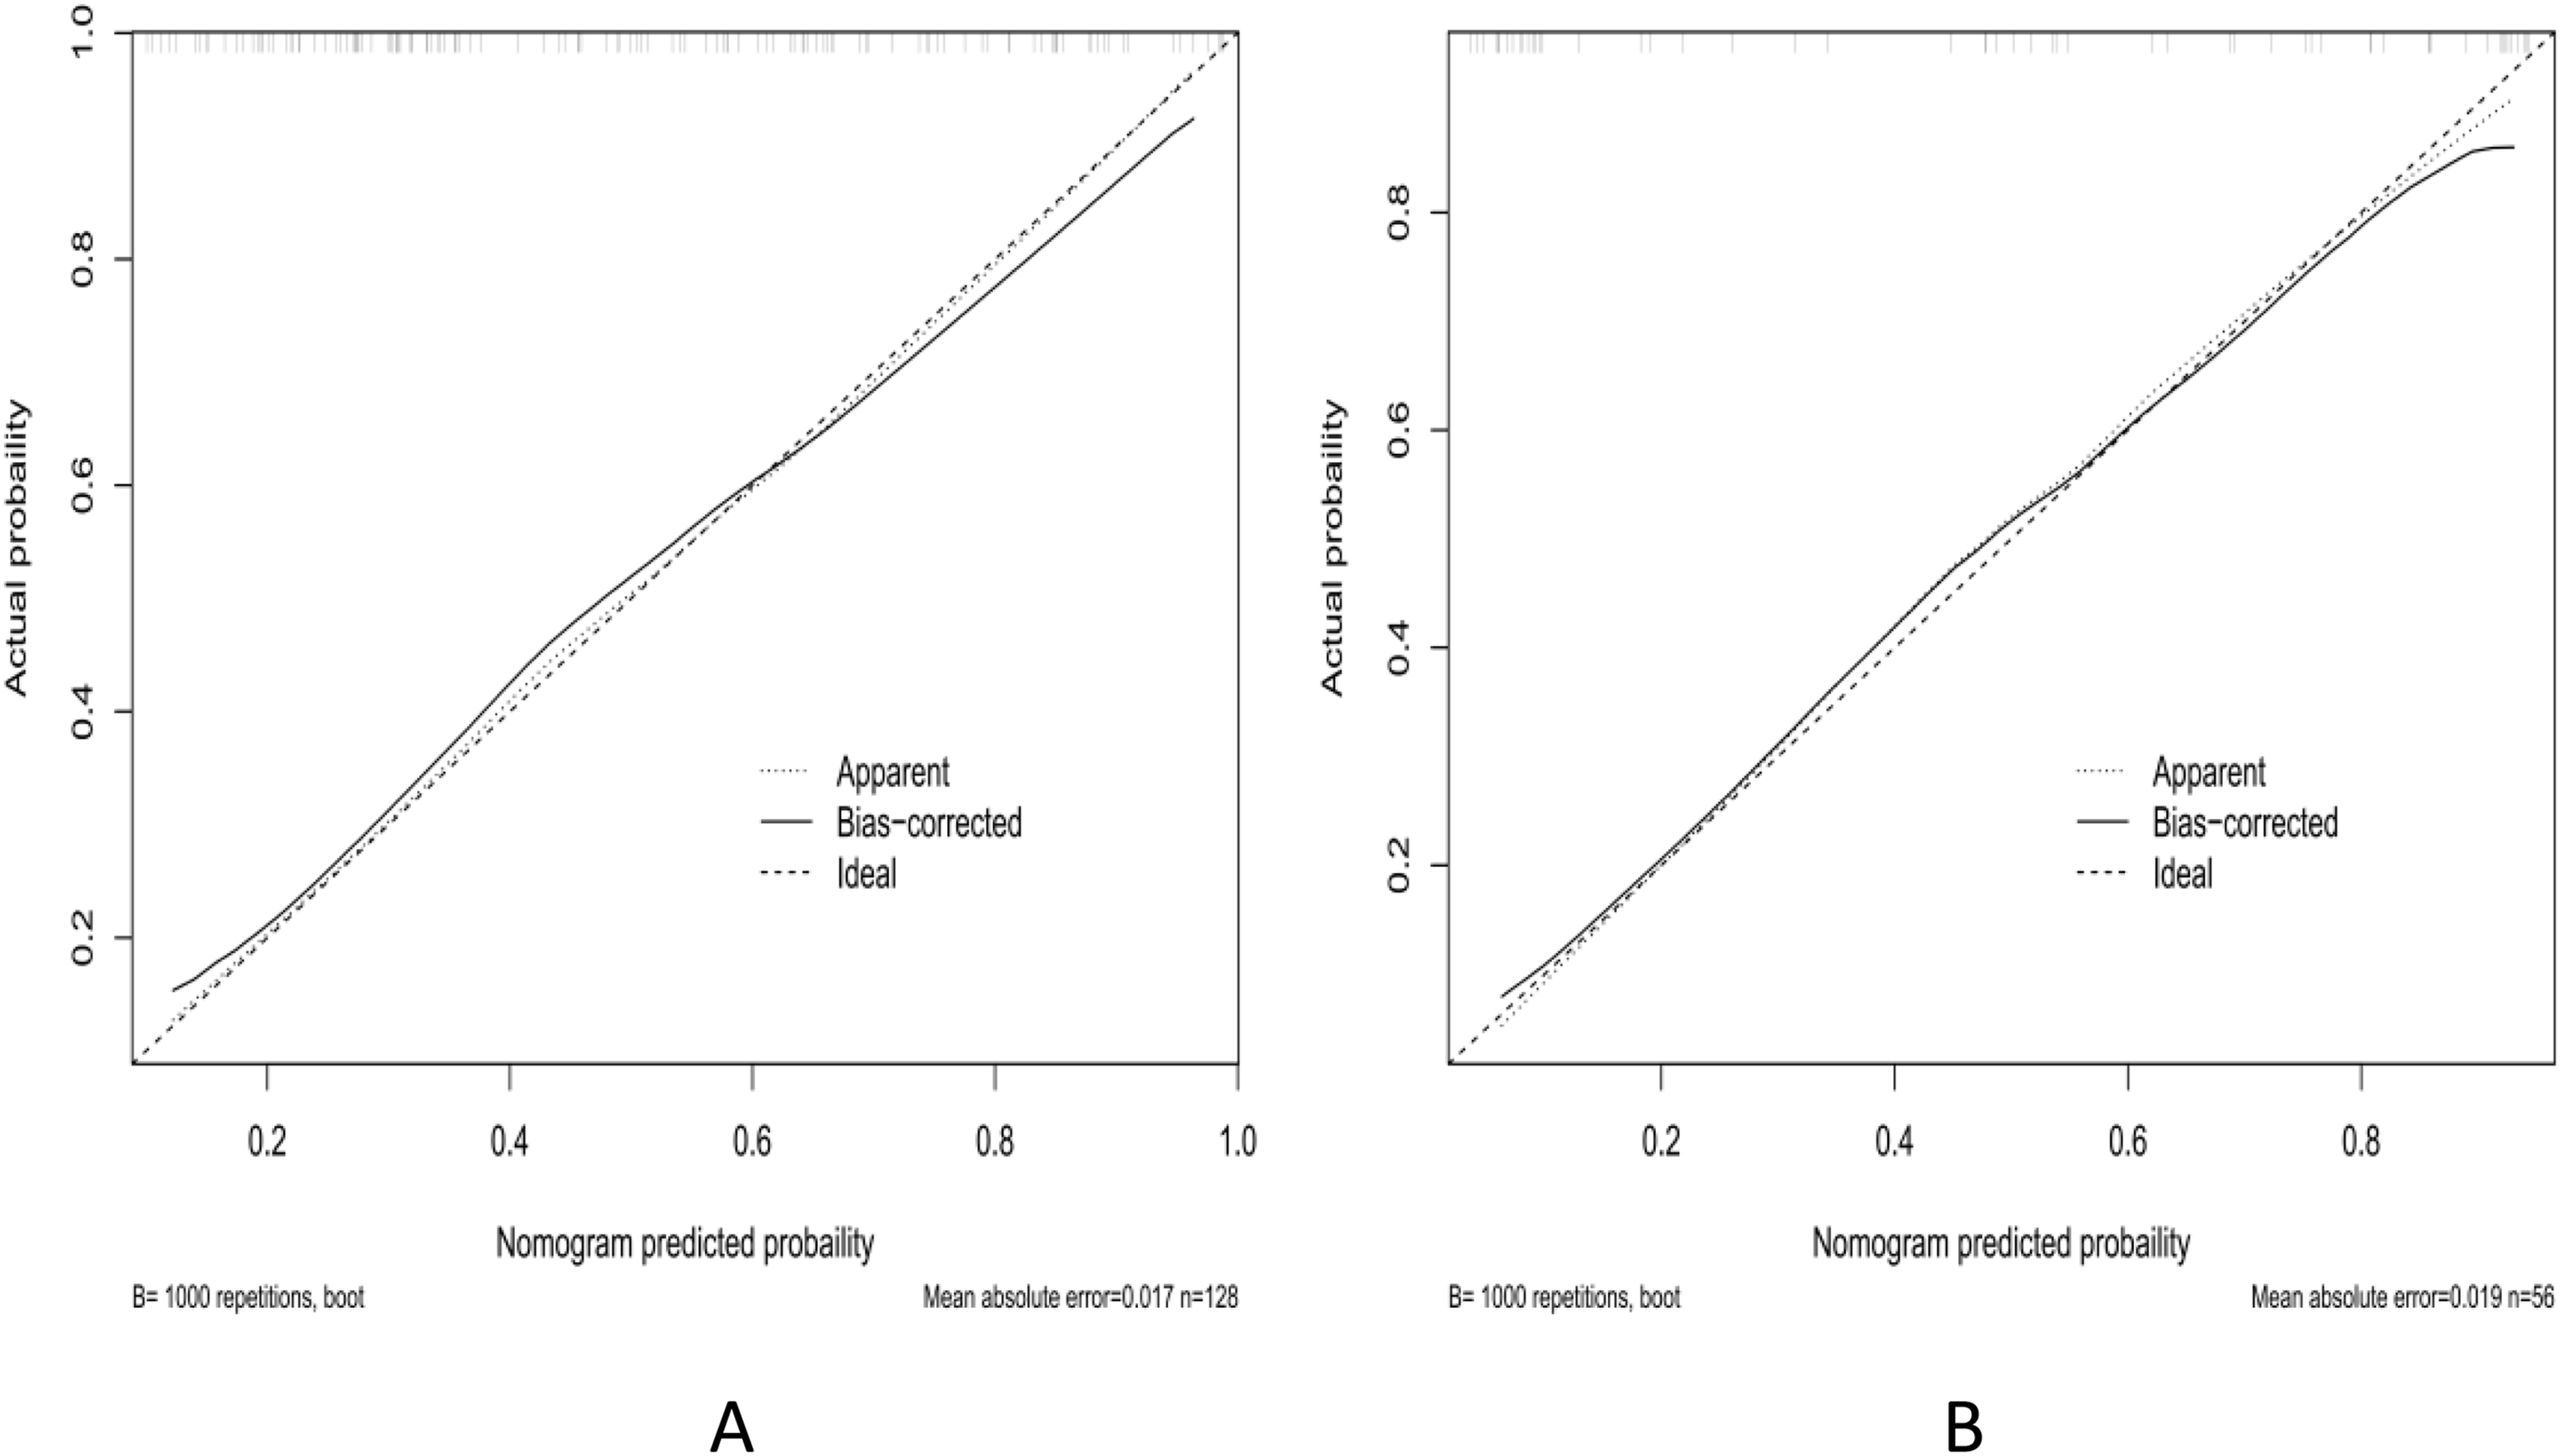
Calibration curves for internal (A, training group) and external (B, validation group) calibration.
ROC curves
The model differentiation was evaluated by ROC curves. The areas under the ROC curves (AUC) for the training group and the validation group were 0.792 (0.715-0.870) and 0.885 (0.798-0.972), respectively. The Hosmer-Lemeshow goodness-of-fit test was used to evaluate the degree of fit, and the results showed that the model had good accuracy in predicting poor prognosis (Figure 6). ROC curves for the training group (A) and the validation group (B).
DCA curves
The DCA curves were compiled to evaluate the clinical practicability of the nomogram(Figure 7). In the DCA curve shown in Figure 7, when the threshold probability was between 10 and 80%, the net benefit of using the nomogram to predict poor prognosis after intravenous thrombolysis of alteplase in AIS was higher, and the inverse model showed good clinical practicability. DCA curves of the training group (A) and the validation group (B).
Discussion
As primary prevention based on traditional risk factors has become more widespread, the incidence of AIS has been greatly reduced. 22 However, AIS can still lead to significant disability, reducing the patient’s ability to perform tasks associated with daily life and imposing major burdens on their families and society.23,24 Reperfusion therapy is one of the main treatment options for AIS and can significantly improve the prognosis of patients. 25 Intravenous thrombolytic therapy with alteplase performed during the early stage of acute cerebral infarction is both safe and reliable. However, due to differences in age, sex, body weight and other factors, some patients may experience complications such as symptomatic intracranial hemorrhage and vasogenic edema, and the recovery of neurological function may even be reduced after thrombolytic therapy, indicating that not all patients within the time window should be treated with rt-PA intravenous thrombolytic therapy. 26 Therefore, the early accurate identification and prediction of groups at high risk of poor prognosis, together with early intervention and treatment, are of great importance in improving the quality of life of patients after AIS.
In this study, PSM was used to achieve a balance between the good prognosis group and the poor prognosis group in terms of age, weight, sex, and smoking, among other factors. Logistic regression analysis found that baseline NIHSS, baseline blood glucose, and hyperlipidemia were risk factors for poor prognosis in patients with AIS after alteplase intravenous thrombolysis. The NIHSS score is widely used in clinical neurology, mainly for evaluating the severity of stroke. Some studies have also found that the NIHSS score has a specific relationship with the prognosis of AIS and the transformation of symptomatic intracranial hemorrhage.27,28 In recent years, the prediction of AIS based on the NIHSS score has been gradually developed, such as the use of the NIHSS score combined with time of onset. A Japanese study investigated the use of a modified rating scale of time and OTT, using the data of patients who had received rt-PA thrombolysis at 10 stroke centers to obtain a simple formula for calculating prognosis: NIHSS-time score = initial NIHSS score × OTT (h). A score ≤20 indicated good prognosis, while a score ≥40 indicates poor prognosis. 29 In addition, the model was subsequently validated externally, and it was found that NIHSS-time score predicted the prognosis of patients after receiving endovascular therapy with good accuracy (OR 0.372,95%CI 0.175-0.789). 30 In addition, studies have found that compared with the current NIHSS score at the onset of stroke, the NIHSS score on day 7 is more accurate for predicting prognosis, possibly because the condition of the patient is not stable for 7 days after stroke onset and is prone to change, so that a correlation between the NIHSS score on the day of the stroke and the outcome on day 90 is not ideal.27,31 The Lausanne Stroke Scale (Acute Stroke Registry and Analysis of Stroke) Lausanne, ASTRAL score, is a tool used to predict the outcome of stroke at 3 months; this includes the patient’s age, NIHSS score, time to hospital, visual field, acute stage blood glucose, and level of consciousness. External validation in the European population showed that it had good predictive efficacy. The advantage of this score is that the calculation process is relatively simple, and includes skull imaging results.32,33 Elevated blood glucose is closely related to the prognosis of alteplase intravenous thrombolysis. Current guidelines recommend that patients with random blood glucose levels higher than 22.2 mmol/l should undergo hypoglycemic therapy before thrombolysis. Hyperglycemia can affect the prognosis of patients with AIS by aggravating neurotoxicity in the ischemic penumbral zone, increasing the permeability of the blood-brain barrier, and thus exacerbating intracranial hemorrhage transformation and brain edema, increasing the risk of post-stroke infection, increasing platelet aggregation, and thus increasing thrombus volume, shown by the therapeutic effects of anti-platelet aggregation.34–37 Blood lipid levels are closely related to the prognosis of patients with AIS. Studies have shown that the probability of recurrence after AIS is increased by 25% for every 1 mmol/L increase in total cholesterol level of patients following AIS, with the risk of recurrence increasing by 15% for every 1 mmo/L increase in the triglyceride level. Abnormal levels of low-density lipoprotein (LDL) in serum are closely related to stroke recurrence and elevated levels are associated with the formation of atherosclerotic plaque, which when enlarged or detached, can lead to ischemic stroke. At present, in terms of the prevention and treatment of stroke, reductions in LDL levels are used as an important indicator to determine the status of blood lipid levels, and reducing the levels of LDL can effectively reduce the risk of poor prognosis of AIS. A number of studies have shown that statins can significantly reduce LDL levels and have a clear effect on improving the prognosis and recurrence of patients with ischemic stroke.38–40
At present, while there are a small number of studies on predictive models related to the prognosis of patients with AIS, none of these models can be widely used in clinical practice, mainly for the following reasons: (1) Few studies have provided simple and rapid predictive models, and some studies have included small sample sizes 41 ; (2) At present, most studies have focused on simple univariate analysis and logistic regression, without analyzing confounding factors and bias risks 42 ; (3) Few existing studies have undergone rigorous internal and external validation 15 ; (4) There are few prognostic models for patients receiving alteplase intravenous thrombolysis in China. 43 Nomograms are an important part of modern medical decision-making, and represent a graphical statistical tool that estimates the probability of an event occurring by integrating a number of variables to derive a continuous scoring system, essentially using a line graph as a visualization of the results of a regression equation. 44 For these reasons, the present study adopted a retrospective cohort study approach using PSM to balance between-group confounders, and then constructed a nomogram prediction model based on the risk factors for poor prognosis identified by logistic regression analysis to evaluate the risk of poor prognosis in patients with AIS after alteplase intravenous thrombolysis. The constructed nomogram could predict a patient’s prognosis using only three pieces of information that can be quickly and easily accessed in the clinic, namely, the baseline NIHSS score, baseline glucose level, and hyperlipidemia. For example, a patient with baseline blood glucose of 8 mmol/l, baseline NIHSS score of 10, and a history of comorbid hyperlipidemia, corresponding to the point values of 18, 28, and 32.5, respectively, and yielding a total score of 78.5, would be predicted to have projected to have a 0.80 likelihood of poor prognosis at three months. In the DCA curve, the Treat All line represents the net benefit when patients undergo clinical interventions, while the Treat None line represents the net benefit when patients do not undergo clinical interventions. When the net benefit received corresponding to the threshold probability is at the upper right of both the Treat All and Treat None lines (i.e., the Treat model line in this study, representing the nomogram), this indicates that the model has good clinical utility for making predictions. The results of ROC and calibration curves also showed that the prediction and actual occurrence associated with the model were better.
However, this study has the following limitations: First, Subject to strict inclusion conditions and regional factors, the sample size was relatively small, and the sample size was not calculated. This limitation may introduce statistical errors, cautioning against broad generalizations of our findings. More data need to be collected in the future to verify the prediction accuracy of the model. Second, Patients treated with intravenous thrombolytic urokinase were not included in this study. Moreover, the retrospective nature of our research design represents an inherent limitation.
Conclusions
In conclusion, this study developed a predictive model for poor prognosis after intravenous thrombolysis with alteplase in patients with AIS based on three factors, namely, baseline blood glucose, baseline NIHSS, and hyperlipidemia.
Footnotes
Declaration of conflicting interests
The author(s) declared no potential conflicts of interest with respect to the research, authorship, and/or publication of this article.
Funding
The author(s) received no financial support for the research, authorship, and/or publication of this article.
Trial registration
This randomized clinical trial was not registered because this is an observational and anonymous study.