
Abstract
Systemic lupus erythematosus (SLE) patients are at greater risk of developing osteoporosis (OP) than the general population. This study aimed to identify crosstalk genes between SLE and OP and to validate their diagnostic accuracy as biomarkers. Data analysis based on Gene Expression Omnibus (GEO) datasets was conducted. We utilized Weighted Gene Co-Expression Network Analysis (WGCNA) and differential expression analysis to identify crosstalk genes (CGs). Machine learning algorithms and consensus clustering were applied to screen shared diagnostic biomarkers and construct two predictive models featuring key genes. We also investigated potential subgroups, immune infiltration across different subtypes, and validated hub mRNAs using quantitative real-time PCR (qPCR). Molecular docking was performed to simulate the interaction of a small molecule compound with its target. We identified 19 CGs and developed two predictive models: the IL1R2-GADD45B and CHI3L1-IL1R2-SPTLC2 diagnostic score thresholds. The CHI3L1-IL1R2-SPTLC2 model showed improved predictive accuracy for lupus-associated osteoporosis. The C2 subtype was found to potentially regulate bone metabolism in SLE patients. Immune infiltration analysis indicated a strong association between CGs and multiple immunocytes, with IL1R2 being a common element in both models. Molecular docking suggests that Anakinra’s therapeutic effect may involve IL1R2. Our study introduces novel diagnostic biomarkers and predictive models for lupus-associated osteoporosis, with a particular focus on IL1R2 as an innovative biomarker and therapeutic target. These are anticipated to aid early screening and risk assessment in SLE patients, pending large-scale clinical validation.
Keywords
Introduction
Osteoporosis (OP) is a common condition affecting bones, characterized by decreased density and deterioration of bone tissue, which leads to increased fragility and a greater likelihood of fractures. 1 The World Health Organization describes osteoporosis as having a bone mineral density (BMD) that is less than 2.5 standard deviations (SD) from the mean value of young adults, measured using dual-X ray absorptiometry (T score < −2.5 SD). 2 In individuals with systemic lupus erythematosus (SLE), the prevalence of osteoporosis is significantly higher than the general population. 3 A meta-analysis found that SLE patients have twice the risk of vertebral fractures compared to the healthy population. 4 In SLE patients, osteoporosis risk factors include traditional elements like age and physical inactivity, alongside disease-specific contributors such as glucocorticoid use and immune system alterations.5–7 Key cytokines—IL-1, IL-6, IL-17, and TNF-alpha—drive osteoclastogenesis and activity, inhibiting osteoblast function.8,9 Premenopausal SLE patients with RANKL and OPG gene polymorphisms face a heightened risk of vertebral fractures. 10 Glucocorticoids also play a role in osteoporosis risk in SLE. 11 Despite these associations, the inflammatory mechanisms linking SLE to osteoporosis are not fully elucidated, highlighting a significant gap in our understanding that impedes the development of more precise diagnostic and therapeutic strategies.
Current diagnostic methods, such as dual-energy X-ray absorptiometry scans, are limited in predicting fracture risk in SLE patients due to cost, specialized equipment, radiation exposure, and the complex interplay of inflammatory and hormonal factors. 12 Mitigation strategies including calcium and vitamin D supplements, bisphosphonates, and hormone replacement therapy are not always effective and may interact with SLE treatments. 13 There is an urgent need for alternative approaches to counteract the osteoporotic effects of glucocorticoids without compromising SLE management. Furthermore, the current lack of precise diagnostic tools for SLE-associated osteoporosis highlights a significant gap in our ability to effectively identify and manage this comorbidity. This study focuses on the diagnostic accuracy of two genetic biomarkers, IL1R2-GADD45B and CHI3L1-IL1R2-SPTLC2, identified through our analysis of GEO datasets. Furthermore, considering the presence of IL1R2 in both markers and the availability of IL1-targeting drugs, we also assess the therapeutic potential of Anakinra in mitigating osteoporosis in SLE patients.
Methods
We integrated WGCNA, machine learning, classic pathway enrichment analysis, and classic omics (qPCR) techniques to assess the diagnostic accuracy of IL1R2-GADD45B and CHI3L1-IL1R2-SPTLC2 for osteoporosis in SLE patients via pathway enrichment analysis. WGCNA is a systems biology method and facilitates the exploration of gene modules with significant biological relevance and their association with diseases. 14 Machine learning, including LASSO 15 and random forest analysis, 16 was utilized to predict and classify disease states based on gene expression profiles, enhancing the robustness of our diagnostic accuracy assessment. GSEA is an analytical method that focuses on gene sets to reveal common biological pathways and extract deeper insights from genome-wide RNA expression data. 17 All working processes are presented in Supplemental Figure 1.
Data sources and study population
Microarray datasets for this study were retrieved from the public Gene Expression Omnibus (GEO) database (http://www.ncbi.nlm.nih.gov/geo/), 18 and do not require ethics committee approval. Utilizing the search terms “systemic lupus erythematosus” and “osteoporosis,” we conducted a targeted investigation of gene expression data repositories. In this process, we excluded any datasets derived from non-human test subjects. We focused on studies categorized as “Expression profiling by array” or “Expression profiling by high throughput sequencing.” Datasets were excluded based on the following criteria: (i) Incomplete data quality: such as those where data missing exceeds 50% or containing inaccuracies that compromise the reliability of the dataset. (ii) Restricted access to data, such as those requiring additional permissions or agreements that could not be fulfilled within the scope of our study. (iii) Non-compliance with ethical standards: such as those lacking appropriate consent forms or not adhering to guidelines set by institutional review boards.
Four datasets were selected for our study: GSE50772, 19 GSE61635, 20 GSE56815, 21 and GSE35959. 22 The GSE50772 dataset, based on the GPL570 platform, includes 61 SLE patient samples and 20 healthy control samples from peripheral blood mononuclear cells. All SLE patients met 1997 revised American College of Rheumatology (ACR) classification criteria. 23 The GSE61635 dataset, also on the GPL570 platform, comprises 99 SLE patient samples and 30 healthy control samples from whole blood. However, GSE61615 did not provide specific classification criteria in the original study, which may affect the comparability of the results. The GSE56815 dataset, utilizing the GPL96 platform, contains 40 osteoporosis patient samples and 40 healthy control samples from monocytes. Lastly, the GSE35959 dataset on the GPL570 platform includes five osteoporosis patient samples and 14 healthy control samples from mesenchymal stem cells. GSE56815 and GSE35959 also did not have clear classification criteria, which may affect the interpretation of the results. More details about these datasets can be found in Supplemental Table 1. In our study design, GSE50772 served as the discovery dataset for identifying potential biomarkers associated with SLE, while GSE56815 was used to discover biomarkers for osteoporosis (OP). The GSE61635 and GSE35959 datasets were employed as validation datasets to confirm the biomarkers identified in the discovery phase for SLE and OP, respectively.
Weighted gene co-expression network analysis (WGCNA)
Therefore, we employed WGCNA to scrutinize the GSE50772 and GSE56815 datasets. Using R language, the “Hclust” package function was used prior to perform hierarchical clustering and exclude outliers. Based on the criterion of R2 > 0.8 to achieve a scale-free topology, as recommended in the literature,14,24 an appropriate soft-thresholding power b (ranging from 1 to 20) was calculated. Subsequently, hierarchical clustering was conducted to identify co-expressed gene modules and to construct the corresponding dendrogram. As described in reference, 25 we set a minimum module size of 50 genes and merged similar modules with a similarity threshold of 0.25. Finally, the eigengene module and its connection with clinical characteristics were calculated to produce expression profiles for each module. Consequently, we focused on modules that exhibited strong correlation coefficients with clinical characteristics, subsequently choosing genes from these modules for additional analysis.
Identification of DEGs
The differentially expressed genes (DEGs) from the GSE50772 and GSE56815 datasets were screened using the “limma” R program. 26 To manage the false discovery rate (FDR), we applied the Benjamini and Hochberg method for P-value adjustment. 27 Adjusted P-value < 0.05 and |log fold change (FC)| > 0 were deemed statistical significance. The results were displayed utilizing principal components analysis (PCA) plots, volcano maps and gene clustering heatmaps.
Analysis of the common genes
We employed Venn diagrams to extract common genes that were positively correlated with both SLE and OP from the pivotal modules. 28 Subsequently, we performed an integrated analysis to identify up-regulated DEGs across the GSE50772 and GSE56815 datasets. Through the convergence of DEGs and genes from the modules ascertained by WGCNA, we pinpointed the genes that mediate the crosstalk between SLE and OP. 29
Machine learning algorithms
We conducted a friends analysis on common DEGs to assess their similarity with the reference genomes using the “GOSemSim” R package. 30 For this analysis, we calculated the geometric mean value of Gene Ontology (GO) semantic similarity between the DEGs and the reference genomes in terms of biological processes, molecular function, and cellular components. The resulting scores were then used to generate a cloud and rain map using the “ggplot2” R package.
The LASSO algorithm was applied to the 19 common genes for every disease dataset.31,32 And we fixed the seed at 100 in both illness groups to guarantee the algorithms’ repeatability. A regression model was developed using the R package “glmnet,” incorporating 10-fold cross-validation to prevent overfitting. We set “binomial” in the “family” parameter and used “lambda.1min” to select the optimal lambda value. For the 19 characteristics, logarithmic (lambda) profiles of the LASSO coefficients were created. Next, we created the logarithm (λ) curve and the partial likelihood deviation (binomial deviation) curve. Next, we determined the optimal value for the minimal standard’s 1se (1-SE standard). For a sensitivity analysis, we computed the area under the curve (AUC) of receiver operating characteristic (ROC). Subsequently, we employed the Random Forest algorithm to classify important genes using the R package “randomForest.” 33 This approach, based on a decision tree algorithm, facilitated the identification of disease signature genes by filtering shared genes. We initiated the model construction with a random forest comprising 100 trees and determined the optimal number of trees through 10-fold cross-validation to ensure the model’s generalizability. Thereafter, we utilized the mean decrease in Gini index to evaluate the importance of each variable, providing insights into their contribution to the model’s predictive power.
Following the application of the two aforementioned algorithms, we utilized Venn diagrams to find the common genes identified by both methods. Subsequently, we intersected these shared genes to pinpoint four specific crosstalk genes that were selected as potential diagnostic markers.
Consensus clustering
We employed the unsupervised consensus clustering method (K-means) to detect DEG-related subgroups in SLE patients. 34 This research was processed using the unsupervised clustering “Pam” approach, which was done using the “Consensus ClusterPlus” R package and repeated 1000 times to guarantee classification stability. The normalized enrichment score (NES) of “C2: all curated gene sets” was calculated using the “GSVA” R package. A P-value threshold of below 0.05 was used to establish statistical significance, along with a FDR that remained under 0.25. 35 The results were displayed utilizing gene clustering heatmaps. 36
Construction and validation of the diagnostic score threshold
We assessed expression levels of shared genes in SLE and OP datasets. The area under the receiver operating characteristic curve (AUC-ROC) was employed to determine the diagnostic accuracy of these biomarkers. ROC analysis quantifies the trade-off between sensitivity (true positive rate) and specificity (true negative rate) across all classification thresholds, providing a threshold-independent measure of discriminative power. 37 The AUC-ROC value ranges from 0.5 (no discriminative ability) to 1.0 (perfect classification), making it a robust metric for evaluating biomarker performance in imbalanced datasets. 38 A multicolinearity analysis was performed to eliminate constant and correlated features by testing the correlation coefficient between features. 39 To determine the SLE (GSE50772) diagnostic score threshold based on the crosstalk diagnostic biomarkers, multivariate logistic regression was used. The expression of hub genes and their logistic regression coefficient were used to determine each sample’s prediction score. The diagnostic score threshold was determined using the following formula:

The coefficient of the gene (i) is the regression coefficient of the gene (i), and the Expression of the gene (i) is the expression value of gene (i) for each patient. The “rms” program generated a nomogram to improve the risk model’s operability and practicability. In the internal (GSE50772) and external (GSE61635) validation analyses, the ROC curve and AUC value were utilized to measure the predictive accuracy of the model for disease risk, and the calibration curves and C-indexes served to evaluate the predictive model’s calibration and predictive accuracy, respectively.
The immune infiltration analysis
The single sample gene set enrichment analysis (ssGSEA) algorithm 40 was used to investigate the distribution of immune cells in peripheral blood mononuclear cells (PBMCs) from SLE patients (GSE50772 dataset) compared to healthy controls, as well as between the two SLE subtypes (C1 and C2) identified through consensus clustering. This analysis aimed to explore whether immune dysregulation in SLE patients correlates with bone metabolism pathways mediated by crosstalk genes (e.g. IL1R2). To illustrate the results, the R packages “corplot,” “vioplot,” and “ggplot2” were utilized. Finally, heatmaps that illustrate the relationship between common genes and immune cell abundance were created using the “pheatmap” software. To ensure the robustness of our results, we conducted multicollinearity checks using Spearman correlation coefficients. We set the thresholds for multicollinearity violation at correlations above 0.8 and Variance Inflation Factor (VIF) values greater than 10. These criteria allowed us to identify and address any potential multicollinearity issues within our dataset.
Verification of the hub mRNA using qPCR
Peripheral blood of 10 SLE patients and five healthy people was collected from Fujian Provincial Hospital. SLE patients were diagnosed using the 1997 revised ACR classification criteria 23 to align with the diagnostic framework of the GSE50772 dataset, ensuring direct comparability between bioinformatics predictions and experimental validation. And all participants were aged 18 years or older. Patients with comorbidities (e.g. other autoimmune diseases, recent immunosuppressive therapy, or conditions affecting bone metabolism) were excluded to minimize confounding effects on hub genes’ expression. This approach ensures that observed differences in hub gene levels are attributable to SLE-associated mechanisms rather than extraneous factors. All protocols received approval from the ethics committee of the Fujian Provincial Hospital (approval number: K2024-02-007, approval date: February 18, 2024), and procedures were conducted according to the Declaration of Helsinki, with written informed consent collected from all participants.
The hub mRNA IL1R2 was subjected to qPCR analysis to verify the reliability of the bioinformatics findings. Total RNA was extracted from the cell lines using TRI REAGENT BD (MRCGENE), following the manufacturer’s instructions. And then total RNA was reverse transcribed to complementary DNA (cDNA) by using the Gene Amp PCR System 9700 (Applied Biosystems). qPCR was performed using QuantStudio™ 5 Real-time PCR System (Applied Biosystems). β-actin was used as an internal control. The relative levels of hub genes were estimated using the 2 −△△Ct method. The primer sequences of hub genes were listed in Supplemental Table 2.
Small molecule agents screening and molecular-ligand docking analysis
Based on the hub genes, the DGIdb database (https://www.dgidb.org/) was used to identify potential therapeutic drugs. The target genes’ main protein structures were obtained from the Protein Data Bank database (http://www.rcsb.org, PDB). To facilitate the molecular docking of key targets with small molecule drugs, we employed the AutoDock Tools software (version 1.5.7). 41 Pymol software was used to assess the binding activities of targets and small molecule compounds, as indicated by docking energy scores (http://www.pymol.org).
Results
Weighted Gene Co-Expression Network Analysis
As depicted in Figure 1a to c, the WGCNA of the GSE50772 dataset resulted in 13 gene modules. Figure 1a showed a significant consistency among gene associations with the scale-free distribution, notably at b = 12 (scale free R2 = 0.93). To assess the relationship between each module and the disease, a heatmap was created to depict module-trait associations. Among these 13 modules, the three modules “MEblack” “MEbrown” and “MEgreenyellow” were positively correlated with SLE (MEblack module: r = 0.65, P = 5e−11; MEbrown modules: r = 0.53, P = 3e−07; MEgreenyellow module: r = 0.51, P = 1e−06), including 208, 2127, and 100 genes, respectively (Figure 1c).

Weighted genes correlation network analysis (WGCNA) of GSE50772 and GSE56815 datasets. (a) Determination of soft-threshold power for SLE. (b) Cluster dendrogram of SLE highly connected genes in key modules. (c) Relationships between modules and traits in SLE. Correlations and P values are included in each cell. (d) Calculation of soft-threshold power for OP. (e) Cluster dendrogram of OP modules. (f) Module–trait relationships in OP.
WGCNA of the GSE56815 dataset yielded gene modules linked to the bone mineral density phenotype, as seen in Figure 1d to f. The analysis of soft threshold selection indicated a high degree of consistency among gene associations with the scale-free distribution, particularly when b = 12 (scale free R2 = 0.86). Then, a total of seven modules were identified. As shown in Figure 1f, MEgrey module (r = 0.59, P = 2e−08) was positively correlated with osteoporosis, including 1394 genes.
Identification of DEGs and the common genes
8509 DEGs with 4047 up-regulated and 4462 downregulated genes were obtained for SLE. For Osteoporosis, there were 4311 DEGs with 2634 up-regulated and 1677 downregulated genes. The DEGs of SLE and OP groups were shown in volcano plots (see Figure 2a and b). PCA analysis suggested a clear separation between samples in the disease and control groups (Figure 2c and d). The distinct clustering observed in these plots indicates that the gene expression profiles of disease samples differ significantly from those of the control samples. Additionally, heatmaps illustrated the DEGs identified in the two groups (Figure 2e and f). The clear separation of colors within these heatmaps further suggests distinct expression patterns between the disease and control groups.

Detection of DEGs and shared genes in SLE and OP. (a) Volcano plots showed DEGs in GSE50772. (c) Characteristics of sample distribution from PCA analysis in GSE50772. (b, d, f) The volcano plot, PCA plots and heatmap of DEGs in OP group. (e) Heatmap of DEGs in GSE50772. (g) Overlapping the WGCNA modules of SLE and OP shows the genes they share. (h) The DEGs shared between SLE and OP are identified. (i) The common genes between WGCNA and DEGs.
We analyzed the genes that were common between WGCNA and DEGs to explore the co-pathogenesis of SLE and OP. There were 213 genes that overlapped the key modules of WGCNA (Figure 2g). A total of 451 genes from the DEGs of SLE and OP overlapped, as shown in Figure 2h. By taking the intersection of these two sets of genes, we identified 19 common DEGs that were present in both datasets (Figure 2i).
Screening of diagnostic genes using friends analysis and machine learning methods
In order to compare the importance of 19 common DEGs, we performed a friends analysis. As shown in the cloud-rain diagram (Figure 3a), the importance of the GADD45B, IL1R2 PLAUR, and EST2 were more stronger. Based on the aforementioned 19 shared genes, LASSO and Random Forest were used to further pick the most promising diagnostic gene. For the SLE group, λ was determined to be 0.0018155 using the LASSO coefficient profiles and the optimal tuning parameter selection map (Figure 3b and c). As part of a sensitivity analysis, the AUC was calculated to be 0.981, indicating that the results of the LASSO regression analysis possessed robustness (Supplemental Figure 2A). The 19 genes were entered into the RF classifier, and the top 10 genes were shown on the importance scale, which were SLC7A7, IL1R2, ETS2, CHI3L1, LILRA5, ABCA1, ALOX15B, SPTLC2, BCAT1, and GADD45B (Figure 3f). Moreover, by integrating these two algorithms, we discovered nine shared biomarkers (ABCA1, BCAT1, CHI3L1, ETS2, GADD45B, IL1R2, LILRA5, SLC7A7, and SPTLC2) in GSE50772 (Figure 3h). Likewise, when the λ was adjusted to 0.04712, the LASSO algorithm identified 10 prominent genes for the OP group (Figure 3d and e). For a sensitivity analysis, we calculated the AUC to be 0.934, which also indicated that the results of the LASSO regression analysis were robust (Supplemental Figure 2B). Figure 3g illustrates the top 10 genes ranked by importance in the RF analysis, including ETS2, GADD45B, IL1R2, SLC7A7, ETV7, BCAT1, ADORA3, ST6GALNAC2, VNN3, and VSIG4. Then, in the OP group, the two algorithms identified 8 overlapping gene biomarkers (Figure 3i). We utilized the overlap of machine learning outcomes from both groups (Figure 3j) to obtain four crosstalk diagnostic genes (BCAT1, ETS2, IL1R2, and GADD45B).

Screening of diagnostic genes using friends analysis and machine learning methods. (a) Cloud and rain map of friends analysis of common DEGs in GSE50772. (b, c) LASSO coefficient profiles and the optimal tuning parameter selection map for SLE showed the final parameter selection λ (lambda). (d, e) LASSO coefficient profiles and the optimal tuning parameter selection map for OP. (f, g) The top-10 discriminative genes for SLE and OP identified by the RF algorithm. (h) A Venn diagram of nine candidate diagnostic genes for SLE, derived from the intersection of two algorithmic results. (i) Eight candidate diagnostic genes in OP were displayed by the Venn diagram. (j) Four candidate diagnostic genes were highlighted between SLE and OP in the Venn diagram.
The expression patterns of the four potential biomarkers in the SLE and OP datasets are displayed in Figure 4a. These four genes were more prevalent in the SLE and OP groups than in the control group. The diagnostic effectiveness of these biomarkers in the SLE and OP datasets was subsequently confirmed using ROC curves (Figure 4b). Figure 4c depicted the correlation between four variables in GSE50772. The correlation coefficients were below 0.8 in the dataset, leading us to exclude the presence of multicollinearity among the four candidate biomarkers. Combined with the results of multivariate logistic regression analysis in GSE50772 (Figure 4d), BCAT1 and ETS2 was removed and IL1R2 and GADD45B were further incorporated to build predictive score. Using the regression coefficients from the multivariate logistic regression analysis to weight the normalized expression levels of IL1R2 and GADD45B, we established a diagnostic model (two-genes diagnostic score threshold = normalized expression level of IL1R2 × 1.464 + normalized expression level of GADD45B × 2.061). The two-genes diagnostic model nomogram was developed to give medical professionals a quantitative method of estimating the likelihood of disease (Figure 4e). The bias-corrected line in the SLE dataset was nearly aligned with the ideal curve, indicating the predictive model’s consistency (Figure 4f). The two-genes risk model’s C-index was higher than that of the single-factor risk models, indicating that our diagnostic model was effective at predicting the disease (Figure 4g). ROC curve was shown in Figure 4h to illustrate the diagnostic model’ predictive capacity. The AUC of the SLE diagnostic model was 0.959 on the GSE50772, with a 95% confidence interval (CI 95%) ranging from 0.913 to 0.991. The AUC values close to 1, along with the narrow confidence interval, indicated strong predictive performance.
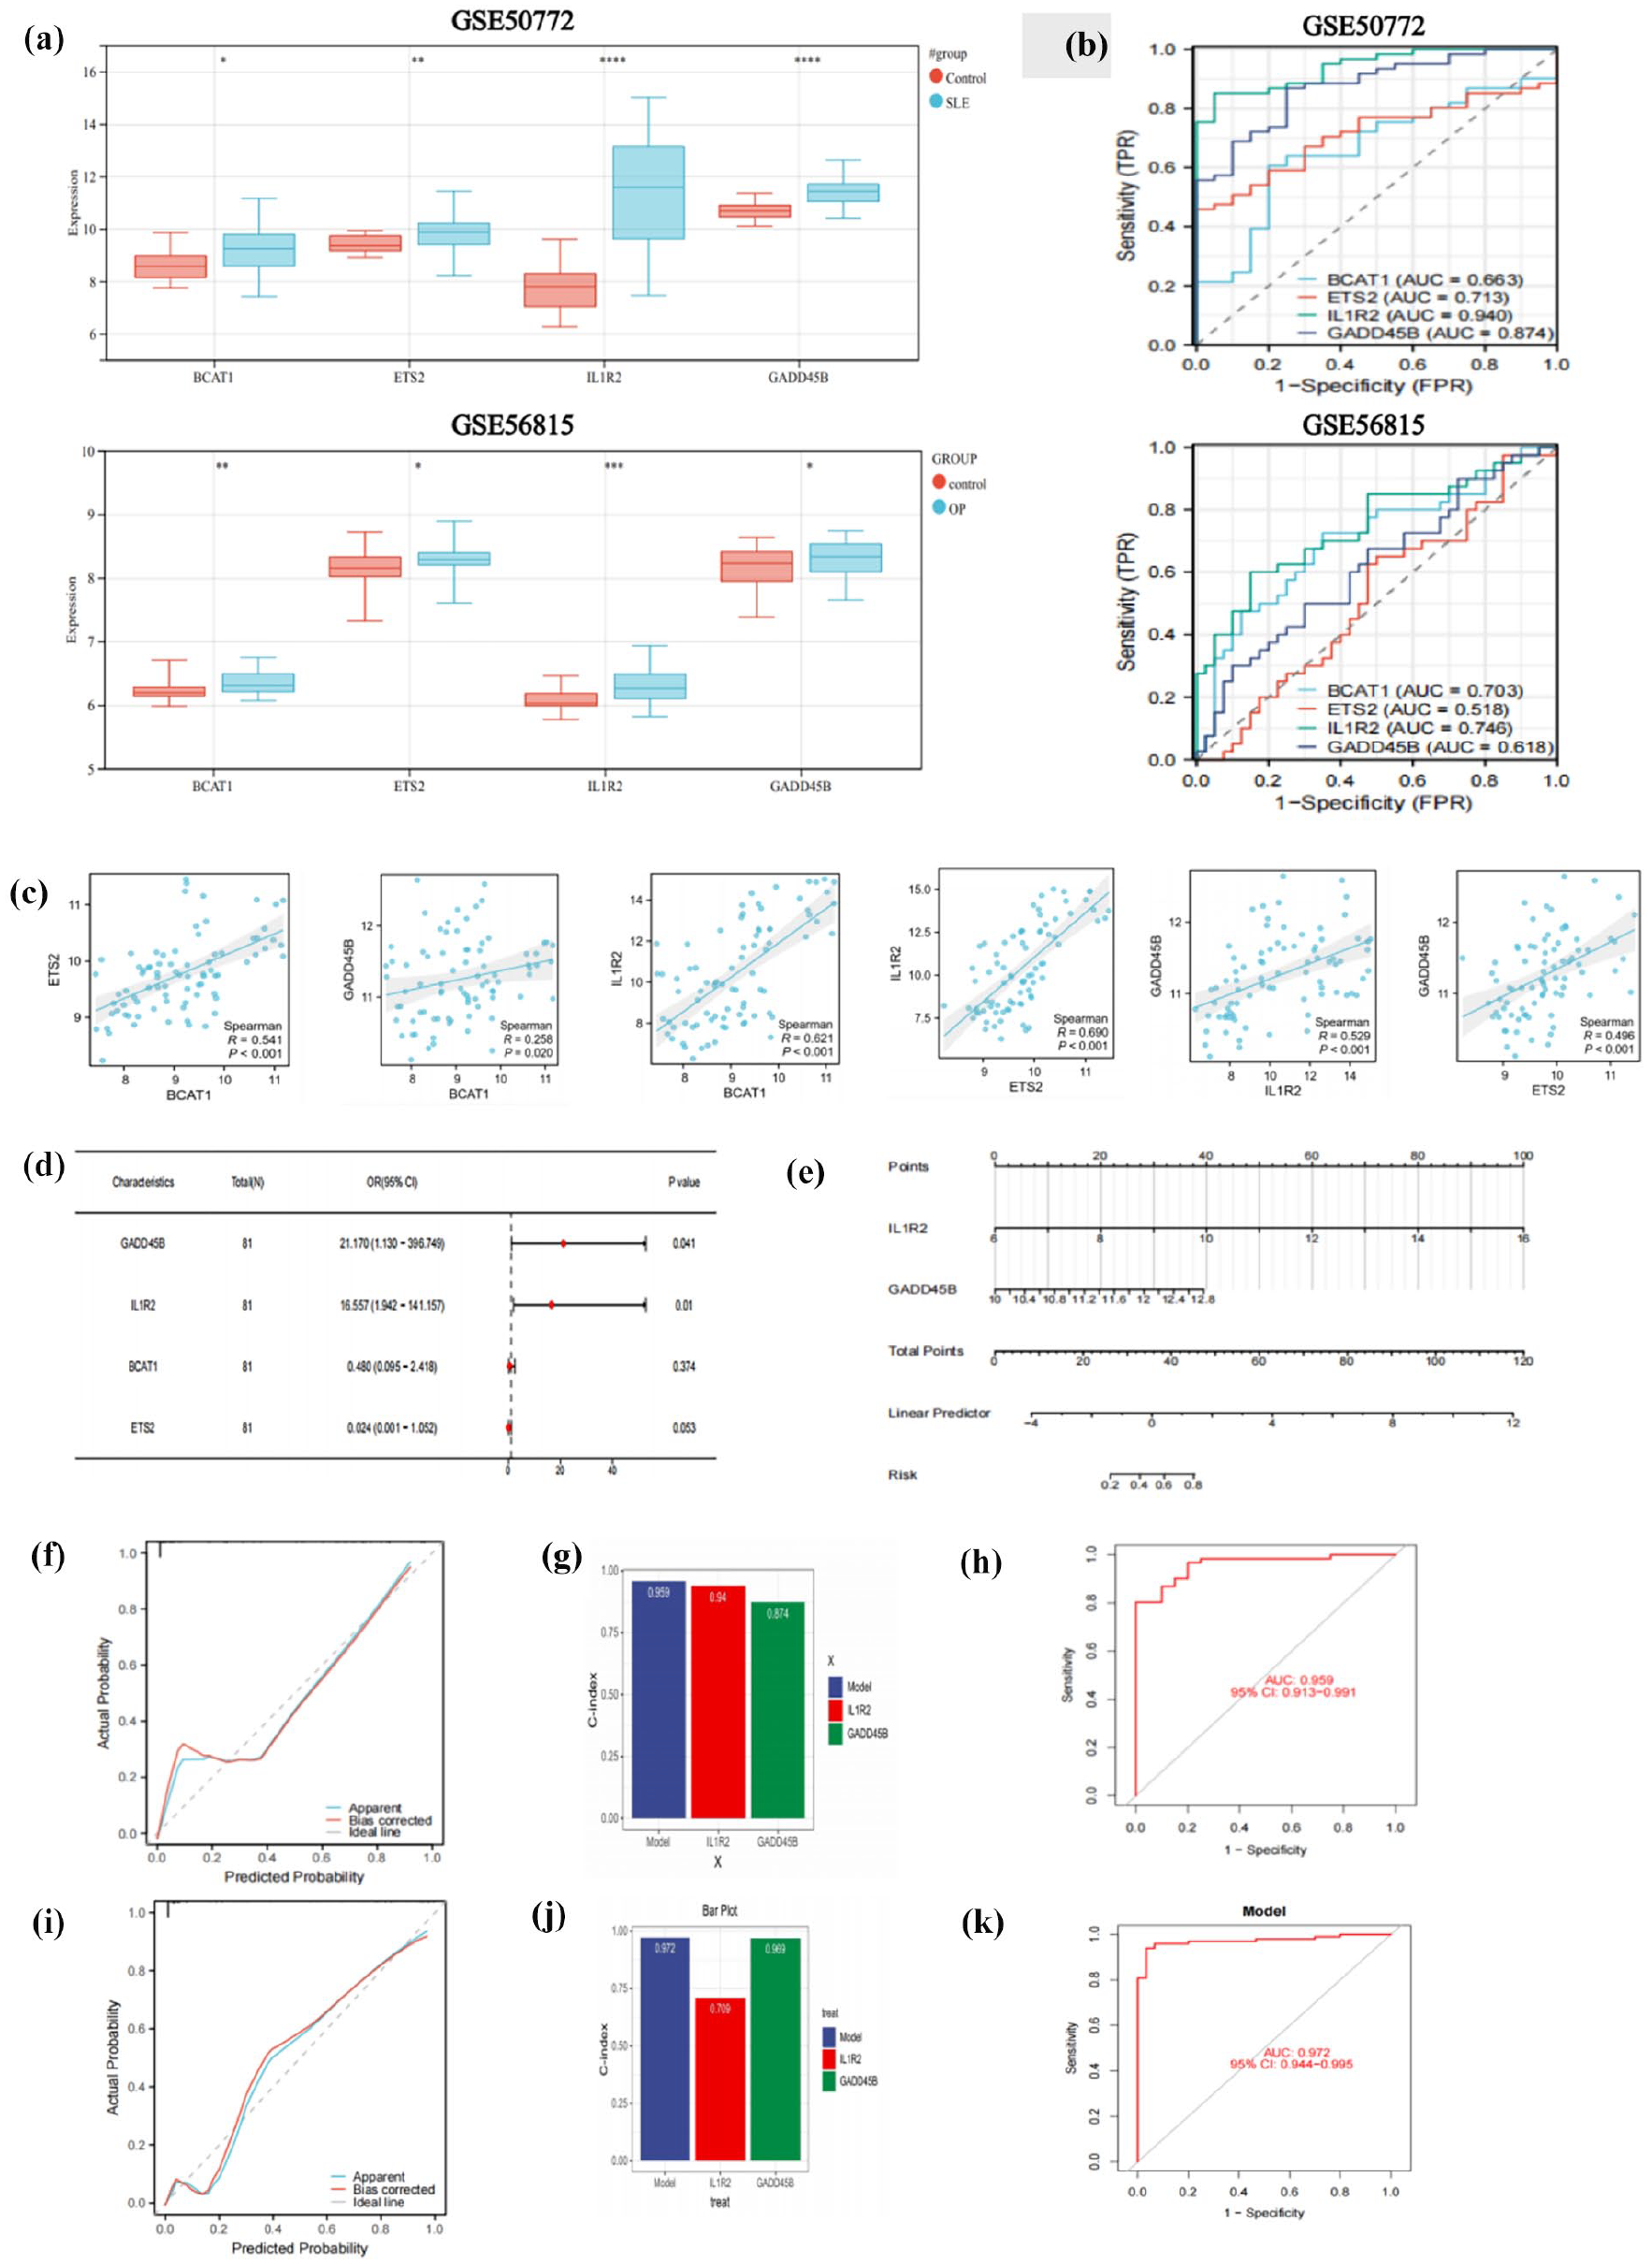
Construction of diagnostic score threshold. (a) The level of expression for four diagnostic biomarkers in GSE50772 and GSE56815. (b) ROC curve of the shared diagnostic CGs in GSE50772 and GSE56815. (c) Correlation between shared diagnostic CGs in GSE50772. (d) The multivariate logistic regression. (e) Nomogram for estimating SLE probability. (f, i) Calibration curves for the SLE risk model in GSE50772 and GSE61635. (g, j) C-index of risk model and single variables in GSE50772 and GSE61635. (h, k) ROC curves of the risk model in GSE50772 and GSE61635.
Furthermore, the external validation analysis’s findings showed that the diagnostic model had outstanding predictive ability. The risk model’s C-index was higher than that of the GSE61635 single-factor risk models (Figure 4j). Based on the external data, the ROC curve (Figure 4k) and calibration curve (Figure 4i) confirmed their reliable ability to forecast disease.
Screening of diagnostic genes using consensus clustering
We employed the consensus clustering technique to categorize the SLE patients from GSE50772 into two genetic subgroups, labeled C1 and C2, using the 19 DEGs (Figure 5a and b). There were 33 samples in C1 and 28 in C2. As shown in Figure 5c, the heatmap displayed eight genes (CHI3L1; ETS2; SPTLC2; BCAT1; IL1R2; VSIG4; ADORA3; ALOX15B) were significantly expressed in C2 subtype compared to the C1. In addition, the GSVA results presented in Figure 5d disclose a significant correlation between C2 and multiple bone metabolism related pathways, such as CYTOKINE_CYTOKINE_RECEPTOR_INTERACTION, WP_KYNURENINE_PATHWAY_AND_LINKS_TO_CELLULAR_SENESCENCE, and WP_MAPK_SIGNALING_PATHWAY. These findings highlight the potential regulatory influence of C2 subtype on the bone metabolic processes in patients with SLE. Based on the consensus clustering results, we postulated that the above eight DEGs might be related to bone metabolism in SLE patients. Based on the eight genes mentioned above, LASSO was once more used to screen five possible diagnostic genes, including BCAT1, CHI3L1, ETS2, IL1R2, and SPTLC2 (Figure 5e and f).
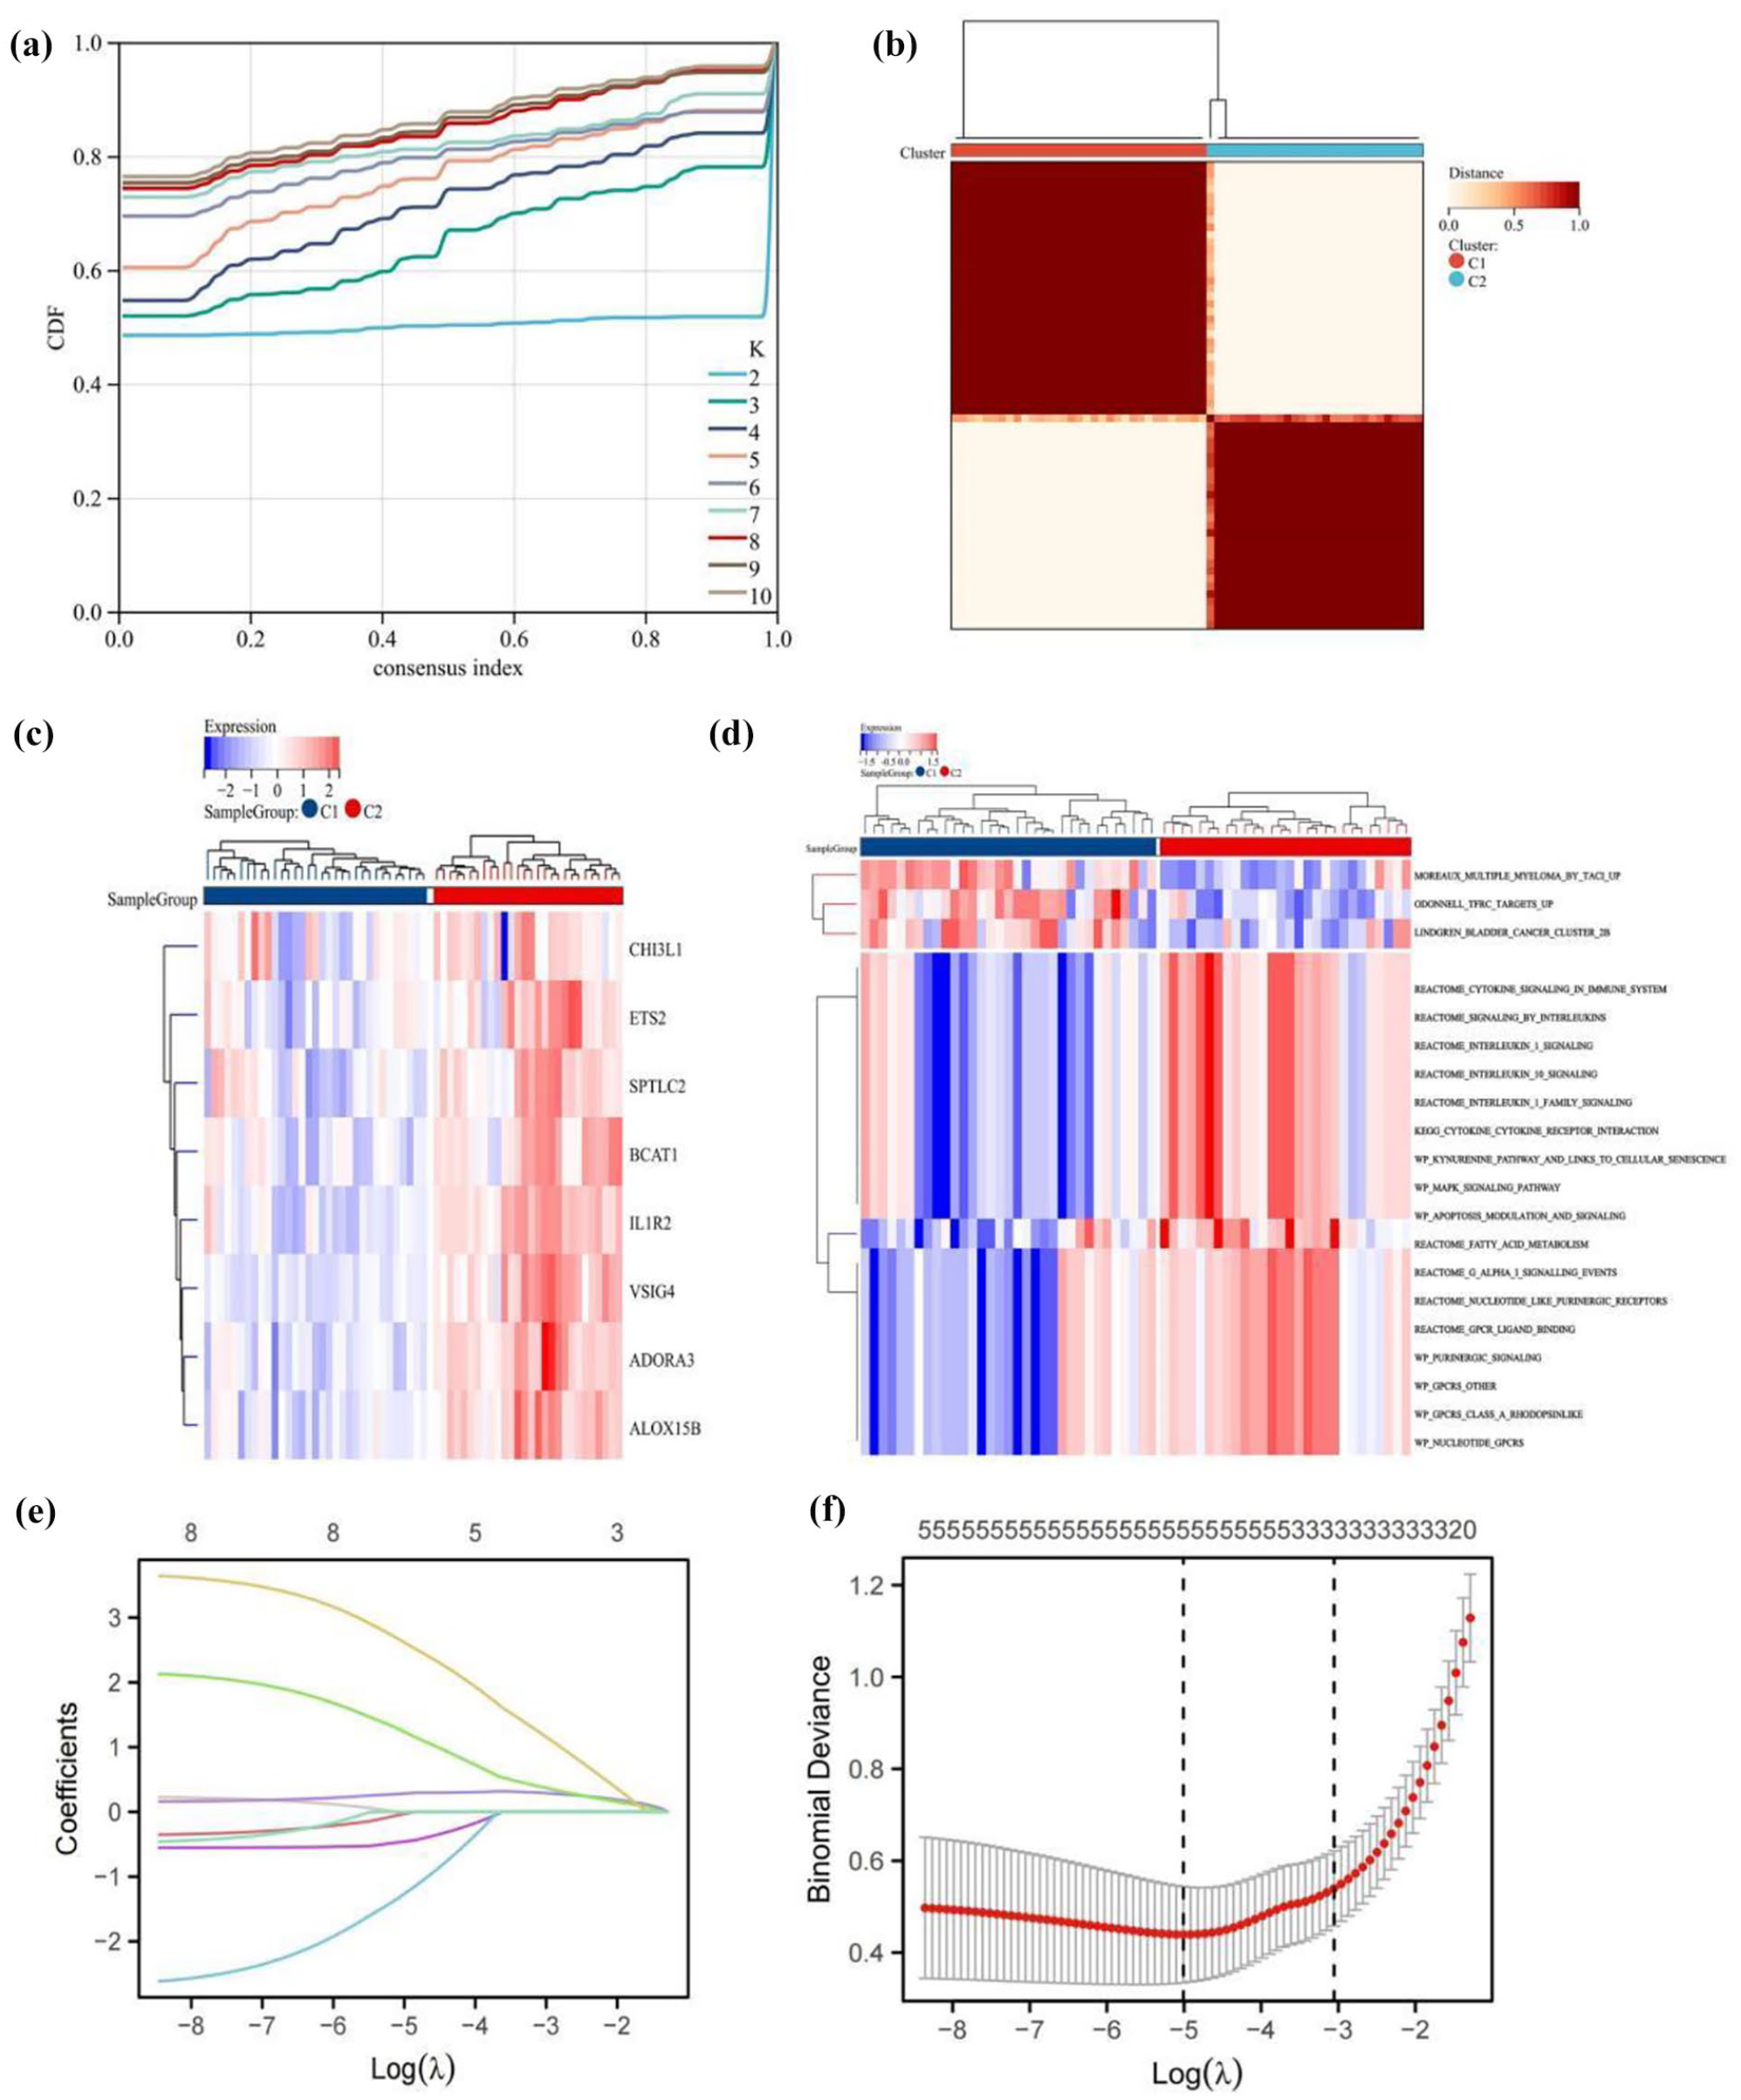
Consensus clustering. (a) Consensus CDF for k values ranging from 2 to 10 and changes in the area under the CDF curve. (b) Heatmap of the consensus matrix when k = 2. (c) The heatmaps showed eight differentially expressed genes in C1 and C2. (d) GSVA analyses in C1 and C2 subgroups. (e, f) LASSO coefficient profile and the optimal tuning parameter selection map.
The correlation coefficients among five variables were below 0.8 in the SLE dataset, leading us to exclude the presence of multicollinearity (Supplemental Figure 3A). Based on these five variables, we made single factor logistics analysis (Supplemental Figure 3B) and multi-factor logistics analysis (Supplemental Figure 3C). Based on the findings from the multivariate logistic regression analysis, BCAT1 and ETS2 may not be significantly associated with an increased risk of SLE. To enhance the accuracy of the risk prediction model, we included three additional genes (CHI3L1, IL1R2, and SPTLC2) in subsequent analyses.
Using the regression coefficients from the multivariate logistic regression analysis to weigh the expression levels of CHI3L1, IL1R2, and SPTLC2, we established a new diagnostic model (three-genes diagnostic score threshold = normalized expression level of CHI3L1 × 0.305 + normalized expression level of IL1R2 × 1.314 + normalized expression level of SPTLC2 × 2.960). The nomogram based on the novel diagnostic score threshold was constructed (Figure 6a). In the training set, the AUC was 0.969, and the 95% CI was 0.937–1, while in the validation set, the AUC was 0.879, and the 95% CI was 0.819–0.940 (Figure 6b and e). The three-genes risk model’s C-index was higher than that of the single-factor risk models, indicating that our diagnostic model was effective at predicting the disease (Figure 6c and f). The calibration plot’s bias-corrected line was near the ideal curve (Figure 6d and g).

Construction a new diagnostic model and validation. (a) Development of the nomogram model utilizing the three potential biomarkers. (b, e) ROC curves of the risk model in GSE50772 and GSE61635. (c, f) C-index of risk model and single variables in GSE50772 and GSE61635. (d, g) Calibration curves of the SLE risk model in GSE50772 and GSE61635.
Evaluation the performance of two diagnostic models in the OP dataset
Based on the osteoporosis dataset, we further evaluated the performance of two diagnostic models in predicting the development of osteoporosis in SLE patients. In comparison with the two-genes diagnostic model (as shown in Supplemental Figure 4A and B), the three-genes diagnostic model demonstrated better predictive capacity, with an AUC of 0.786, indicating high discriminative ability (as depicted in Supplemental Figure 4C). Furthermore, the bias-corrected line in the calibration plot was also close to the ideal curve (Supplemental Figure 4D). Therefore, the three-genes diagnostic model may be the optimal genetic predictive model for lupus-associated osteoporosis.
The immune infiltration landscape of SLE
The ssGSEA method was used to determine the proportion of each of the 28 types of immune cells in each sample in order to better investigate the immunological landscapes in SLE datasets. In the GSE50772, the most of immune cells, such as neutrophils, mast cells, monocytes, macrophages, and myeloid-derived suppressor cells (MDSCs), significantly infiltrated in the SLE group (Supplemental Figure 5A). As shown in Supplemental Figure 5B, the two genes showed significant correlations with infiltration levels of multiple immune cells in the SLE dataset, such as macrophages, mast cells, and neutrophils. Similarly, we also explored the distribution of immune cells between C1 and C2 subgroup. Compared with C1, macrophages and mast cells presented a high infiltrating level in C2, as shown in the box plot (Supplemental Figure 5C). And three differentially expressed genes also showed significant correlations with macrophages and mast cells in the C2 subgroup (Supplemental Figure 5D). To ensure the reliability of our correlation analyses, we conducted a thorough check for multicollinearity among the variables. We found that all VIFs were less than 10, indicating no significant multicollinearity and confirming the robustness of our results.
Verification of the hub mRNA using qPCR
To identify the common biomarkers between the two diagnostic models, we intersected the genes previously mentioned and discovered that only IL1R2 was common to both models (Supplemental Figure 6A). The above-described bioinformatics findings unveiled the expression of IL1R2 was significantly up-regulated in the SLE patients. Subsequently, the relative expression of IL1R2 was investigated by qPCR. As shown in Supplemental Figure 6B, the relative expression of IL1R2 was significantly increased (P < 0.05) in the SLE patients compared to controls, thus confirming the validity and reliability of the bioinformatics analyses performed.
Effectiveness of Anakinra in SLE-Associated Osteoporosis
We submitted the hub gene IL1R2 to the DGIdb database to identify potential small molecule compounds that could serve as therapeutic agents for SLE patients with OP. Through this approach, we found only one possible small-molecule drug, which was anakinra. The 2D-structure was retrieved from the PubChem database. The research downloaded crystal structures of the molecular target IL1R2 (PDB ID: 3O4O) with high resolutions, smaller than 3 Å, from the RCSB Protein Data Bank. We used AutoDock Tools 1.5.7 software to dock anakinra and IL1R2 with the largest fold difference. The docking score for anakinra binding to IL1R2 was −8.5 kcal/mol. Supplemental Figure 7A and 7B illustrate that anakinra formed a hydrogen bond with Thr318, His226, and Thr291, and also interacted with nearby residues through additional bonds. This molecular docking analysis provides valuable insights into the potential binding interactions between anakinra and IL1R2, supporting its candidacy as a therapeutic agent for SLE patients with OP.
Discussion
The mechanisms behind bone loss in SLE are intricate and involve multiple factors. Recent studies have discovered that the decrease of bone mineral density in SLE patients is related to disease-related inflammatory response, metabolism, endocrine, autoantibodies and drug effects.42–44 For example, IL-1, as a pro-inflammatory cytokine, contributes to increased bone resorption and subsequent bone loss through multiple mechanisms, including RANKL expression, directly acting on osteoclast precursors, synergizing with other inflammatory factors, and affecting the RANKL/OPG ratio. 45 However, there is a lack of studies that have investigated the comorbidity hypothesis of osteoporosis and SLE on a genetic level. Our study incorporates transcriptome data from public databases to identify possible crosstalk genes between SLE and OP, and to explore their clinical significance and links to immune cell function.
In order to enhance the identification of SLE patients at risk for osteoporosis, we utilized WGCNA to identify crosstalk genes between SLE and OP. Based on these 19 shared genes, we employed machine learning algorithms and consensus clustering to construct two predictive models. The first model, a two-gene diagnostic model, incorporated IL1R2 and GADD45B, while the second model, a three-gene diagnostic model, included CHI3L1, IL1R2, and SPTLC2. We identified the best predictive model by evaluating its performance on both training datasets and independent validation sets.
We performed an immune infiltration analysis and found that the SLE group exhibited significant infiltration of various myeloid cells, including neutrophils, mast cells, monocytes, macrophages, and myeloid-derived suppressor cells (MDSCs), compared to the normal group. And based on the results of correlation analysis, potential biomarkers also showed a positive correlation with myeloid lineage cells, specifically mast cells, macrophages, and neutrophils. Growing evidence suggests that myeloid lineage cells play a role in the development of SLE and OP separately. A study has demonstrated that myeloid-lineage cells were enriched in lupus arthritis and may play a central role in the observed infammation. 46 In addition, increasing evidence indicates that myeloid cells affect bone remodeling, which in turn causes osteoporosis or porous bone disorders.47,48 Therefore, these hub biomarkers may contribute to the development of osteoporosis in SLE patients through myeloid lineage cells-related biological pathways.
By employing consensus clustering based on the 19 shared genes, we stratified SLE samples into two subtypes, C1 and C2. We discovered that the C2 subtype may exert a potential regulatory effect on bone metabolic processes in SLE patients by modulating the infiltration and activity of immune cells, particularly macrophages and mast cells, and by influencing gene expression and signaling pathways related to bone metabolism.
Interleukin-1 inhibitory receptor type 2 (IL1R2) was the sole gene identified in two diagnostic models. It has been described as a decoy receptor that helps control inflammation and immunity by absorbing IL-1 and lowering its bioavailability. 49 Several studies have suggested that IL1R2 has been linked to the pathogenesis of rheumatic diseases such as rheumatoid arthritis, adult-onset Still’s disease and gout. 50 Additionally, it has been implicated in osteoporosis. A study reported in the Chinese Han population, IL1R2 polymorphisms (rs11674595, rs4851527, rs2072472, and rs3218977) may increase the risk of osteoporosis. 51 To the best of our knowledge, the present study was the first to uncover that IL1R2 involved to the bone loss process during SLE, as well as validating it as reliable markers via qPCR, which sets it apart from previous research.
GADD45B is a member of the GADD45 family, known for sensing stress and activating signaling pathways that result in the release of inflammatory cytokines in response to cellular stress. 52 Some recent studies have demonstrated that GADD45B involved in the pathogenesis of autoimmune diseases by acting on the MAPK kinase cascade and activating the production of various cytokines and inflammatory factors.53,54 A studies also have shown that GADD45B plays a crucial role in maintaining normal cartilage balance and in the disruption of matrix remodeling in osteoarthritic cartilage. 55
A study has demonstrated Chitinase 3-like 1 protein (CHI3L1) levels were notably elevated in SLE patients, particularly in those with active disease, implying a possible link between this cytokine and SLE pathology, with higher levels correlating to increased disease activity. 56 Park et al. 57 demonstrated that Chi3L1 aids in bone development, curtails osteoclastogenesis, and protects against osteoporosis associated with aging. The serine palmitoyltransferase long chain base subunit 2 (SPTLC2), plays a significant role in the maintenance of hematopoietic stem cells and myeloid cell differentiation, which are integral to the bone marrow’s function and indirectly impact bone health. 58 Burger et al. 59 found that SPTLC2 was upregulated in lesioned skin of psoriasis patients compared to non-lesioned skin. This suggested that SPTLC2 may contribute to the immune barrier dysfunction and immunological impairment associated with psoriasis.
Anakinra is a recombinant human receptor antagonist for interleukin-1 (IL-1), a proinflammatory cytokine associated with immune responses and inflammation. 60 Just like natural IL-1Ra, anakinra attaches to IL-1R1 and competitively hinders IL-1α and IL-1β from binding to IL-1R1. 61 Recognizing the role of IL1R2 in capturing IL-1 and its implications in osteoporosis, we consider the potential of anti-IL-1 targeted drugs like anakinra to reduce inflammation—a key factor in SLE-related bone loss—by binding to IL-1 and preventing its interaction with signaling receptors. By dampening the inflammatory signals that stimulate osteoclast activity and bone resorption, these drugs may help maintain bone density and strength in SLE patients, particularly those with IL1R2 gene variations that increase their risk of osteoporosis. While anakinra is approved for rheumatoid arthritis (RA) and cryopyrin-associated periodic syndromes (CAPS), it is frequently used off-label beyond these conditions. 62 For instance, studies have shown that anakinra was both efficacious and safe in treating systemic juvenile idiopathic arthritis (sJIA), 63 macrophage activation syndrome 64 and gout. 65 Molecular docking results suggest that anakinra may be a target agent for SLE patients with OP by targeting IL1R2, but the specific mechanism requires further experimental verification.
Our results can serve as a theoretical foundation for the comorbidity hypothesis of osteoporosis and SLE. But there are some limitations in our research. Firstly, the crosstalk genes we found in the current study have not been experimentally confirmed by additional functional validation or immunological correlation analysis. Secondly, even though we created a diagnostic model and determined the connection between immune infiltration and CGs, additional confirmation by large-scale matched SLE-OP cohort with harmonized tissue sources is required prior to therapeutic implementation. Thirdly, our reliance on publicly available gene expression data from the GEO database, in the absence of clinical data, may lead to potential biases. To mitigate this, it is essential that we gather clinical data to enhance our analysis and strengthen the validity of our findings in the future. Additionally, some datasets (e.g. the SLE validation dataset and osteoporosis datasets) did not specify the disease classification criteria, which may lead to heterogeneity across studies and affect the reproducibility of the results. Future research should promote standardized data reporting, including detailed diagnostic criteria, to enhance data reusability and cross-study comparability. Lastly, the limitation of our study regarding the small sample size and the potential imbalance in sample distribution across different groups, may affect the generalizability and the statistical power of our findings.
Conclusion
Our study successfully evaluated the diagnostic accuracy of two genetic biomarkers, IL1R2-GADD45B and CHI3L1-IL1R2-SPTLC2, in identifying osteoporosis in SLE patients. Anakinra, targeting IL1R2, emerged as a potential therapeutic option for SLE patients with osteoporosis. These results advance our understanding of the genetic basis of SLE-related osteoporosis and support the development of personalized medicine. However, larger-scale prospective studies are needed to validate these findings for clinical application.
Supplemental Material
sj-docx-1-iji-10.1177_03946320251331842 – Supplemental material for Integrative analysis of crosstalk genes and diagnostic biomarkers in lupus-associated osteoporosis
Supplemental material, sj-docx-1-iji-10.1177_03946320251331842 for Integrative analysis of crosstalk genes and diagnostic biomarkers in lupus-associated osteoporosis by Zhihan Chen, Yunfeng Dai, Fei Gao, Jianwen Liu, Juanjuan He, Li Zhang and Yanfang Wu in International Journal of Immunopathology and Pharmacology
Supplemental Material
sj-docx-2-iji-10.1177_03946320251331842 – Supplemental material for Integrative analysis of crosstalk genes and diagnostic biomarkers in lupus-associated osteoporosis
Supplemental material, sj-docx-2-iji-10.1177_03946320251331842 for Integrative analysis of crosstalk genes and diagnostic biomarkers in lupus-associated osteoporosis by Zhihan Chen, Yunfeng Dai, Fei Gao, Jianwen Liu, Juanjuan He, Li Zhang and Yanfang Wu in International Journal of Immunopathology and Pharmacology
Supplemental Material
sj-jpg-3-iji-10.1177_03946320251331842 – Supplemental material for Integrative analysis of crosstalk genes and diagnostic biomarkers in lupus-associated osteoporosis
Supplemental material, sj-jpg-3-iji-10.1177_03946320251331842 for Integrative analysis of crosstalk genes and diagnostic biomarkers in lupus-associated osteoporosis by Zhihan Chen, Yunfeng Dai, Fei Gao, Jianwen Liu, Juanjuan He, Li Zhang and Yanfang Wu in International Journal of Immunopathology and Pharmacology
Supplemental Material
sj-jpg-4-iji-10.1177_03946320251331842 – Supplemental material for Integrative analysis of crosstalk genes and diagnostic biomarkers in lupus-associated osteoporosis
Supplemental material, sj-jpg-4-iji-10.1177_03946320251331842 for Integrative analysis of crosstalk genes and diagnostic biomarkers in lupus-associated osteoporosis by Zhihan Chen, Yunfeng Dai, Fei Gao, Jianwen Liu, Juanjuan He, Li Zhang and Yanfang Wu in International Journal of Immunopathology and Pharmacology
Supplemental Material
sj-jpg-5-iji-10.1177_03946320251331842 – Supplemental material for Integrative analysis of crosstalk genes and diagnostic biomarkers in lupus-associated osteoporosis
Supplemental material, sj-jpg-5-iji-10.1177_03946320251331842 for Integrative analysis of crosstalk genes and diagnostic biomarkers in lupus-associated osteoporosis by Zhihan Chen, Yunfeng Dai, Fei Gao, Jianwen Liu, Juanjuan He, Li Zhang and Yanfang Wu in International Journal of Immunopathology and Pharmacology
Supplemental Material
sj-jpg-6-iji-10.1177_03946320251331842 – Supplemental material for Integrative analysis of crosstalk genes and diagnostic biomarkers in lupus-associated osteoporosis
Supplemental material, sj-jpg-6-iji-10.1177_03946320251331842 for Integrative analysis of crosstalk genes and diagnostic biomarkers in lupus-associated osteoporosis by Zhihan Chen, Yunfeng Dai, Fei Gao, Jianwen Liu, Juanjuan He, Li Zhang and Yanfang Wu in International Journal of Immunopathology and Pharmacology
Supplemental Material
sj-jpg-7-iji-10.1177_03946320251331842 – Supplemental material for Integrative analysis of crosstalk genes and diagnostic biomarkers in lupus-associated osteoporosis
Supplemental material, sj-jpg-7-iji-10.1177_03946320251331842 for Integrative analysis of crosstalk genes and diagnostic biomarkers in lupus-associated osteoporosis by Zhihan Chen, Yunfeng Dai, Fei Gao, Jianwen Liu, Juanjuan He, Li Zhang and Yanfang Wu in International Journal of Immunopathology and Pharmacology
Supplemental Material
sj-jpg-8-iji-10.1177_03946320251331842 – Supplemental material for Integrative analysis of crosstalk genes and diagnostic biomarkers in lupus-associated osteoporosis
Supplemental material, sj-jpg-8-iji-10.1177_03946320251331842 for Integrative analysis of crosstalk genes and diagnostic biomarkers in lupus-associated osteoporosis by Zhihan Chen, Yunfeng Dai, Fei Gao, Jianwen Liu, Juanjuan He, Li Zhang and Yanfang Wu in International Journal of Immunopathology and Pharmacology
Supplemental Material
sj-jpg-9-iji-10.1177_03946320251331842 – Supplemental material for Integrative analysis of crosstalk genes and diagnostic biomarkers in lupus-associated osteoporosis
Supplemental material, sj-jpg-9-iji-10.1177_03946320251331842 for Integrative analysis of crosstalk genes and diagnostic biomarkers in lupus-associated osteoporosis by Zhihan Chen, Yunfeng Dai, Fei Gao, Jianwen Liu, Juanjuan He, Li Zhang and Yanfang Wu in International Journal of Immunopathology and Pharmacology
Footnotes
CRediT authorship contribution statement
Chen Zhihan: Data curation, Methodology, Funding acquisition, Validation, Writing - original draft, Writing - review & editing. Dai Yunfeng: Data curation, Methodology, Validation, Writing - original draft, Writing - review & editing. Gao Fei: Data curation, Methodology, Writing - original draft, Writing - review & editing. Liu Jianwen: Data curation, Methodology, Validation, Writing - review & editing. He Juanjuan: Investigation, Methodology, Validation, Writing - review & editing. Zhang Li: Conceptualization, Data curation, Validation, Writing - review & editing. Wu Yanfang: Conceptualization, Data curation, Funding acquisition, Project administration, Supervision, Validation, Writing - review & editing.
Declaration of conflicting interests
The author(s) declared no potential conflicts of interest with respect to the research, authorship, and/or publication of this article.
Funding
The author(s) disclosed receipt of the following financial support for the research, authorship, and/or publication of this article: This work was supported by the Natural Science Foundation of Fujian province, [Grant No. 2023J011199], Joint Funds for the Innovation of Science and Technology, Fujian province [Grant No. 2023Y9305] and Joint Funds for the Innovation of Science and Technology, Fujian province [Grant No. 2023Y9318].
Ethicals approval
The microarray datasets used in this study were obtained from the GEO database, which are publicly available and do not require ethics committee approval. However, the qPCR validation involving human peripheral blood samples was conducted with approval from the Ethics Committee of Fujian Provincial Hospital (approval number: K2024-02-007, approval date: February 18, 2024).
Consent to participate
The patients/participants provided their written informed consent to participate in this study.
Informed consent
Written informed consent was obtained from all subjects before the study.
Data availability statement
Supplemental material
Supplemental material for this article is available online.
References
Supplementary Material
Please find the following supplemental material available below.
For Open Access articles published under a Creative Commons License, all supplemental material carries the same license as the article it is associated with.
For non-Open Access articles published, all supplemental material carries a non-exclusive license, and permission requests for re-use of supplemental material or any part of supplemental material shall be sent directly to the copyright owner as specified in the copyright notice associated with the article.