
Abstract
Keywords
Introduction
According to data from the Chinese National Stroke Registry, individuals aged 60 and above continued to exhibit the highest incidence of acute ischemic stroke (AIS) in both 2007–2008 and 2012–2013.1,2 When it comes to the treatment of acute ischemic stroke, two primary therapeutic strategies emerge: alteplase intravenous thrombolytic therapy and neuroprotective therapy.3,4 Alteplase, a recombinant tissue plasminogen activator (rt-PA), stands as the sole approved thrombolytic drug for ischemic stroke, having demonstrated its effectiveness in clinical practice.5,6 Nonetheless, not all patients subjected to intravenous thrombolysis with alteplase experience a favorable prognosis. Thus, the identification of predictive markers becomes imperative in assessing the potential for positive outcomes among individuals undergoing alteplase intravenous thrombolysis.
Diabetes mellitus (DM) stands as a chronic metabolic disorder that profoundly influences the overall quality of life. Epidemiological studies have revealed a gradual rise in diabetes prevalence in China, escalating from 20.4% in 2007–2008 to 22.86% in 2010. Diabetes presents a significant risk factor for the onset of ischemic stroke. An observational study has indicated that hyperglycemia is present in 68.7% to 77% of stroke patients, with 14% to 35% of acute stroke patients having a history of diabetes. Additionally, 16% to 24% are newly diagnosed with diabetes, and 21% to 24% exhibit glucose intolerance, possibly indicating prediabetes. 7 A substantial association exists between blood glucose levels, the variability of blood glucose fluctuations, and the incidence of ischemic stroke. The impact of blood glucose control on the development and prognosis of ischemic stroke has been a central topic of research. Currently, a definitive conclusion regarding the correlation between blood glucose levels and stroke remains elusive, and limited studies have addressed the impact of admission serum glucose levels on the prognosis of patients undergoing intravenous thrombolysis with alteplase. As a result, the ability of admission serum glucose levels to predict the prognosis of patients remains uncertain. In this study, we gathered clinical data from ischemic stroke patients who received alteplase therapy. We aimed to evaluate the factors influencing an adverse prognosis 90 days after the onset of the disease and to explore the potential correlation between admission serum glucose levels and patients’ neurological prognosis at 90 days.
Materials and methods
Study design
In this retrospective study, we included a total of 164 patients with acute cerebral infarction who underwent intravenous alteplase thrombolysis at Deyang People’s Hospital between January 2016 and December 2017. Verbal informed consent was obtained from all subjects before the commencement of the study. This study follows a retrospective cohort design.
Inclusion and exclusion criteria
Inclusion criteria: (1) Acute ischemic stroke occurring within 4.5 h of onset. (2) Age of 18 years or older. (3) Adherence to alteplase intravenous thrombolysis guidelines. 8
Exclusion criteria: (1) Occurrence of adverse outcomes before sampling. (2) Confirmation of intracranial hemorrhage, subarachnoid hemorrhage, arteriovenous malformation, aneurysm, or intracranial tumor via CT/MRI upon admission. (3) Presence of preexisting neurological or mental illness interfering with assessment. (4) History of bleeding, recent bleeding, trauma, or surgical procedures within 2 months before stroke. (5) Infection during specimen collection. (6) Presence of rheumatoid immune diseases, severe liver or kidney diseases, heart diseases, blood diseases, or malignant tumors. (7) Suspected infectious embolus or bacterial endocarditis. (8) Baseline platelet count less than 100 × 10^9/L. (9) Pregnancy or breastfeeding. (10) Lack of clinical, radiological, or follow-up data or information. (11) Poor quality of blood samples.
A total of 164 consecutive patients were initially included in the study. However, 15 patients were subsequently excluded due to infection upon admission, three patients were found to have malignant tumors, three patients had rheumatic immune diseases, five patients had incomplete clinical data and follow-up data, and three patients had low-quality blood samples. As a result, the final analysis comprised 138 patients who had sufficient data to be included in the study.
Data Collection
We collected data from electronic medical records, which included age, sex, body mass index (BMI), vascular risk factors such as smoking, alcohol consumption, hypertension, hyperlipidemia, diabetes, atrial fibrillation, history of previous stroke, and coronary heart disease. Additionally, we obtained the immediate blood pressure upon admission, random blood glucose, pre-stroke Modified Rankin Scale (mRS) score, 9 National Institutes of Health Stroke Scale (NIHSS) Score, 10 infarct site (categorized as left, right, anterior, and posterior circulation), door to needle time (DNT), and onset to needle time (ONT). Other analyzed data encompassed white blood cell count, hemoglobin level, platelet count, red blood cell count, neutrophil ratio, fibrinogen level, international normalized ratio, D-dimer level, prothrombin time (PT), activated partial thromboplastin time (APTT), uric acid level, sodium level, potassium level, and homocysteine level. All blood samples were collected upon patients’ admission to the hospital but before they received any medication.
Intravenous thrombolysis
Alteplase intravenous thrombolysis is conducted in accordance with international standards. The administration of alteplase involves a dosage of 0.9 mg per kg of body weight, with a maximum dose of 90 mg. The medication is delivered through a two-step infusion process. Initially, a high dose of 10% is infused within 1 min, followed by the subsequent infusion of the remaining 90% dosage over a span of 60 min.
Follow-up and endpoint events
The primary endpoint for this study was neurological function evaluated 90 days after intravenous thrombolytic therapy, which was assessed using the modified Rankin Scale (mRS). The assessment was conducted by neurologists through either face-to-face interactions or telephone follow-ups. 9 The mRS Scores were categorized into good prognosis (score 0–2) and poor prognosis (score 3–6), with a specific classification of six indicating death.11,12 The secondary endpoint was symptomatic intracranial hemorrhage (sICH), characterized by any form of intracranial hemorrhage occurring within 24 h after intravenous thrombolytic therapy. This included the presence of hematoma manifestations observed on CT or MRI scans, coupled with neurological deterioration and a rise of four or more points in the NIHSS score. 13 Subsequently, all enrolled patients were categorized into two groups: the good prognosis group and the poor prognosis group, based on their neurological function prognosis 90 days after the onset of the disease. The clinical data from these two groups were then subjected to a comparative analysis.
Statistical analysis
Statistical analysis was conducted using SPSS 25.0 software. The normality of measurement was assessed using the K-S test. Normally distributed data were presented as mean ± standard deviation (× ± s). The comparison between two groups with normally distributed data was performed using a t test. For measurement data that did not follow a normal distribution, the data were described using the median and quartiles [M(P25, P75)], and the independent sample Mann–Whitney U test was used for comparison between groups. Categorical variables were presented as case numbers and percentages [n (%)], and the comparison between groups was conducted using the χ2 test or the Fisher exact test. Using the prognosis at 90 days after disease onset as the dependent variable, the relevant variables with a significant level of p < 0.05 in univariate analysis, along with those selected clinical characteristics, were incorporated into the multivariate logistic regression model. The results of the analysis were reported as odds ratios (OR) with corresponding 95% confidence intervals (CI), aiming to investigate whether admission serum glucose acted as an independent risk factor influencing the prognosis at 90 days after disease onset. To establish the optimal admission blood glucose cut-off value for predicting a poor prognosis at 90 days after onset, a receiver operating characteristic (ROC) curve was utilized. Statistical significance was set at p < 0.05.
Results
General Information
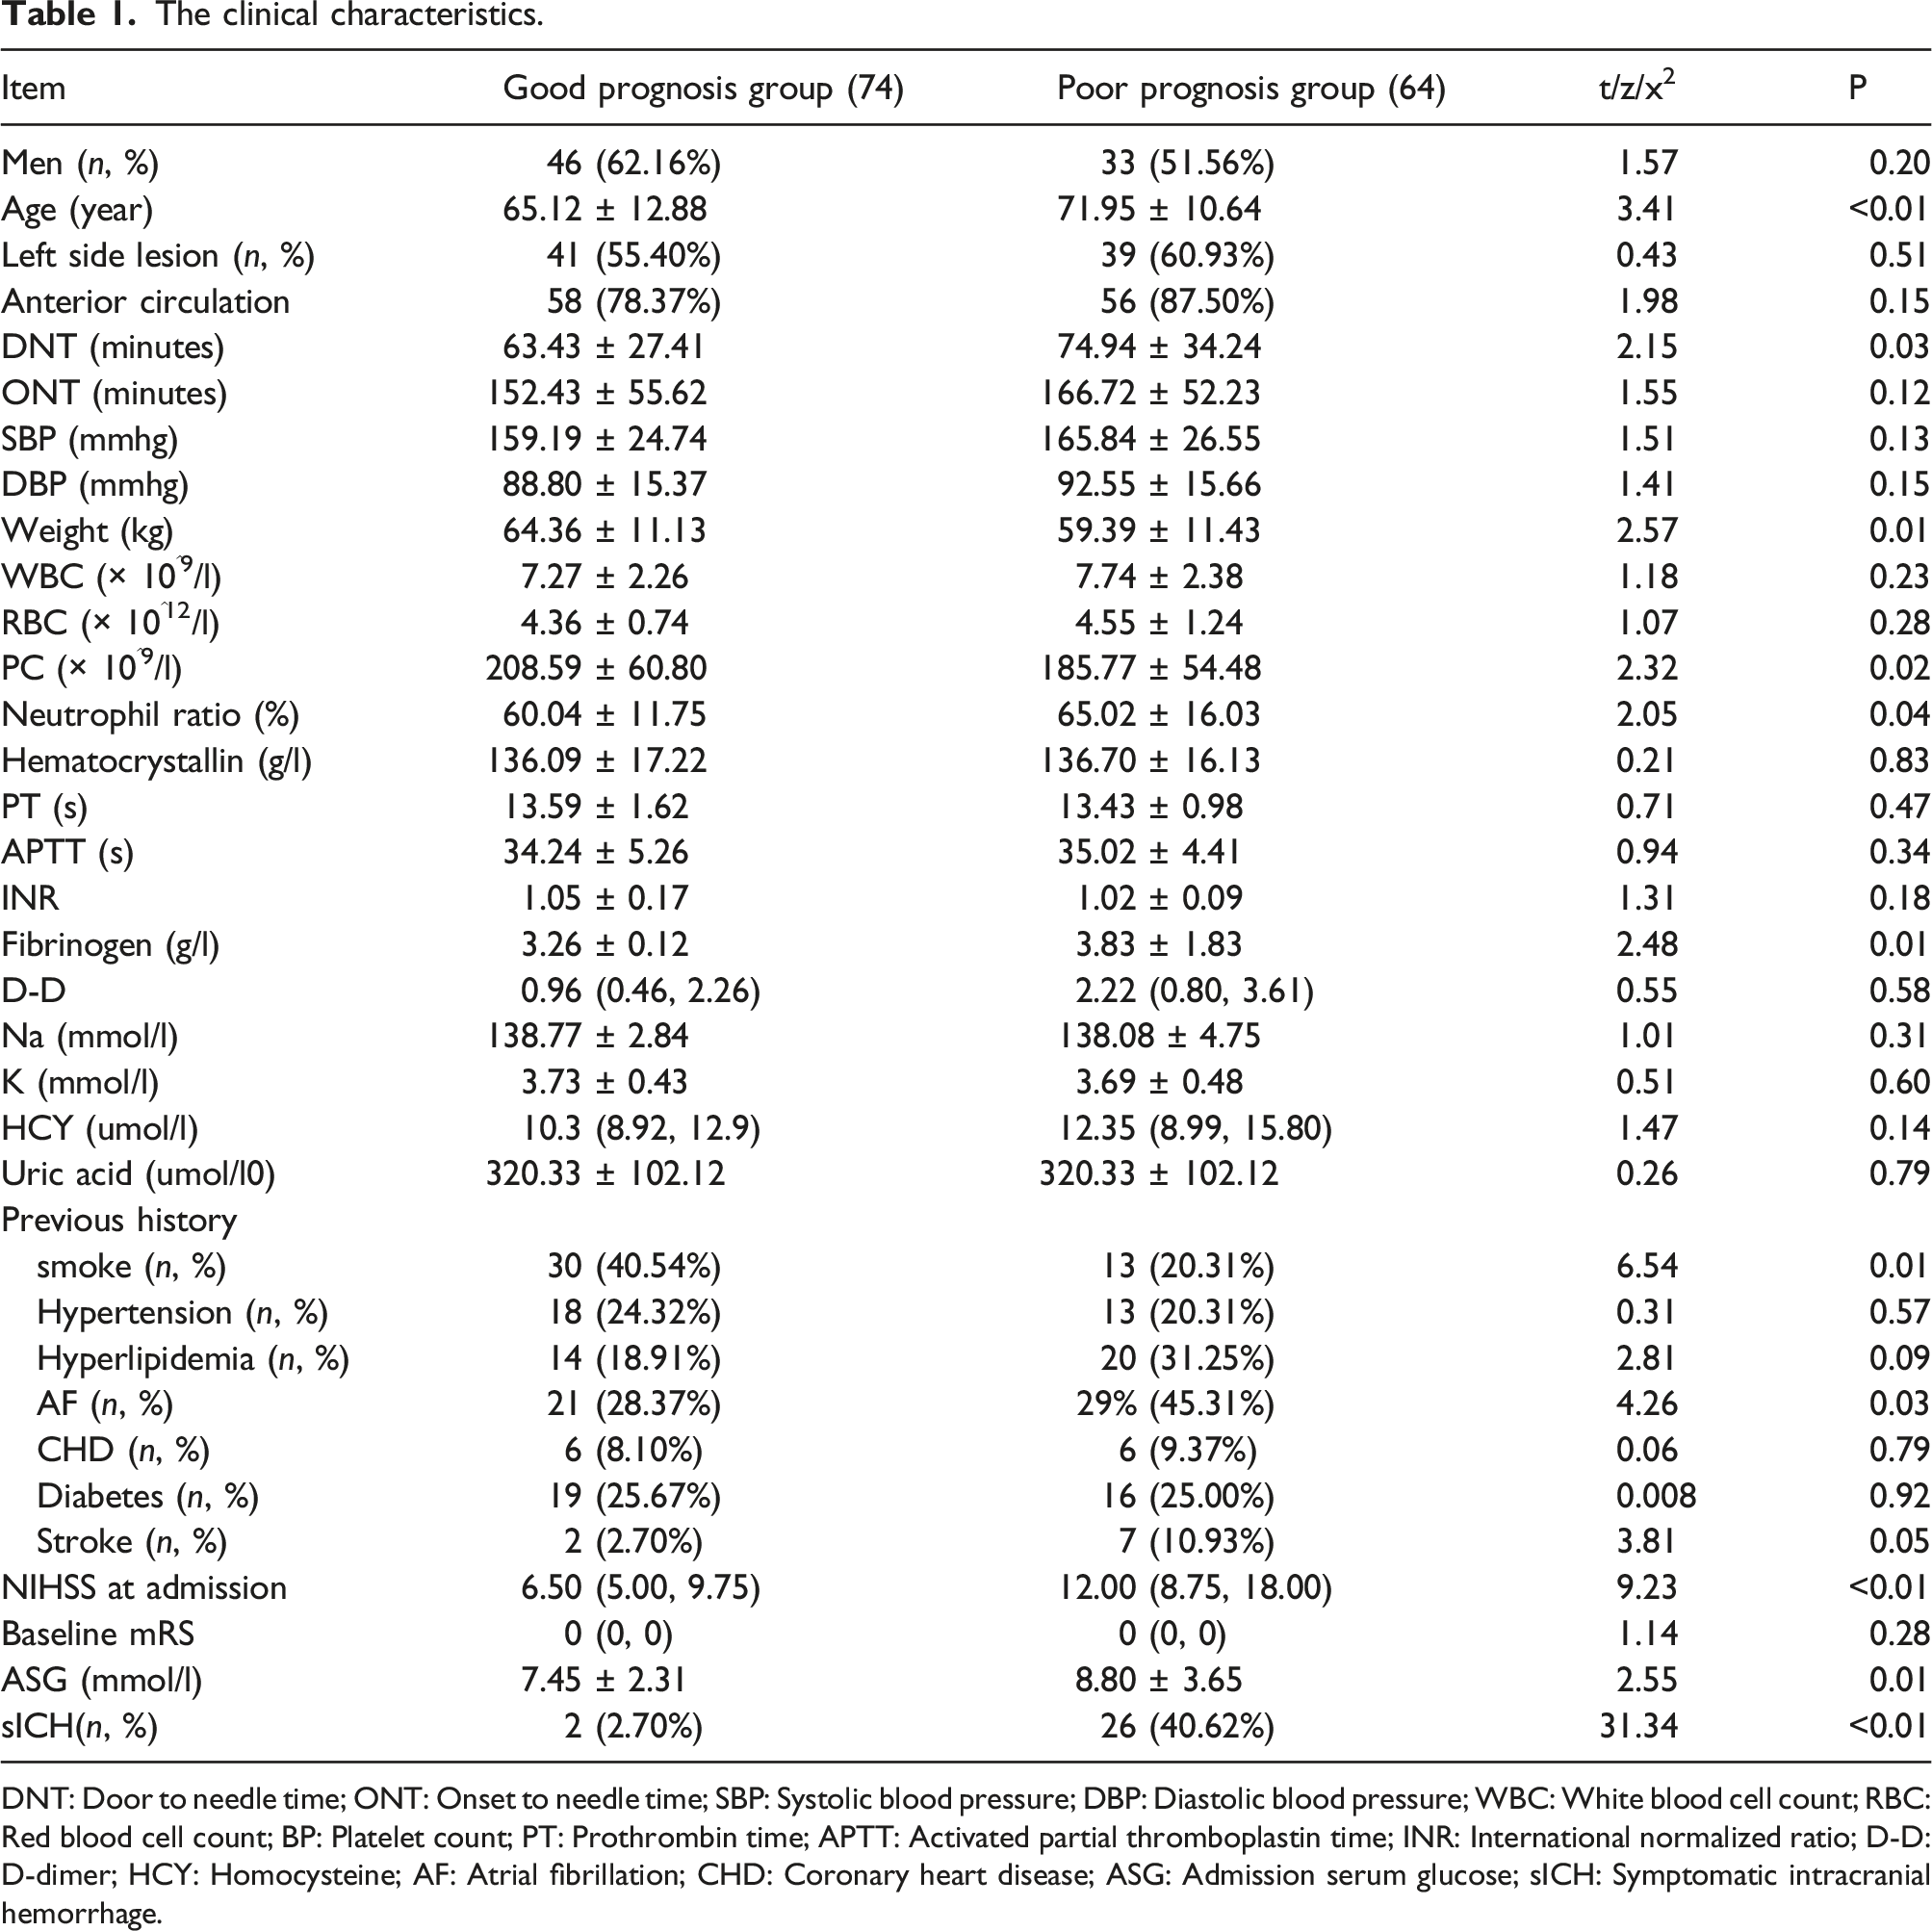
The clinical characteristics.
DNT: Door to needle time; ONT: Onset to needle time; SBP: Systolic blood pressure; DBP: Diastolic blood pressure; WBC: White blood cell count; RBC: Red blood cell count; BP: Platelet count; PT: Prothrombin time; APTT: Activated partial thromboplastin time; INR: International normalized ratio; D-D: D-dimer; HCY: Homocysteine; AF: Atrial fibrillation; CHD: Coronary heart disease; ASG: Admission serum glucose; sICH: Symptomatic intracranial hemorrhage.
Comparison of clinical data of patients with different neurological function prognosis
At the 90-day mark following intravenous thrombolytic therapy, 74 patients (53.63%) demonstrated a favorable prognosis, while 64 patients (46.37%) experienced an unfavorable prognosis. The outcome of the univariate analysis revealed notable differences between the two prognosis groups. Patients in the poor prognosis group were characterized by older age, an extended DNT duration, lower body weight, decreased platelet count, a higher proportion of neutrophils, elevated fibrinogen levels, an increased smoking rate, higher incidence of concurrent atrial fibrillation, higher NIHSS score on admission, higher admission serum glucose levels, and a higher occurrence of sICH post-intravenous thrombolysis. These disparities exhibited statistical significance (p < 0.05). Refer to Table 1 for further details.
Multivariate logistic regression analysis
Multivariate logistic regression analysis of adverse prognostic factors at 90 days after disease onset.

The predictive value of admission serum glucose to clinical prognosis at 90 days after disease onset
The ROC curve analysis showed that the optimal cutoff value for admission serum glucose to predict poor prognosis 90 days after onset was 6.77. The area under the curve (AUC) was 0.623 (95% CI: 0.53–0.72, p = 0.01), indicating a moderate predictive ability. The sensitivity was determined to be 68.80%, while the specificity was 52.70%. For visual reference, please refer to Figure 1. ROC curve of 90 days prognosis of acute ischemic stroke predicted by admission serum glucose.
Comparison of different admission serum glucose groups
Comparative analysis of parameters across distinct groups based on admission serum glucose levels in acute ischemic stroke patients.


Comparison of 90 days prognostic outcomes among different admission serum glucose groups.
Secondary endpoint events
sICH occurred in 28 (20.28%) out of the 138 patients included in this study. Among these, the good prognosis group exhibited 2 (2.70%) cases of sICH, while the poor prognosis group had 26 (40.62%) cases of sICH. Specifically, the ASG < 6.77 mmol/l group had 6 (10.90%) cases of sICH, while the ASG ≥6.77 mmol/l group reported 22 (26.50%) cases of sICH, highlighting statistically significant differences.
Out of the total 138 patients analyzed in this study, 21 (15.22%) passed away within 3 months, with 21 (32.81%) of these fatalities occurring within the poor prognosis group. Further breaking it down, the ASG < 6.77 mmol/l group experienced 3 (5.45%) cases of mortality, whereas the ASG ≥ 6.77 mmol/l group documented 18 (21.68%) cases of mortality (see Figure 3). Secondary endpoint analysis of mortality across different prognosis and ASG groups.
Discussion
Consistent with findings from prior studies, this study employed both univariate and logistic regression analysis to examine the relationship between admission serum glucose levels and the prognosis of 138 patients with acute ischemic stroke who received alteplase intravenous thrombolysis. The analysis revealed a notable association between admission serum glucose and the clinical prognosis at 90 days following the onset of symptoms. Importantly, patients in the good prognosis group displayed significantly lower admission serum glucose levels compared to those in the poor prognosis group.
The two most extensively studied factors concerning the connection between blood glucose and acute ischemic stroke are the fluctuation of the blood glucose levels and stress-induced hyperglycemia triggered by the stroke itself. Glucose fluctuation, often referred to as glucose variability (GV), denotes the unstable state of blood glucose levels oscillating between high and low values across a specific timeframe. This encompasses both short-term and long-term oscillations, with the latter reflected in HbA1C levels. Elevated HbA1C levels have been shown to increase the risk of a significant first-time stroke and the development of a larger infarct.14,15 Furthermore, in contrast to patients who do not encounter early neurological deterioration, those who do experience this deterioration exhibit a more pronounced standard deviation and average fluctuation range in their blood glucose levels. 16 Epidemiological studies have demonstrated that an extended period of elevated hyperglycemia is associated with magnified infarct dimensions, heightened susceptibility to reperfusion complications, deterioration of stroke-related lesions, and potentially elevated mortality rates. 17 Currently, the precise mechanism underlying the aggravation of brain damage due to glucose fluctuations remains incompletely elucidated. However, several potential rationales exist for this phenomenon. Acidosis: During instances of reduced blood flow and oxygen availability to the brain, glucose undergoes anaerobic metabolism, generating a substantial quantity of lactic acid. This process can trigger pronounced acidosis within the body. ②. Energy metabolism disruptions: Elevated glucose levels can engender lactic acidosis, which impedes the energy metabolism of brain tissue mitochondria. Consequently, this exacerbates the extent of brain injury. 18 ③. Changes in local cerebral blood flow: Hyperglycemia has the potential to induce swelling in the brain tissue nerve cells, subsequently diminishing local blood flow. In order to sustain adequate blood circulation, the brain responds by substantially increasing intracranial pressure. This cascade of events ultimately contributes to a larger infarct size following ischemic events. 19 ④. Hypoglycemia: Profoundly low blood sugar levels can inflict irreversible damage to the nervous system and further deteriorate autonomic nervous system dysfunction in stroke patients. This scenario can establish a vicious cycle of irregular blood sugar fluctuations. 20
Research has shown that in addition to glucose fluctuations, elevated blood glucose levels induced by stress may also serve as a significant prognostic indicator for acute ischemic stroke outcomes.21–25 Several studies have indicated that stress-induced hyperglycemia, along with newly diagnosed diabetes, can increase the risk of stroke recurrence, worsen the overall prognosis, and result in higher in-hospital mortality rates compared to stroke patients with preexisting diabetes. In a recent study called CHANCE, it was discovered that patients with newly diagnosed diabetes and stress-induced hyperglycemia had a greater likelihood of experiencing stroke recurrence, encountering worse outcomes, and facing higher mortality rates during their hospital stay. 26 In addition, stress-induced hyperglycemia (as measured using the glucose/A1c ratio) increases the risk of recurrence and all-cause mortality among patients with acute ischemic stroke but without a prior diabetes diagnosis. 27 Following an acute ischemic stroke, diverse pathophysiological pathways can foster processes like gluconeogenesis, proteolysis, lipolysis, and insulin resistance, leading to stress-induced hyperglycemia. In comparison to chronically persistent hyperglycemia, stress-induced hyperglycemia exerts a more distinct and significant effect on oxidative stress and endothelial dysfunction. The precise mechanism by which stress-induced hyperglycemia influences stroke prognosis remains uncertain, and potential mechanisms could include the following: ① Effect on Ischemic Penumbra: Hyperglycemia upon admission might impact the ischemic penumbra in patients with a favorable recanalization score. Hyperglycemia might directly induce neurotoxicity within the ischemic penumbra, resulting in greater neuronal damage and reduced chances of survival. 28 ② Blood–Brain Barrier Disruption: Elevated blood sugar levels could potentially compromise the integrity and functionality of the blood–brain barrier. The heightened permeability of the blood–brain barrier could exacerbate edema and raise the likelihood of hemorrhagic conversion following an infarction. 29 Indeed, research has provided evidence linking stress-induced to a heightened risk of hemorrhage transformation in cases of acute stroke.30,31 ③ Association with post-stroke infection: Subsequent hyperglycemia following admission could potentially correlate with post-stroke infection. Such infections, even in patients without diabetes, can complicate the prognosis. ④ Platelet Aggregation and Function: Stress-induced hyperglycemia might also trigger platelet aggregation. Additionally, hyperglycemia can detrimentally impact platelet function, exerting adverse prothrombotic effects. 32
Nevertheless, a plethora of studies have highlighted that blood glucose might not be linked to the prognosis of stroke patients. A meta-analysis showed that, in comparison to stroke patients with diabetes, those without diabetes exhibited an elevated risk of mortality within 30 days of onset.33,34 Similarly, another study found that there existed no statistically significant difference in mortality between stroke patients with or without diabetes mellitus. Nonetheless, upon delving into subgroup analysis, it was uncovered that among patients without diabetes mellitus, the blood glucose threshold for predicting stroke-related mortality was lower. Moreover, the optimal cutoff value for the mortality prediction in acute stroke patients without diabetes was identified as the normal blood glucose level. 35 In addition, other studies have reported that stress-induced hyperglycemia might not be directly correlated with adverse outcomes. The SHINE study, for instance, discovered no statistical difference in prognosis between the two groups: one subjected to standard insulin treatment and the other to intensive insulin treatment for acute stroke patients. Interestingly, the intensive treatment group experienced instances of severe hypoglycemic events. 36 Similarly, a multi-center randomized controlled trial yielded comparable results by revealing no significant difference in 90-day mortality rates among patients without preexisting diabetes who developed hyperglycemia within 24 h of admission.37,38 Other studies have likewise supported these findings, suggesting that meticulous blood glucose management through insulin administration during stroke does not improve the outcome or reduce mortality for patients with acute ischemic stroke; instead, it appears to heighten the risk of hypoglycemia. 39 The relationship between stress-induced hyperglycemia and stroke remains inconclusive, a situation possibly arising from the subsequent factors: ① Variation in Diagnostic Criteria: A substantial disparity exists in the diagnostic criteria for stress-induced hyperglycemia across various studies. Currently, specific guidelines for defining stress-induced hyperglycemia are lacking, with many studies relying on randomly collected blood glucose levels at admission to identify it. ② Blood Glucose Measurement Type: Most studies failed to specify whether they measured whole blood or plasma glucose levels, potentially introducing variability in their findings. ③ Early Diabetes Detection: Elevated blood sugar levels detected during acute illness might also serve as the initial clinical indicator of underlying or early-stage type-2 diabetes. ④ Diverse Study Populations and Outcomes: Different studies incorporated varied populations and defined distinct clinical outcomes, consequently yielding inconsistent conclusions. In general, the majority of studies suggest that stress-induced hyperglycemia escalates the risk of stroke recurrence and contributes to an unfavorable stroke prognosis. However, a minority of studies contend that a direct relationship does not exist.
Considering the existing body of research, the connection between blood glucose levels and predicting the prognosis of acute ischemic stroke remains uncertain. The variation in study subject’s inclusion criteria could potentially lead to disparate research results. Alteplase is an established and effective drug for treating acute ischemic stroke within a 4.5-h window from onset. Its administration has been shown to significantly change the survival trajectory of patients compared to those who do not receive intravenous thrombolysis. Previous studies on the relationship between blood glucose and acute ischemic stroke prognosis did not consistently account for whether intravenous thrombolysis was employed. Therefore, there is a possibility of uncovering new insights by investigating the connection between admission serum glucose levels and the prognosis of patients who undergo alteplase intravenous thrombolysis. The ROC curve was constructed to assess the predictive capability of admission serum glucose levels in acute ischemic stroke patients treated with alteplase intravenous thrombolysis. The findings showed that patients with admission serum glucose levels higher than 6.77 mmol/l exhibited a certain degree of predictability for poor prognosis, aligning with conclusions drawn from current prominent studies. However, the AUC value in this study was 0.623, falling below the threshold of 0.7. Additionally, the sensitivity and specificity of admission serum glucose as a predictor of poor prognosis 90 days post-disease onset were not high. This outcome might stem from the intricate interplay of numerous factors influencing the adverse prognosis of acute ischemic stroke patients treated with alteplase intravenous thrombolysis. A solitary parameter might not comprehensively capture the entirety of the situation. Consequently combining two or more indicators becomes imperative to improve the predictive accuracy.
The findings from this study highlight the potential of admission serum glucose levels in predicting the neurological function outcome among acute ischemic stroke patients undergoing alteplase intravenous thrombolysis. Specifically, patients with admission serum glucose ≥ 6.77 mmol/l exhibited an elevated risk of experiencing a poor prognosis at the 90 days mark compared to patients with admission serum glucose < 6.77 mmol/l. However, it is important to acknowledge certain limitations in this study. Firstly, this study was conducted as a single-center retrospective study with a relatively small sample size. While the study has identified a potential connection between admission serum glucose levels and prognosis, the limited sample size prevents the definitive establishment of a causal relationship. Therefore, the findings would benefit from validation through multi-center studies with larger participant pools. Secondly, the study solely relied on admission serum glucose levels, neglecting blood glucose fluctuations during other time frames. Dynamic monitoring of blood glucose levels over a longer period might offer a more robust predictor of outcomes compared to a single measurement. Thirdly, the study did not differentiate whether the elevated admission serum glucose levels were due to preexisting diabetes or stress-induced hyperglycemia following acute ischemic stroke without a history of diabetes. This distinction could be analyzed through stratification in future studies to yield more detailed and specific conclusions.
Conclusion
In this study, we discovered that the arbitrary admission serum glucose level predicted the 90-day prognosis following intravenous thrombolysis in acute ischemic stroke patients. Notably, patients with admission serum glucose levels ≥6.77 mmol/l exhibited a greater risk of experiencing a poor prognosis at the 90-day mark compared to those with admission serum glucose <6.77 mmol/l.
Footnotes
Declaration of conflicting interests
The author(s) declared no potential conflicts of interest with respect to the research, authorship, and/or publication of this article.
Funding
The author(s) received no financial support for the research, authorship, and/or publication of this article.