
Abstract
Background:
Malnutrition is an umbrella term that refers to an impairment in nutrition indicative of subsequently compromised human well-being. The term covers the full spectrum of nutritional impairments from a small yet detectable departure from a “norm” to a terminal stage when severe malnutrition could result in death. This broad spectrum of nutritional departures from “the optimum” dictates the need for an ensemble of metrics to capture the complexity of involved mechanisms, risk factors, precipitating events, short-term, and long-term consequences. Ideally, these metrics should be universally applicable to vulnerable populations, settings, ages, and times when people are most susceptible to malnutrition. We should be able to characterize and intervene to minimize the risk of malnutrition, especially child acute malnutrition that could be assessed by anthropometric measurements.
Objectives:
The main challenge in reaching such an ambitious goal is the complexity of measuring, characterizing, explaining, predicting, and preventing malnutrition at any dimension: temporal or spatial and at any scale: a person or a group. The expansive body of literature has been accumulated on many temporal aspects of malnutrition and seasonal changes in nutritional (anthropometric) status. The research community is now shifting their attention to predictive modeling of child malnutrition and its importance for clinical and public health interventions. This communication aims to provide an overview of challenges for understanding child malnutrition from a perspective of predictive modeling focusing on well-documented seasonal variations in nutritional outcomes and exploring “the systems approach” to tackle underlining conceptual and practical complexities to forecast seasonal malnutrition in an accurate and timely manner. This generalized approach to forecasting seasonal malnutrition is then applied specifically to child acute malnutrition.
Introduction
Malnutrition conventionally refers to an impairment in the nutrition of a person indicative of subsequently compromised well-being. 1,2 In general, the umbrella term “malnutrition” covers the full spectrum of nutritional impairment: ranging from a small yet detectable departure from a “norm” to the more severe yet curable stages to a terminal stage of point of no returns when malnutrition results in death. This broad spectrum of malnutrition manifestation dictates the need for an ensemble of metrics to capture the complexity of biological processes involved. While we assume a continuum in potentially measurable conditions, in practical settings, the preferences are given to anthropometric measurements that provide the portable, universally applicable, inexpensive, and noninvasive tools for assessing the size, proportions, and composition of the human body. 3 These measurements reflect both health and nutritional status and predicts performance, health, and survival. In this article, our focus is child malnutrition and specifically its manifestation as nutritional (anthropometric) deficits—child wasting. Ideally, we aim to measure and characterize the degree and the speed of change in nutritional (anthropometric) status and to intervene to correct the course for an individual and a community.
The main challenge in reaching this ambitious goal is the complexity of measuring, characterizing, explaining, predicting, preventing malnutrition at any dimension: temporal or spatial, and at any scale: a person or a group. The expansive body of literature has been accumulated on many aspects of malnutrition capturing mechanisms, precipitating factors, short-term and long-term consequences, risk factors, vulnerable populations, locations and settings, age, and time periods when people are susceptible to malnutrition. The research community is now shifting attention to predictive modeling of malnutrition and its importance for nutrition clinical and public health interventions. Predicting child malnutrition, especially in its acute and severe form, has many challenges and paybacks. An anticipated rapid rise in child acute malnutrition could call for needed resource allocation, effective implementation of early warning strategies and preparation, and ultimately help save lives. In setting up the forecasting malnutrition framework, we recognize that both individual and group predictions are intertwined and represent an additional layer of complexity.
Paraphrasing Niels Bohr, it is hard to forecast, especially the future. Much harder is to derive a forecast experts can rely on and make decisions based on predictions. Thus, the desire for a glance into the future and opportunities to intervene are fueling the search for ways to make predictions more accurate and much in advance. Forecasting is the process of making predictions of the future based on past and present data along with defining the uncertainty of the forecast. In forecasting child malnutrition at both individual—meaning using individual-level data for group-level predictions such as malnutrition prevalence—and group levels—meaning using already aggregated individual-level data—researchers could forecast individual or group trajectories of nutritional status measures, ability to recover after the shocks, like infectious outbreaks or food shortages, to respond to interventions 4 or to maintain health under unfavorable conditions. The process of building predictive models requires better understanding factors influencing individual and group trajectories, their drivers, and measurable proxies. Forecasting child acute malnutrition is especially challenging. 5,6 To define the framework for forecasting child acute malnutrition, one can start with a framework for forecasting child malnutrition more generally, that is, all forms of under and overnutrition. This requires setting a research agenda for identifying data, models, and information gaps and establishing the interdisciplinary links to inform relevant stakeholders. With the accurate and timely early warning of famine and food insecurity, health and humanitarian professionals can increase the efficiency of prevention and treatment. 7,8
Since 1985, the U.S. Agency for International Development’s Famine Early Warning Systems Network (FEWS NET) has been providing evidence-based guidance, both qualitative and quantitative, for effective humanitarian relief efforts. Through the regular development of subnational-scale scenarios, FEWS NET identifies the location, extent, severity, and causes of food insecurity. More recently, there is an ongoing effort to use available secondary data, for forecasting the risk of individual-level child wasting (a form of child acute malnutrition) based on a host of household and community characteristics to provide subnational forecasts. This work is being done under the Modeling Early Risk Indicators to Anticipate Malnutrition (MERIAM) project. 9,10 Such support is essential when population health is affected by varying combinations of natural and man-made disasters exacerbated by institutional failures: from floods and droughts to conflicts and infrastructure breakdowns.
In regions where child acute malnutrition is common (observed in a relatively large fraction of the population) and persistent (observed for a relatively long duration or frequently), the seasonal (systematic, periodic, and annual) fluctuations in child acute malnutrition are highly likely. 11 Seasonality encompasses a complex interplay of factors that can heighten the risk of acute malnutrition, 5,6 given the magnitude of the problem. Triggered by the COVID-19 pandemic, the prevalence of undernourishment climbed to around 9.9% in 2020, from 8.4% a year earlier; and nearly 1 in 3 people in the world (2.37 billion) did not have access to adequate food. 12 The strong interlink between child stunting and child wasting has serious programmatic and policy implications calling for routine and seasonal preventive interventions for children at risk of growth faltering. 13 -15 When seasonal acute malnutrition is prominent, even a relatively small change in causal factors could trigger the chain of events leading to a rapid increase in child acute malnutrition. 16 Furthermore, the sequence and duration of factors, say the timing and intensity of extreme weather conditions, may force swift amplification of acute malnutrition. The anticipation of such changes is critical in considering predictions stemming from large-scale systems, like FEWS NET.
Seasonal variations in any nutrition or health outcome can be characterized by a set of 3 features: seasonal peak, amplitude, and duration. 11 It means that the task of forecasting seasonal malnutrition consists of 3 steps: (1) estimating seasonal features of malnutrition from historical data; (2) building a model that allows for estimates fine-tuning; and (3) testing the model for its accuracy with newly acquired data. In modeling seasonal malnutrition, each of these steps has its own challenges. The first one calls for extensive historic records sufficient to produce reliable estimates for diverse populations and scenarios affecting nutrition status at different rates. The second step requires deep knowledge and understanding of triggers and driving factors that could affect nutrition status in short and long terms, factors that could amplify or dampen each other effects, and factors that affect the measurements directly or via a mediating path. Finally, the last step assumes that continuous tracking and monitoring are possible, and criteria for a reliable forecast are well understood and accepted by both forecasters and forecast users. This general concept is applicable to malnutrition at large and could be tailored to various types of malnutrition by considering the statistical properties of measured outcomes and the progression from mild to severe malnutrition. 11,17
This communication aims to provide an overview of these main challenges of predictive modeling and explore the strategies to initiate forecasting efforts of seasonal malnutrition for select populations. Capitalizing on our recent efforts to understand seasonal signatures in common infections, this overview provides parallels with both tracking of infectious outbreaks and modeling disease seasonality. By tackling underlining conceptual and practical complexities in forecasting seasonal malnutrition, this overview may pave the path for forecasting acute malnutrition and make useful connections with large-scale efforts in famine early warning. 7,18
General Concepts
To Predict, to Project, or to Forecast?
To describe a process of estimating future unknown situations, the terms forecasting, prediction, projection, and prognosis are often used interchangeably. Some researchers make a distinction between forecasting and predictions suggesting that forecasting is an extrapolation of the past into the future, while prediction and projection are judgmental and consider changes taking place in the future. Some suggest that forecasting is free from intuition and personal bias, whereas prediction is subjective and fatalistic in nature. In short, all forecasts are predictions but not all predictions are forecasts.
In statistics, the 2 terms: forecasting and prediction refer to formal statistical methods or alternatively to less formal judgmental methods, the meaning may depend on the context and differences between areas of application. In some instances, forecasting is reserved for estimates of values at certain future times, say peak timing of seasonal infection, while the term prediction is used for more general estimates, such as the number of outbreaks that will occur over a predefined period. Quite often terms: interpolation, extrapolation, futurecasting, and hindcasting are used in the mix. In statistics, interpolation refers to a method of reconstructing missing data points within the range of known data points. Sometimes, we are looking for ways to replace a missing daily record based on known values observed before and after, so we impute the missing value, keeping specific assumptions in mind that validate such approach. 19 Some statistical models require no missing values in the time series; therefore, interpolation is needed to prepare data for the analysis and fill the gaps.
Opposite to interpolation, which produces estimates between known observations, extrapolation is the process of estimating a value or values of a variable beyond the range of available records. Typically, extrapolation is based on some known relationship with another variable. Forecasting and hindcasting can be viewed as some form of extrapolation: one, estimating the future values, another, estimating the past, which is subject to greater uncertainty and a higher risk of producing incorrect results as it might be hard to prove the past. We are not yet encountering futurecasting in scholarly work on forecasting health outcomes. Looks like this neologism invented by media tries to add value to weather forecasts and sound more “edgy,” “sexy,” and “catchy” than the word “forecast.” However, the term nowcasting is gaining popularity in economics, indicating the prediction of the present, the very near future, and the very recent past state of an economic indicator. Similarly, in meteorology, nowcasting refers to weather forecasting on a very short-term mesoscale period of up to 2 hours.
Here, we offer definitions to help standardize methodology and interpretation of findings stemming from research on nutrition outcomes (Table 1) by analogy with definitions applied in ecological forecasts. 20 We recommend reserving qualitative techniques based on the opinion and judgment of experts and end-users to establish prognosis and projections. These approaches are most appropriate when past data are limited or not available, when systems are complex to formalize the process, or when envisioned scenarios are difficult to agree upon. They are usually applied to intermediate- or long-range decisions. Examples of qualitative forecasting methods include informed opinion and judgment, the Delphi method, market research methods, and historical life cycle analogy. 21
Proposed Definitions for: Forecasting, Prediction, Projection, and Prognosis.
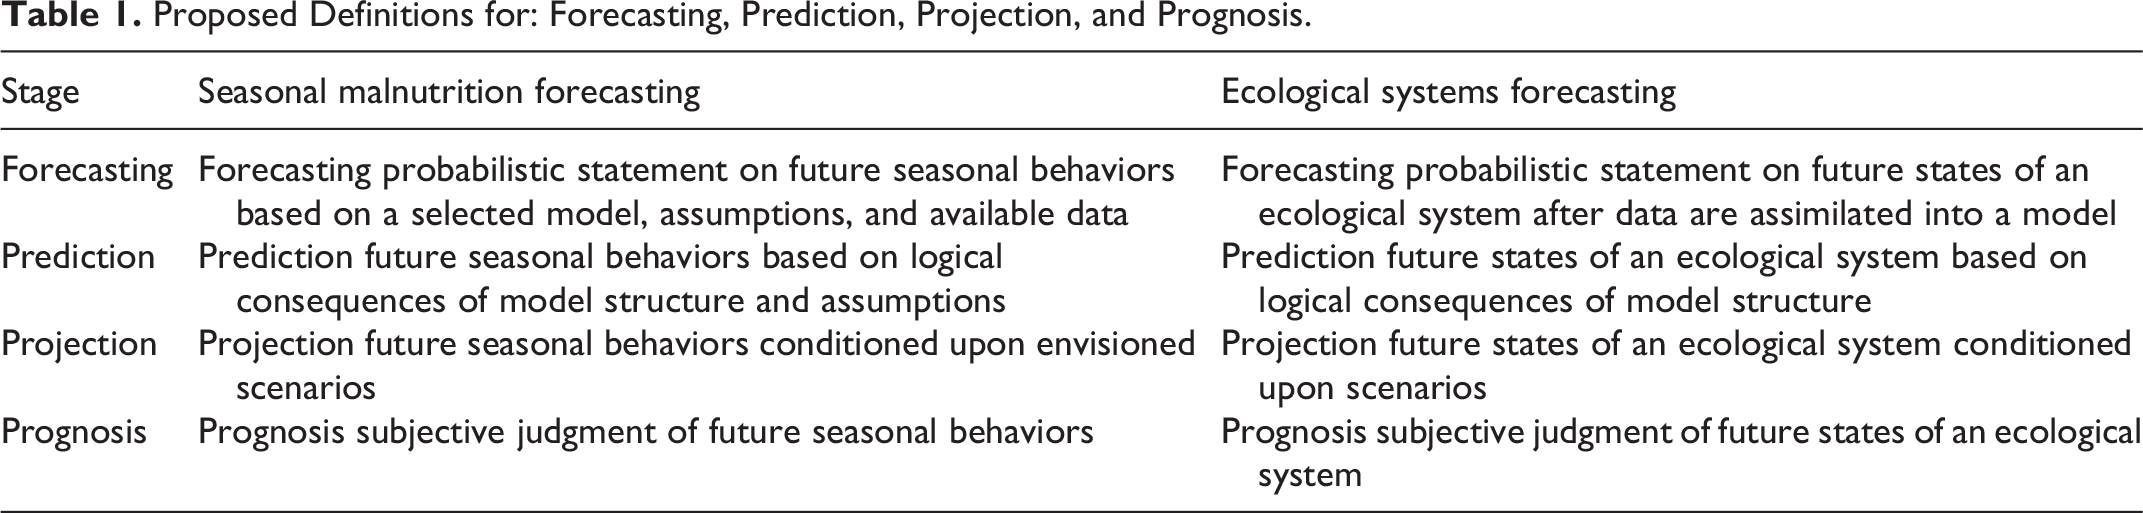
Quantitative methods are used to generate probabilistic forecasts or predictions as a function of past data, existing knowledge, selected assumptions, and models. They are appropriate to use when past numerical data are available and when it is reasonable to assume that some of the patterns in the data are expected to continue. Examples of quantitative forecasting methods are last period value, simple and weighted moving averages, exponential smoothing, seasonal indexes, and regression models adapted for forecasting and prediction. 21 These methods are usually applied to short- or intermediate-range decisions. The estimates are intended to be accompanied by uncertainty measures for users to judge accuracy and plausibility.
Information that feeds into the quantitative methods for forecasting can either be individual-level data (age, sex, whether the child is acutely malnourished) or group-level data (prevalence of acute malnutrition in a subcounty, wealth inequality in the subcounty). For the former, the model uses individual data to make individual-level forecasts, which are then averaged to make group forecasts. The goal is not to say whether a child is going to be malnourished but rather to use data from a cohort to understand prevalence in a group or geographical area. Using individual-level data, as opposed to already aggregated group data, in the model leads to better overall forecast precision.
Prediction: An Evidence-Based Estimation or a Judgment Call?
Forecasting and judgment techniques complement each other in guessing the likelihood of an event. Judgment expert calls are valuable in understanding the range of perspectives and developing a conceptual model to inform a formal forecasting procedure, which relies on information arranged in chronological order or a set of time-referenced variables. Due to many factors influencing an event occurrence requiring many experts to voice their opinion, prediction of an event is likely requiring judgment and weighing of pros and cons toward both an event and consequences associated with the event.
In the context of forecasting child acute malnutrition, a researcher might be asked to set up an early warning for reaching predefined thresholds and potentially predict famine and whether an authoritative institution will issue a famine at specific times. In the context of forecasting seasonal malnutrition, the most attractive feature of the forecast could be the ability to adapt the modeling tools to routinely collected data with the continuous improvement of forecast quality. Adaptive forecast models assume that forecast is produced and then compared to the actual values, and thus by default, the forecast should offer the estimates of higher quality yet demand more information available in a timely manner.
To start the task of forecasting, one should have an idea on what to forecast—a forecasting feature—for which period—a forecast horizon—and with what degree of accuracy the forecast will deem sufficient—a forecast quality. These forecasting features, horizons, and accuracy measures form a forecasting trio that reflects the emphasis depending on the forecasting goal while minimizing the cost associated with forecast error.
Forecasting Features: An Event or a Process?
Forecasting features are context-specific and can be presented as a distinct event or a special behavior of a process. In forecasting an event, the focus is on assessing the probability of event occurrence by an assigned time or within an assigned time interval. For example, forecasting a drop in child body weight below some threshold (to make a group forecast) or forecasting a percent of people in the observed group exhibit symptoms of severe acute malnutrition would call for event-focused forecasting.
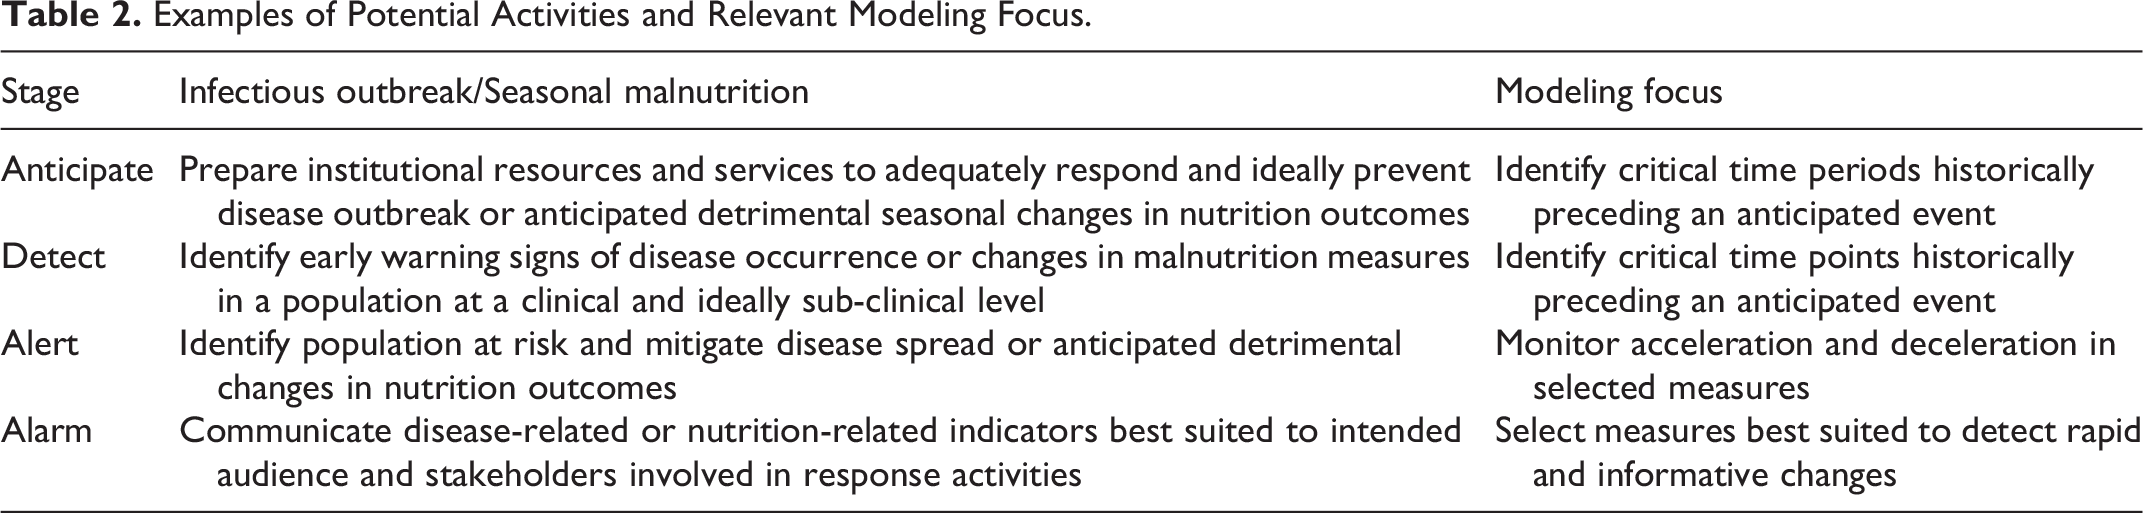
To forecast a process behavior, the emphasis is shifting to detecting the temporal proximity of an event with an overarching goal to minimize or maximize the potential effect of an event. This concept is well outlined for early detection of an infectious outbreak when the process can be presented in 4 delineated stages: anticipate, detect, alert, and alarm. This progression reflects the process by which an infectious disease or health condition can be contained within a population, treated through the mobilization of adequate resources, and minimized to prevent further exposure. Similarly, early warning for worsening food insecurity would call for process-focused forecasting.
In forecasting seasonal behaviors, which by default imply systematic periodic occurrences observed over time, and specifically over the course of a calendar year, we shift the focus to defining essential temporal elements and patterns in the outcome of interest, presented as time series. These elements include temporal trend, periodicity, and irregularity. Periodic seasonal characteristics such as peak timing, peak intensity, and peak duration are often the subject for forecasting needs. Each of these characteristics can be treated as a forecasting event. An example of a seasonal curve for an anthropometric indicator is shown in Figure 1. We could then expand the list of critical features like peak timing and peak intensity and include critical points and periods that are informative for defining the process. For example, a period of acceleration that precedes peak timing or a period of deceleration that precede the nadir could offer valuable insight for anticipating an event. These periods and their quantification help in better defining the temporal proximity of a seasonal peak or nadir for a given moment. So, the 4 stages of awareness and response can be aligned with an anticipated event and guide forecasting goals.
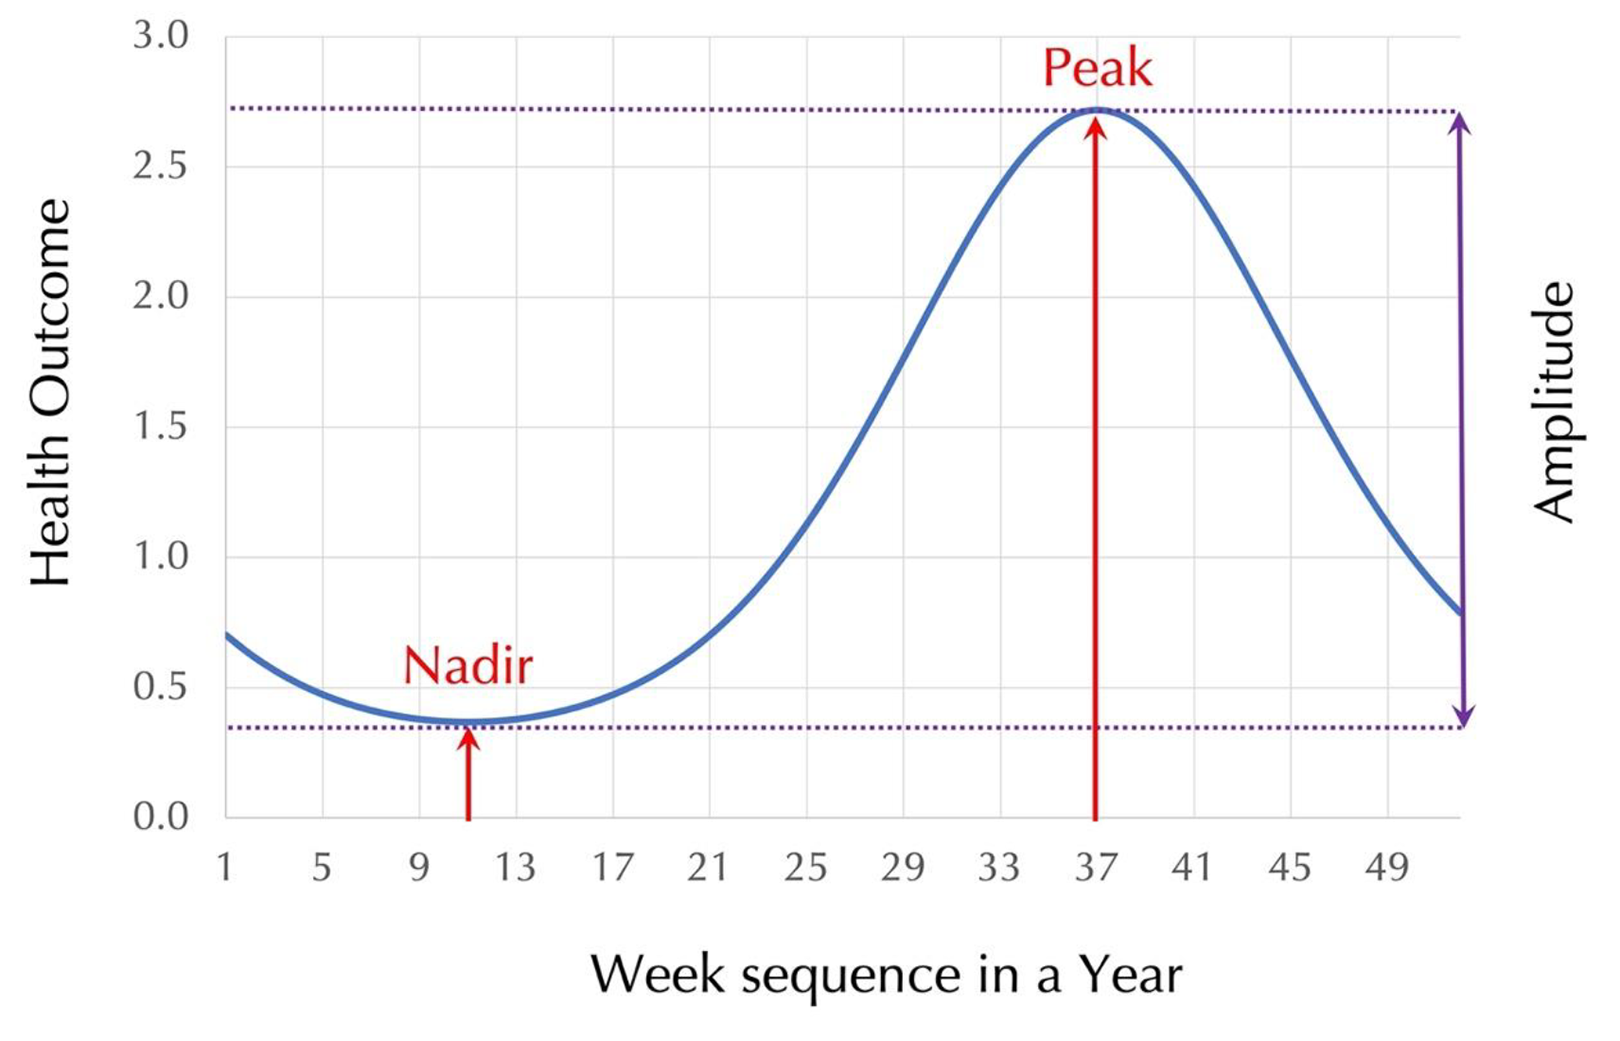
A seasonal curve of a measured health outcome.
Table 2 illustrates examples of potential activities health and nutrition professionals could be involved in an anticipation and responding to an infectious outbreak and worsening nutrition in an observed population. Conceptually, at each stage, forecasters could tailor their modeling focus and carefully select the forecasting trio: feature, horizon, and the degree of forecast accuracy. For example, for developing forecast for anticipated climate-related changes in malnutrition, one can explore the relationships between extreme weather events and changes in infants’ diet by timing and location of responses about the kind of food that is fed to infants. 6,22,23 This information is collected by the Demographic and Health Surveys (DHS) Program aiming to disseminate accurate and representative data on population, health, and nutrition in over 90 countries for the last 4 decades. The 2019 WHO/UNICEF report provides recommendations for the data collection of anthropometric indicators in young children aiming to “identify the best period to implement the survey to allow comparison with previous surveys.” 24 Since each survey also records the date of the interview, infant feeding and anthropometric measurements could be linked to extreme weather in the previous month, to weather anomalies in the previous year, or to the climatic and food insecurity predictions stemmed from FEWS NET. Such forecasts could be compared across climatic zones, locations with various degree of humanitarian assistance or military conflicts using different modeling focus, like identifying environmental indicators at critical time periods best suited to detect rapid and informative changes in malnutrition prevalence. For example, MERIAM uses a similar overall framework of pulling on individual child and household-level information with a combination of regional data, testing different lags to identify critical variables and associated time periods for forecasting subnational wasting prevalence. 9
Examples of Potential Activities and Relevant Modeling Focus.
Modeling seasonal changes in malnutrition represent an insightful scenario when forecasting techniques could capitalize on the transparency of the event-focused forecasting combined with the continuity of the process-focused forecasting. This concept could be expanded to explore the link between forecasting seasonal malnutrition and famine early warning efforts. Famine Early Warning Systems Network identifies the location, extent, severity, and causes of food insecurity using subnational-scale scenarios. 7 Since the livelihoods of food-insecure populations are often climate sensitive and climate variability affects nutrition through multiple pathways, the predictions stemming for FEWS NET could complement forecasting of seasonal malnutrition. 16
Forecasting Horizon: Too Short or Too Long?
The forecast horizon is the length of time into the future for which forecasts are to be prepared. In general, forecasts could be long term, short term, near term, and real time. In both theory and practice, time is relevant, and long-, short-, and near may have different meanings. Human perception of time and life span may contribute to such differences. Processes that evolve over several human life spans or generations are often perceived as slow. Changes that vividly transform and can be easily recalled are often perceived as fast. A long-term forecast horizon for a mayfly—a “1-day insect”—is likely to be a short-term forecast for a shark because of their differences in life span.
To simplify the task of defining the “long” and “short,” we must consider the specifics of a forecasted feature, a unit of time, and a context for decision-making. For example, in modeling influenza 25 -28 —a seasonal infection with a well-established winter peak—using weekly surveillance reporting, forecast of expected circulating viral strains for next and subsequent years (needed to provide recommendations for vaccine developers) is a long-term forecast; forecast of a seasonal peak at the start of a school year (needed for pediatricians and public health practitioners to plan for vaccination coverage, disease monitoring, treatment, and availability) is a short-term forecast; forecast of laboratory-confirmed cases of influenza among school children for next week (needed for school nurses and superintendents to prepare for potential school closing) is a near-term forecast.
In modeling seasonal malnutrition, we are bounded by the fixed length of a calendar year and unbounded by the lasting effects of prior events on current nutritional status. 11,17 The forecasting horizon has also defined the length of human life and human developmental stages and nutritional requirements at each stage. Yet, the most important aspect of prediction is its timeliness to offer time to respond, and as stated by Kim and others, “early warning systems are only effective if they trigger an early response.” 29
Forecast Accuracy and Credibility: What Is the Cost of an Error?
Any forecast must be accompanied with appropriate measures of accuracy and ideally, with a global measure of accuracy that allows for evaluating the correctness of various forecasting methods to ease the process of forecast comparison. The price for low accuracy in forecasting depends on type of an error. In predicting an infectious outbreak, damages from predicting an outbreak and not to have an outbreak and damages from not predicting an outbreak and to have an outbreak could be even not comparable. In the first scenario—resources are wasted, and forecasters can lose their credibility; in the second—lives can be lost, and more resources are needed for recovery than potentially for prevention (Table 3). In predicting seasonal malnutrition, the consequences share similar concepts.
Forecast Quality Metrics and Justification for Data Elements Enabling High-Fidelity High-Quality Predictions.
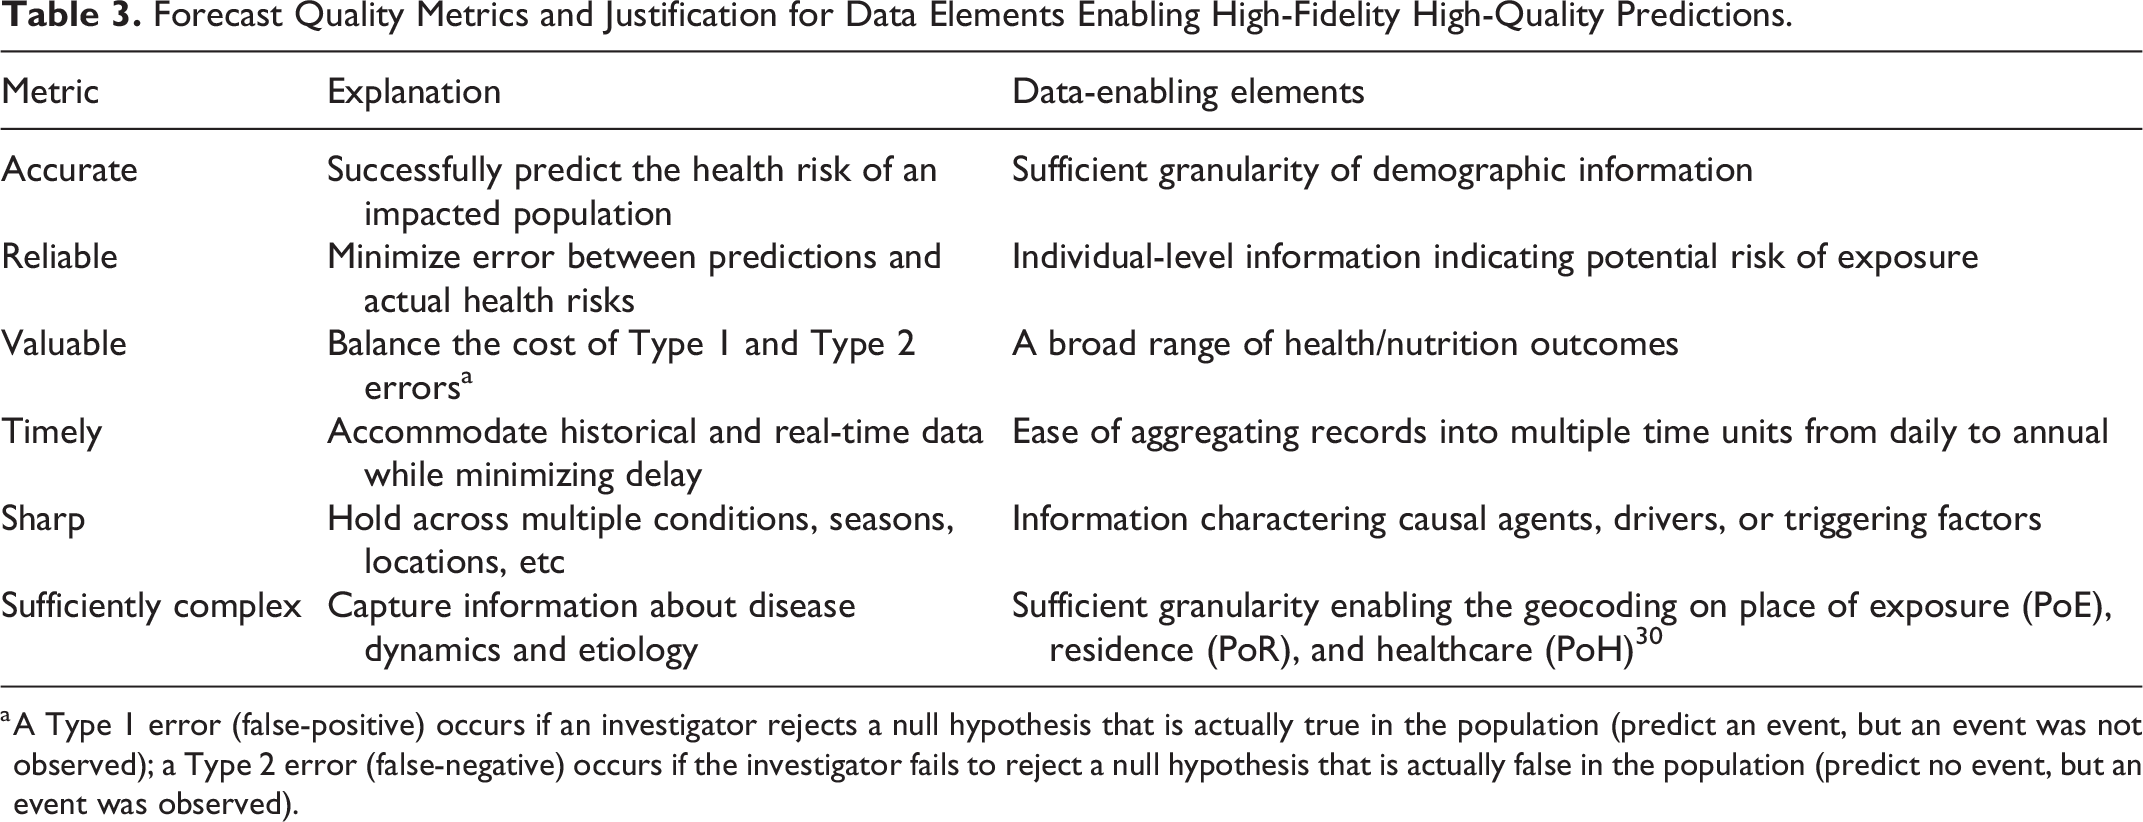
a A Type 1 error (false-positive) occurs if an investigator rejects a null hypothesis that is actually true in the population (predict an event, but an event was not observed); a Type 2 error (false-negative) occurs if the investigator fails to reject a null hypothesis that is actually false in the population (predict no event, but an event was observed).
Formalizing Forecasting Tasks
In building forecast in practical applications, a forecasting trio: feature, horizon, and accuracy measures must be further specified to include key information on where to forecast and how it should be tailored to available data. Here, we present a formal structure to initiate the task, prepare data for the analysis, and select appropriate techniques. This structure can be applied to practically any health outcome and a broad range of scenarios.
Framework for Forecasting Seasonal Malnutrition
A typical task of a forecasting can be formulated as follow: to estimate forecasting features (F) of an outcome of interest (D) according to a case definition (C) in a location (S) during a time frame (T) considering factors (X) using a data source (W). These 7 elements, namely an outcome in question, its features and risk factors, spatial resolution or location, a time period (with time units), and a data source (D, F, D, X, C, S, T, and W, respectively) are critical for the forecast framework development. Below, we illustrate how this framework can be applied to community-level measures of seasonal malnutrition.
This framework: F(t) = {D, C, S, T, X, W} aiming to build an operational forecast for an infectious disease, considering its etiology, ecology, and epidemiology, time range or forecast horizon (long term vs short term vs real time), and the stakeholder decision-making process can be fully adapted for forecasting seasonal malnutrition. Moving forward, statistical forecasting and analyses based on existing data could be insufficient in forecasting health and nutrition consequences of extreme processes or events that are not captured in historic data sources. Thus, scenario-based forecasts, structured around counterfactual “what-if” type of experiments, could generate simulated records to build the needed “in-silico” forecasts.
Preparation for Forecasting Seasonal Malnutrition
By using the presented structure, we can effectively initiate the forecasting tasks and prepare data for the analysis that requires organizing available records in chronological order and forming so-called time series of selected outcomes. When designing a time-series analysis to forecast seasonal malnutrition, we take into consideration the actual and effective length of data available for building the forecast. Longer time series with regular measurements enable greater identification of seasonal fluctuations (change at the same time each year) as well as general trends (change across all years) than shorter time series. In time series with irregular measurements or frequently missing measurements, it might be difficult to detect the effects of specific events on the outcome of interest. Noisy time series with substantial fluctuations might obscure seasonal periodicity and reduce forecast accuracy.
Seasonal characteristics can be estimated from historic records with different degrees of precision. 33 The uncertainty and credibility of estimation depend on (a) the time period or length of available records; (b) quality, completeness, frequency, and regularity of measurements; and (c) statistical assumptions used in estimation procedures. 32 Seasonal characteristics then can be modeled to better understand whether a peak would appear earlier or later, or a peak intensity is expected to differ than previously or commonly observed. 34 To solidify the final stage of forecasting, the projected estimates are compared to the observed to judge forecast accuracy with newly acquired data. Say, we estimated the peak of malnutrition in a community to occur in late spring based on historic data, we also learned that poor harvest and high prices for staple foods tend to push the peak to an earlier time; thus, we would adjust the forecast.
The pressing issues of data availability, completeness, and accuracy are essential in preparation for assessing and forecasting seasonal malnutrition. Data availability, completeness, and accuracy are intrinsically interconnected. Structural missingness may occur for various reasons. 35,36 It is likely that worsening in these principal properties appears not at random, with the more vulnerable and food insecure areas particularly suffering from lack of data. It means that the forecast obtained from only available data, when more food insecure areas reporting less accurate information, is at risk of underestimating the forecasted seasonal malnutrition. Systematic efforts to minimize potential bias emphasize the potential for underestimation due to data limitation and develop approaches to both better calibration of available sources and seeking novel data sources could help in addressing these issues.
Where to Start or What Is Naive Forecast?
Statistical methods aiming to produce probabilistic quantitative forecasting vary in is origin and ranging from simple naive forecasting methods to methods based on time-series analysis and to machine learning methods. Estimating techniques in which the last period’s values are used as near next period’s forecast, without attempting to establish causal factors or adjusting for external factors, form a category of naive forecasts. This method provides a useful benchmark for other more sophisticated methods, yet very limited in offering high-quality forecasts.
The naive forecasting methods use the most recent observations and propagate them forward based on specific assumptions. Forecasts can be produced for any forecast horizon by specifying the desired time period and the number of values for this interval. Below, we provide some examples of naive forecasting methods.
Weighing scheme could be useful in adaptive forecasting when with new datum arrival the method is finetuned to minimize the overall forecasting error. The error could be also sensitive to the number of available time points contributing to estimation. In general, this contributing time period could be as short as any 2 data points and as long as the whole time series. In the context of forecasting seasonal malnutrition, it is essential to have sufficient data to establish a seasonal pattern with the sufficient degree of accuracy, thus at minimum of one annual cycle of data is needed to initiate the forecasting procedure.
How to Perform “Less Naive” Forecast?
More complex forecasting methods incorporate information needed for correcting, fine-tuning, and adjusting forecast based on external factors and inherited variability of seasonal patterns. Examples of such techniques include process-based harmonic models allowing to consider (a) 2 common forms of outcomes variables: binary and counts, and (b) long-term monotonic and nonmonotonic trends, weekly cycles, calendar effects of various social, political, ecological events, and other temporal factors affecting the seasonal curve of outcome of interest. 37 -41
Two articles presented in this issue utilize this technique to describe seasonal patterns in child acute malnutrition building the foundation for implementing forecasting approaches. 42,43 The first article relies on a dataset of monthly nutrition outcomes in eastern Chad. After imputing missing records, a harmonic mixed effects model was applied to wasting, a binary outcome reflecting individual occurrences when weight-for-heigh measurements are less than a predetermined threshold of 2 standard deviations below the normalized mean value. The logistic mixed-effect model with harmonic terms was applied to detect the presence of multiple seasonal peaks in wasting. The other article utilizes over half a million individual observations collected from historic nutrition monitoring data collection. A similar model with harmonic terms was applied to detect seasonal peaks in the acute form of malnutrition across livelihood zones. Thus, both studies serve as examples of how anthropometric measurements can be analyzed for establishing seasonal peaks, a potential forecasting feature in future research. With the prominent seasonal annual peaks that occur on an annual basis, it become essential to explore potential drivers and develop seasonal forecasts that in turn could help to distinguish the effects of factors directly related to annual shocks such as droughts or famines.
Our recent work on modeling the interlinks between wasting and stunting based on individual growth trajectories in a single cohort of young children measured adds important nuances to discussions of the timing of growth faltering. 13,14 Findings show that by addressing the overall conditions in which children live and underline the importance of improving community-level systemic factors that constrain growth among the entire population, rather than simply focusing on household or nutritional factors, may have substantial implications for the optimal timing and nature of growth interventions. Longitudinal growth surveillance programs could plausibly detect early signs of growth faltering if the measurements are taken at sufficiently high frequency. I envision that future methodology development in forecasting seasonal malnutrition could be based on individual growth trajectories in sentinel cohorts to complement an extensive work on early warning systems.
How to Access Forecast Quality?
Forecast quality will be assessed based on the 6 metrics shown in Table 3. While many existing methods provide some uncertainty measures, the important aspects of fidelity, such as reduction of bias and distortion introduced by lack of data or other factors, have rarely been discussed or implemented in the existing modeling platforms. Overall, forecast quality requires that predictions can be clearly communicated to key stakeholders so they could make decisions and answer key questions related to say, resource allocation in the near future. Forecast quality depends on spatiotemporal resolution of data. Thus, techniques and decisions on how data are aggregated, for instance: daily into weekly, zip code into town, age into age groups, and so on affect forecast metrics. Such effects should be clearly communicated to data curators to minimize information loss and distortions. Standard seasonal modeling techniques 39 could serve as an initial benchmark; however, a detailed examination of validation procedures for the proposed framework is warranted.
Forecasts must be interpretable to be useful. Furthermore, each forecast should be supplemented with metrics and evaluation criteria to judge the forecast quality, including measures of model performance such as quality of fit values, mean absolute error, and so on, as well as post hoc analysis of how accurate the model forecast was. Better utilization of forecast for seasonal malnutrition could offer support in relation to both seasonal peaks divorced from large covariate shocks such as droughts and famines, as well as in anticipation of those larger shocks. Better forecasting of acute malnutrition outcomes, as opposed to relying on existing assumptions of seasonality that do not always stand up to the data, could help with timely surging of resources and capacity for treatment services as well putting in place more preventive measures addressing the drivers associated with peak seasonal malnutrition.
Next Steps
The proposed framework can be used in a broad context of any type of malnutrition and cover the full spectrum of nutritional impairment: from small yet detectable departure from a “norm” to the more severe yet curable stages to a terminal stage of point of no returns when malnutrition results in death. This broad spectrum of malnutrition manifestation calls for an ensemble of essential metrics to capture the complexity of biological processes involved. Forecasting methods are also improving in their performance, complexity, demand on data, and accuracy. While all techniques rely heavily on available data, they have different requirements on data type and volume, computational capacities, and anticipated forecast horizon. Recent developments in the field of artificial intelligence offer improvements in prediction methodology and consequently in decision-making. Researchers are shifting their attention to implementing methods offering reliable short-term and near-term forecasts and focusing on methods accommodating self-organizing, adaptive, scenario-based, and ensemble-based modeling. The complexity of processes influencing seasonal malnutrition requires systems thinking 11,27,28,34,43,44 and ability to take into account time, space, and scale dimensions, governing or driving factors, including feedback mechanisms, tipping points and attractors, synchronization of infectious outbreaks, fat-tailed distributions reflecting leverage values, and irregularities. 25,40,45 The challenge therefore remains in evaluating and quantifying the performance of forecasting methods in real time. When successful, we gain from a reliable forecast by making actions to maximize the benefits and reduce potential harm. A good forecast should offer proper resource allocation, effective implementation of early warning strategies and preparation, and ultimately saving lives. Beyond statistics, data analytics, and modeling, multidisciplinary communication strategies, solutions, and sociopolitical implementation dialog are needed to make forecast actionable. 46,47
Conclusion
While we have had good famine early warning information for decades, such as FEWS NET, the international community is often reluctant to act on it, due to a combination or political and technical reasons, including levels of trust between donors and humanitarian actors. 48 Triangulation across different forecasting models and early warning systems using different modeling or predictive approaches and different outcomes, including food security and acute malnutrition, could help increase overall trust in the forecasts, particularly when those models draw on reliable data and show overall agreement. Current guidelines classifying famines call on a high level of rigor in the data and analysis with hard-to-reach areas rarely meeting these criteria, despite likely having worse outcomes related to the lack of access. Acute malnutrition models that draw on climate and conflict data could further help with forecasts for areas that are generally inaccessible. Adding additional toolsets to forecast acute malnutrition, borrowing from the knowledge gained in the prediction of infectious diseases could go a long way to supplement existing early warning systems, providing further evidence for key decision-makers on advocacy and timely humanitarian support.
To meet the World Health Assembly and the UN Sustainable Development Goal targets, we need a paradigm shift in understanding how child malnutrition emerges, sustained, aggravated, mediated, and mitigated at the individual, household, or group levels. A better understanding of spatiotemporal interactions among malnutrition measures within environmental, social, economic, and political systems in the context of systems thinking is crucial for developing sustainable intervention strategies. Thus, a call for setting priorities on identifying data, metrics, and methods to make forecasting of seasonal malnutrition actionable merits much greater attention.
Footnotes
Acknowledgments
The author would like to acknowledge Dr Anastasia Marshak, Dr Yuri N. Naumov, and anonymous reviewers for their thoughtful comments and suggestions.
Declaration of Conflicting Interests
The author(s) declared no potential conflicts of interest with respect to the research, authorship, and/or publication of this article.
Funding
The author(s) disclosed receipt of the following financial support for the research, authorship, and/or publication of this article: This work in part was supported by the STOP Spillover project through the United States Agency for International Development (USAID). The contents are the responsibility of STOP Spillover and do not necessarily reflect the views of USAID or the United States Government. The Tufts University Data Intensive Studies Center (DISC) Seed Grant also supported this research.