
Abstract
Background:
Understanding seasonal patterns in nutritional status is critical for achieving and tracking global nutrition goals. However, the majority of nutrition seasonality research design draws on 2 or 3 within-year time points based on existing assumptions of seasonality, missing a more nuanced pattern.
Objective:
We aimed to identify the intra-year variability of childhood wasting, severe wasting, and weight-for-height z-scores (WHZ) in a dryland single wet-season context and illustrate an analytical approach for improving analysis of the seasonality of nutritional status.
Methods:
To quantify the intra-year variability in nutritional status, we use data from a 23-month panel study (May 2018 to March 2020) following 231 children (6-59 months of age) in eastern Chad. We apply a mixed-effects harmonic regression with child- and village-level fixed effects on the odds of being wasted, severely wasted, and on WHZ, testing for multiple and nonsymmetrical seasonal peaks, adjusted for child sex and age. We triangulate our findings using climate data on temperature, vegetation, and precipitation.
Results:
We identify 2 annual peaks of wasting and severe wasting. Wasting peaks at 14.7% (confidence interval [CI], 11.8-18.2) at the end of the dry season, while the smaller peak corresponds to the start of the harvest period at 13.4% (CI, 10.7-16.6). The odds of being wasted decline during the rainy season to 11.8% (CI, 9.4-14.7), with the lowest prevalence of 8.8% (CI, 6.9-11.1) occurring during the start of the dry season. In addition, a 1°C monthly increase in temperature is significantly associated with a 5% (CI, 1.4-8.7) and 12% (CI, 3.0-20.3) increase in the odds that a child is wasted and severely wasted, respectively.
Conclusions:
Intra-year variability of child wasting is far more complex and nuanced than identified by the literature, with 2 peaks, as opposed to 1, likely corresponding to different seasonal drivers, such as food insecurity, disease, water contamination, and care practices at different times of year. Better seasonality analysis can go a long way in improving the timing and content of programming with the goal of reducing child wasting.
Plain language title
Two Seasonal Peaks of Acute Malnutrition in Chad
Plain language summary
Understanding seasonal patterns in nutrition is crucial for achieving and monitoring global nutrition goals. However, most research on nutrition seasonality relies on only a few time points within a year, which oversimplifies the true pattern. In our study conducted in Chad, a dryland environment with a single rainy season, we examined various indicators of acute malnutrition, including severe acute malnutrition. We analyzed 23 months of data from 231 children aged 6 to 59 months, considering factors such as sex, age, monthly rainfall, temperature, and vegetation. Our findings revealed 2 peaks of acute malnutrition, challenging the prevailing notion of a single peak identified in existing literature. The first, larger peak occurred at the onset of the rainy season, followed by a decline and then a second peak just before the harvest period. This pattern aligned with temperature variations rather than rainfall. The complex and nuanced seasonal patterns we observed suggest that different factors such as food insecurity, disease, water contamination, and care practices may contribute to acute malnutrition at different times of the year. Improved analysis of seasonality can significantly enhance the timing and effectiveness of interventions aimed at reducing child wasting.
Introduction
In 2015, the world committed to the elimination of malnutrition in all its forms by 2030 as part of the Sustainable Development Goals (SDGs). However, since the adoption of these targets, progress to reduce child wasting has been slow. 1 -3 Recently, there has been a renewed emphasis on seasonality, with seasonality identified as the “missing link” 4 or major information gap to design programs that prevent malnutrition. 5 -7 However, existing assumptions 8 and methodological approaches to measuring and analyzing seasonality 9 limit our ability to detect the true complexity and nuance of seasonal wasting patterns. We use data from Chad to show how to improve the study of the seasonality of nutrition status in drylands more broadly. We identify 2 uneven annual peaks in wasting, deviating from the existing literature. Correctly quantifying wasting seasonality is critical for nutrition policy and interventions, whether it is identifying the best time for ramping up support for the treatment at health centers or implementing the appropriate nutrition-sensitive programs for the purpose of prevention, or simply a better understanding of progress toward the SDG nutrition targets.
Certain assumptions around the peak timing of wasting are extremely common in the literature and can bias study design, analysis, programming content, and timing. Pelletier et al (1995) identified the presence of a “food-first” bias in nutrition programming, meaning the idea that malnutrition is primarily caused by a lack of food on the individual, household, or community level and hence needs to be addressed with interventions focused on improving food security. 8 There is a broad consensus that the “hunger” or “lean” season corresponding to the wet season is the culmination of multiple drivers of poverty and food insecurity, including low food stocks, heavy workloads, and high disease presence. 10 -13 The primacy of a food-first assumption means that seasonal patterns in food security become synonymous with seasonal patterns in wasting, resulting in numerous papers and organizational documents asserting that peak timing for wasting occurs during the “lean” season. 11,14,15 Consequently, the dominance of this assumption results in an emphasis on food-oriented interventions timed to correspond to the peak timing of food insecurity, including supplementary feeding, market gardens, support around markets and the food value chain, social and behavior change (SBC) around cooking and meal composition, and cash interventions. 8,16 The assumption can lead to bias in seasonality study design and analysis that unintentionally supports this assumption, by selecting or aggregating analysis across categorical time periods in line with the seasonality of food insecurity, such as comparing nutrition status across postharvest versus preharvest, moderate versus hunger versus posthunger, or rainy versus dry season. 9
The study of seasonality is the “study of the interrelations that exist between ourselves as individuals, as well as the populations within which we exist, and the ecosystems of which we are part” 17 and thus requires a consideration and incorporation of climatic characteristics and patterns. An environmental perspective on seasonality is particularly crucial for unimodal rainfall drylands, such as Chad, given the intra-year changes in precipitation, temperature, and vegetation, 18 the link between that climatic variability and human activities, particularly livelihoods, 19 and the resulting intra-year variability across multiple outcomes, including child nutrition. 10,13,20 Drylands cover 40% of the world’s terrestrial areas 21 and are home to 2 and a half billion people 19 with a single wet-season regime dominating. 22 Unimodal drylands have been identified as suffering from persistently high levels of wasting classified as a humanitarian emergency, even in the absence of a drought, conflict event, or other disaster. 23 Hence, we use Chad as a good example for understanding seasonal patterns of nutritional status in unimodal drylands more broadly.
We specifically focus on 3 nutrition outcomes at the individual child level at each time point: weight-for-height z-score (WHZ) or weight-for-length z-score (WLZ) depending on whether the child is 2 years and older or younger than 2 years, respectively, whether the child was wasted (WHZ <−2 or WLZ <−2), and whether the child is severely wasted (WHZ <−3 or WLZ <−3). 24 For the remainder of the article, for simplicity we refer to WHZ with the understanding that we used WLZ for children younger than 2 years. On the population level, wasting and severe wasting prevalence captures the proportion of children in the left-hand tail of the distribution of WHZ, whereas mean WHZ tells you about the central tendency of the distribution. The literature on the seasonality of wasting and WHZ in single wet-season dryland contexts is sparse and inconsistent. When it comes to wasting, studies in Malawi, Sudan, and Nigeria found that wasting peaks right before the harvest or during the rainy season, 25 -27 while data from Chad, Niger, and South Sudan show an association between the dry season or the onset of the rainy season with higher wasting prevalence. 28 -30 Seasonality of WHZ is also not consistent. Research from Senegal, Ethiopia, and Zimbabwe shows that WHZ is lowest in the “lean” or preharvest season, 31 -33 while in Mali, WHZ shows a gradual improvement occurring in the dry season followed by a decline in the rainy season. 34 Only 2 studies identified multiple peaks of wasting visually, but not statistically, immediately prior to the rains and after the rains: secondary data analysis of nutrition surveys in South Sudan 35 and another secondary data analysis from Chad, Sudan, and South Sudan. 6 Furthermore, all but 2 studies treated time as a categorical variable, an approach not in line with current best practices for other highly seasonal outcomes, such as infectious diseases. 36 -39 The differences across the multiple studies within similar climatic conditions may reflect differences in precipitation and vegetation observed in drylands within or between years or the predominate livelihood system included. The differences could also be due to a tendency to analyze, and even sometimes aggregate, data using overly simplistic categorical seasonal definitions such as “rainy” versus “dry” or “preharvest” versus “postharvest,” 40,41 with no consideration or testing for the possibility of more than 1 within-year peak. 9
The aim of this article is to identify the intra-year variability in wasting and WHZ in the context of 1 wet-season regime in eastern Chad as well as illustrate an analytical approach to getting the most out of nutrition panel data for the purpose of seasonality analysis. To that end, we present findings from a 23-month panel study (May 2018 to March 2020), following the same households and their children (6-59 months of age). We illustrate the importance of testing for multiple within-year peaks and show that Chad experiences 2, as opposed to just 1, peaks of wasting. We also discuss the importance of a more nuanced approach to defining seasons that goes beyond treating time as a categorical variable and is more in line with changes in climatic variables and local perspectives in drylands.
Methodology
Location
The study was conducted in the Sila Region of eastern Chad in Concern Worldwide’s program catchment area. The region and communities sampled include households that practice a mix of subsistence farming and pastoralist livestock production, with a history of more exclusive specialization in one production system or the other. 42,43 The rainy season typically occurs between May and October, receiving an average of 500 to 600 mm/rainfall a year, with variability in rainfall patterns within and between years. 6
Study Procedures
All enumerators went through a thorough 1-week training on the survey instrument and child anthropometry. Only enumerators who passed an exam at the end of the training were selected. A refresher training was provided at the beginning of the second year of data collection.
In each community, mobilization of the selected households occurred 1 or 2 days prior to the planned data collection. On the day of data collection, enumerators went through the voluntary consent process. Once the respondent agreed to participate, the survey was conducted in a private location. Anthropometry measurements of children between the ages of 5 and 59 months were taken 3 times to confirm accuracy. Electronic scales were used for the weight data and a standard height board for height. For children younger than 2 years, recumbent length was measured instead of height. Consent for the anthropometry was provided by the female caretaker. All instruments were approved by institutional review board of Tufts University. All data were collected using electronic tablets, allowing for real-time quality control as well as built-in logic to prevent (as much as possible) human error.
Sampling and Data
Eight villages were purposively selected for the study based on their proximity to Goz Beida, the regional center and nongovernmental organization (NGO) office location, to ensure access throughout the year. The region under study is extremely remote (950 km from the capital), making access to most of the communities almost impossible or at least unpredictable, especially during the rainy season. Given the need for monthly panel data, particularly during the time of poor access, consistency and ease of data collection were deemed paramount for sample selection. Ninety households, with at least 1 child aged 6 to 59 months, were then randomly selected across the 8 villages. The sampling frame was provided by roster data from Concern Worldwide’s completed Community Resilience to Acute Malnutrition program. 44 As with the village selection, the sample size was determined based on the ability of the team to collect monthly measures.
The study followed the same households and their children on a monthly basis. As children aged out of the study age criteria (turned 60 months of age), they were removed from the study, while children who aged into the age criteria (turned 6 months of age) were added. Data were collected from May 2018 through March 2020. By March 2020, the study included 219 individual children. Female caretakers served as the respondent for all points of data collection.
We use 3 key outcomes in the analysis: WHZ, wasting, and severe wasting. We also include, separately, area-averaged time series data on monthly precipitation, temperature, and the Normalized Difference Vegetation Index (NDVI) within the geographical boundary (bounding box: 13°N, 21°E, 12°N, 22°E) of Concern’s programming area. Precipitation data are derived from the Integrated Multi-satellite Retrievals for Global Precipitation Measurement (IMEREG) data, temperature data are derived from the Atmospheric Infrared Sounder (AIRS) data, and the NDVI data are a MYD14C2 version 6 product.
Preparing Data for Analysis
Weight and height data were collected across 2,576 child observations (data set 1). We then removed all measurements of weight and height data deemed to be unrealistic or unreliable, resulting in the loss of 46 observations (data set 2). Specifically, we removed height data if the child appeared to lose more than 5 cm in height in a single month; and weight if weight changed, up or down, by 3 kg or more in a month. Next, we replaced the weight and height data removed in data set 2 using the mean value between available observations, as long as the child had a realistic measurement in at least the 2 months prior and after the gap in data, allowing us to restore 45 of the removed observations (data set 3). Both WHZ and WLZ were calculated using the UNICEF Stata macro for calculating z-scores using the 2006 World Health Organization growth standards.
Analysis
We ran and compared results across 4 different models in order to identify the seasonal trends in wasting and the primary and secondary peaks. To incorporate seasonality and account for the observed noneven intervals in wasting, we included 4 harmonic terms with both 2 and 4π sine and cosine terms in the regression, in line with previous epidemiology research on seasonality. 36,38,44,45 The use of the sine and cosine terms allows us to capture the presence of repeated patterns in our outcome measure, while the use of both the 2 and 4π terms allows us to test the presence of multiple and nonsymmetrical patterns within the same year.
For model 1, we used logit and ordinary least square (OLS) regression with the inclusion of the harmonic terms for WHZ, wasting, and severe wasting, adopting the model for the latter 2 binary outcomes to better identify and observe the seasonal trend on its own. In model 2, we ran the same regressions, but with the inclusion of the “day” time trend. In model 3, we used a mixed-effects regression with child- and village-level fixed effects, to control for unobserved child- and village-level characteristics. Model 4 additionally adjusts for child sex and age in months so we can distinguish between the crude and adjusted intra-year variability. Models 5, 6, and 7 include the average monthly climatic data: rainfall (in mm), temperature (in Celsius), and NDVI, respectively.
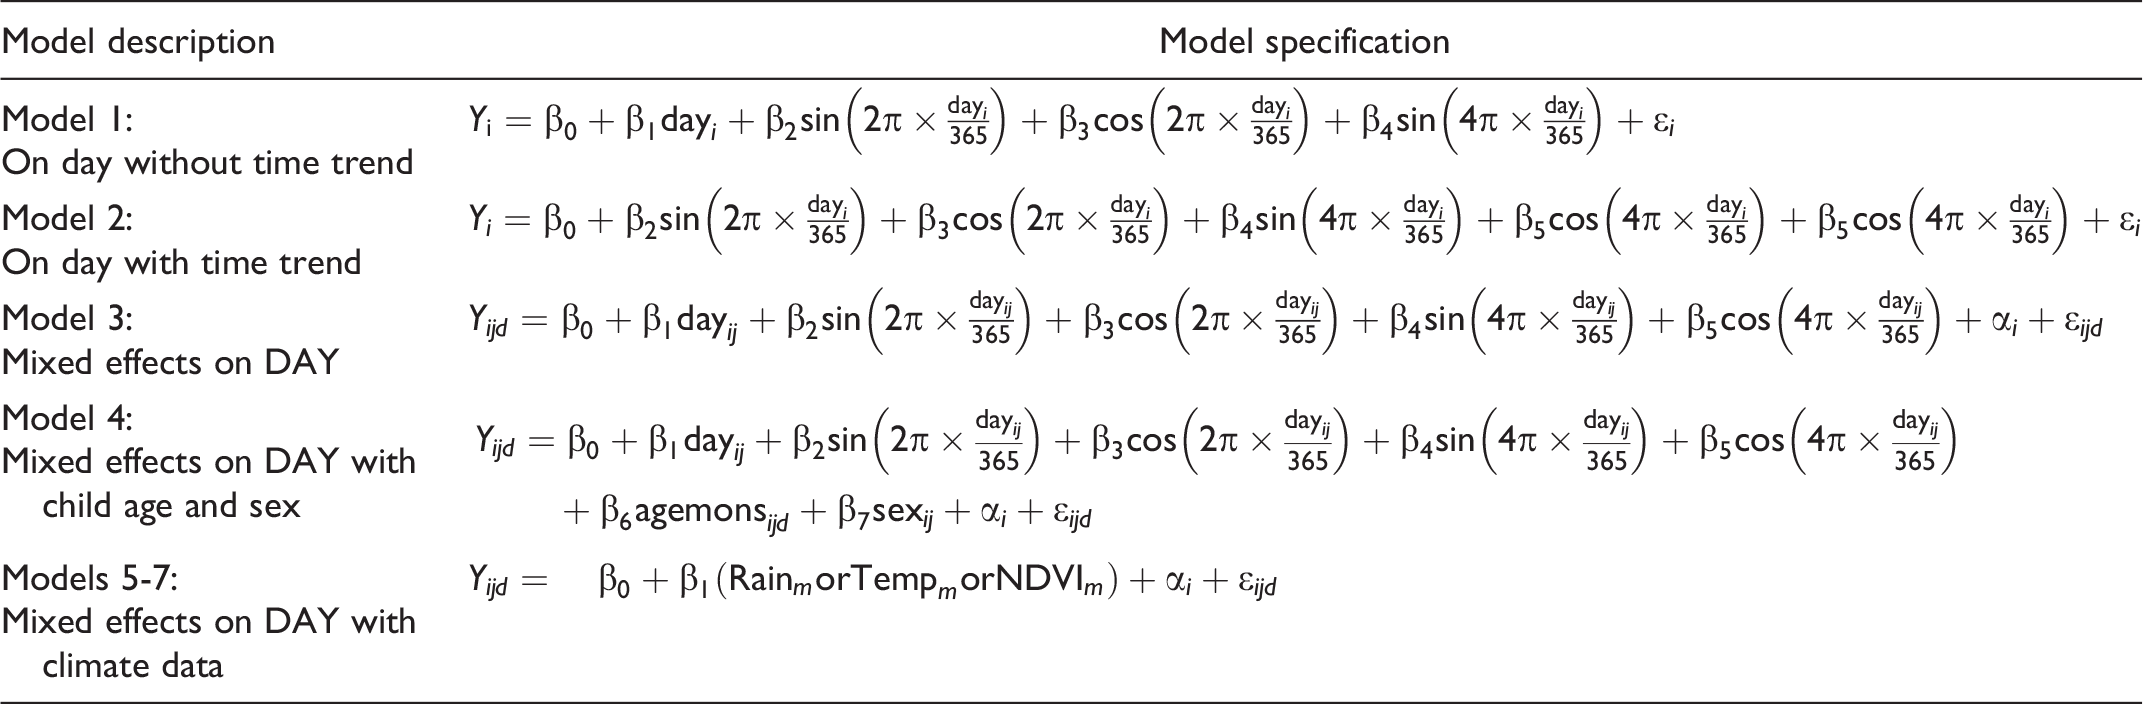
where,
All models 1 to 7 were adapted for both forms of the outcome: continuous (WHZ) and binary (wasting or severe wasting). For the binary outcomes, Y is taking the logit form:
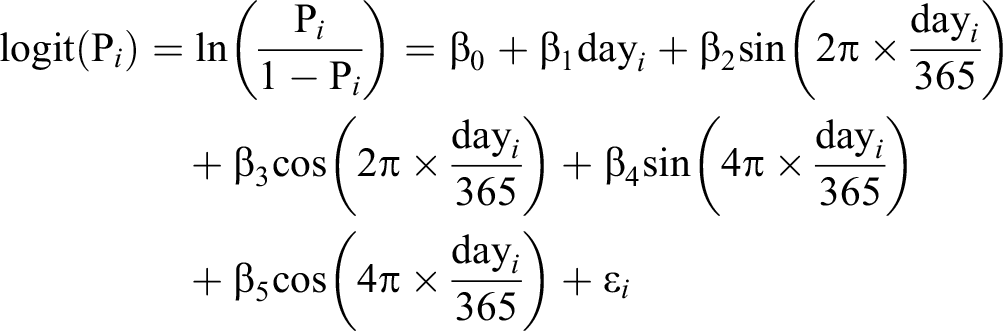
To detect the primary and secondary peaks of wasting in the sample, we created predicted daily values for WHZ, wasting, and severe wasting. Using the predicted values for each model, we identified the inflection points (where the sign changes) by subtracting out the summation of the harmonic terms at time day t from time day t +1 for each day between May 1, 2018, and March 31, 2020. Throughout the article, relationships are described as significant if the P value is less than .05.
Results
The imputation of missing data did not affect the mean, standard deviation, skewness, and kurtosis of the original data set and thus we were confident in using data set 3 with the imputed values for all of our analysis (Table 1). All 4 of the models used in the analysis of intra-year variability (models 1, 2, 3, and 4) indicate the presence of 2 peaks of wasting and severe wasting within a year, with the harmonic terms significant in 2 of the 4 models for wasting (models 3 and 4) and 3 of the 4 models for severe wasting (Model 1, 2, and 3) (Table 2). For WHZ, seasonality is significantly present in all 4 models but unlike with wasting, only one peak is identified. In model 5, 6, and 7, higher temperature is associated with significantly higher odds of a child being wasted, severely wasted, and lower WHZ, with each additional degree Celsius increasing the odds that a child is wasted by 5% (CI: 1.4, 8.7), severely wasted by 12% (CI: 3.0, 20.3), and a drop in 0.01 (CI: 0.009, 0.018) standard deviations in WHZ. Higher rainfall and higher NDVI are both associated with a drop in WHZ only.
Summary Statistics of Weight and Height by Data Set and Weigh for Height Z-Score, % Children Wasted, % Children Severely Wasted, Age of Children, and % of Children Who Were Female Given the Final Data Set Weight and Height Data in Sila Region, Chad: sample Size, Mean, Standard Deviation, Skewness, and Kurtosis.a
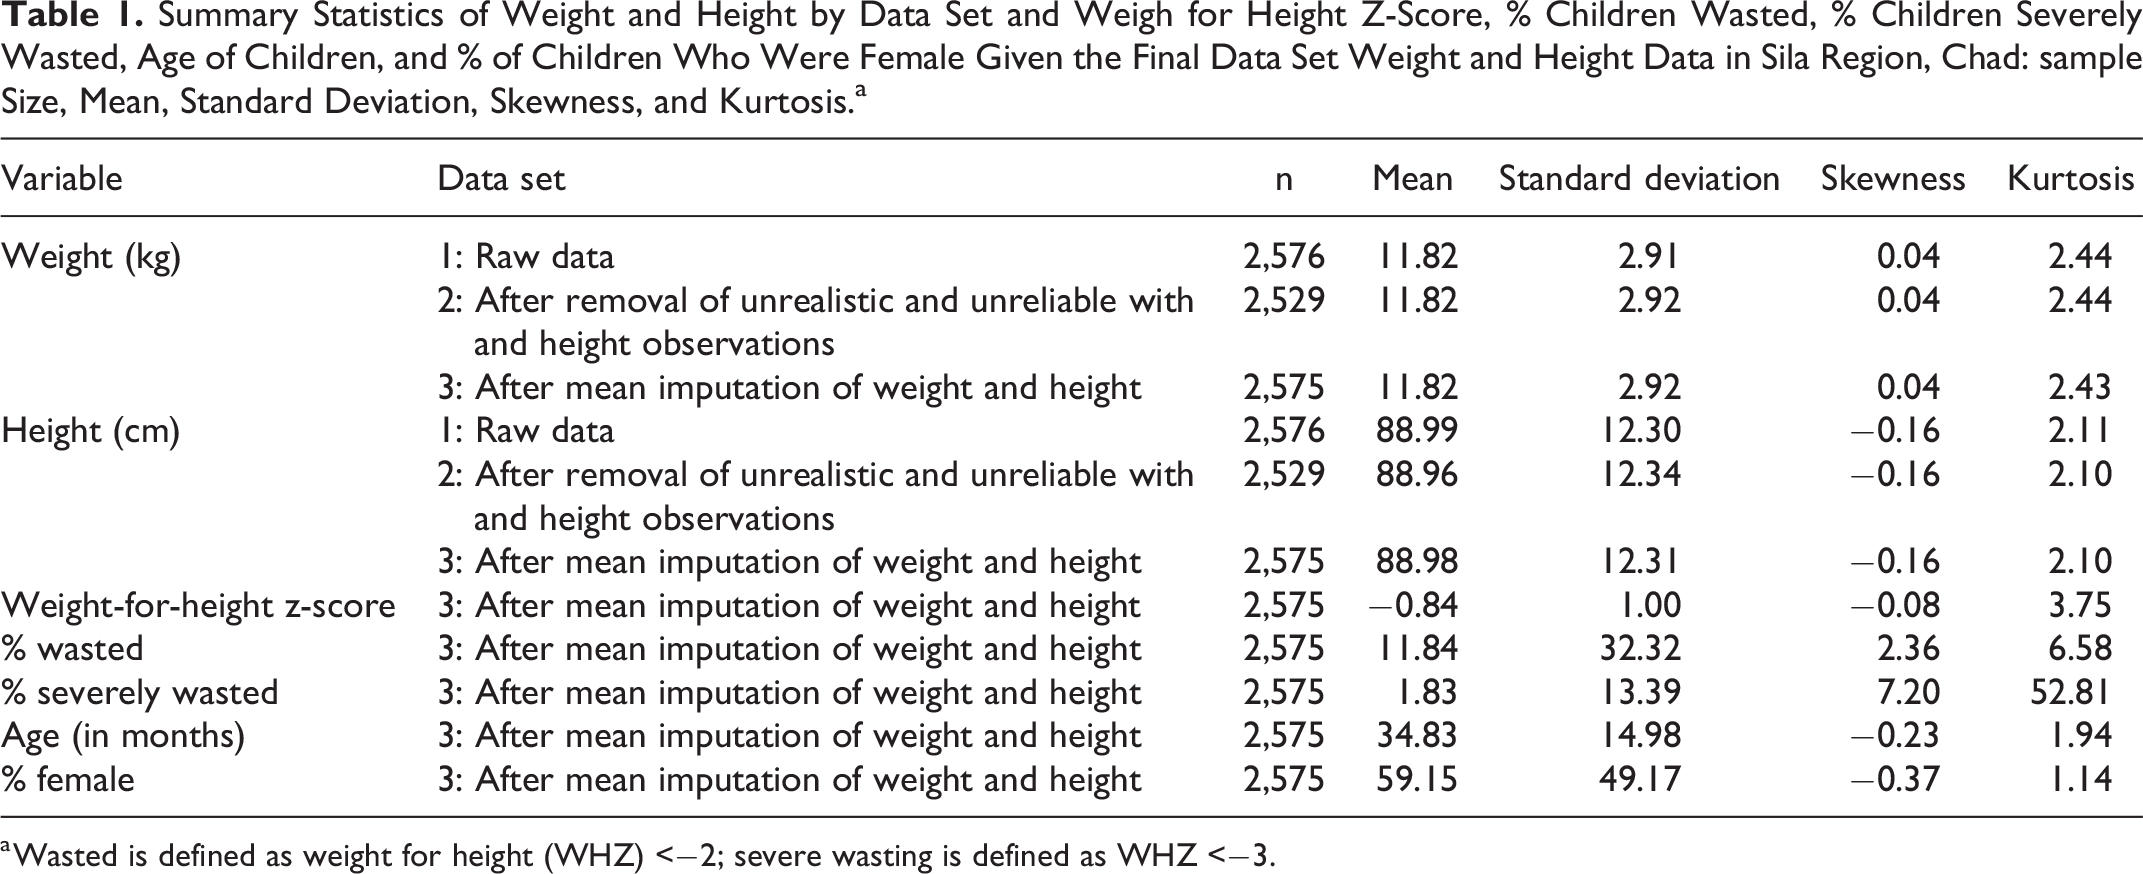
a Wasted is defined as weight for height (WHZ) <−2; severe wasting is defined as WHZ <−3.
Primary Regression Coefficient, P Value, and 95% Confidence Interval (CI) for Wasting, Severe Wasting, Weight-for-Height Z-Score (WHZ) Across Different Models: Without Time Trend, With Time-Trend, Mixed Effects, Mixed Effects Controlling for Age and Sex, Mixed Effects With Rainfall, Mixed Effects With Temperature, and Mixed Effects With Normalized Vegetation Index (NDVI).a,b
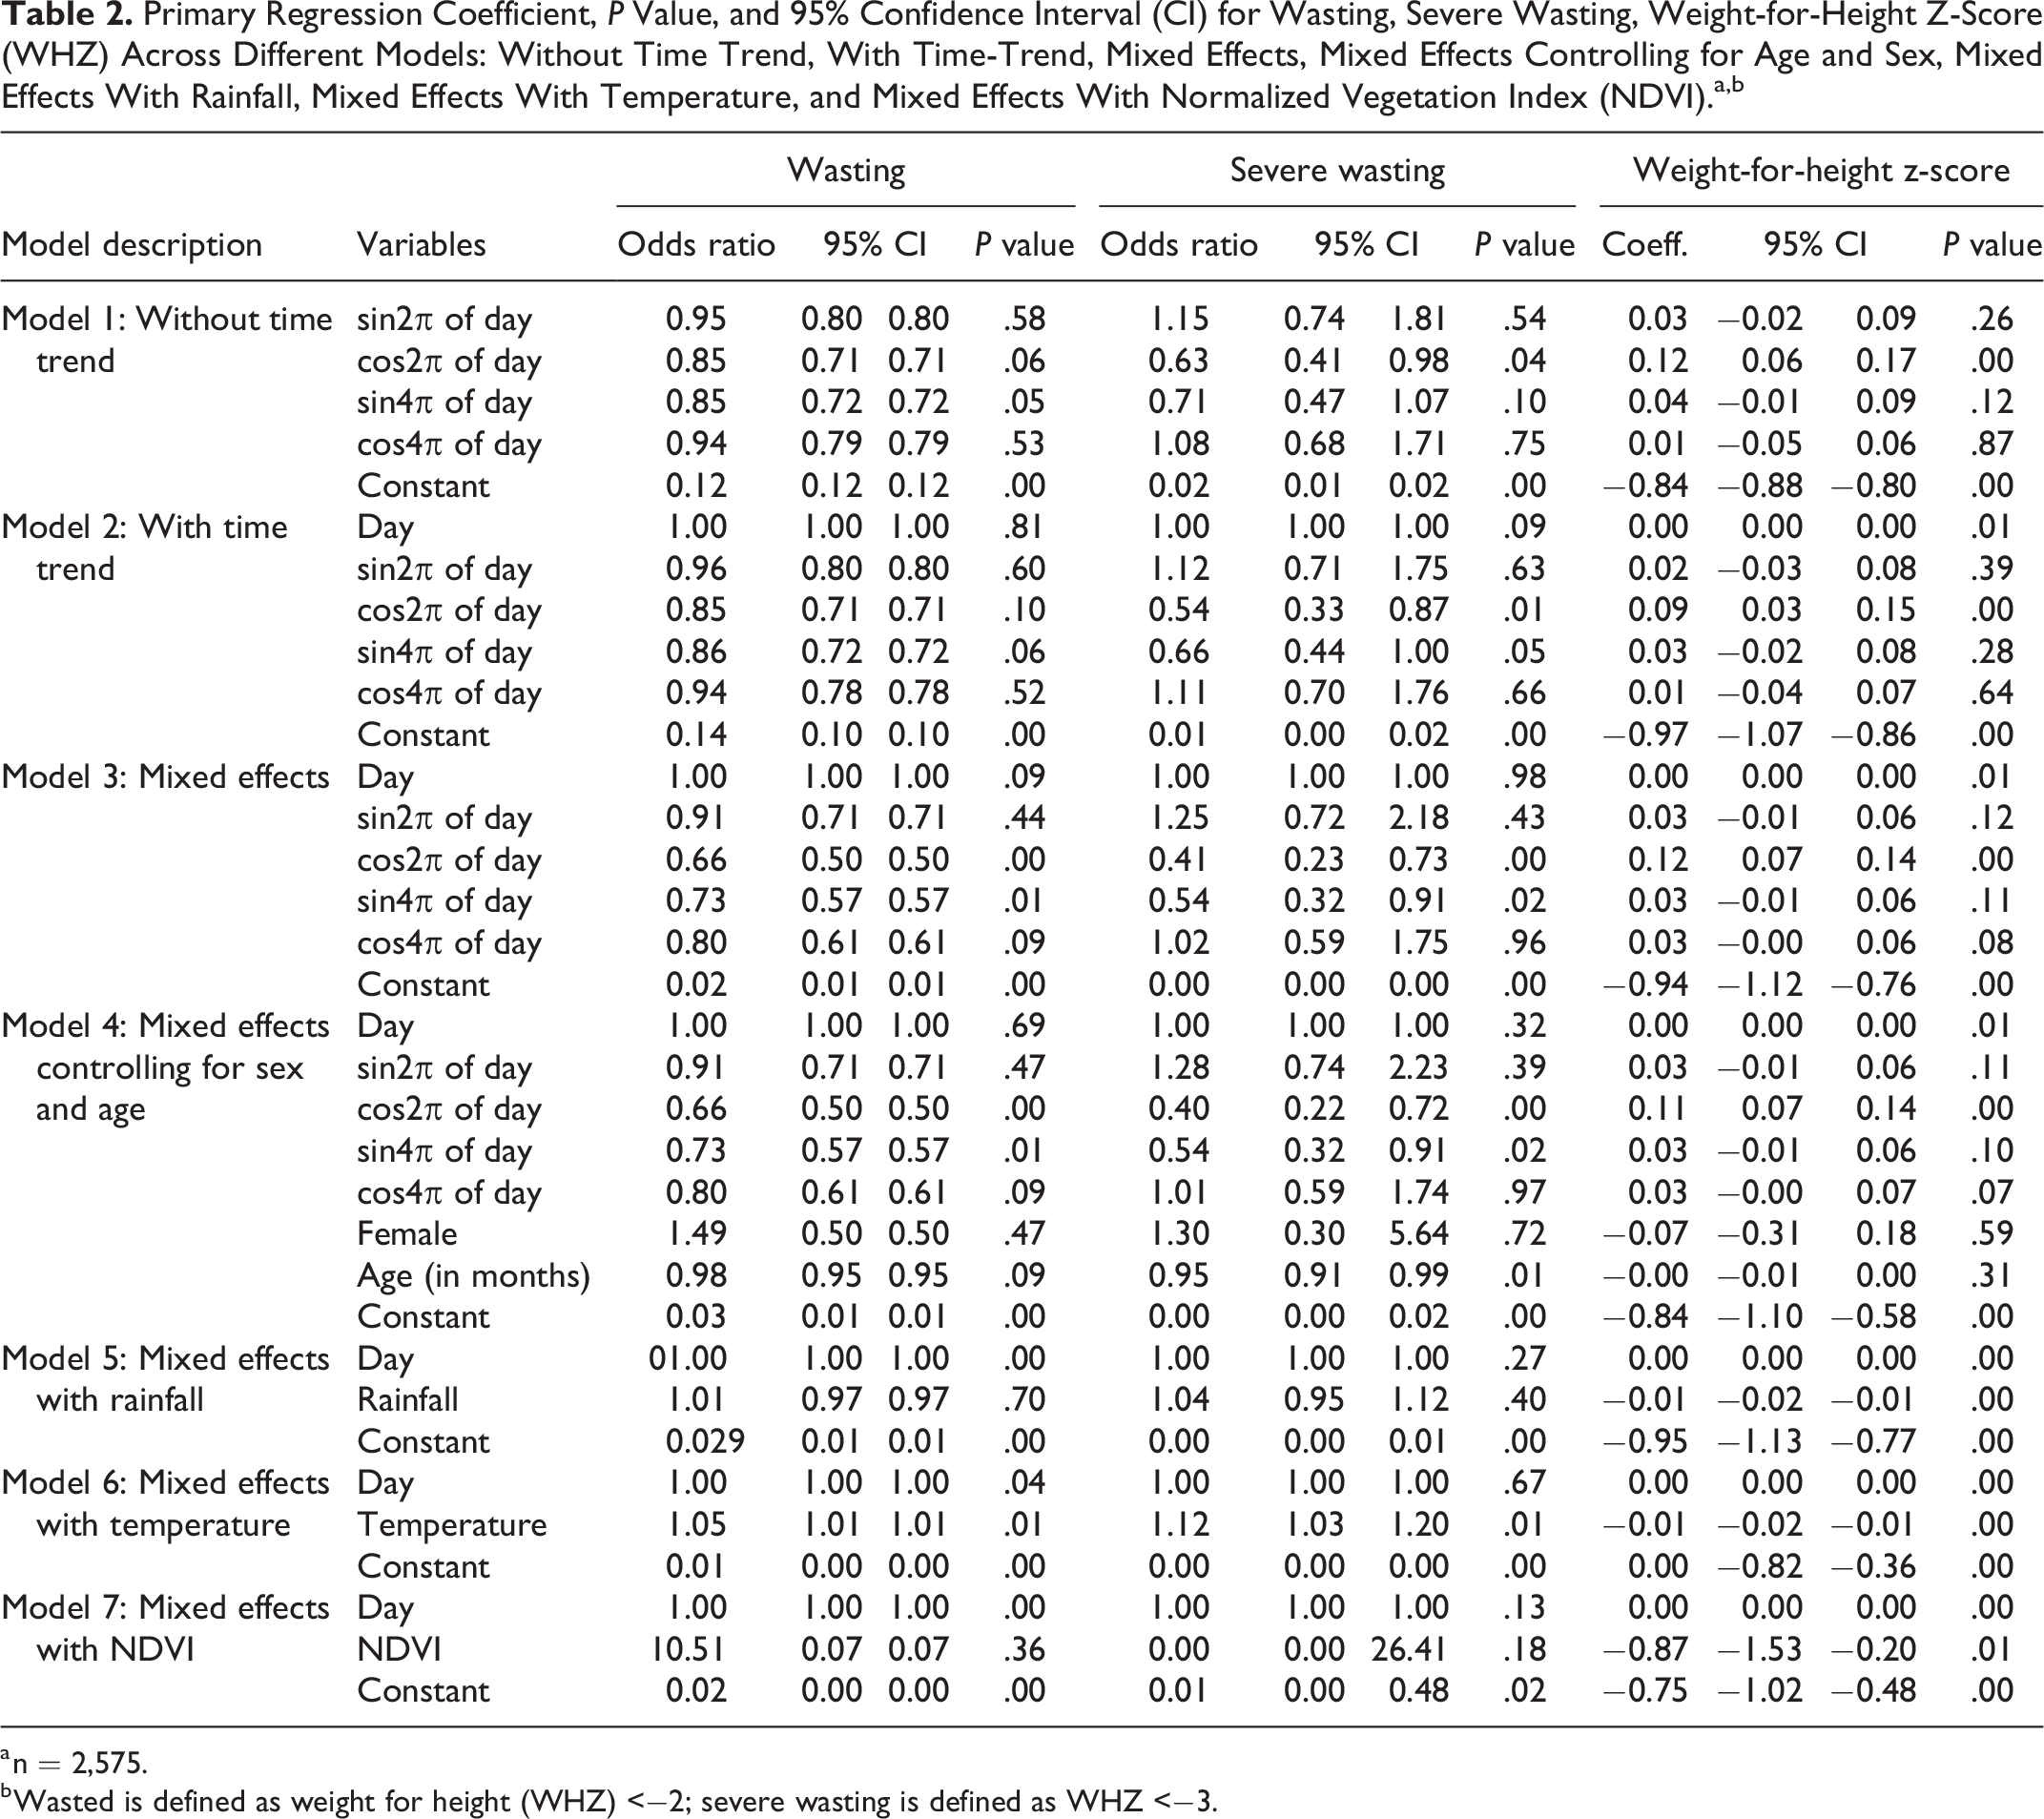
a n = 2,575.
b Wasted is defined as weight for height (WHZ) <−2; severe wasting is defined as WHZ <−3.
Models 1 to 4 on all 3 outcomes indicate that the primary, or largest, peak occurs sometime in the second half of May, while the lowest prevalence is around the end of January (Table 3). There is a secondary or smaller peak that happens around October/November and a clear reduction in wasting between the May/June and October/November peak. While each model identified a slightly different primary and secondary minimum and maximum of wasting prevalence, the difference between the model predictions is never more than a couple of days. There is good agreement between WHZ and wasting when it comes to identifying January/February as the period with the best nutritional status and May/June with the worst status.
Predicted Timing of Primary and Secondary Seasonal Peaks and Nadirs for Wasting, Severe Wasting, Weight-for-Height z-Score by Model: Without Time Trend, With Time Trend, Mixed Effects, and Mixed Effects Controlling for Age and Sex.a,b
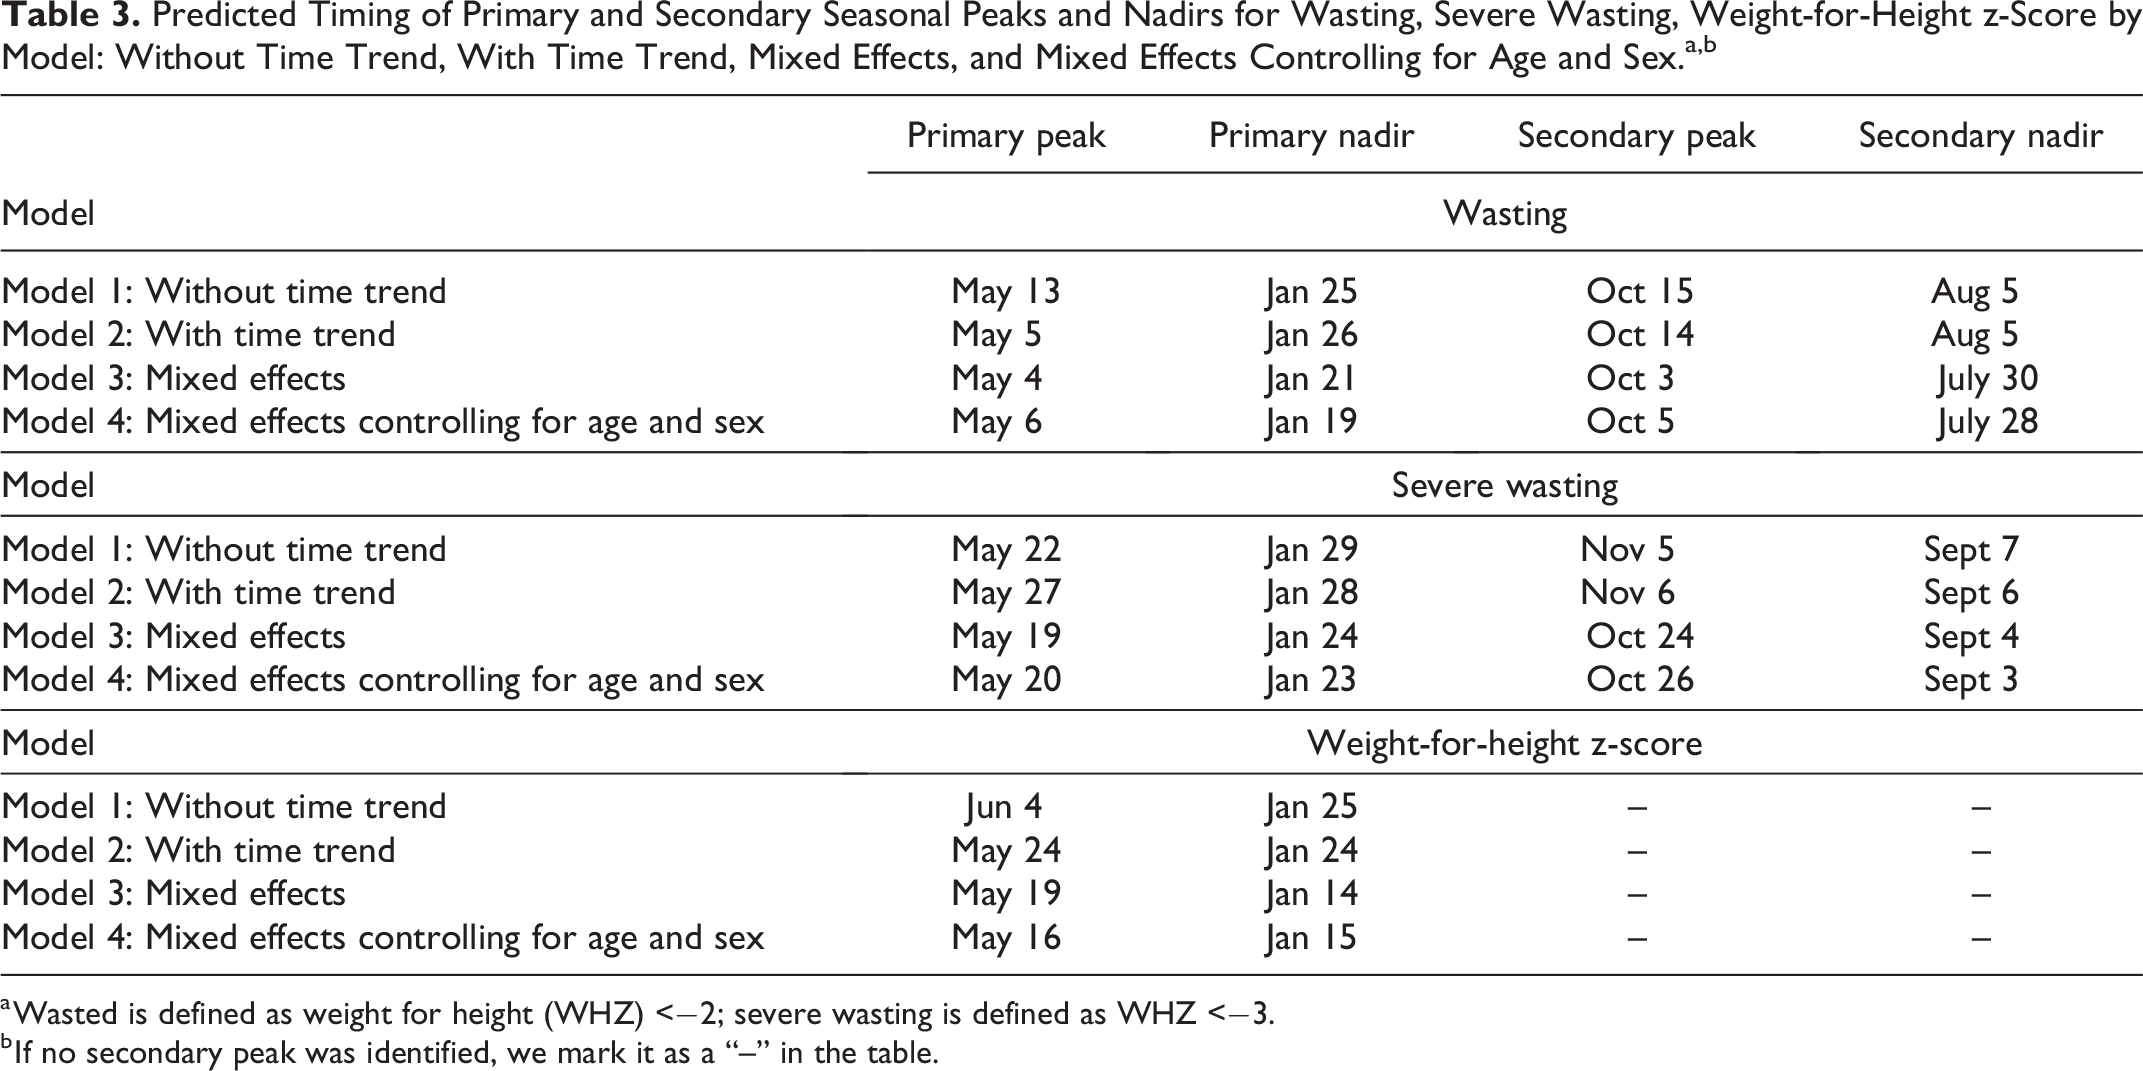
a Wasted is defined as weight for height (WHZ) <−2; severe wasting is defined as WHZ <−3.
b If no secondary peak was identified, we mark it as a “–” in the table.
The final seasonal prediction can be observed in Figure 1 illustrating the twin peaks of wasting (panel a) in relation to rainfall (panel c) and temperature and NDVI (panel b). Overall, there is a slight decline in the prevalence of wasting across the 2 years. However, what comes out clearly is the presence of 2 peaks in 2018 and 2019, followed by an expected increase in wasting prevalence in March of 2020. Specifically in the first year of data collection, wasting and severe wasting prevalence in May was 14.74% (CI, 11.82-18.24) and 2.80% (CI, 2.30-3.41), respectively. Particularly important is the improvement in wasting observed between the May and October peak corresponding to the rainy season with wasting and severe wasting dropping to 11.79% (CI, 9.38-14.70) and 0.97% (CI, 0.79-1.18), respectively. The drop is followed by a secondary peak with wasting increasing to 13.39% (CI, 10.70-16.63) and severe wasting to 1.24% (CI, 0.95-1.49). The lowest prevalence of wasting and severe wasting occurs in January at 8.81% (CI, 6.97-11.08) and 0.68% (CI, 0.56-0.83). Similar to wasting, temperature exhibits 2 clear peaks that correspond almost perfectly to the timing of wasting and as discussed above is significantly associated with the increase in the odds of a child being wasted and severely wasted.
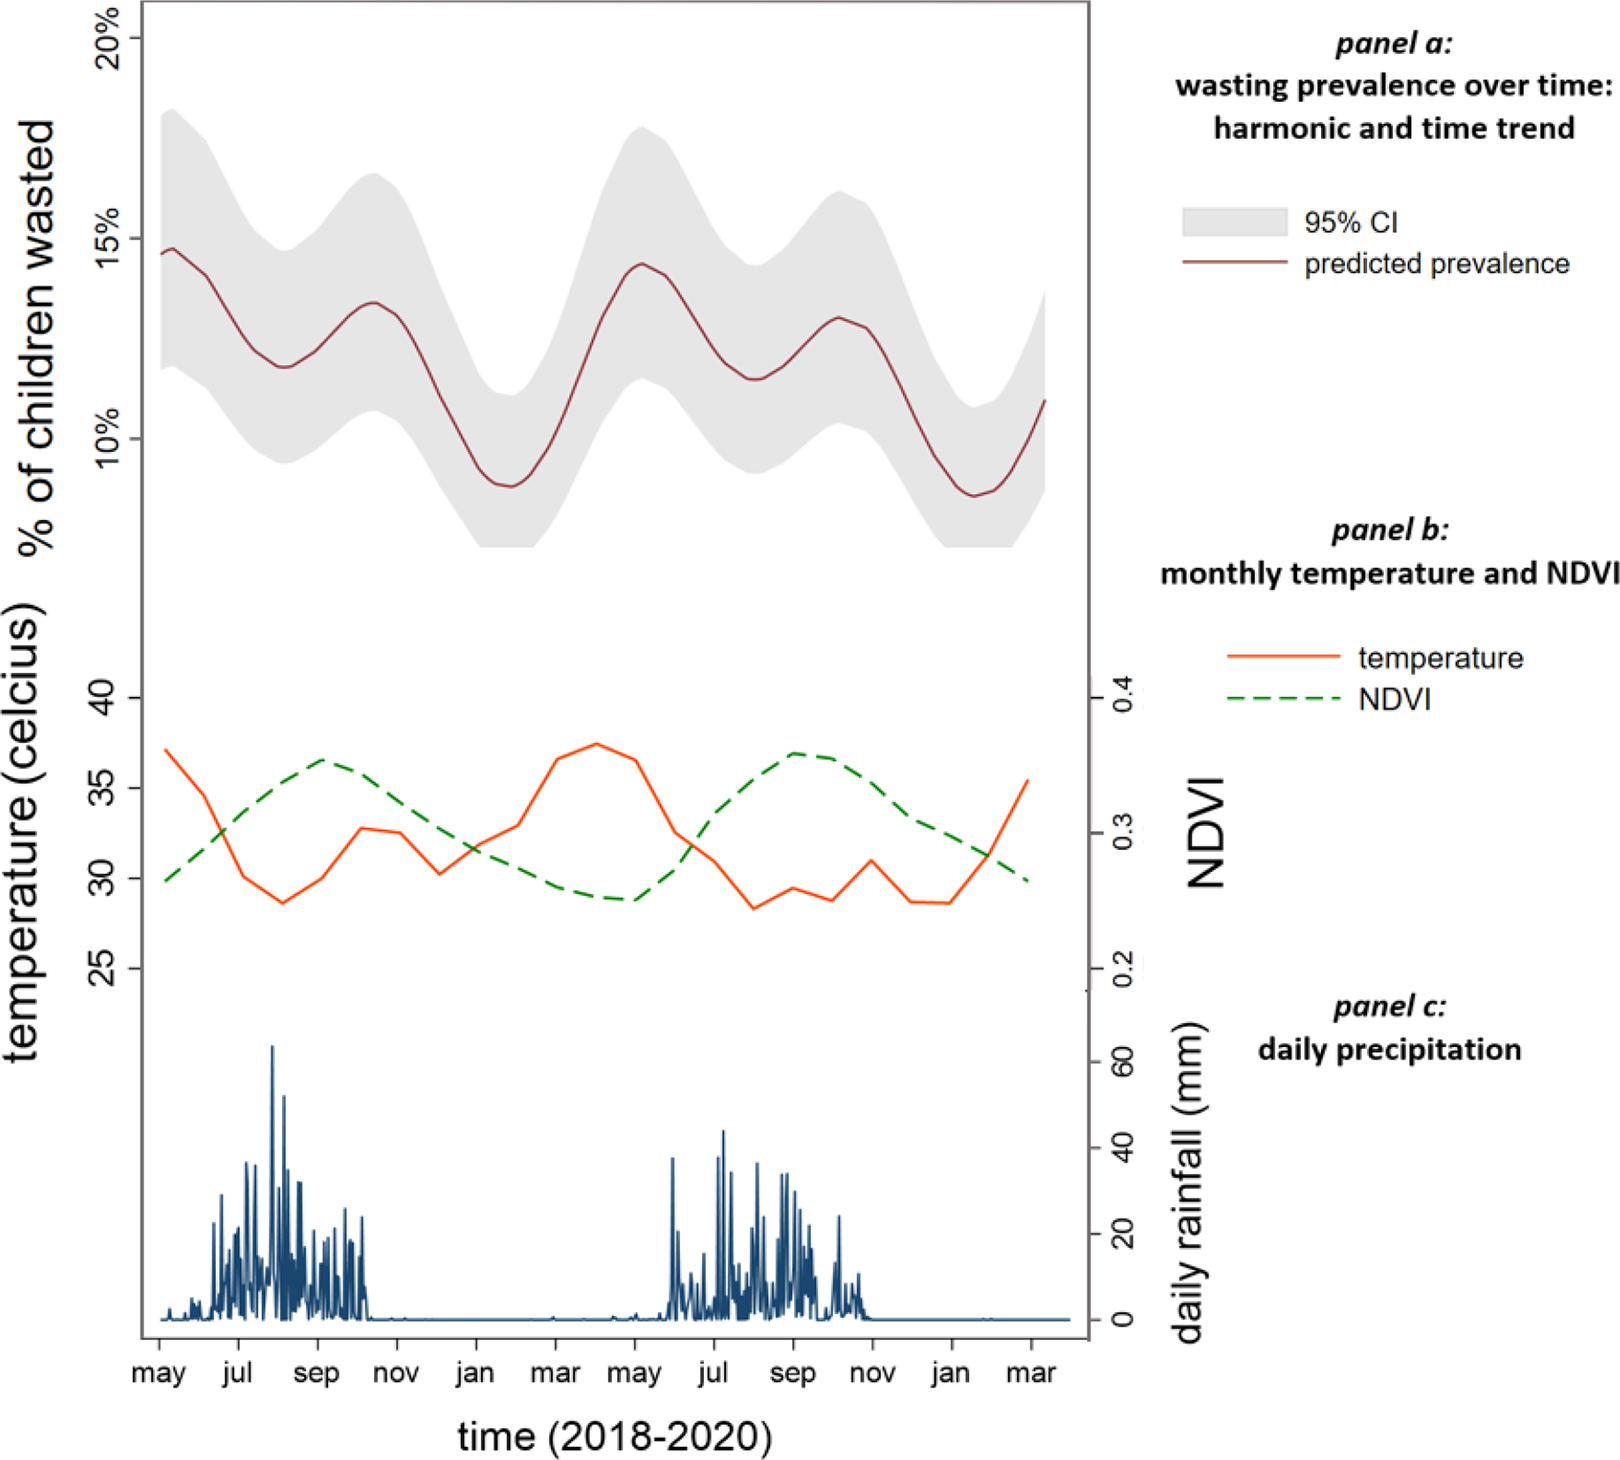
Predicted wasting prevalence according to regression results with time trend (model 2, panel a), monthly temperature and normalized vegetation index (NDVI; panel b), and daily rainfall for May 2018 to March 2020. Note: Wasted is defined as weight for height (WHZ) <−2.
Discussion
The analysis identifies 2 annual peaks of wasting among children aged 6 to 59 months in eastern Chad. The primary peak occurs around mid-May; but more important than the calendar month is that peak timing of wasting corresponds with high temperatures, the first appearance of rain after a 6-month dry spell, and little-to-no vegetation. The secondary peak in October corresponds with the end of the rains, a second peak in temperature, and high vegetation. The significant relationship between wasting and temperature is captured in model 6. A recent study of seasonality in Chad, Sudan, and South Sudan using secondary Standardized Monitoring and Assessment of Relief and Transition (SMART) nutrition data identified a similar seasonal pattern in wasting outcomes across all 3 countries indicating that the findings from Chad might be generalizable to unimodal drylands more broadly. 6
The findings from this study call into question the predominance of the food-first assumption in driving nutrition program content, timing, and targeting. 8 The presence of 2 wasting peaks raises the possibility of different drivers during different seasons. The post-rainy season peak could be related to food security (shrinking grain reserves, high market prices, increase farm labor demand, etc), while the May peak could indicate a larger role for infectious disease and potentially water contamination as a key driver. 12,46 -48 Previous analysis from the same population in eastern Chad has indicated a potential key role of children consuming water contaminated by livestock feces leading to worse nutritional status. 42,49 The end of the dry season corresponds to large cattle and camel migration in the area as part of their yearly journey in search of pasture and water. The use of seasonal data could be an effective means of lining up the seasonality of wasting and WHZ against the seasonality of a range of drivers to get a clearer picture of what conditions might be associated with malnutrition at different time periods and what programs to implement and when to prevent children from losing weight.
Incorrect assumptions about peak timing of wasting could lessen programmatic impact and the ability to measure it. A clearer understanding of the drivers of wasting among which populations at what time period would improve the design and targeting for both nutrition-sensitive and specific interventions. For example, an impact evaluation in Niger found that a cash transfer and supplementary feeding increased food insecurity but had no impact on wasting, with the authors hypothesizing that wasting was driven more by increased fever and malaria as opposed to food insecurity. 16 A clearer understanding of peak timing of wasting and its drivers would lead to programs that are more targeted, context specific, and hence effective. In addition, we could be under- or over-estimating the impact of certain programs if we do not measure that impact at the correct time. In the broader sense, an incorrect or limited understanding of seasonality also means it is difficult for us to assess progress toward the SDG wasting targets. 4 In India, research found that a slight differential in timing of data collection of India’s National Family’s Health Surveys between 2005 and 2015 explains the observed increase in wasting prevalence over the past decade. 50 On a more positive note, seasonal patterns in wasting in eastern Chad in 2018 and 2019 indicate that wasting can drop to around 8% in January/February, almost reaching the SDG goal for 2025.
The majority of existing studies on the seasonality of malnutrition compare nutritional status across 2 or 3 time periods in the year. 9 A lot of information can be lost or missed completely in the aggregation of seasonal data, 51 especially if the critical period for peak wasting is likely to be short. 41 For example, if we were to aggregate our data to the rainy vs. dry season, where in that categorization would our May peak fall, as it lies right at the start of the rains? Depending on the analysis or definition used for “rainy” season, the start of the rains could easily fall into either category. Local perspectives and seasonal definitions that value indigenous knowledge using participatory methods are critical in this respect. Communities distinguish between multiple seasons that are extremely useful for the anticipation and description of environmental changes and human activities. 41,52 For example, communities in Chad and Sudan identified an extremely short but important season—Rushash or the start of the light rains—as a period of extreme vulnerability 6,53,54 corresponding to our May peak.
We can also draw out some important methodological considerations for future studies and for monitoring and evaluation. The analysis illustrates the value of using the day of data collection for predicting peak timing. Given that the majority of data collection occurs on digital devices that automatically record the precise time and day of data collection, most studies should be able to do day-level analysis even when the interval for data collection is monthly, quarterly, and so on. Imputation of missing data can also improve the integrity of the dataset, without changing the general distribution or characteristics of the data. Importantly, our analysis specifically tests for the possible presence of 2 peaks of wasting with the inclusion of the cos(4π) and sin(4π) terms. The exclusion of these terms in a harmonic regression means that even if 2 peaks are present, the model can only identify 1 peak. 26,27 The danger of this exclusion is that assumptions are imposed on the model, limiting our understanding of a more complicated seasonal pattern in wasting. Thus, future studies need to invest in frequent panel data collection to better understand local seasonal patterns in wasting, utilize the most precise time data they have, prioritize sex and age disaggregation in their study design given the possibility of different seasonal patterns and drivers for girls versus boys and children in different age groups, 55 and check for multiple peaks.
A diverse array of different rainfall regimes, livelihood systems, diseases, and confluence of other drivers is responsible for a mosaic of different seasonal patterns in wasting. Evaluating the seasonal trends of wasting or progress toward a reduction in wasting in line with the SDGs requires a robust, context-specific, participatory, and spatially and temporally accurate representation of the inter-year variability in wasting and WHZ, and their drivers. An evidence-based, rather than assumption-based, understanding of seasonality needs to be incorporated across every aspect of nutrition policy and programming, from the timing and content of the interventions to how and when we evaluate them.
It is worth noting that there are several limitations to our study and analysis. Seasonal patterns in nutritional status and their drivers likely vary by age groups, 18,24 sex, 27,53 and livelihoods. 55 In terms of the latter, our study included a mix of livelihoods, and a direct comparison of seasonal peaks in western Chad between sedentary and nomadic groups indicates similar seasonal timing, 29 so that distinction is less of a concern. However, our study unfortunately has to aggregate across age groups and sex given the small sample size, though we do aim to control for these characteristics in model 4. Another important consideration is that the repeated interactions with the respondents and the collection of child’s weight and height could alter caretaker’s behavior (ie, if a child’s weight begins to drop the caretaker might take the child to a health center or prioritize feeding). Grellety et al find that nutrition status in sentinel sites, over time, tends to deviate from a random sample. 27 Most importantly, our study only covers 23 months and thus is a measure of the intra-year variability of wasting rather than an establishment of long-term seasonal patterns. Furthermore, seasonal patterns might not always be consistent across years and a different seasonal pattern could exist in famine years or under other extreme circumstances.
Footnotes
Acknowledgments
The authors thank Concern Worldwide for supporting this research and managing the on-the-ground fieldwork. Most importantly, the authors thank all the women and children in this study who for 23 months graciously allowed our intrusion into their lives and homes.
Declaration of Conflicting Interests
The author(s) declared no potential conflicts of interest with respect to the research, authorship, and/or publication of this article.
Funding
The author(s) disclosed receipt of the following financial support for the research, authorship, and/or publication of this article: This study was funded by Irish Aid.