
Abstract
Jurisdictions need estimates of bicycle activity levels for road safety and infrastructure planning studies. When counts are not available, direct-demand (DD) models can be used to estimate bicycle activity (often as annual average daily bicycle [AADB] counts) as a function of demographic and network data. However, not all jurisdictions have sufficient count data or resources to develop their own DD model and would benefit from applying a DD model developed in another jurisdiction. However, there is little prior evidence of the spatial transferability performance of DD models or of the factors that affect spatial transferability performance. This paper addresses this gap. The spatial transferability of five DD models from the literature was evaluated across four target jurisdictions: the City of Toronto, the City of Milton, and the Region of Waterloo in Canada, and Pima County, AZ, USA. True AADB data from continuous counts were available for all four target jurisdictions. Spatial transferability was quantified using four metrics. Results demonstrated generally poor spatial transferability, with root mean squared errors (RMSE) up to 600 times higher than those reported in the original model development data sets. Moreover, analysis showed only moderate correlation between model accuracy and the similarity of the target and development jurisdictions (both for average levels of cycling activity and site and network characteristics). These findings underscore a pressing need for enhanced methods to improve the spatial transferability of DD models for estimating bicycle counts.
Keywords
Vulnerable road users (VRUs), including pedestrians, cyclists, and motorcyclists, account for more than half of all road traffic deaths, according to the World Health Organization (WHO) road traffic injuries report ( 1 ). In Canada alone, in 2021, 32% of collision fatalities involved VRUs, with pedestrians accounting for 16%, motorcyclists 13%, and cyclists 3% ( 2 ). In addition, bicycle ridership has increased in North America in the past few decades as one of the major sustainable transportation modes ( 3 ). For instance, census data from metropolitan areas in Canada show that the number of people commuting to work between 1996 and 2016 increased from 8.6 million to 11.7 million (a 35.9% increase), while the number of those who used a bicycle to commute increased by 87.9% ( 4 ). Similarly, there was a 1.9% increase in cyclist fatalities (from 948 to 966) from 2020 to 2021, accounting for 2.2% of all traffic fatalities in the United States ( 5 ). These statistics point to VRUs, including cyclists, suffering injuries and fatalities as a result of collisions at much higher rates than automobile vehicle occupants and provide the motivation for jurisdictions to develop and implement designs and interventions with a focus on improving VRU safety.
Prioritizing network locations for safety improvements for cyclists and developing appropriate intervention strategies or infrastructure requirements require knowledge of bicycle counts. There are two common conventional methods for collecting bicycle counts, which have been borrowed from vehicle and pedestrian data collection ( 3 , 6–8): one involves deploying equipment in the field to collect continuous counts (CCs), while the other entails collecting short-term counts (STCs) in which counts are collected over a period of time from several hours to several days depending on the purpose of the study and the resources available. Exposure is typically expressed in the annual average daily bicycle (AADB) counts. With CCs, AADB counts can be directly computed when a full year of data are available. When only STCs are available for a site, but CCs are available from other sites in the same jurisdiction, then AADB counts can be estimated by using factoring methods. However, STCs may not always be available, and there are many questions about how many STCs are required and where they should be collected. Studies have explored different methodologies for improving AADB estimation errors and accuracy by optimizing the conditions and number of STCs ( 9 – 11 ).
One alternative when bicycle counts (either STCs or CCs) are unavailable for a site is to estimate exposure using a DD model, which is a statistical model that relates explanatory variables such as socioeconomic, land-use, and network characteristics in the local vicinity of the site of interest to the AADB count (the dependent variable). The challenge for many jurisdictions is that they do not have the resources, expertise, or data (including known AADB for many sites) to develop a DD model for their local jurisdiction. An attractive alternative is for the local jurisdiction to apply a DD model that was developed by another jurisdiction. This avoids the need to develop their own DD model but does raise the question of the spatial transferability of these DD models. In this paper, spatial transferability refers to using existing DD models developed in one jurisdiction and applying them to another, referred to as the target jurisdiction. The purpose of this paper is to address this question. Specifically, this paper has three objectives:
Conduct a review of the literature and identify the set of DD models that have been proposed for estimating AADB counts.
Assess the set of DD models to identify a short-list of models that would be suitable for the estimation of AADB counts by most jurisdictions.
Quantitively evaluate the spatial transferability of the short-listed models by applying the models to sites in four different jurisdictions for which the true AADB count is known from CCs.
The remainder of this paper is organized as follows: the next section provides a review of literature on DD models for estimating bicycle counts in the form of AADB. This is followed by the methodology section, which describes the selection criteria for shortlisting DD models for evaluation of spatial transferability. The data sets used to evaluate the spatial transferability are described, followed by the spatial transferability results and discussion section. Finally, the conclusion and recommendations are provided.
Literature Review
The goal of this paper is to quantitatively evaluate the spatial transferability of existing DD models that estimate bicycle counts, preferably as AADB. Above we described three general approaches to estimating bicycle counts, namely: 1) directly calculating exposure from continuous counts; 2) estimating exposure from STCs using expansion factors obtained from continuous counts; and 3) directly estimating exposure based on the socioeconomic, network, and land-use characteristics in the local vicinity of the site (using a previously developed DD model). Recently there have been hybrid methods proposed that estimate bicycle counts from socioeconomic, network, and land-use characteristics (similar to DD models), but also include a short-term count alternative (typically from crowdsourced data sources such as mobile phone apps such as Strava and bike share data) as an explanatory variable ( 12 – 15 ). Studies have shown the potential to improve the accuracy of bicycle count estimates using these crowdsourced data, however, there remain several key challenges, including bias (the cyclists using these apps/systems do not provide a representative sample of the population of cyclists), sampling rates that are unknown and vary across time and location, the presence of multiple crowdsourcing platforms, and the challenges for jurisdictions to acquire access to available data from these different platforms as a standard procedure ( 14 ) as well as biases associated with under-representation of these data sets, for example, different age groups and ridership trends at different times of the year ( 16 ). Consequently, within the context of this study, models that require STCs or alternative STCs (from crowdsourcing or otherwise) as input are not considered DD models.
A review of the literature was carried out to identify DD models for estimating bicycle counts. These DD models can be categorized as either statistical regression models (e.g., ordinary least squared model, multiple linear regression models, and Poisson) ( 17 – 20 ), and machine learning approaches (e.g., random forest, K nearest neighbor, and extreme gradient boosting (XGBoost) ( 3 , 13 , 14 , 21 , 22 ).
The common regression modeling approaches include multiple linear regression (1), log-linear regression (2), and negative binomial regression (3) with functional forms as depicted below in Equations 1 to 3.


where
Different types of explanatory variables have been used in the development of these models, depending on their availability and the specific characteristics of the jurisdictions in which they were developed. Explanatory variables can be categorized as land-use characteristics, demographic factors, network characteristics, and others associated with original jurisdiction/site-specific characteristics. The most commonly used explanatory variables include demographics, such as mean income and employment numbers, as well as various types of land use within specific circular areas, such as the presence of schools, infrastructure types such as the number of metro stations or bus stops within certain areas, bike lanes and/or markings, and the number of street lanes leading to an intersection (17–20, 23 ). Additionally, some studies have incorporated more specific demographic characteristics such as population density, race, and age, as well as more detailed road infrastructure features such as average slope and road network connectivity, to estimate bicycle demand ( 20 , 23 ). Similarly, some studies used more site-specific variables, such as a bikeability index ( 23 ), centrality as a function of origin–destination pairs ( 24 ), using third-party information such as that provided by the League of American Cyclists ( 25 ). These types of explanatory variables may make the DD models less flexible for spatial transferability purposes.
The spatial transferability of DD models is, therefore, affected by 1) availability of values for the explanatory variables; and 2) the underlying relationships between the explanatory variables and trip making behavior by the bicycle mode (i.e., as captured in the function form of the DD model and the model coefficients). Only a few studies have attempted to address the issue of spatial transferability of DD models to estimate AADB counts.
The study by Munira et al. ( 23 ) attempted to develop a generic DD model for estimating AADB based on a variable called the bikeability index (which is derived from built-environment variables, such as high-comfort bicycle route length as a function of traffic speeds and volume, connectivity of bicycle-friendly streets, etc.), and demographic factors such as population, race, age, and education. However, the spatial transferability of this model is hindered by the need for explanatory variable values that are not commonly available (e.g., bikeability index). Furthermore, though the model is proposed to be spatially transferable, the study does not apply the model to one or more other jurisdictions to assess its estimation error, validate its applicability, and confirm its accuracy.
Wang et al. ( 26 ) examined the spatial transferability of two DD models (City of Minneapolis and City of Columbus) developed to estimate mixed mode counts on multiuse trail segments. The DD models were developed using a small number of continuous count sites (six and five for Minneapolis and Columbus, respectively) and a larger number of short-duration count sites (80 and 36 for Minneapolis and Columbus, respectively). The short-duration counts were extrapolated to AADT (annual average daily traffic) through the day of year factoring methods proposed by Hankey et al. ( 27 ). Wang et al. examined the spatial transferability of these models by conducting a cross-city validation, applying the Minneapolis model to Columbus and vice versa. They found that the spatially transferred models performed poorly with the average absolute error rate 1.7 times larger than the error rate for the model when applied to the development jurisdiction.
A more recent study ( 15 , 28 ) examined the effect of different data sources on the accuracy of DD models. The study developed DD models for six jurisdictions in the USA (Bend, Portland, and Eugene in Oregon; Bolder, Colorado; Charlotte, North Carolina; and Dallas, Texas). AADB was derived from a small number of continuous count sites and a larger number of short-duration count sites. Data were obtained across three years such that there was a total of 603 AADB counts across all the sites and years. Three categories of DD model were developed for each of the jurisdictions: 1) DD models considering only static explanatory variables (e.g., site characteristics); 2) DD models that used static variables plus crowdsourced data including both Strava Metro data (data obtained from a dedicated mobile phone app) and StreetLight data (data obtained from anonymized location based devices); and 3) DD models that included both static and crowdsourced variables. Though the focus of the study was on the improvement in accuracy obtained by combining static and crowdsourced data, they also examined the transferability of the three Oregon DD models. Specifically, they developed DD models for each of the three Oregon cities using 2019 data and then applied these models to the same cities, but mostly different locations within the city, and compared them with 2018 AADB counts. Consequently, their analysis considered both spatial and temporal transferability combined—but the spatial transferability was to different sites in the same jurisdiction—not to a different jurisdiction. They found that the DD models that used only static variables had AADB errors that were 1.6, 1.1, and 1.0 times the 2019 errors for Portland, Eugene, and Bend, respectively. As indicated, the spatial and temporal transferability resulted in a significant increase in the model estimation error for the City of Portland, but not for the Cities of Eugene or Bend.
Miah et al. ( 29 ) examined the influence of including STCs or Strava Metro count data as explanatory variables in DD models (classification and regression tree models) for estimating AADB on road segments. The study used data from 12 continuous count stations and 73 short-term count locations in Portland, Oregon from the years 2017 and 2019. Short-term counts were expanded using factoring methods to estimate AADB. As part of this study, the authors examined the temporal transferability of the DD models by developing models from 2017 data and then forecasting 2019 counts and by developing models from 2019 data and backcasting 2017 counts. Their forecasting temporal transferability results indicate an average increase in estimation errors of 20%. They did not explicitly examine spatial transferability but did note that developing models on the basis of STCs collected specifically for the purposes of supporting the development of a bicycle count model may bias the application of the model to the broader network because the STCs are typically taken at locations with medium to high bicycling activity and no sites with low bicycling activity.
The spatial transferability of DD models for estimating pedestrian volumes was examined by applying six DD models reported in the literature to signalized intersection sites in three urban jurisdictions for which pedestrian volumes were known ( 6 ). Estimation error was quantified as the mean absolute error between the DD model estimate and the observed annual average daily pedestrian traffic (AADPT) divided by the mean AADPT. The study showed that the accuracy of the DD model predictions varied widely across the different jurisdictions with the error metric varying from a low of 0.52 to more than 50 depending on the DD model and the jurisdiction to which it was applied. The best accuracies were observed for the cases in which the characteristics of the application jurisdiction were similar to the original jurisdiction on which the DD model was developed.
In summary, few prior studies have examined spatial transferability of DD models for estimating bicycle counts (AADB). Those that have been conducted indicate varying results, with spatially transferred models providing errors that are 1.0 to 1.7 times the error when the model is applied to the development jurisdiction. However, these prior studies are limited by one or more of the following:
They have relied on expanding short-duration counts to AADB using a small number of continuous count sites with the result that the estimates of the true AADB, against which the DD model’s accuracy is determined, contain errors.
The DD models estimate AADB for off-road multiuse paths and not roadway intersections, the focus of this paper.
The transferability assessment combines both temporal and spatial transferability, limiting the ability to disaggregate these effects.
The spatial transferability examined applying a DD model to different sites within the same development jurisdiction rather than to a different jurisdiction.
Only a small number of DD models were evaluated on a single target jurisdiction.
The DD models were developed using STCs collected for the purpose of developing a bicycle count estimation model and consequently locations with low bicycle activity may have been under-represented, which may adversely affect the spatial transferability of the models and bias the evaluation of the model performance.
In view of these limitations, this paper presents an assessment of the spatial transferability of five DD models identified from the literature on four target jurisdictions for which continuous counts are available for a full year for a combined 182 signalized intersections. The continuous counts are obtained from a camera-based traffic monitoring system permanently deployed at each site.
The next section describes the criteria used to identify candidate DD models from the literature and those models.
Direct-Demand Models Selected for Assessment
Selection Criteria for Applying Direct-Demand Models
The following selection criteria were used to identify DD models suitable for assessing the spatial transferability of AADB estimation:
Dependent variable: The models selected were either developed to directly estimate AADB or estimated average bike counts for a portion of the day, such as the p.m. peak hour, from which AADB could be estimated.
Explanatory variables: Values for the explanatory variables should be readily available to jurisdictions meaning they should be available from census data, land-use data, or road network data. Models containing variables based on travel patterns, such as general travel origin–destination data or bicycle trip trajectories, and count data (either STCs or crowdsourced data such as from Strava) were not considered.
Count locations: It was preferred to select models which were developed to estimate exposure at intersections or at least a combination of counts from road segments and intersections as opposed to models developed using data primarily from off-road trails.
Development data set: Only models developed on a reasonably large set of sites in either the United States or Canada and which reported reasonably good fit were considered.
Considering the aforementioned criteria, five DD models were selected for spatial transferability assessment. The following subsections describe each model in detail:
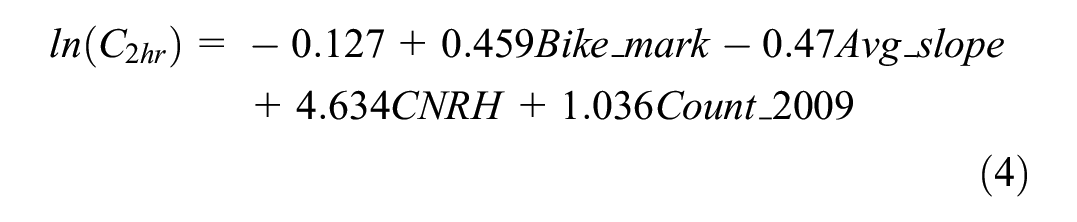
Griswold et al. ( 20 )
Two-hour bicycle counts (Equation 4)were used as the dependent variable in Alameda County, California, USA (81 intersections). Different demographic and land-use characteristics were examined to develop four DD models. Among those, the model in which all explanatory variables could be retrieved from our data sets was selected. There are three main explanatory variables related to network characteristics: 1) the connected node ratio which is calculated as the ratio of the number of three-leg and four-leg nodes within a circular buffer zone from the intersection of interest divided by the total number of nodes (including dead-ends) within the buffer area (a connected node ratio = 1 represents the most connected area without any dead-ends); 2) the average vertical grade; and 3) binary variable indicating the presence/absence of bike symbol markings. To extract the average slope for each jurisdiction, Google Earth Engine Data Catalog was used along with QGIS software ( 30 ).
In addition to these three network characteristic variables, this model includes a binary variable indicating whether the count was conducted in 2009 or not. This variable was found to be statistically significant and was considered to represent behavioral changes given the substantial variation in gasoline prices between the summer of 2008 and summer of 2009 (average gasoline prices in southern California were 50% higher in the summer of 2008 than in the summer of 2009 and 35% higher than the summer of 2007) when the bicycle counts were recorded. As stated by the authors, this variable was included to reflect the changes that the higher gasoline prices in 2009 may have had on mode choice and trip making behavior and therefore on the observed bicycle counts collected in 2009. For all applications of this model in this paper, this binary variable was set to zero. The reported model fit to the calibration data set of 2-h counts was adjusted
where
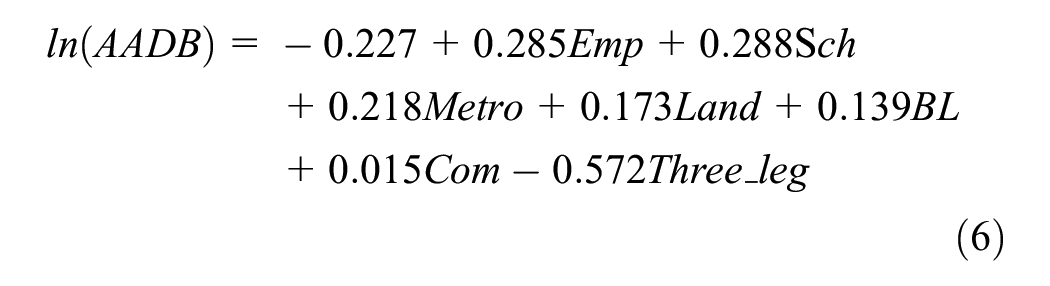
Strauss et al. ( 19 ) model
This Poisson regression model (Equation 6) was developed using data from 647 signalized intersections in Montreal, Canada. Short-term counts from these intersections were expanded to AADB using expansion factors. The dependent variable is AADB and the explanatory variables consisted of land-use characteristics, network characteristics such as the presence of a cycle track, three-leg versus four-leg intersections, and the number of metro stations, and demographics (in this case employment).
We note that the model intercept reported in the original paper (−0.227) results in unrealistically small estimated values of AADB. Communications with the model developers confirmed that the reported value of the constant is incorrect; the correct value should be between 5 and 6. A sensitivity analysis was conducted to select an intercept value within this range. The ratio of the mean absolute error (

where
The AADB count is then calculated as shown in Equation 6:
where
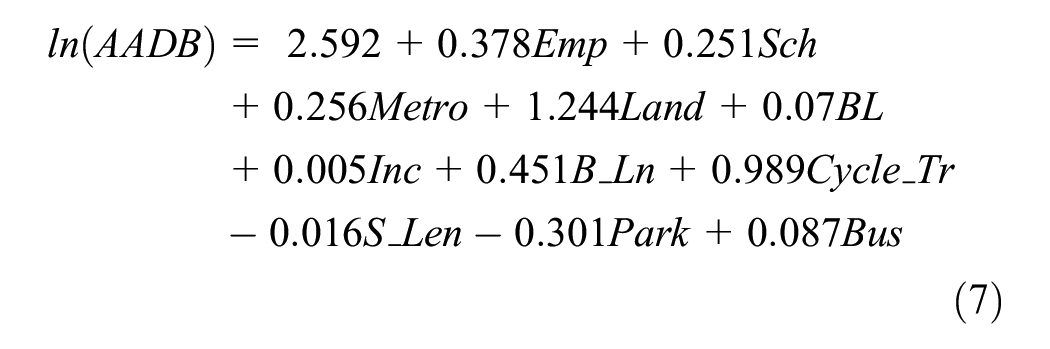
Strauss and Moreno ( 17 )
This model is similar to Equation 6 but was developed using data from 758 signalized intersections in Montreal, Canada. The authors report that the model provided an
where
Tabeshian and Kattan Models ( 18 )
Two models were developed to estimate the average bicycle counts during the p.m. peak hours (16:00 to 18:00) in the City of Calgary, CA, at 34 intersections. One was a multiple linear regression (MLR) (Equation 8), and the other was a Poisson model (Equation 9), with the latter yielding slightly lower estimation errors, using root mean square error
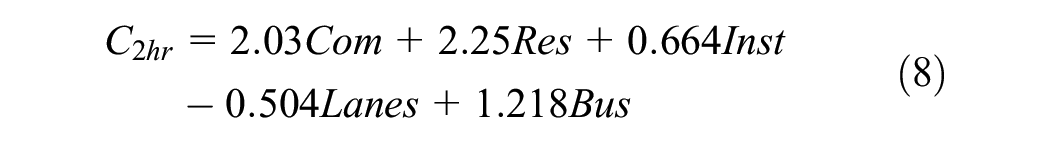
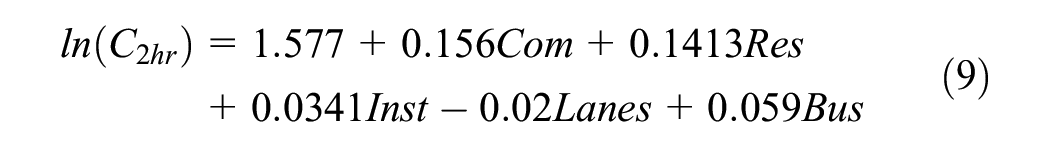
where
Bus = number of transit bus stops in a 402-m (0.25-mi) radius buffer.
The next section describes the methodology for assessing the spatial transferability of the five candidate DD models.
Quantifying DD Models Transferability
Model accuracy is typically quantified in the absolute errors (absolute difference between the model estimated AADB and the true AADB) and in the absolute error relative to the true AADB. However, selecting just one of these measures frequently produces results that are troublesome in practice. When the true AADB is quite small, then the relative error metric is often very large, even if the absolute error is small and of no practical significance for transportation engineering decision making. Similarly, when the true AADB is large, then even a small relative error corresponds to a large absolute error.
Four indicators were applied to quantify the accuracy of DD model applications: mean absolute error (


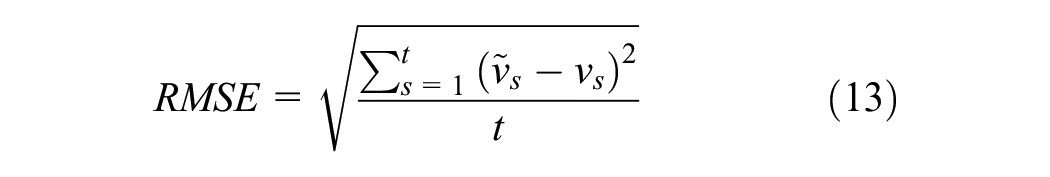
where
The
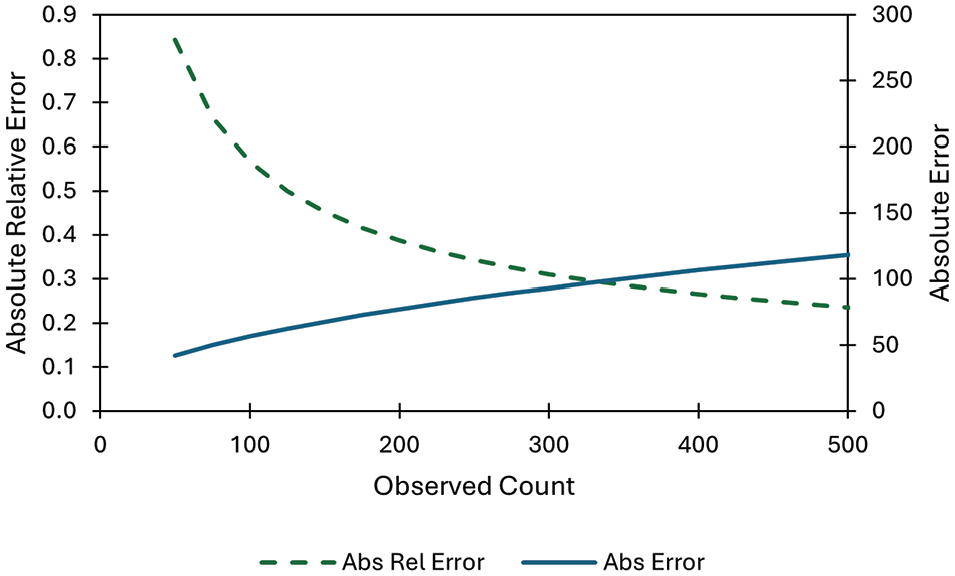
Absolute error and absolute relative error as a function of observed count for
Jurisdictions for Assessing Spatial Transferability
Data Description
Three jurisdictions from Ontario Canada (Region of Waterloo, City of Toronto, and City of Milton), and Pima County were selected for assessing the spatial transferability of the DD models. These jurisdictions are referred to as the target jurisdictions in contrast to the jurisdictions from which the data was obtained for the development of the DD models (which are termed the model development jurisdictions). All four target jurisdictions have a camera-based intersection data collection system from the same vendor which provides vehicle, pedestrian, and cyclist counts by turning movement and crossing each minute. These data were aggregated to provide daily (24-h) intersection counts for all days in the calendar year 2023. Only sites which had at least some observed level of bicycle activity (AADB ≥ 5) were considered in this study.
A data quality screening process with two filters was implemented to identify and exclude data for which data anomalies were evident. The first filter (Filter 1) identified sites at which the camera-based count system was installed on or before Jan. 1, 2023 and was still operational on or after Dec. 31, 2023. The second filter (Filter 2) identified sites at which the count system was not operational for extended periods of time during 2023. The count system only reports data when a count is made. Consequently, the database of counts does not distinguish between a period in which the system was not operating and a period for which there were no users traversing the intersection. In both situations, the database will not contain any counts for the time period. As a result, we assessed the functionality of the system by examining the vehicle counts rather than the bicycle counts, as there is a much lower likelihood that zero vehicles traverse an intersection during a 24-h period than zero cyclists. Valid days of data were determined as those for which vehicle counts were greater than zero (implying that the video monitoring equipment was functioning). Individual sites were screened and sites which had four or more consecutive invalid days of data were excluded from the analysis. The threshold of four consecutive days resulted in approximately 10% of sites passing Filter 1 being excluded from the analysis for failing Filter 2 (Table 1). Different threshold values were tested and the value of four consecutive days was selected as it correctly identified those sites for which there was a high degree of confidence that the data should be excluded. To illustrate, the time series of daily vehicle counts are shown in Figure 2 for two sites that did not pass Filter 2. These sites were excluded from the analysis.
Descriptive Statistics for Target Jurisdictions
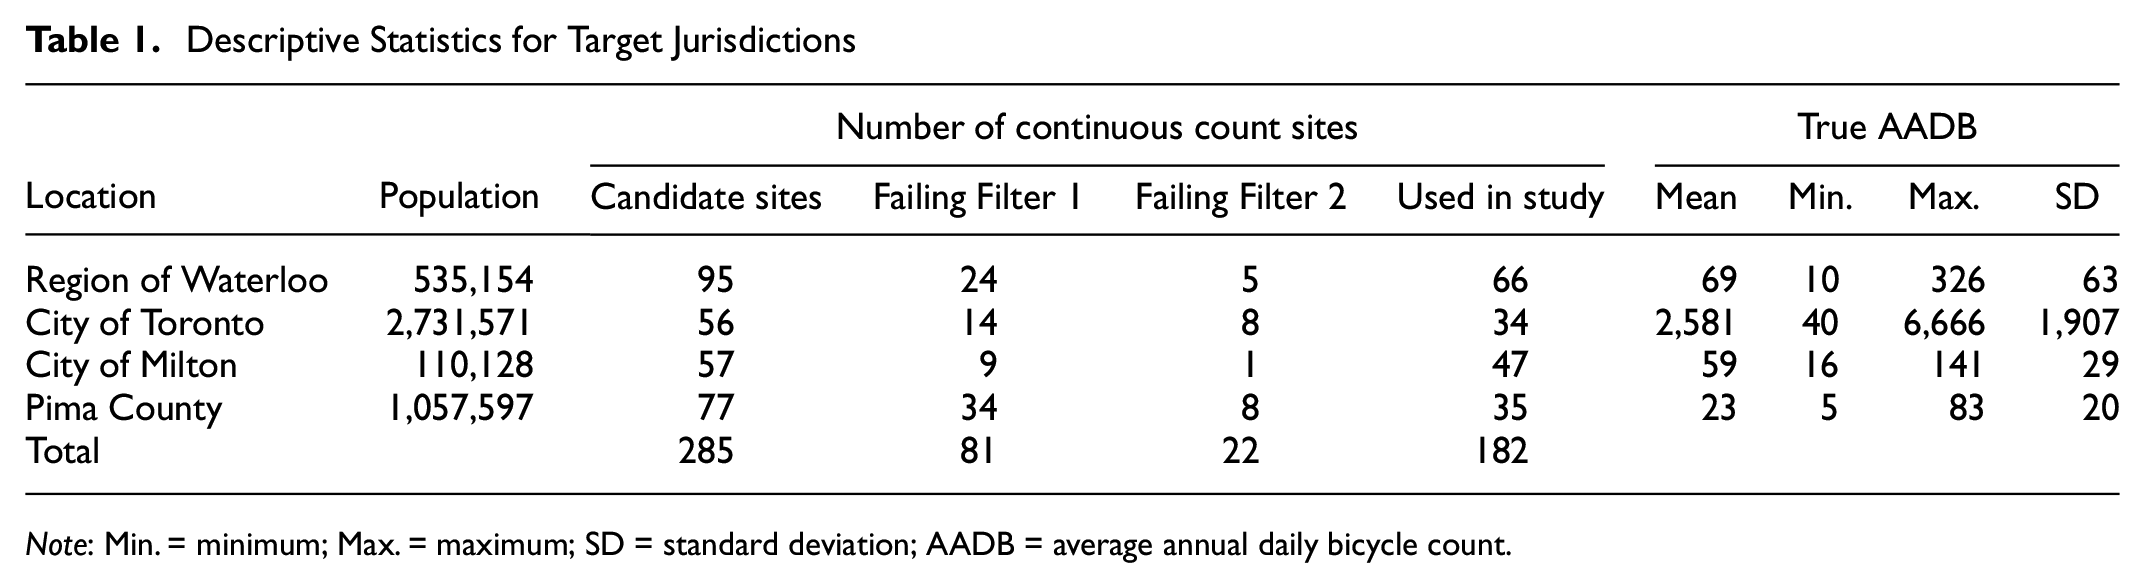
Note: Min. = minimum; Max. = maximum; SD = standard deviation; AADB = average annual daily bicycle count.
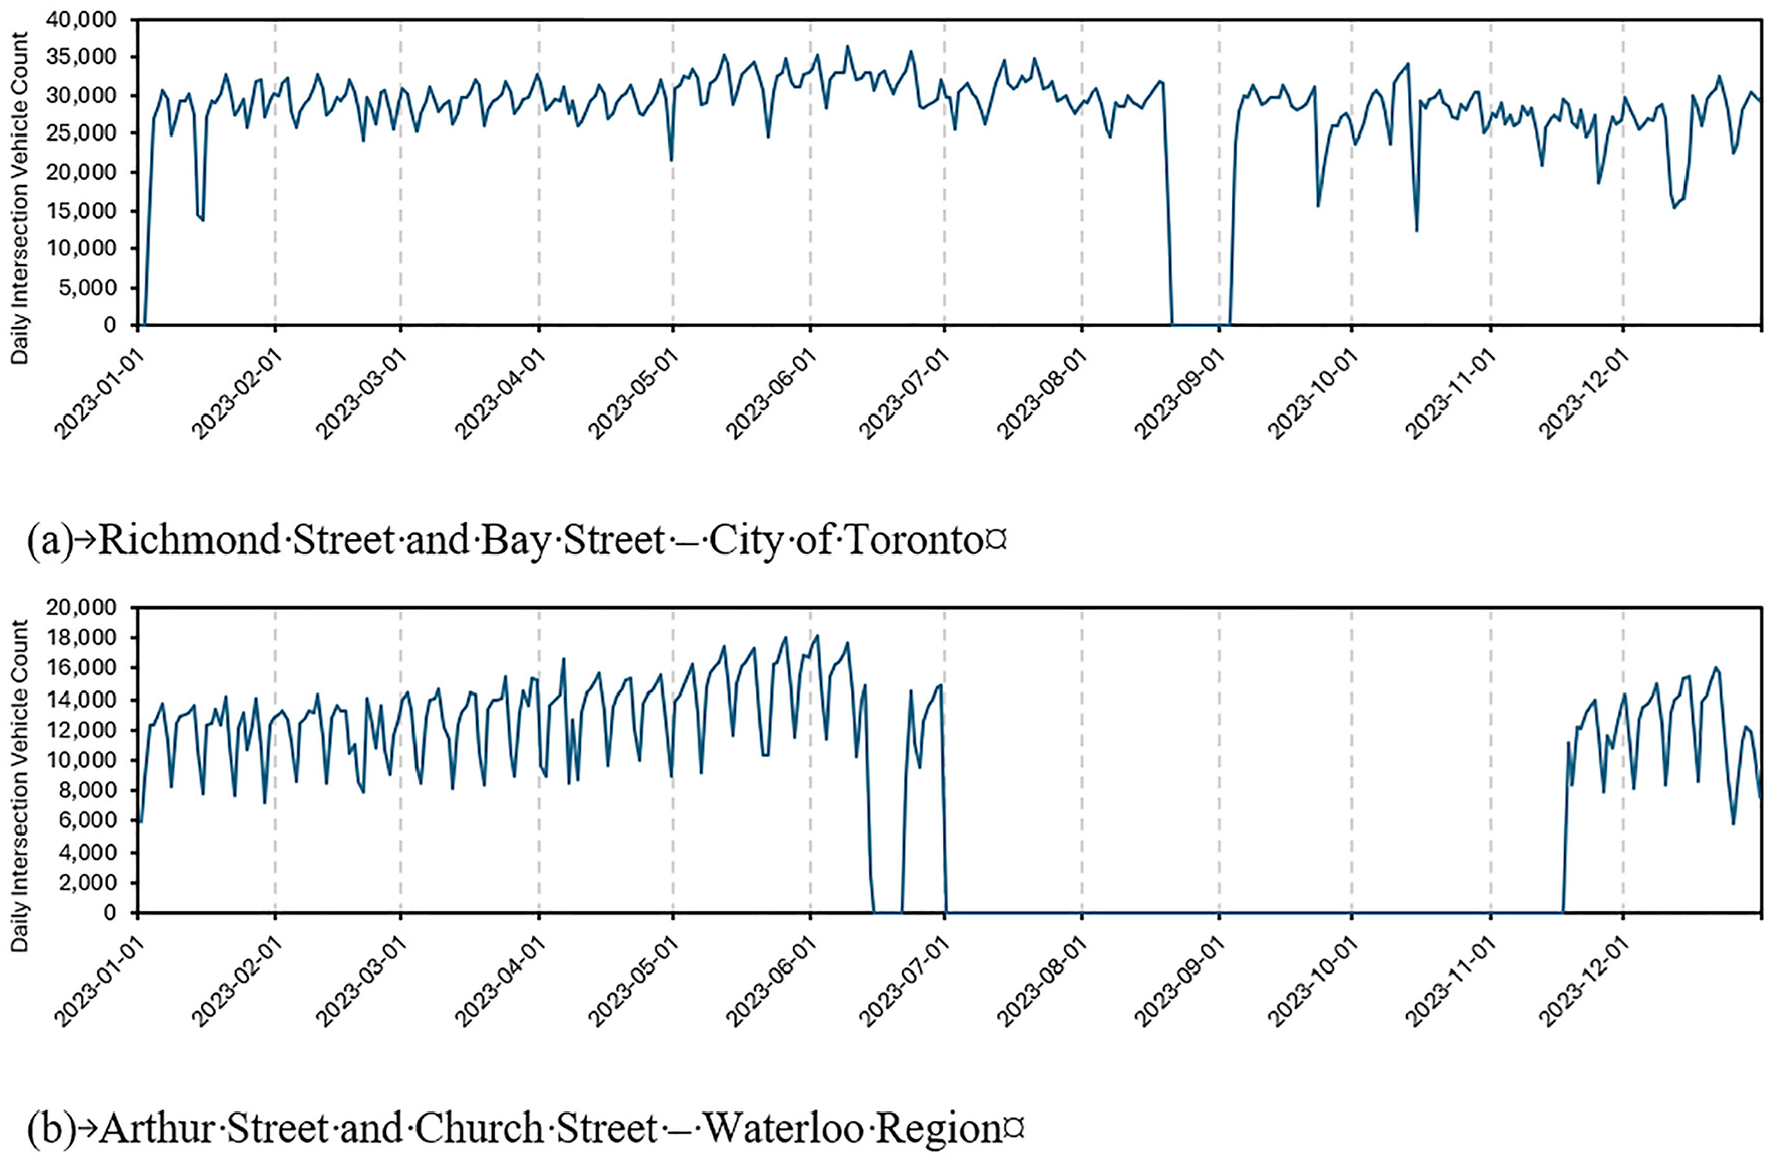
Time series of daily intersection vehicle counts for two sites that did not pass Filter 2.
The accuracy of the bicycle counts from the camera-based count system was assessed. Manual counts and video recording were collected for a 2-h period (4:30–6:30 p.m.) from a high activity intersection in the City of Toronto (AADB of approximately 4,000 bicycle counts per day). The manual bicycle count obtained during the 2-h observation period was 669. After the data collection period, the recorded video was independently viewed by two different analysts to extract manual counts (video manual count 1 = 672; video manual count 2 = 673). The average of the two video manual counts (672.5) was considered as ground truth. The corresponding camera-based bicycle count was 675, representing an accuracy of more than 99% (1 - |672.5—675)|/672.5). This field verification was limited to a single intersection and did not examine count accuracy during night-time conditions or inclement weather—situations for which accuracy is likely to be lower. Nevertheless, the results indicate the camera-based counts are sufficiently reliable for the purposes of the analysis in this paper.
The true AADB for the target jurisdictions, based on the bicycle counts for the entire intersection (including all approaches), was calculated from the valid counts for the calendar year of 2023 for all sites in all jurisdictions using Equation 14.

where
Table 1 provides further information for each target jurisdiction. Demographic and population data were extracted from the 2016 census for the Canadian jurisdictions and from 2022 for Pima County. It is worth noting that different target jurisdictions with varying levels of bicycling activity were intentionally selected for this paper to investigate the spatial transferability of DD models for estimating AADB counts. For instance, Pima County and the City of Toronto represent cases with very low and very high bicycling activity, respectively, and distinctly different seasonal weather patterns. Meanwhile, the other two target jurisdictions, the City of Milton and the Region of Waterloo, have relatively moderate levels of bicycling activity.
We note that the continuous count sites from which the bicycle counts data were obtained in each jurisdiction constitute only a small sample of all signalized intersections within each jurisdiction and may not be a representative sample with respect to the jurisdiction-wide bicycling activity.
It is useful to compare the characteristics of the four target jurisdictions with the model development jurisdictions, particularly with respect to the levels of bicycling activity as indicated by the mean AADB.
For models estimating 2-h counts, we approximated the mean AADB for comparison. The two DD models by Tabeshian and Kattan ( 18 ) were developed using the same set of data from Calgary, Canada which consisted of bicycle counts during the 2-h period from 16:00 to 18:00 from 34 sites. The study reports the mean 2-h p.m. count was 14.3 cyclists, but no information was given to factor this value up to a corresponding AADB. The average ratio (Equation 15) of the AADB to the bicycle counts in the period from 16:00 to 18:00 was determined from all sites in each of the four target jurisdictions and then the average ratio across the four jurisdictions was computed to be 7.26. Consequently, this factor was applied to estimate the Calgary mean AADB as 14.3 × 7.26 = 104.

where
The Griswold DD ( 20 ) model was developed using 2-h bicycle counts from Alameda County in California. The mean 2-h count across all 81 sites was reported to be 35.8 but the counts were taken at different times of the day. Consequently, the average ratio of AADB to 2-h bicycle counts for each time period from 18:00 to 20:00 was computed for each jurisdiction (Table 2). We assumed that the counts were made between 08:00 and 18:00 and observe from Table 2 that the average ratio across all four target jurisdictions is relatively consistent across these periods. Consequently, we used the average ratio between 08:00 and 18:00 of 7.78 to compute the mean AADB across all sites as 35.8 × 7.78 = 279.
Average Ratio of AADB to 2-h Bicycle Counts for Each Target Jurisdiction
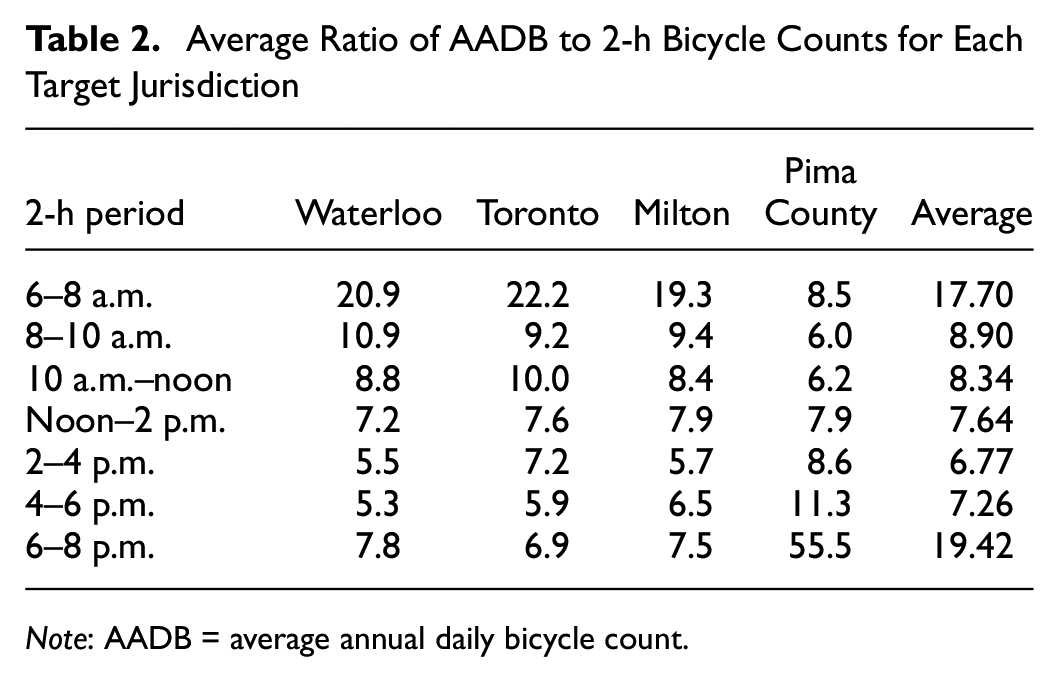
Note: AADB = average annual daily bicycle count.
The mean AADB values for the Strauss et al. ( 19 ) and the Strauss and Moreno ( 17 ) DD models were reported in their studies as 445 and 277 respectively.
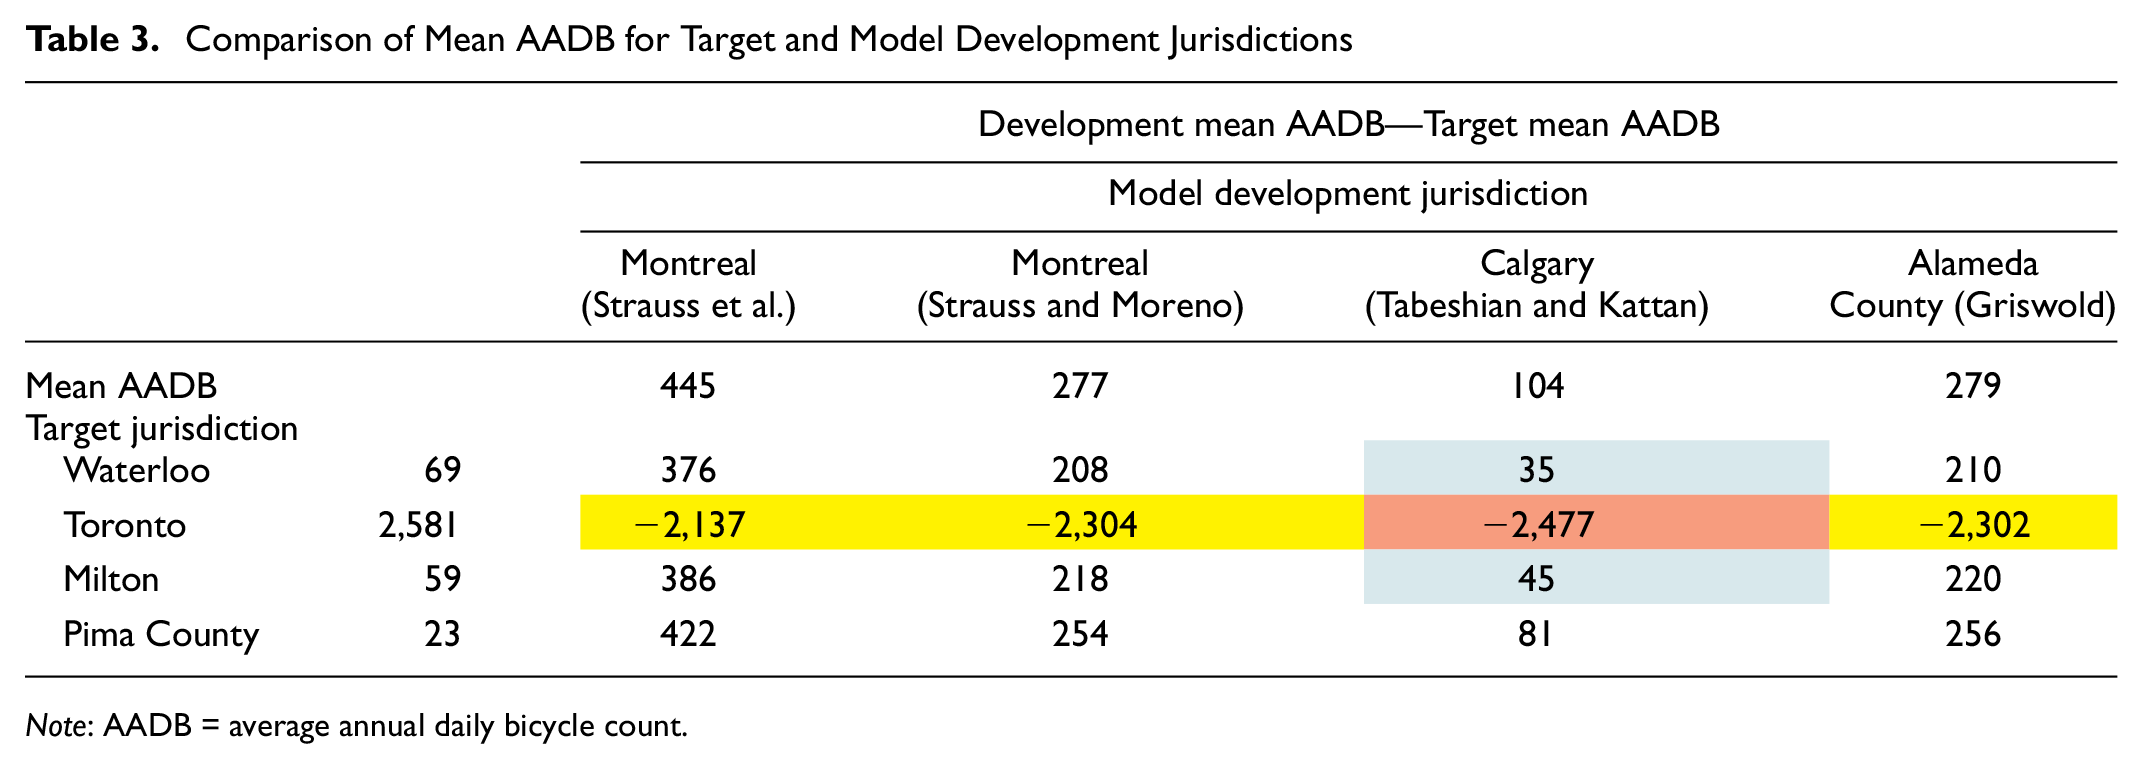
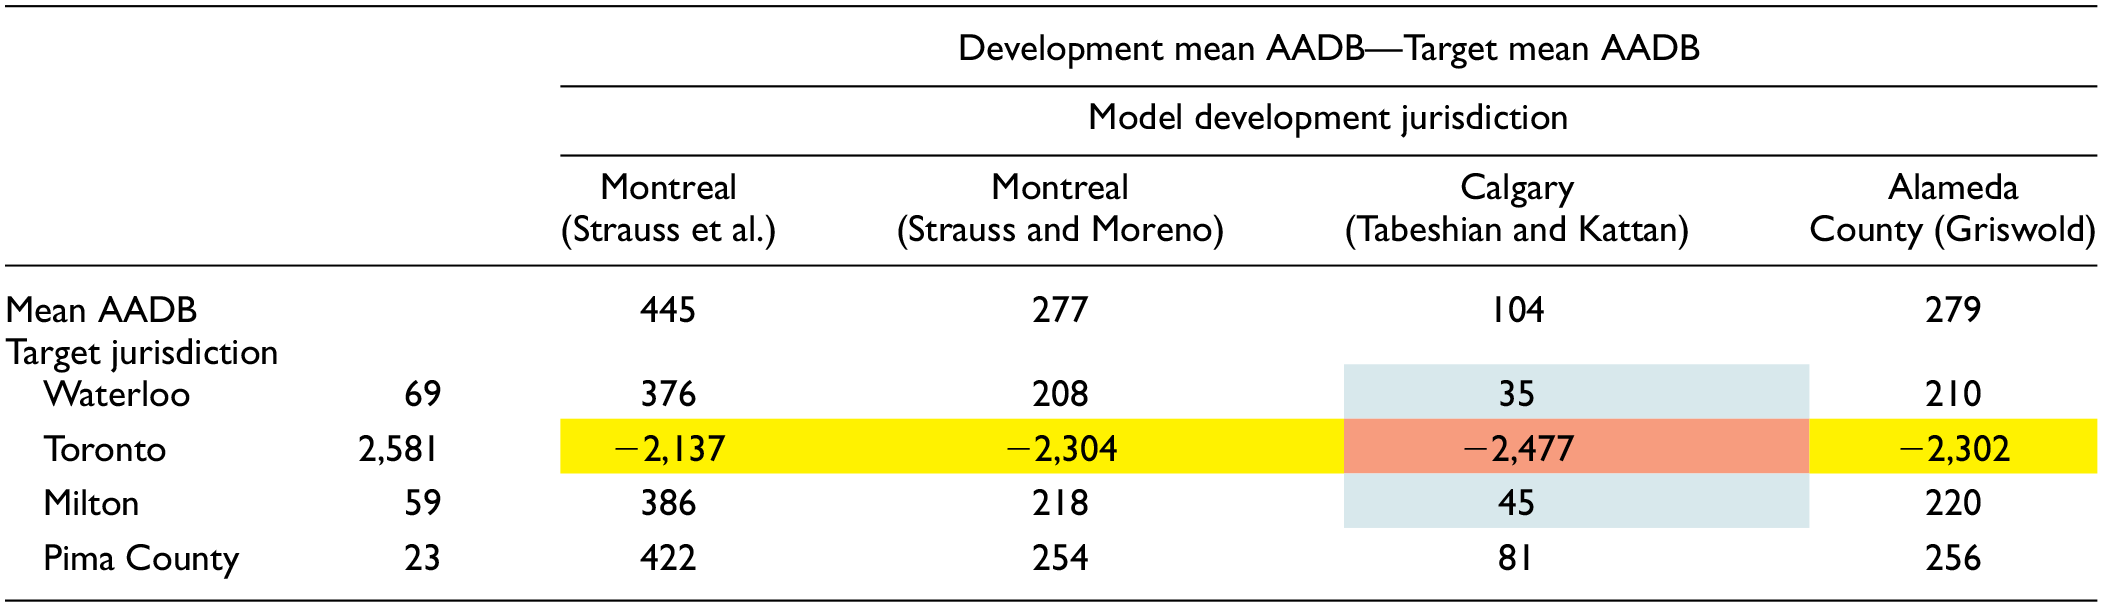
Table 3 compares the average level of bicycling activity (AADB) between the four target jurisdictions and the four model development jurisdictions. The table provides the difference between the mean AADB from the development jurisdiction and the target jurisdiction. Positive values indicate that the development jurisdiction had a larger mean AADB than the target jurisdiction. Only the City of Toronto has negative values highlighted in yellow, with the largest difference shown in red. The most similar cases between the target and development jurisdictions are highlighted in light green.
Comparison of Mean AADB for Target and Model Development Jurisdictions
Note: AADB = average annual daily bicycle count.
From this table, it can be observed that the AADB for the City of Toronto sites are much larger than any of the model development jurisdictions and that the greatest level of similarity exists between the target jurisdictions of Milton and Waterloo and the model development jurisdiction of Calgary.
Land-Use, Infrastructure, and Demographic Data
Land-use, infrastructure, and demographic data were obtained from open source data sets including jurisdictions’ websites/data portals, national census data, and OpenStreetMap (OSM) ( 31 ). Table 4 lists the sources for each individual variable and each model across all four jurisdictions.
Sources of Information for Explanatory Variables across Jurisdictions
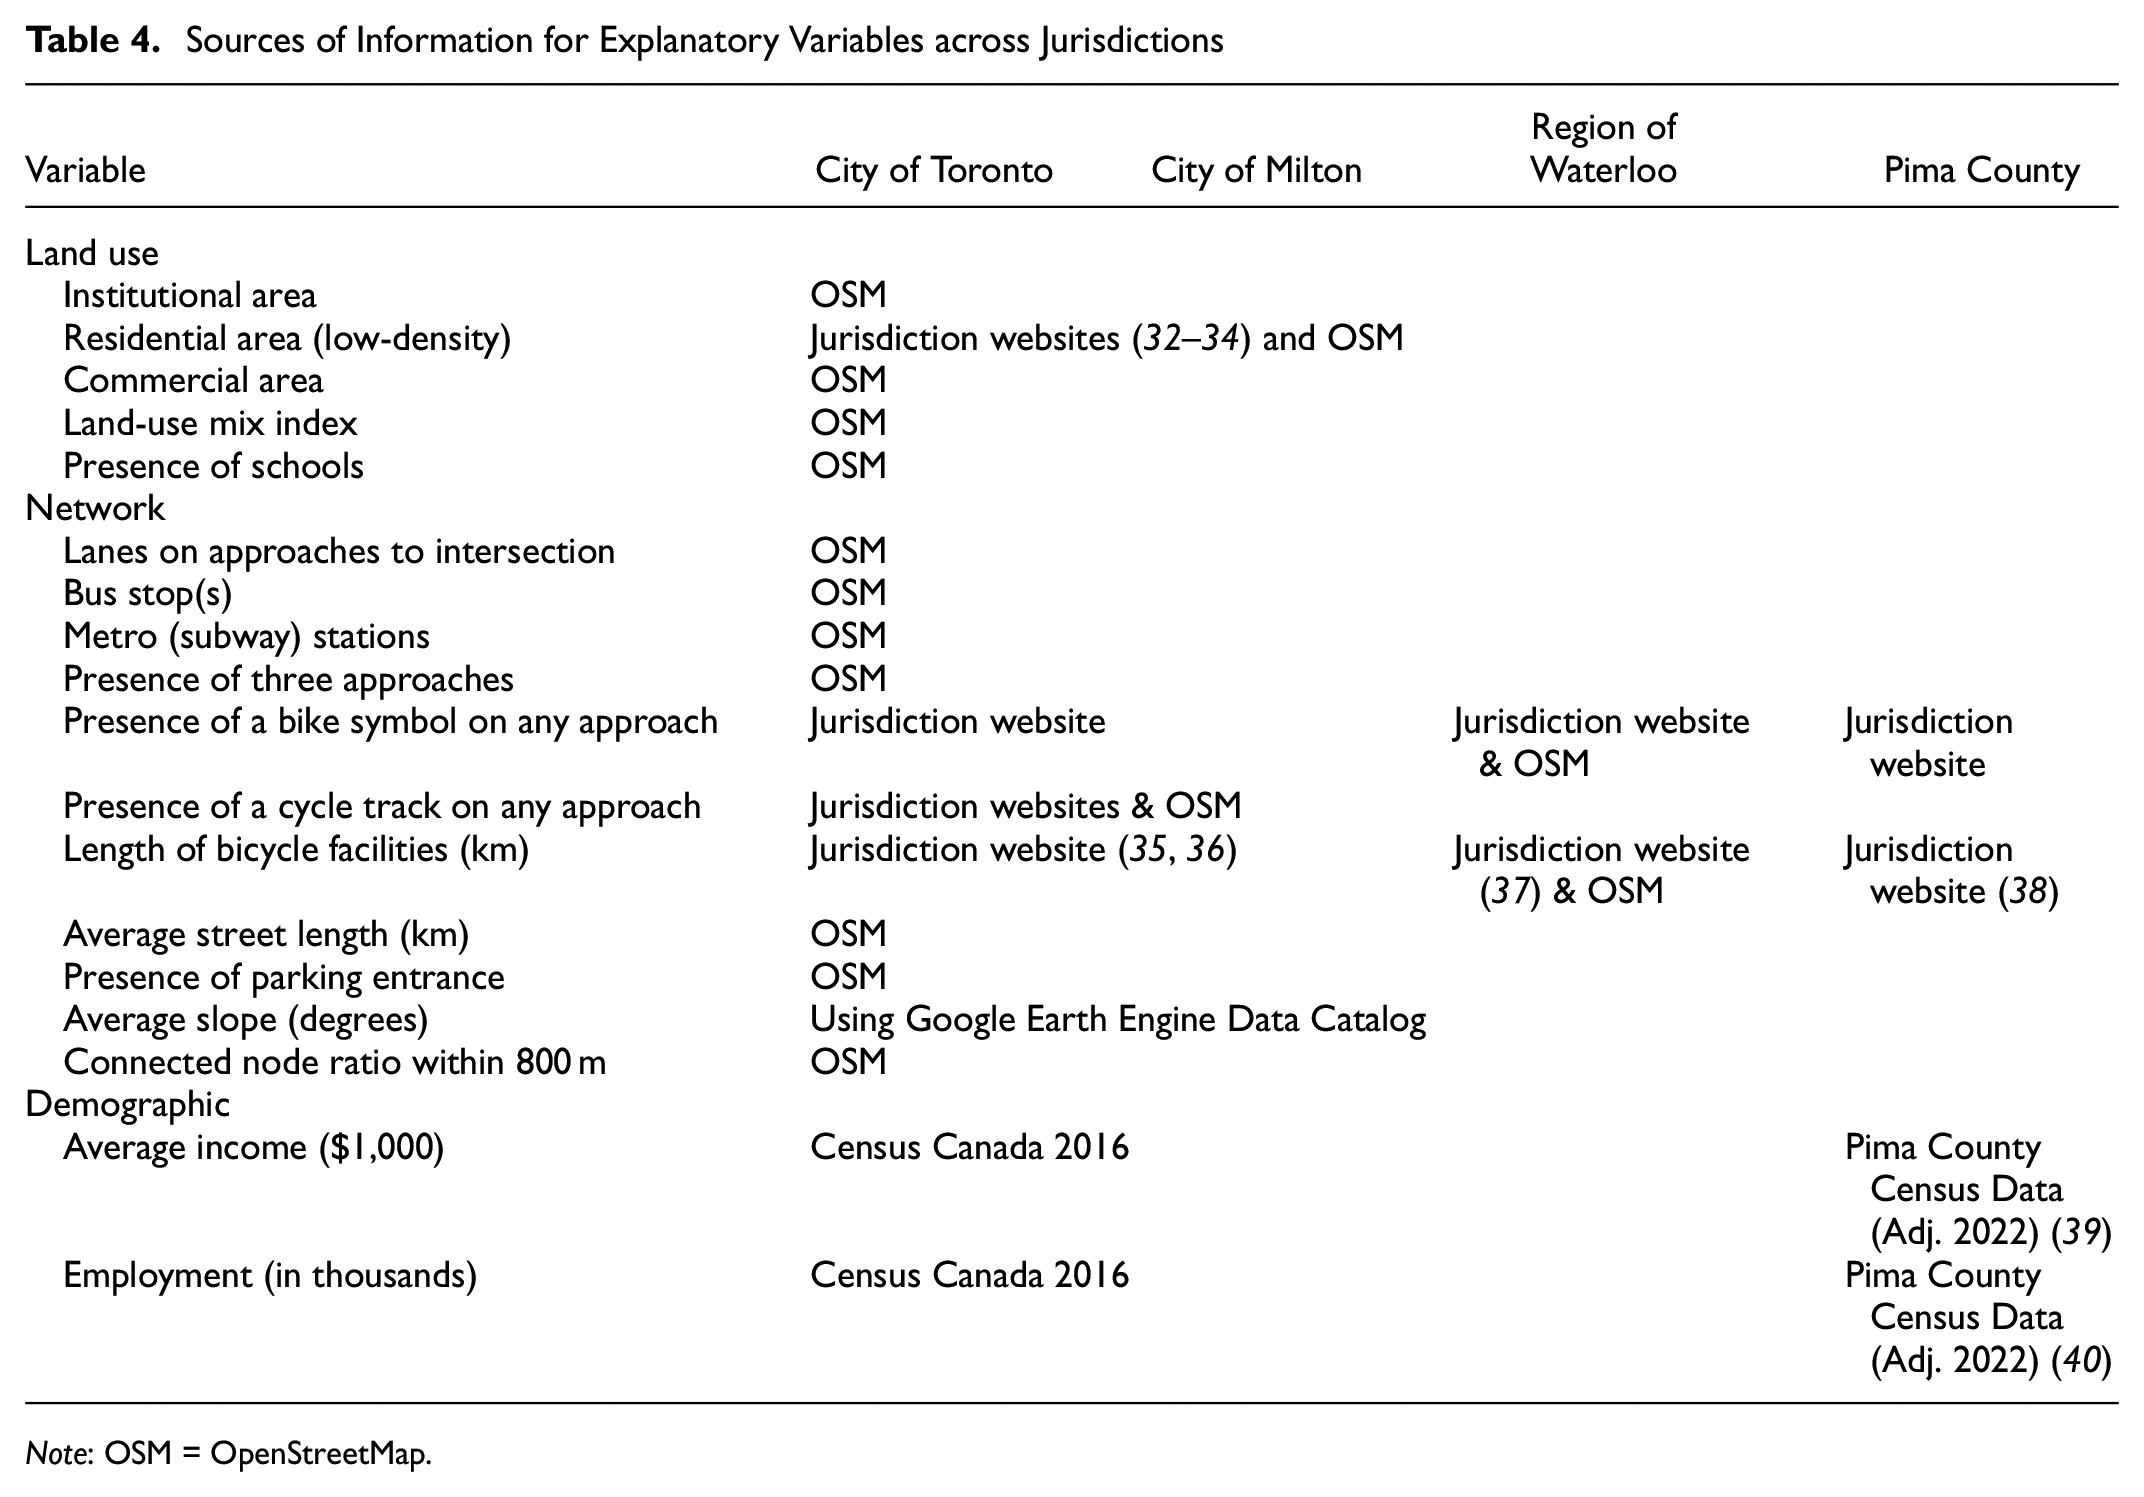
Note: OSM = OpenStreetMap.
Results and Discussion
Figure 3 presents the application of all five DD models to the four target jurisdictions. Each column represents a DD model, and each row represents a target jurisdiction. The individual data points on each graph represent the estimated AADB on the y-axis and the true AADB on the x-axis. The accuracy of each model is reported in
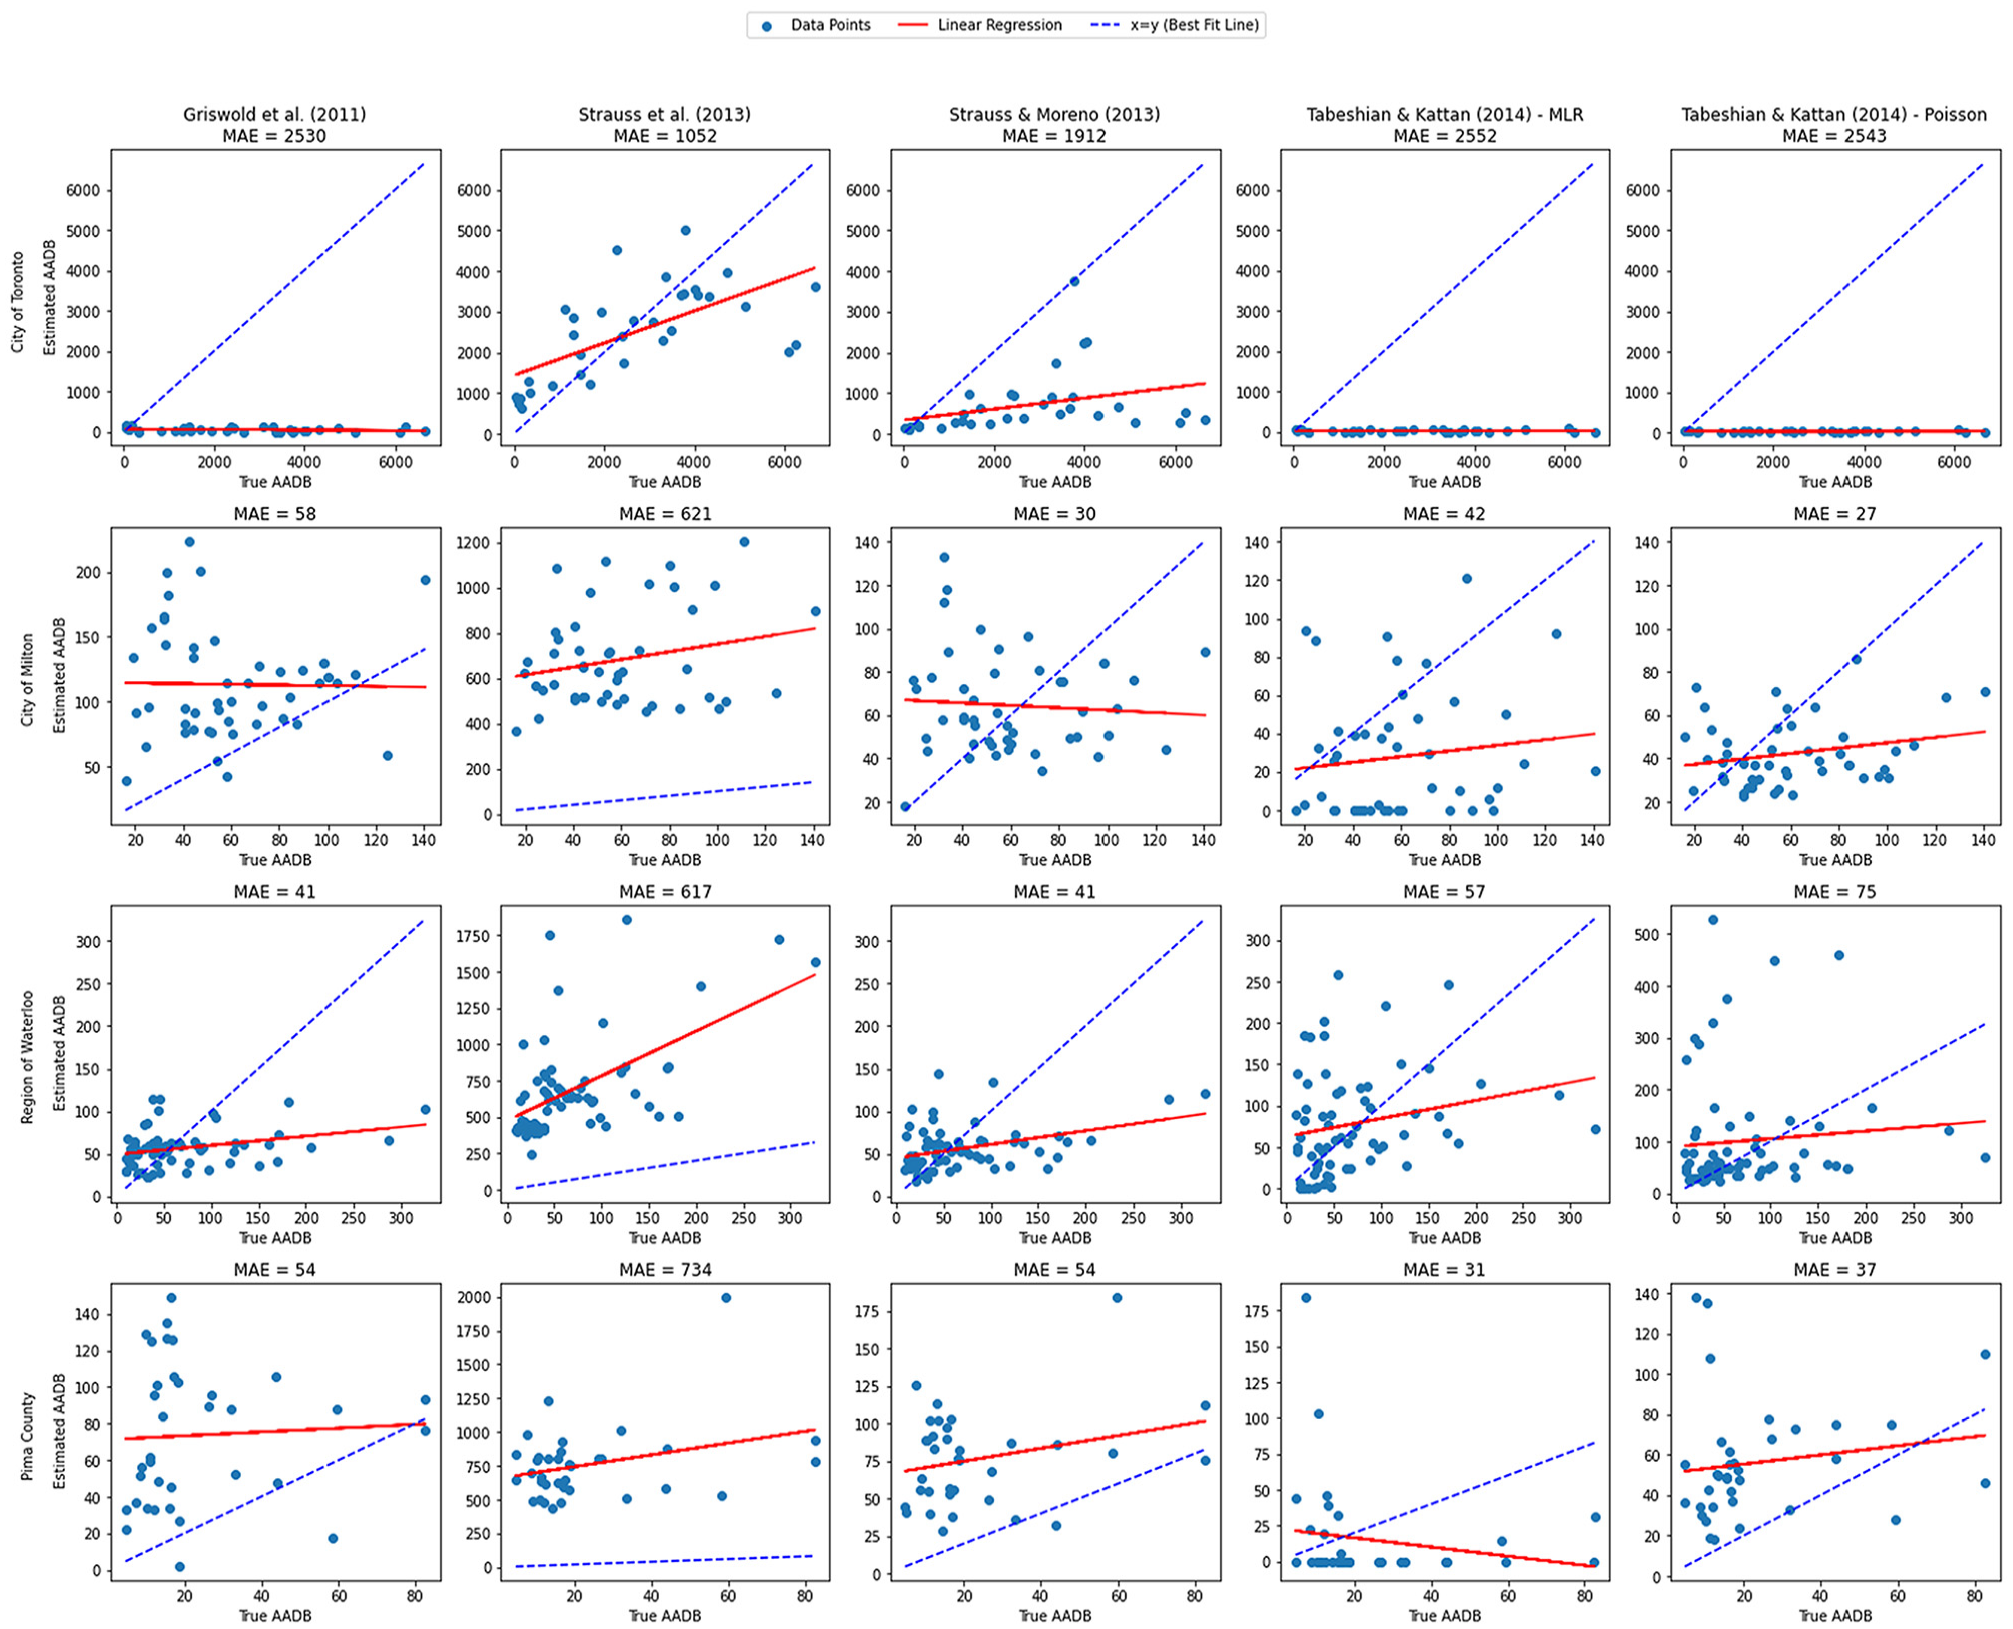
Summary of direct-demand (DD) estimations application across four jurisdictions.
Table 5 provides a summary of three error metrics for each DD model and jurisdiction as well as the average error measures across all DD models and target jurisdictions. The three error metrics are
DD Model Performance Metrics across All Four Jurisdictions
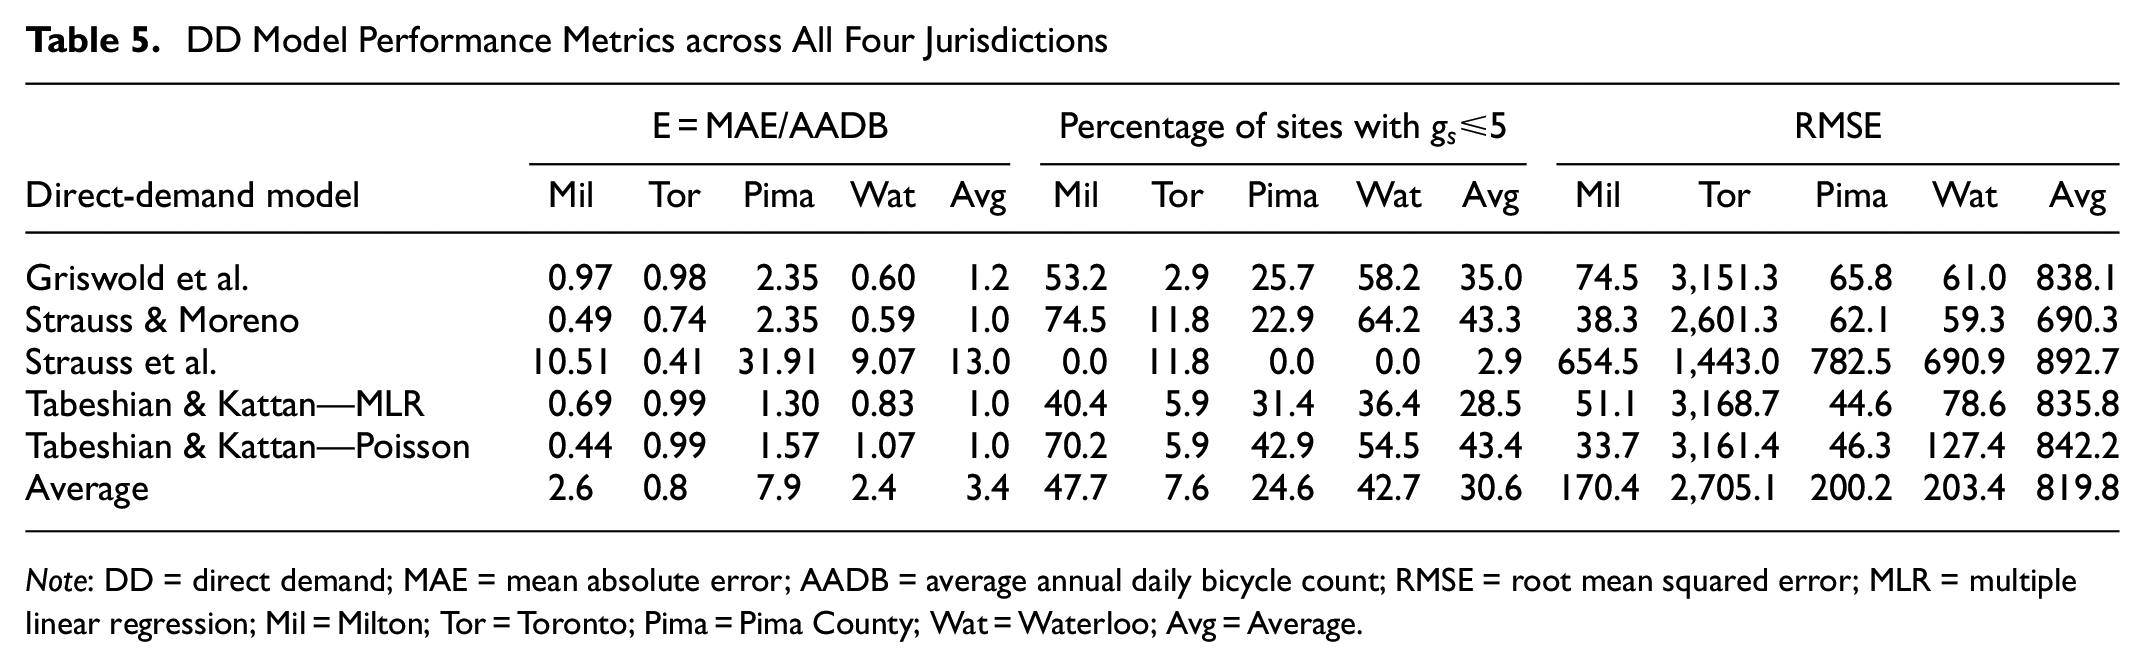
Note: DD = direct demand; MAE = mean absolute error; AADB = average annual daily bicycle count; RMSE = root mean squared error; MLR = multiple linear regression; Mil = Milton; Tor = Toronto; Pima = Pima County; Wat = Waterloo; Avg = Average.
From the results in Figure 3 and Table 5 we can make the following observations.
The spatial transferability performance varies widely across the different DD models and across the different target jurisdictions. The performance also varies with the performance metric selected.
A correlation analysis was conducted between the four metrics of model performance (Table 6) showing that there is only a moderately strong correlation between
Correlation of Spatial Transferability Performance Metrics
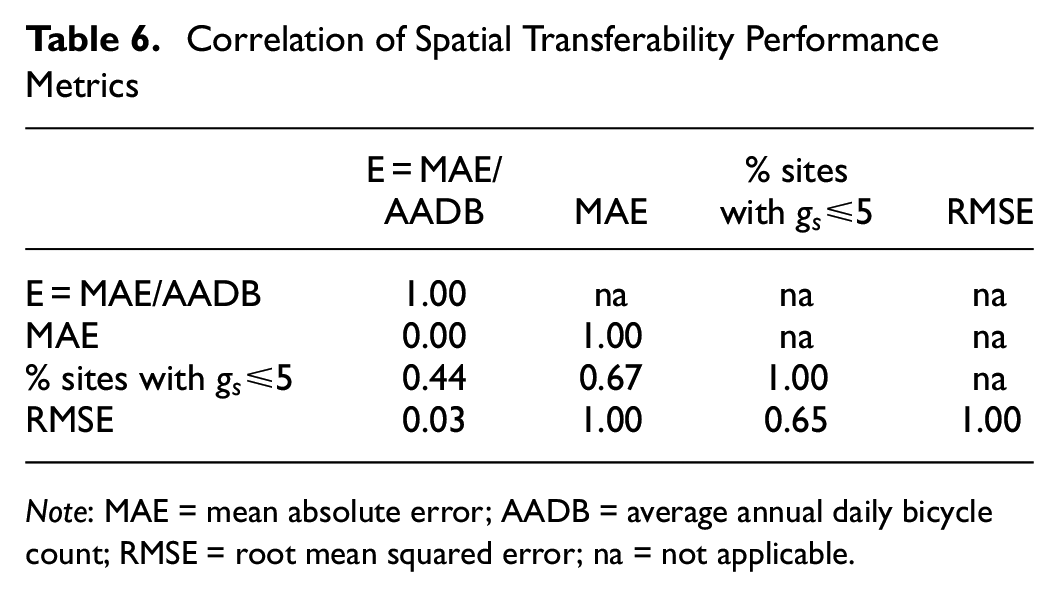
Note: MAE = mean absolute error; AADB = average annual daily bicycle count; RMSE = root mean squared error; na = not applicable.
When using
Most of the models had similar performance when applied to Milton and Waterloo jurisdictions. This result is not surprising because the level of bicycling activity and the built environment of these two jurisdictions are relatively similar.
Interestingly, the Strauss et al. (
19
) model had the best performance (
Table 3 provided the difference in the mean AADB (AADB_Diff) between the target and development jurisdictions as a measure of the dissimilarity between the two jurisdictions. To investigate the correlation between spatial transferability performance and the similarity of the target and development jurisdictions, three additional measures were computed as follows.
Abs_Diff = absolute difference in the mean AADB
GEH_AADB = GEH statistic (computed using Equation 12)
E_AADB = Abs_diff / true AADB for target jurisdiction
A correlation analysis was conducted to examine the relationship between spatial transferability performance (
Correlation of Spatial Transferability Performance Metrics and Jurisdiction Similarity Metrics
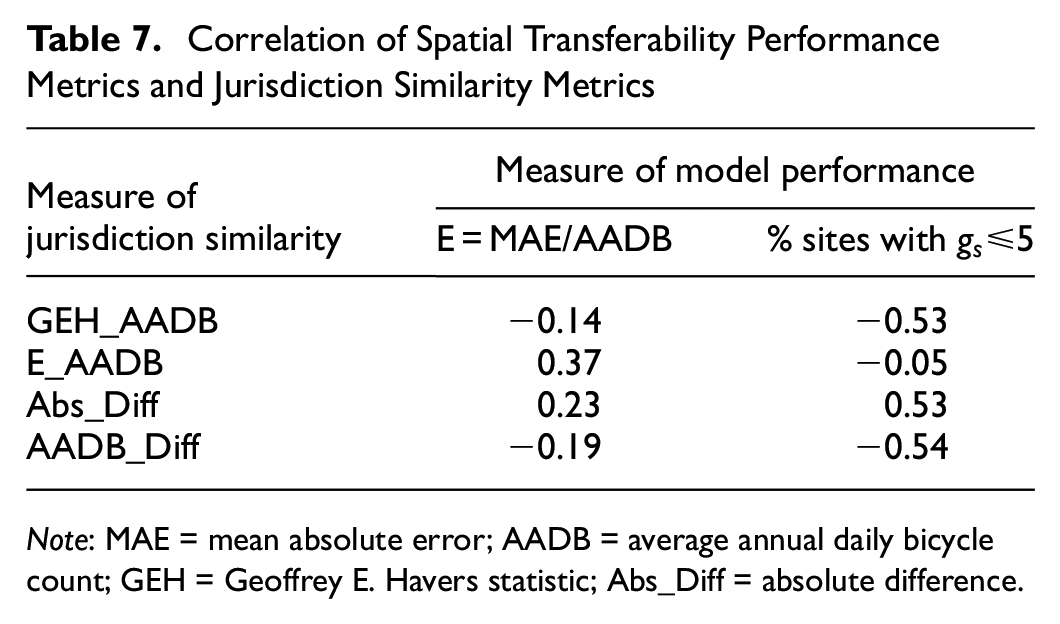
Note: MAE = mean absolute error; AADB = average annual daily bicycle count; GEH = Geoffrey E. Havers statistic; Abs_Diff = absolute difference.
Figure 4 shows a plot of model performance (percentage of sites with
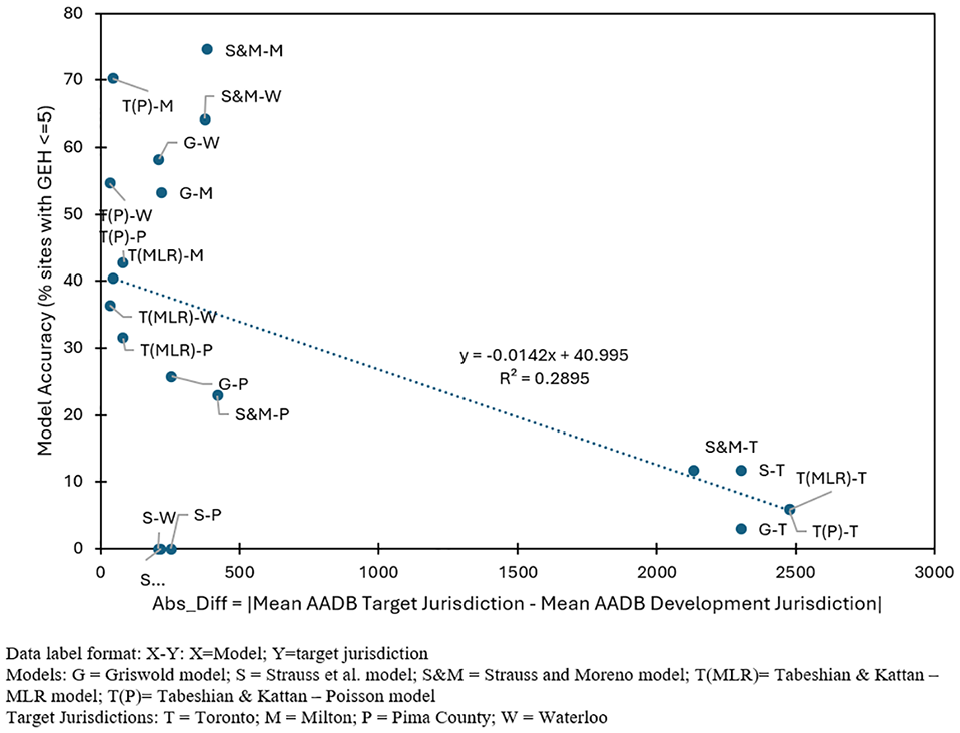
Spatial transferability performance (percentage
The above analysis quantified the similarity between the development jurisdiction and the target jurisdiction in average bicycling activity levels (i.e., mean AADB). In practice, jurisdictions wishing to apply a DD model developed in another jurisdiction do so because they don’t have any or enough bicycle counts in the target jurisdiction to develop their own DD model. In this case, it is not possible to assess the similarity of the bicycling activity levels in the target and development jurisdictions as a means to assess the suitability for spatially transferring the DD model. As such, we also examined the correlation between the similarity/dissimilarity of the site characteristics in the target and development jurisdictions and model estimation accuracy.
The mean values of the explanatory variables for each of the DD models were compiled from the literature references (note; these data were not available for the Griswold model from ( 20 ) so the following analysis is based on the remaining four DD models) and corresponding values compiled for each of the four target jurisdictions. Several measures based on these mean values were assessed to quantify the similarity/dissimilarity between jurisdictions. The selected measure expresses the dissimilarity between the development and target jurisdictions as the average of the differences in the normalized mean explanatory variable values (Equation 16).
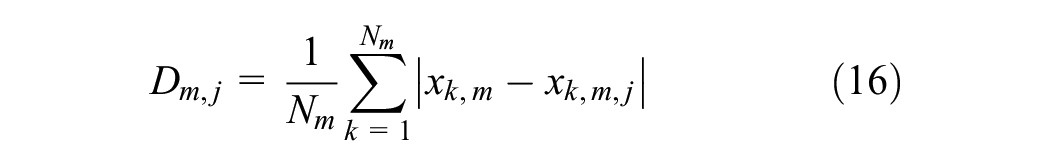
where
The mean values from the explanatory variables were normalized for each model such that the maximum value across all target jurisdictions and the development jurisdiction was set equal to one and the remaining values were scaled by multiplying by 1/maximum value, ensuring
A correlation analysis was performed between the dissimilarity measures and the two measures of DD model performance provided in Table 7 (i.e.,
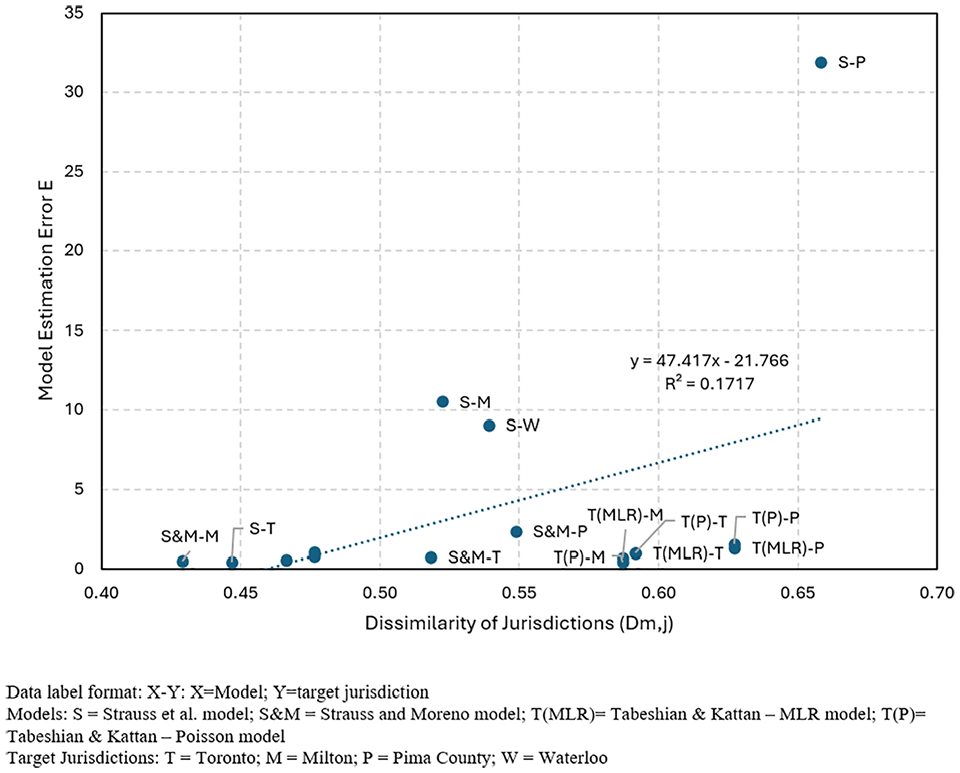
Spatial transferability performance (
These results suggest that similarity between the target and model development jurisdictions (mean explanatory variable values) is not a sufficient condition to ensure good spatial transferability of a direct-demand model.
Another observation from the spatial transferability results is that generally the naïve spatial transferability of the five DD models is poor. None of the applications achieve the condition that 85% of the model estimates have
Conclusions and Recommendations
A review of the literature was carried out to identify available models for estimating bicycle activity (AADB) at intersections based on commonly available demographic and network data (i.e., not STCs or crowdsourced data). The review identified five models that met the criteria: Griswold et al. ( 20 ), Strauss et al. ( 19 ), Strauss and Moreno ( 17 ), and two models from Tabeshian and Kattan ( 18 ).
The spatial transferability of these five DD models was assessed through the application of these models to sites in four jurisdictions (City of Toronto, City of Milton, and Region of Waterloo in Canada, and Pima County, AZ, USA) for which the true AADB was known (computed from continuous counts at these sites).
The results show that, in general, spatial transferability performance is poor. The average model estimation error (in
Furthermore, though it is expected that model performance is better when the target and development jurisdictions are similar (i.e., they have similar levels of bicycling activity), the results showed that satisfying the condition that the target and development jurisdictions have similar levels of bicycling activity does not ensure high model estimation accuracy.
These results indicate that there is strong need for methods to substantially improve the spatial transferability of DD models for estimating bicycle counts (AADB).
Limitations
We note that all the selected DD models were developed before the COVID-19 pandemic (before 2019), while the data sets used to evaluate their spatial transferability performance are from the post-pandemic period (2023). Although there were no direct pandemic-related restrictions, such as lockdowns, during the 2023 period, cyclist activity and travel patterns may have changed compared with the pre-pandemic era, potentially leading to poorer model performance.
Footnotes
Acknowledgements
The authors gratefully acknowledge: 1) the Region of Waterloo, City of Toronto, City of Milton, and Pima County for providing permission to use the bicycle counts data and for providing rich open data portals that were essential sources of information for this research; and 2) Miovision for providing access to the bicycle data.
Author Contributions
The authors confirm contribution to the paper as follows: study conception and design: Hellinga and Azizi Soldouz; data collection: Azizi Soldouz; analysis and interpretation of results: Azizi Soldouz and Hellinga; draft manuscript preparation: Azizi Soldouz and Hellinga. All authors reviewed the results and approved the final version of the manuscript.
Declaration of Conflicting Interests
The author(s) declared no potential conflicts of interest with respect to the research, authorship, and/or publication of this article.
Funding
The author(s) disclosed receipt of the following financial support for the research, authorship, and/or publication of this article: The authors gratefully acknowledge financial support from the Natural Sciences and Engineering Research Council of Canada (NSERC). via the Discovery Grant Program (funding reference number 2022-03275).
The work in this paper reflects the views of the authors and there is no explicit or implicit endorsement by any of the aforementioned jurisdictions or companies. The research was carried out by the authors and no endorsement of the methods or findings by funding agencies is claimed or implied.