
Abstract
Direct demand (DD) models are an important tool for estimating annual average daily pedestrian traffic (AADPT) for all intersections in a jurisdiction. These models associate socioeconomic and land-use variables with pedestrian exposure and allow the estimation of AADPT for sites where pedestrian counts are not (readily) available. However, some jurisdictions lack pedestrian volume counts from a sufficiently large number of intersections to develop their own DD model or do not have the institutional resources to carry out the model development. Under these circumstances, a cost-effective alternative is to use DD models that were developed in other jurisdictions. Previous research evaluated the spatial transferability of DD models in scenarios where no pedestrian counts are available (i.e., naïve transferability) and showed that this resulted in large estimation errors. This paper examines methods to improve the estimation accuracy of spatially transferred DD models by using AADPT that is readily accessible to jurisdictions (we call this local calibration). Five local calibration models were proposed and evaluated using observed field counts and synthesized counts from three jurisdictions. The best model to use is a function of the number of local jurisdiction sites for which pedestrian counts are available. When pedestrian volume is available for 10% of the sites, Model C presented the best results for the synthetic approach: an average improvement of 8.7% when comparing the locally calibrated and naïve estimates. Using real AADPTs and very limited samples for local calibration, Model C also presented the best performance: an average improvement of 35.0%.
Keywords
Recent North American road safety reports have shown alarming trends in the frequencies and proportions of fatal crashes involving pedestrians. For instance, the yearly number of pedestrians killed on U.S. roadways increased from 4,092 to 6,205 between 2009 and 2019 ( 1 , 2 ). In Canada, although the number of pedestrians killed has remained relatively stable over the last few decades, the proportion of pedestrian fatalities has increased. Between 2005 and 2009, pedestrians accounted for 13% of the total road fatalities in Canada; this number grew to 17% in the period between 2015 and 2019 ( 3 , 4 ). These statistics show the importance and need for jurisdictions to develop strategies focused on pedestrian safety.
The set of opportunities for a jurisdiction to improve pedestrian safety is wide and varied, ranging from long-term educational actions to relatively simple infrastructure changes such as the installation of a raised crosswalk. In the context of signalized intersection—the object of study in this work—the selection of optimal countermeasures to benefit pedestrians is commonly preceded by a network screening step, in which sites are ranked according to some measure of risk ( 5 ). The development of the site ranking relies on information about pedestrian exposure at all the sites in a jurisdiction ( 6 – 8 ), which is often challenging to acquire.
The opportunity for jurisdictions to obtain pedestrian exposure for the entire road network depends on the type and quantity of data available. The two typical sources for pedestrian volume data at signalized intersections are short-term counts (STCs) and continuous counts (CCs). STCs are normally the product of fieldwork carried out for signal timing design purposes, where vehicular turning movement counts and pedestrian volumes are counted over one or a few nonholiday weekdays. On the other hand, CCs provide long-term information (i.e., years) and are useful for detecting systematic spatial and temporal oscillations in vehicular and pedestrian volumes. In sites where CC stations are available, annual average daily pedestrian traffic (AADPT) can be directly calculated. In addition, when CCs are available from a sufficient number of intersections then the CC data can be used to expand STCs to AADPT. The literature suggests that CCs should be available from between 6 and 25 stations as a minimum, depending on the characteristics of the jurisdiction ( 9 ), for the expansion of STCs to provide reliable estimates of AADPT. Because of resource limitations, jurisdictions may have sites for which no recent pedestrian counts are available, which prevents appropriate jurisdictionwide exposure estimates (according to the Federal Highway Administration [ 10 ], pedestrian STCs must be renewed every 3 to 7 years). To overcome this limitation, researchers have developed direct demand (DD) models to estimate pedestrian volumes for sites where pedestrian counts are not available.
DD models are statistical models calibrated using sites where pedestrian exposure is known by associating it with explanatory variables that are often readily available to jurisdictions: socioeconomic features (e.g., population and employment densities), land-use attributes (e.g., number of commercial and residential places), and geometric and operational aspects (e.g., presence of transit stops) ( 11 – 13 ). Once the DD model has been developed, practitioners can estimate the pedestrian exposure for all the sites in a given jurisdiction.
There is a relatively large body of literature on DD models. Different models considering varied explanatory variables, calibration sample sizes, modeling techniques, and types of jurisdictions have been developed and are available for the community (a comprehensive literature review on the development of DD models is available in other works [9, 11, 12]). This leads us to the prime motivator behind this study: the development of adequate DD models requires that jurisdictions have valid pedestrian data (ideally in the form of AADPT) for a sufficiently large number of sites to support the development (i.e., calibration and validation) of a DD model. For example, researchers have developed DD models with an R2 of 0.70 using calibration sample sizes in the order of 50 to 70 sites ( 7 , 14 , 15 ). Considering that some jurisdictions may lack data to develop their own DD model, a cost-effective alternative is for them to apply a model available in the literature. However, very limited research has been done on the examination of the spatial transferability of DD models, raising the question of whether this alternative is appropriate.
To the authors’ knowledge, only one study investigates the spatial transferability of DD models to other jurisdictions. Sobreira and Hellinga evaluated the transferability of six DD models available in the literature to three different jurisdictions and found that the accuracy of the model estimation varied considerably depending on the characteristics of the jurisdiction that the model is being transferred to (referred to in this work as the target jurisdiction) ( 9 ). The evaluation methodology assumed that no information on pedestrian volume was known for any sites in the target jurisdiction, resulting in a “naïve” transferability. This represents an extreme case, as it can be reasonably expected that most jurisdictions have pedestrian counts for at least some of their signalized intersections, even when they do not have sufficient data to develop their own DD model. Consequently, there is an opportunity for jurisdictions that fall into this category to try to enhance the naïve transferability of DD models by employing the existing pedestrian count data, a procedure that is referred to in this work as local calibration. Thus, this research evaluates the local calibration of DD models transferred from other jurisdictions by using AADPT data that are readily available for signalized intersections in the target jurisdiction.
The next sections of this work are organized as follows: Section 2 summarizes the results found by Sobreira and Hellinga ( 9 ). Sections 3, 4, and 5 present the methods proposed for the local calibration. Section 6 comprises the results and discussion of the local calibration, and Section 7 presents the conclusions of this work.
Naïve Transferability of DD Models
Sobreira and Hellinga investigated the spatial transferability of DD models available in the literature ( 9 ). The authors chose six DD models with varying features in relation to the number of significant explanatory variables in the model, calibration dataset sample size, and level of pedestrian activity in the original calibration jurisdiction. The models were applied to three jurisdictions with quite different characteristics for pedestrian activity, land use, and socioeconomics. The first jurisdiction was Milton, Ontario, Canada, which presents a mid-level of pedestrian activity (average AADPT = 313) and similar land-use and socioeconomic characteristics to many other suburban U.S. and Canadian jurisdictions. The second jurisdiction was Pima County, AZ, representing sites with very low pedestrian activity (average AADPT = 28). The third jurisdiction was Downtown Toronto, Ontario, Canada, an environment with extremely high pedestrian activity (average AADPT = 23,481) and population and employment densities.
To help the reader understand the main differences between jurisdictions, Figure 1 presents the distribution of several variables for each jurisdiction. Figure 1 also shows the mean, minimum, and maximum statistics for the jurisdiction in which the model was originally developed. It was observed that the distribution of the variables followed the level of pedestrian activity found in each jurisdiction (i.e., Pima County < Milton < Toronto) and that the variables for Milton and Pima County, in general, were within the range of values of the original DD model calibration datasets. More information on the jurisdictions and the chosen DD models is available in Sobreira and Hellinga ( 9 ).
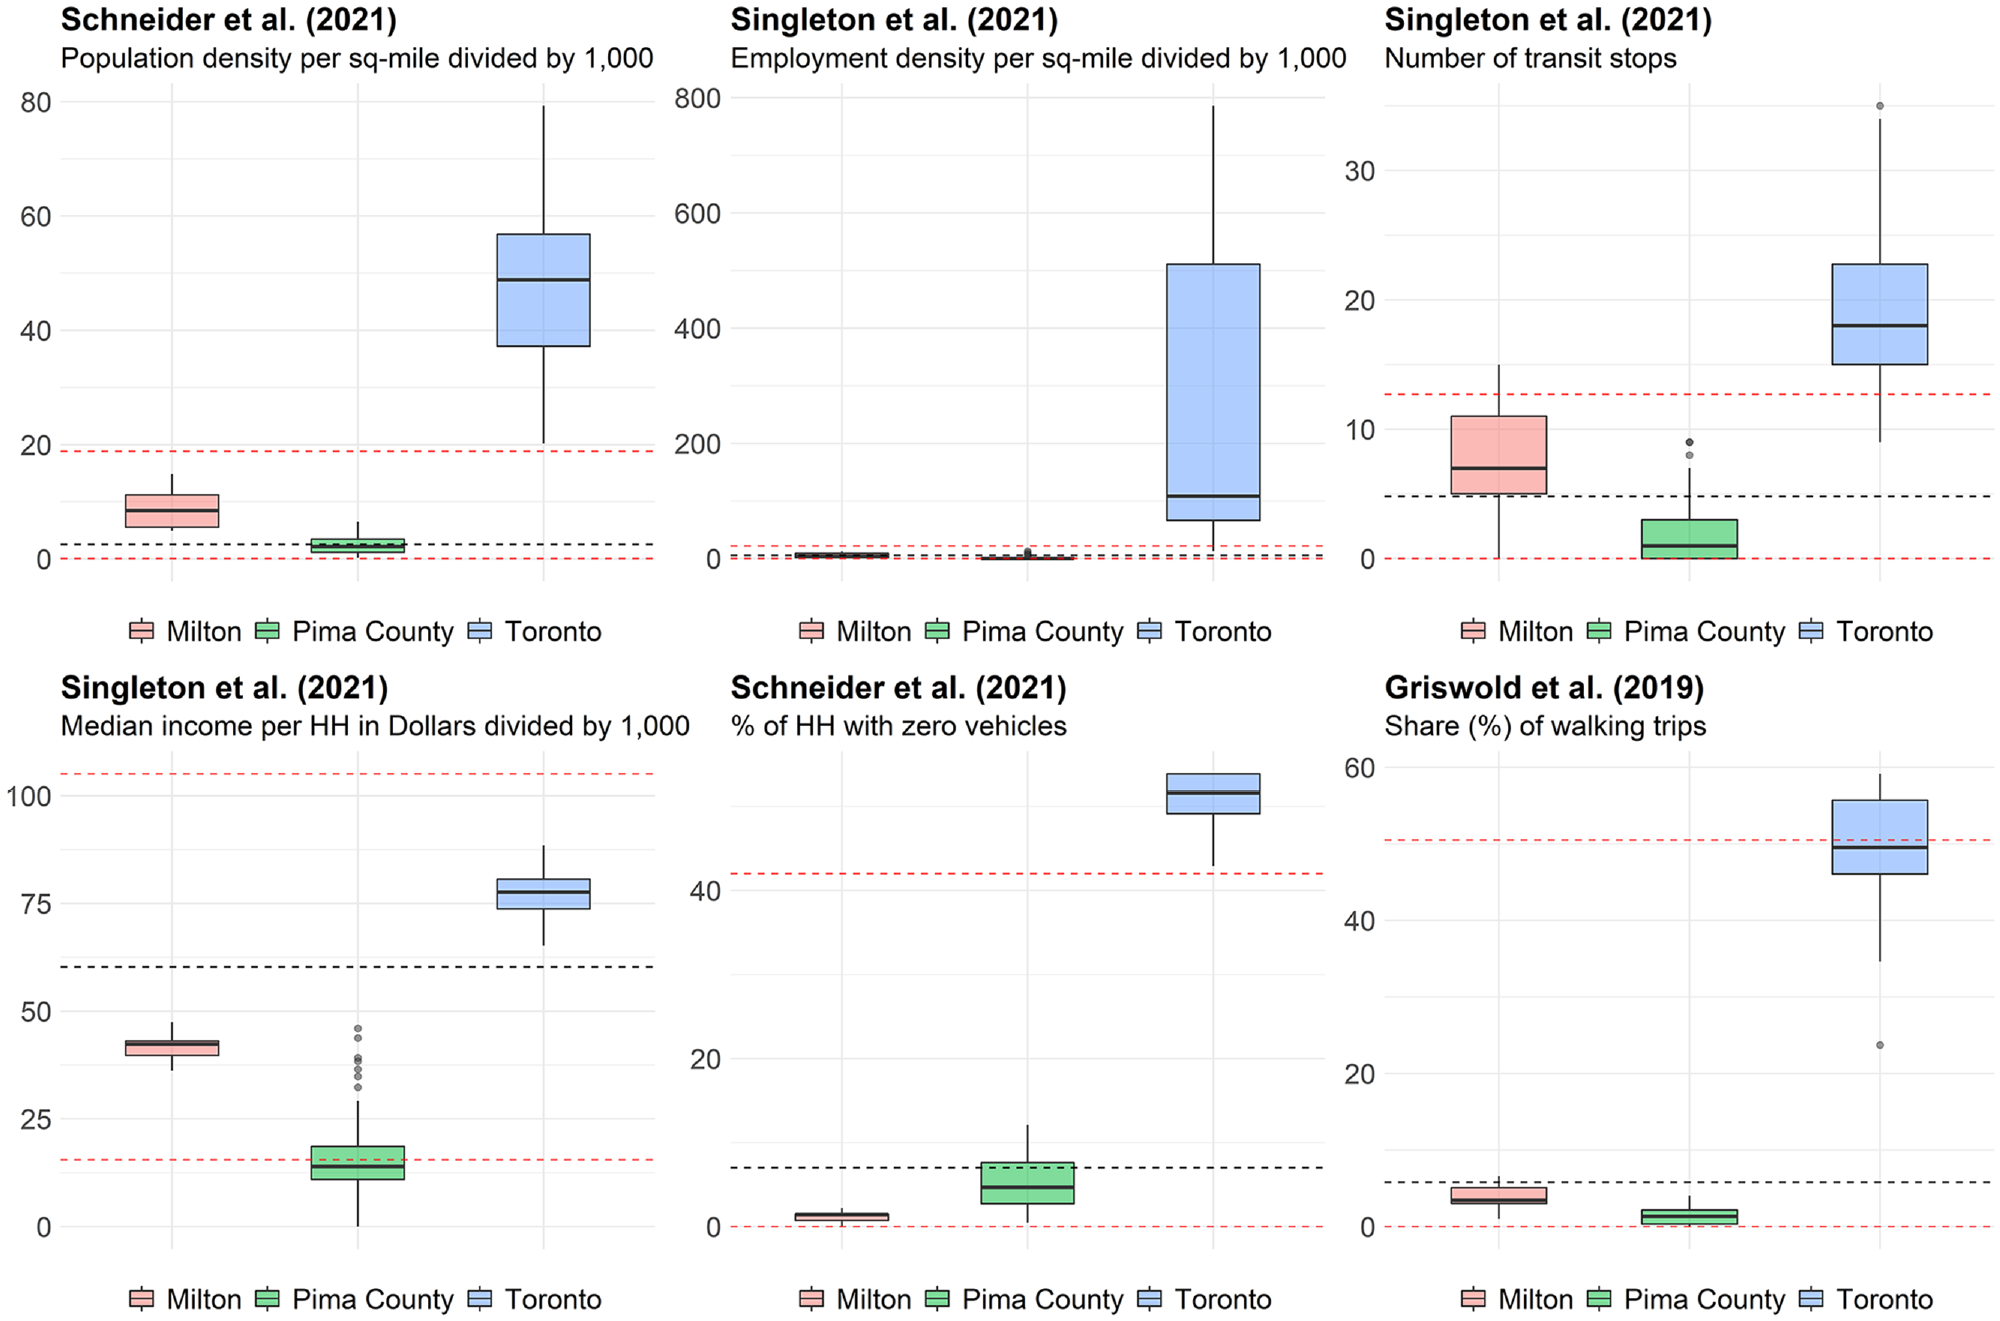
Boxplots of variables for each jurisdiction.
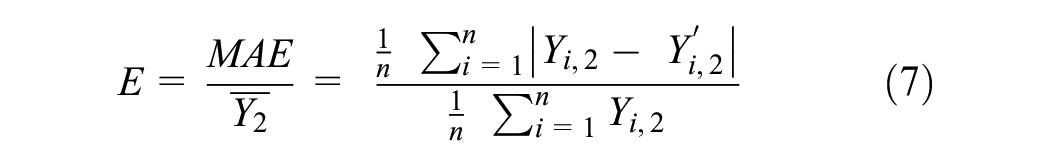
To measure the accuracy of the transferability, Sobreira and Hellinga considered sites where at least 30 days of COVID-19 pandemic-free data were available to estimate the observed AADPT ( 9 ). The authors made use of expansion factors to deal with sites where less than a year of data were available (see Sobreira and Hellinga [ 9 ] for further details on this procedure). Table 1 presents the summary of the results for the mean average error (MAE). The ratio between the MAE and the average observed AADPT was also considered to standardize the errors across different studies and jurisdictions. The column “Original study” of Table 1 provides the performance reported by the original DD model authors based on the original jurisdiction calibration or validation dataset. It can be noted that a benchmark value for the standard error metric is around 0.60 to 0.65. The main findings obtained in the study are summarized below:
Although some of the models performed acceptably well when applied to other jurisdictions, there was no single DD model that performed well across all three target jurisdictions.
The models performed well in Milton. The authors linked this to the similarities between Milton and the jurisdictions in which the DD models were originally developed in relation to pedestrian activity, land-use, and socioeconomic attributes.
In general, the models performed poorly in Pima County and Toronto. The authors associated this with the peculiar environment observed in the considered sites of both jurisdictions (i.e., very low and high pedestrian activity, respectively), which is very different from the ones seen in the jurisdictions in the original models.
Summary of the Naïve Spatial Transferability
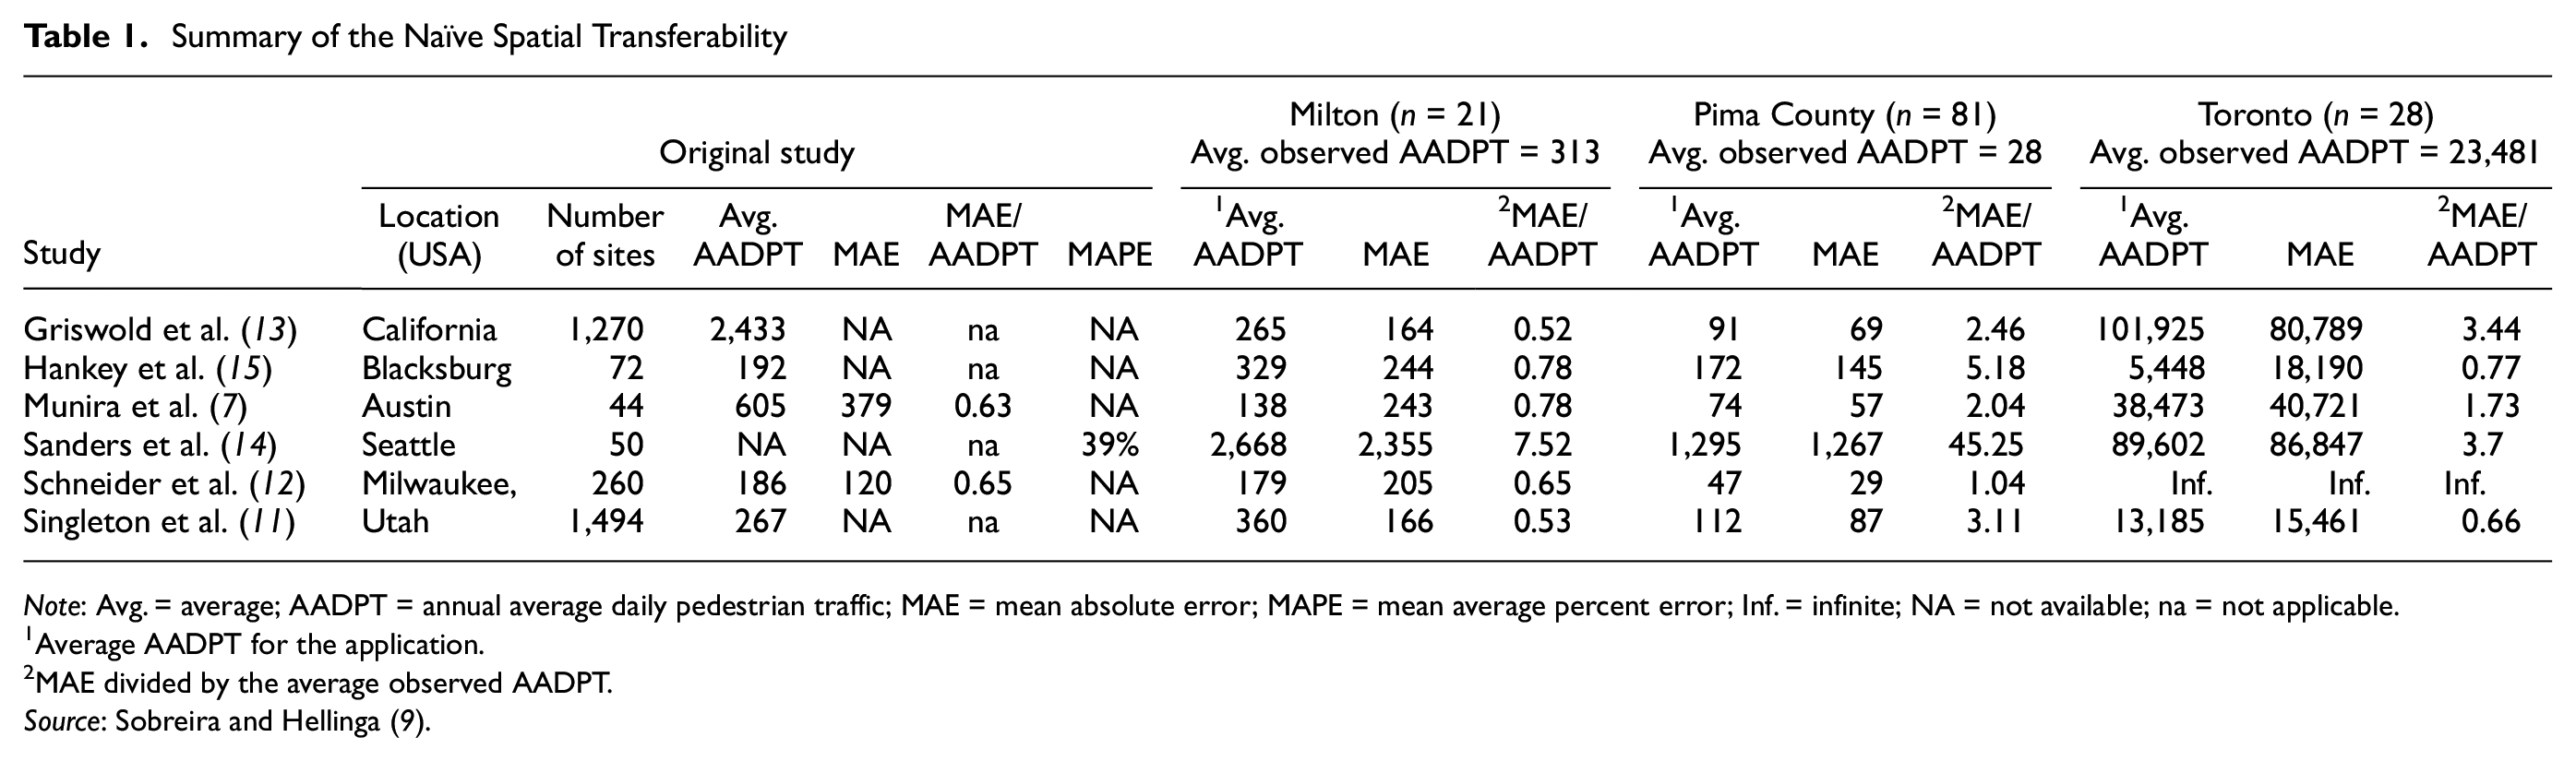
Note: Avg. = average; AADPT = annual average daily pedestrian traffic; MAE = mean absolute error; MAPE = mean average percent error; Inf. = infinite; NA = not available; na = not applicable.
Average AADPT for the application.
MAE divided by the average observed AADPT.
Source: Sobreira and Hellinga ( 9 ).
These findings suggest that naïvely transferring DD models from the literature may be sufficient when the target jurisdiction shares characteristics with the original model jurisdiction (i.e., level of pedestrian activity and land-use and socioeconomic features). However, when this does not happen, the accuracy of the transferability is frequently substantially worse than the benchmark standard, demonstrating a clear need for methods to improve the transferability. This is the focus of the present work.The present work was developed using the same target jurisdictions and datasets as Sobreira and Hellinga ( 9 ). The three DD models that presented the best performance when being naïvely transferred were selected for the local calibration task: Singleton et al. ( 11 ), Schneider et al. ( 12 ), and Griswold et al. ( 13 ). The next section describes the local calibration method and the five local calibration models evaluated in this paper.
Proposed Local Calibration Models
The idea behind the local calibration is that the pedestrian volume data that are readily available to target jurisdictions may be used to enhance the naïve AADPT estimates from DD models that were developed in other jurisdictions. Figure 2 presents the proposed method for estimating AADPT using the local calibration approach. Some key terms of the method are described below:
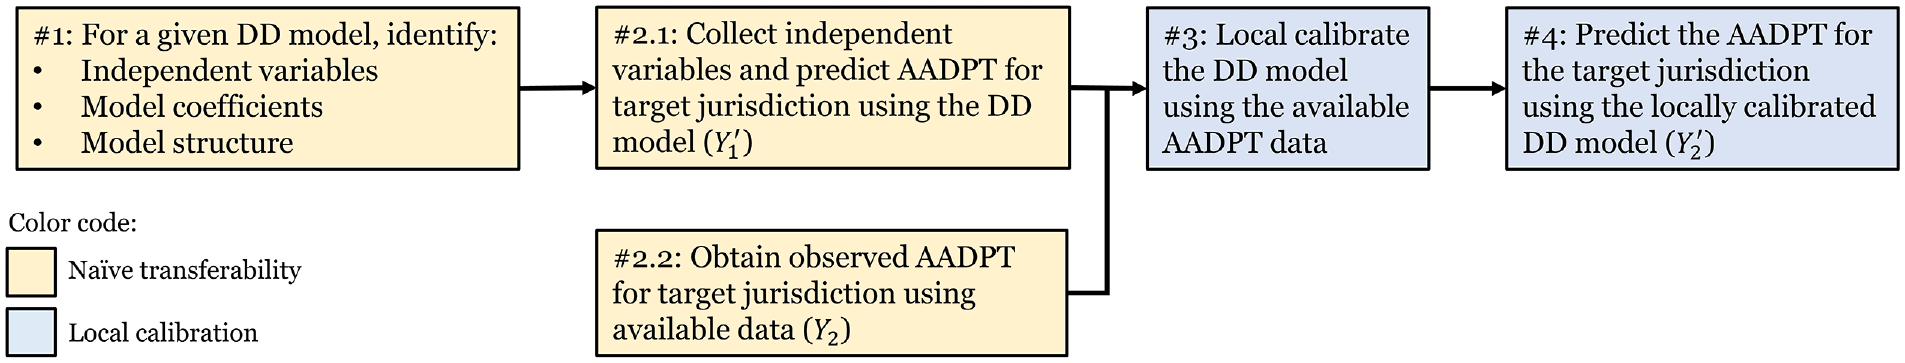
Method for estimating AADPT using local calibration.
Step #1 of the method consists of detailing a given DD model from the literature in relation to significant independent variables, model coefficients, and model structure (e.g., log-linear or negative binomial distributions). In Step #2.1, the independent variables identified in Step #1 are collected for the target jurisdiction, then the AADPT is naïvely predicted (
Steps #1, #2.1, and #2.2 represent the naïve transferability approach and are pre-requisites for the local calibration. More details on these steps, on the features of the DD models selected from the literature, and on how the observed AADPTs were estimated can be found in Sobreira and Hellinga ( 9 ).
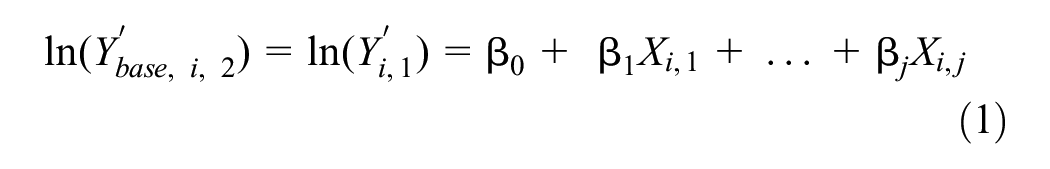
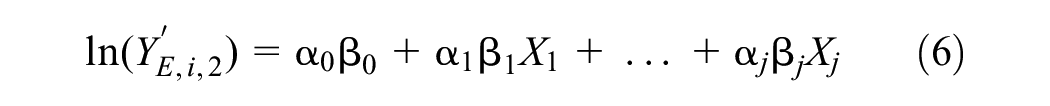
Five models (A to E) were proposed for the development of the local calibration (Equations 2 to 6). In addition, a base model representing the naïve transferability was also considered for comparison purposes (Equation 1). Models A and B correspond to scaling factor models. Models C and D consist of a calibration of linear and power regression, respectively, using
The selected DD models for this task were developed using either log-linear or negative binomial distributions ( 11 – 13 ). In both distributions, the dependent variable was ln-transformed before the model calibration. We tried the application of the local calibration models using both the natural logarithm of AADPT and AADPT itself. The former approach presented better results and was the one adopted. The exponential of the natural logarithm of AADPT was then taken to obtain the locally calibrated AADPT.
Base model: no change to the original model from Jurisdiction #1 (naïve transferability)
Model A: calibration factor (
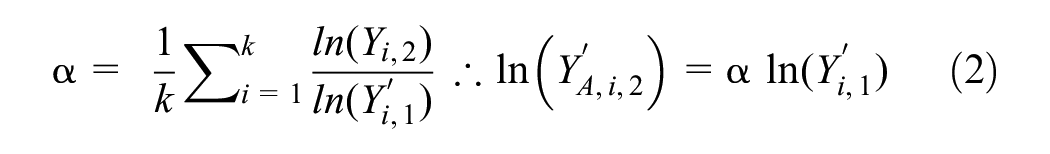
Model B: calibration factor Version 2 (
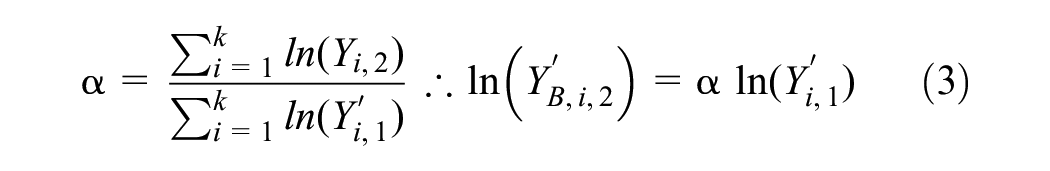
Model C: linear regression to obtain slope (

Model D: power regression to obtain coefficients

Model E: linear regression to obtain adjustment (
where
Evaluation Methodology
The performance of the different proposed local calibration models will depend on (i) the number of sites (
Identify sites where AADPT is known. Sample size is equal to
Set sample sizes of sites used for local calibration (
Randomly select
Calibrate the coefficients
Obtain
Compute the error metric (
The median of the error indicators (
As the reader may have noticed, small samples of sites where AADPT is known were available in the jurisdictions of the study (Table 1: Milton = 21 sites, Pima County = 81, and Toronto = 28). This constrained our ability to carry out in-depth analyses, for example, defining the optimal number or percentage of sites that maximize the cost–benefit of the local calibration. Thus, we complimented our evaluation using the empirical datasets with an evaluation based on synthesized AADPT data for real sites in the same three jurisdictions. The method of generating the synthetic AADPT data is described in the next section.
Generating Synthetic AADPT Data
The objective of synthesizing AADPT data was to create a larger dataset on which to evaluate the five local calibration models. The main challenge in this task was to generate synthetic AADPT values that were realistic given the characteristics of the site and the jurisdiction. Considering that, we proposed the use of DD models to generate synthetic estimates. The rationale behind this decision was that the DD models had been calibrated to capture the relationships between site characteristics and AADPT and were calibrated in different jurisdictions, so each DD model represented a particular environment with regard to the relationship between pedestrian activity and socioeconomic and land-use features. These site-specific- and jurisdiction impacts were captured by the DD model via the explanatory variables and associated coefficients. As long as the explanatory variables of a given DD model are available for the sites, synthetic AADPTs can be generated. An example is provided to illustrate the method: Griswold et al. developed their DD model using sites from the state of California in the United States (
13
). We applied this DD model to all sites in a target jurisdiction (for example Milton) to create synthetic AADPT to represent
Generation of the synthetic AADPT starts with the naïve estimate using a given DD model (Equation 8).

where
We decided to set an upper limit threshold (
After filtering the datasets based on the


where
The inclusion of the random error resulted in the estimation of sites with zero or negative AADPTs, especially for sites with small values of
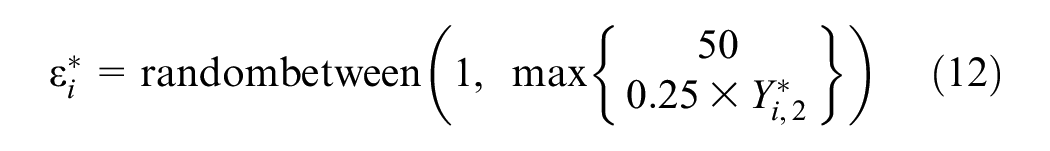
where
The functional form and parameters of Equation 12 are subjective but were based on examination of the observed AADPT data from the three jurisdictions used in this study and on the requirements to retain stochasticity in the synthesized data while limiting the number of sites with synthesized AADPT values equal to zero.
Because of the addition of the random error terms, there are an unlimited number of synthetic AADPTs for a given jurisdiction using a given DD model. As a result, 10 sets of synthetic AADPTs were created for each jurisdiction and DD model combination, and 30 repetitions for each set were used in the simulation process outlined in the previous section. The 300 simulations used in the real AADPT approach were set to match the number of simulations in the synthetic approach. The performance of the five local calibration models considering both “real” and synthetic AADPTs are presented in the next section.
Results and Discussion
Table 2 provides an overview of the number of sites and descriptive statistics of the site AADPT values as obtained from the real AADPT and synthetic AADPT approaches. For the synthetic approach, we decided to split the City of Toronto sites into two datasets—Downtown and Other—because we observed that the AADPT estimates in Downtown were much larger than the ones in the rest of the city. This division was made to avoid biasing the results of the local calibration toward the sites in Downtown. Synthetic datasets were generated for each jurisdiction using the following DD models: Singleton et al. ( 11 ), Schneider et al. ( 12 ), and Griswold et al. ( 13 ), except for the application of Schneider et al. ( 12 ) in Downtown Toronto, which was not possible owing to the generation of unrealistically large estimates (the Schneider et al. model [ 12 ] provides highly unrealistic AADPT estimates when employment density becomes large, as was the case for the Downtown Toronto sites). The evaluation using the real AADPT data used the datasets from Milton, Pima County, and Downtown Toronto.
Descriptive Summary: Sample Size and AADPT
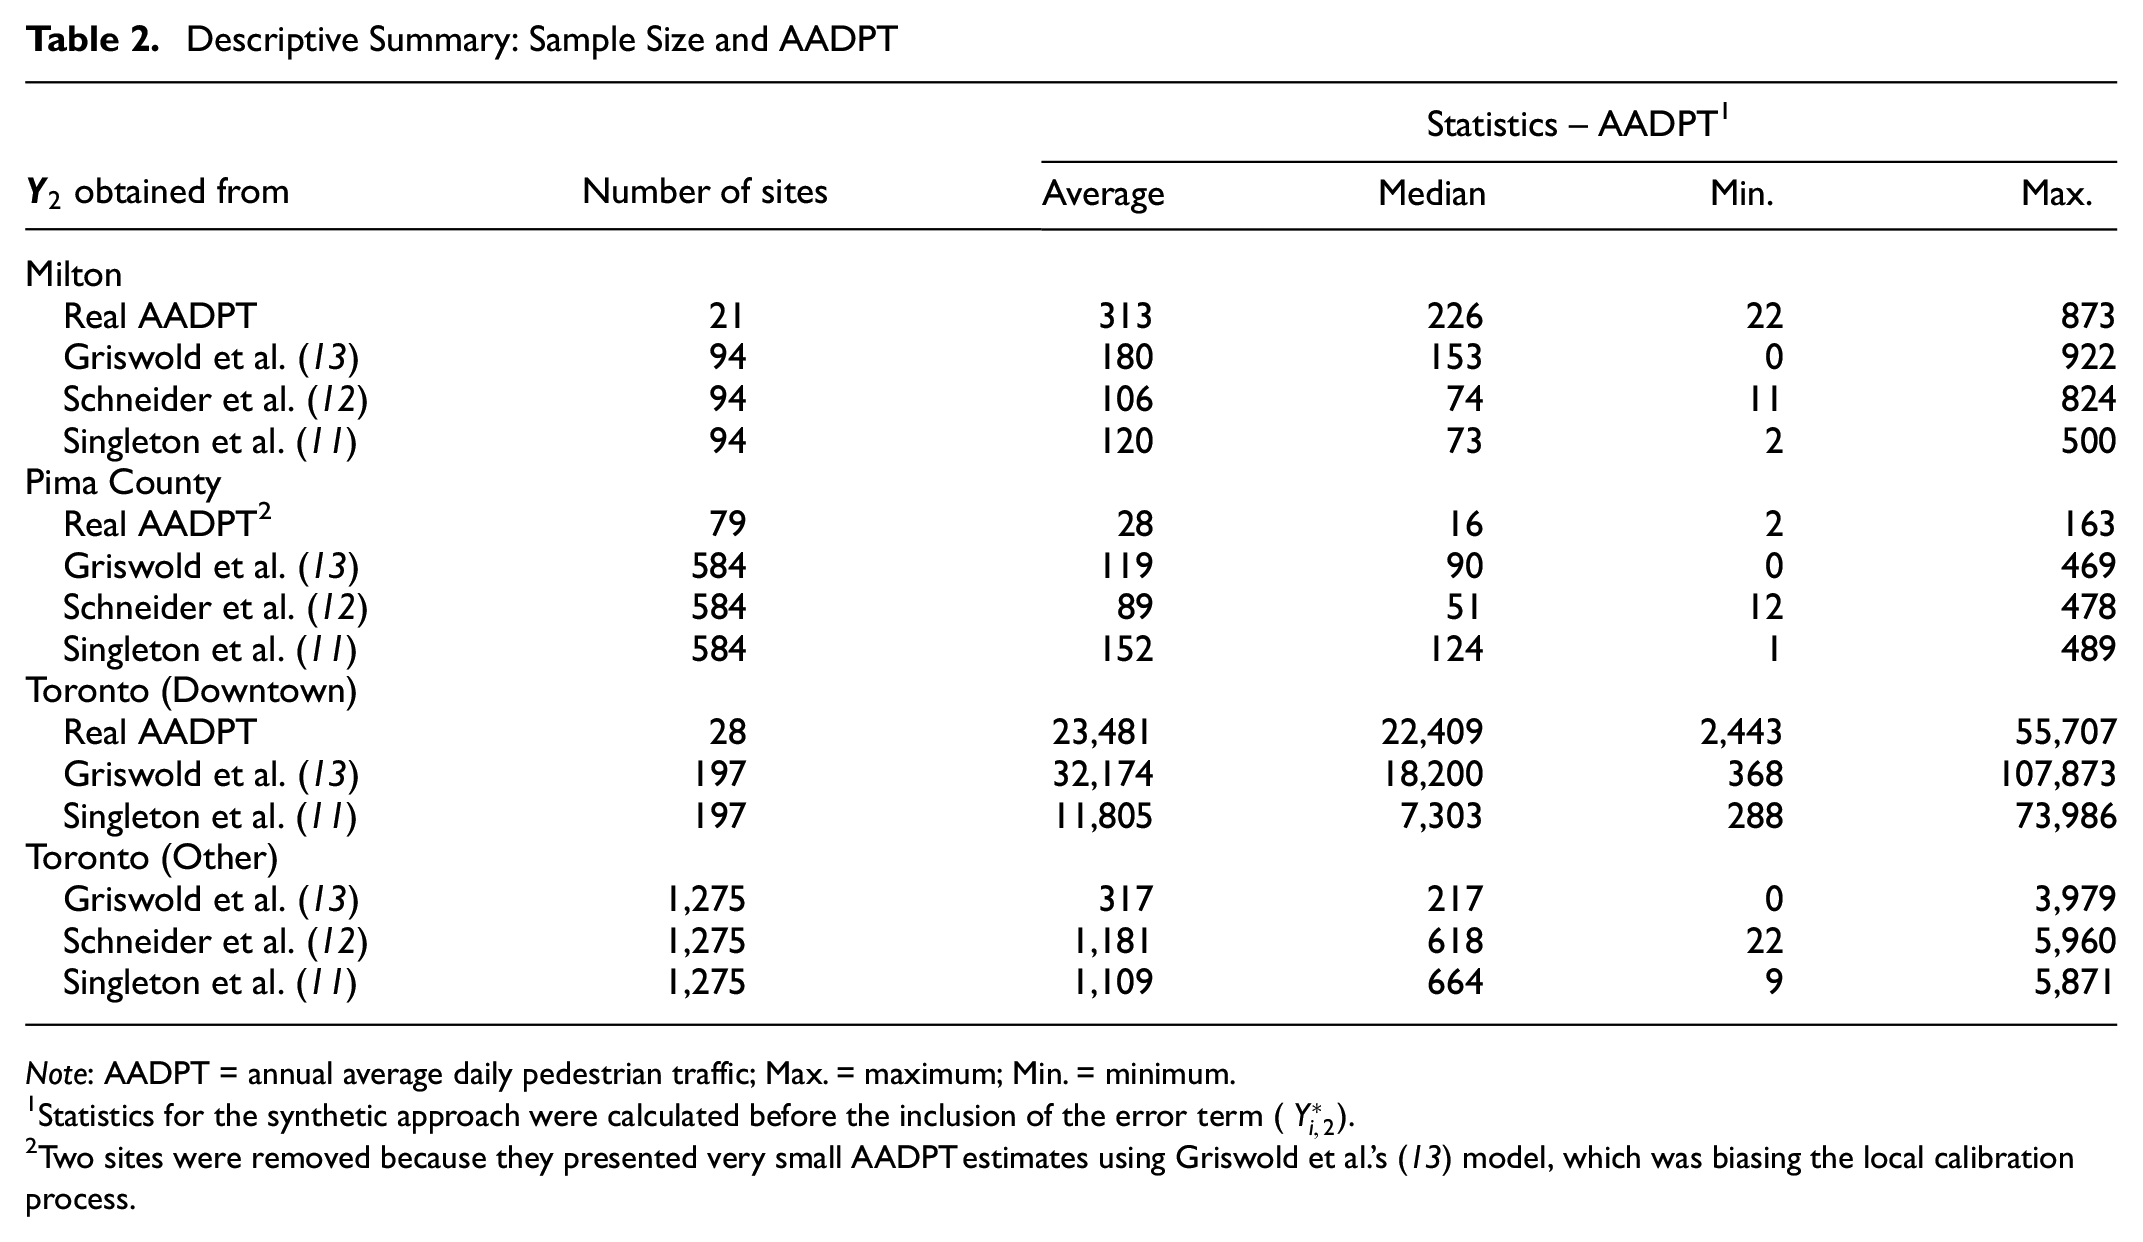
Note: AADPT = annual average daily pedestrian traffic; Max. = maximum; Min. = minimum.
Statistics for the synthetic approach were calculated before the inclusion of the error term (
Two sites were removed because they presented very small AADPT estimates using Griswold et al.’s ( 13 ) model, which was biasing the local calibration process.
From Table 2 it can be observed that the synthetic data showed similar, but not exactly the same, tendencies across jurisdictions as do the real AADPT data. For example, the real data showed that the Downtown Toronto sites had much larger AAPDT than the other jurisdictions. This difference was also reflected in the synthesized data. However, the real data also exhibited a larger mean and median for Milton than Pima County, but for the synthesized data, the mean and median values were much more similar. It is also worth noting that some of the synthetic datasets presented AADPTs with similar central tendencies, for example the models of Singleton et al. ( 11 ) and Schneider et al. ( 12 ) provided very similar synthesized data when applied to Milton and when applied to Toronto-Other. This had an impact on the performance of the local calibration models, and this is discussed in the next section.
Local Calibration Using Synthetic AADPTs
Figure 3 presents a sample of the results obtained with the local calibration using the synthetic datasets. Each graph represents the local calibration of a given DD model to a given target jurisdiction in which synthetic AADPTs were generated using a given DD model. In total, 31 graphs were created (for Milton, Pima County, and Toronto-Other, nine graphs were generated for each jurisdiction. For Toronto-Downtown, Schneider et al.’s ( 12 ) model could not be applied, so there were only four combinations for this jurisdiction). Note that we also considered the case where a DD model was transferred to a jurisdiction in which the synthetic AADPTs were generated using the same DD model (Figure 3f). Our intention was to evaluate the local calibration in scenarios where the target jurisdiction has an identical relationship between pedestrian activity and socioeconomic/land-use features to the one observed in the jurisdiction where the model was originally developed.
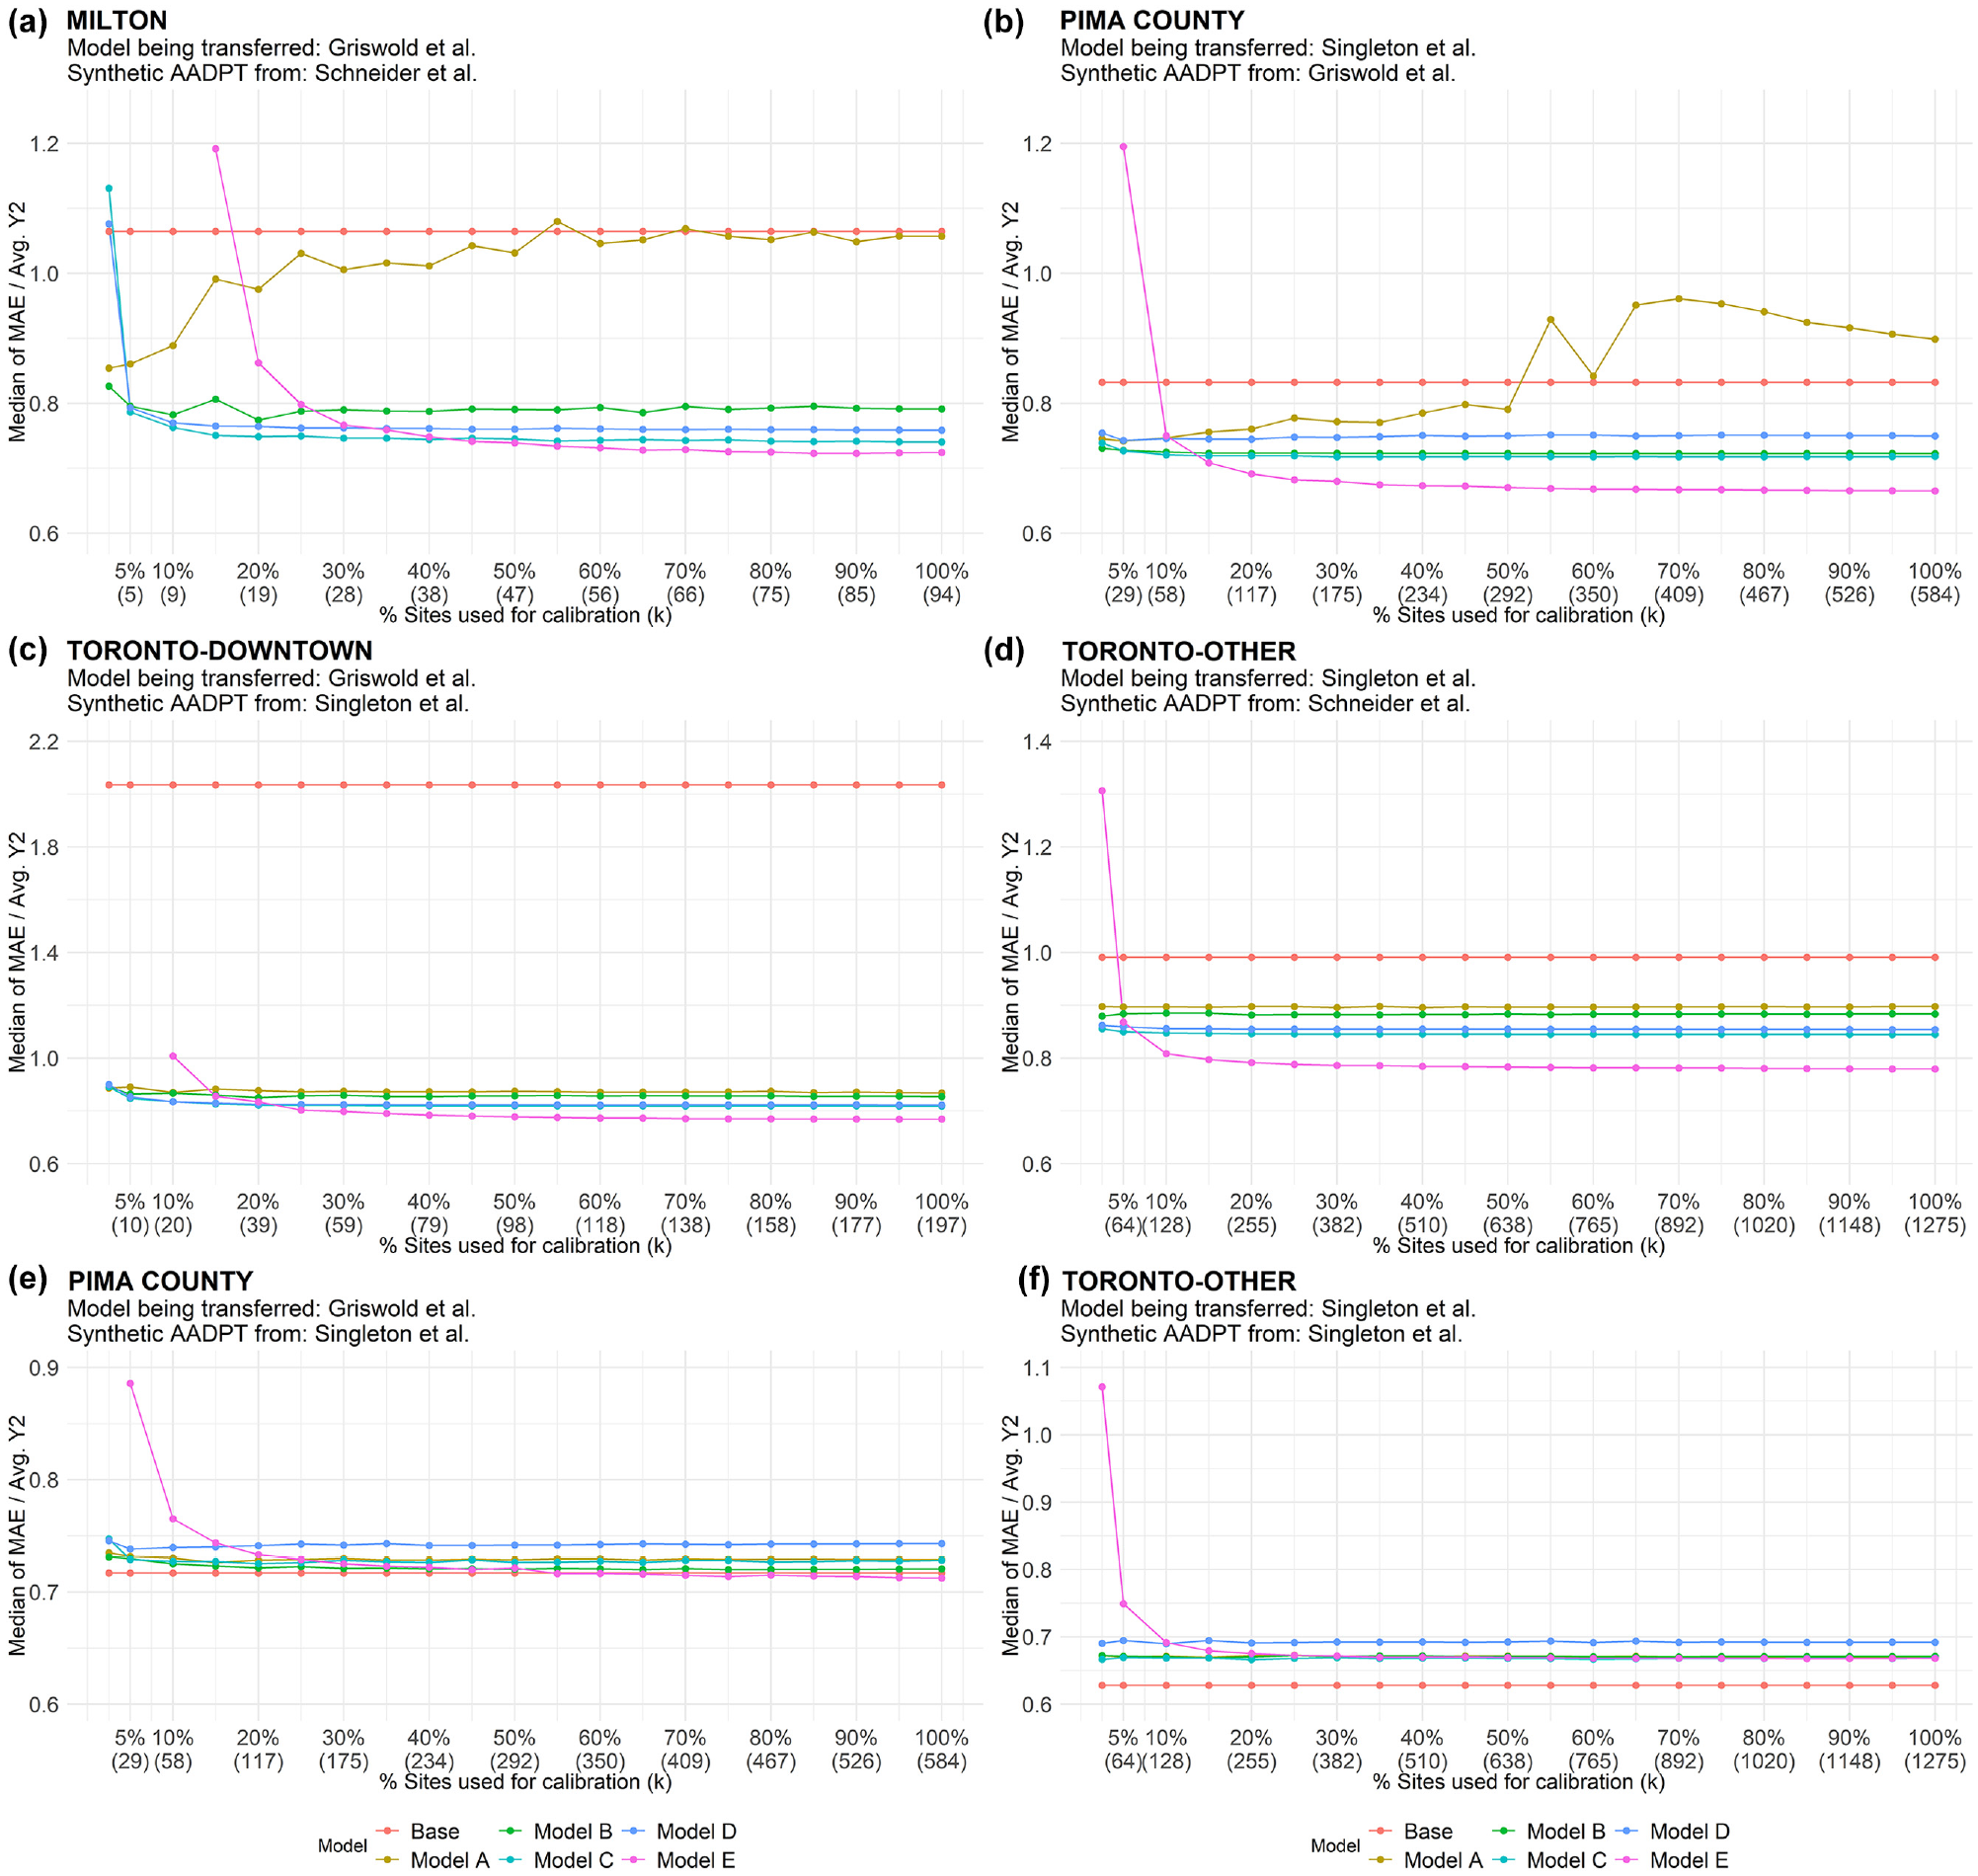
Results of local calibration using synthetic AADPTs: (a) Milton (Griswold et al./Schneider et al.); (b) Pima County (Singleton et al./Griswold et al.); (c) Toronto-Downtown (Griswold et al./Singleton et al.); (d) Toronto-Other (Singleton et al./Schneider et al.); (e) Pima County (Griswold et al./Singleton et al.); and (f) Toronto-Other (Singleton et al./Singleton et al.)
Each point in the Figure 3 graphs represents the median of the error indicator,
The performance of the local calibration models varied significantly across the graphs in Figure 3. Figure 3, a to d , presents situations in which one or more local calibration models produced improvements when compared with the base model (i.e., naïve transferability). However, Figure 3, e and f , shows cases where the effect of local calibration was null or negative. The main reason for the variability in the performance was associated with the level of similarity of the relationship between pedestrian activity and socioeconomic/land-use features in the target jurisdiction and in the one where the DD model was originally developed. One would expect the local calibration to provide improvements when the two jurisdictions exhibit different pedestrian activity relationships, especially if systematic underestimation or overestimation in the AADPT obtained from naïve transferability is observed. Local calibration Models A to D (Equations 2 to 5) were formulated to address scaling differences between pedestrian activity in the two jurisdictions. Conversely, the local calibration would be expected to be less beneficial when the two jurisdictions are very similar.
Model E (Equation 6) was expected to be beneficial when differences in the two jurisdictions were not predominantly a global scaling but reflected different levels of pedestrian activity for specific explanatory variables (e.g., a retail place generates X times more trips in the target jurisdiction than in the jurisdiction where the model was developed, but schools generate Y times more trips and X and Y are not similar). However, a review of all 31 graphs produced revealed that it was necessary for observed AADPT data to be available from at least 70% of the total sites before Model E provided results that were better than the base model. From a practical perspective, this suggests that local calibration Model E was only preferred under conditions when it would be both possible and desirable to develop a DD model directly for the target jurisdiction using the available data.
Figure 4 illustrates the effect of similarity of jurisdictions on local calibration model performance. Figure 4a shows a scatterplot between the naïve AADPT estimates using Griswold et al. (
13
) and the synthetic AADPT estimates using Schneider et al. (
12
) for Milton. This represents one of the 10 datasets used to obtain Figure 3a, where the local calibration performed well. One may notice that overestimation prevailed in Figure 4a, which is the reason why the
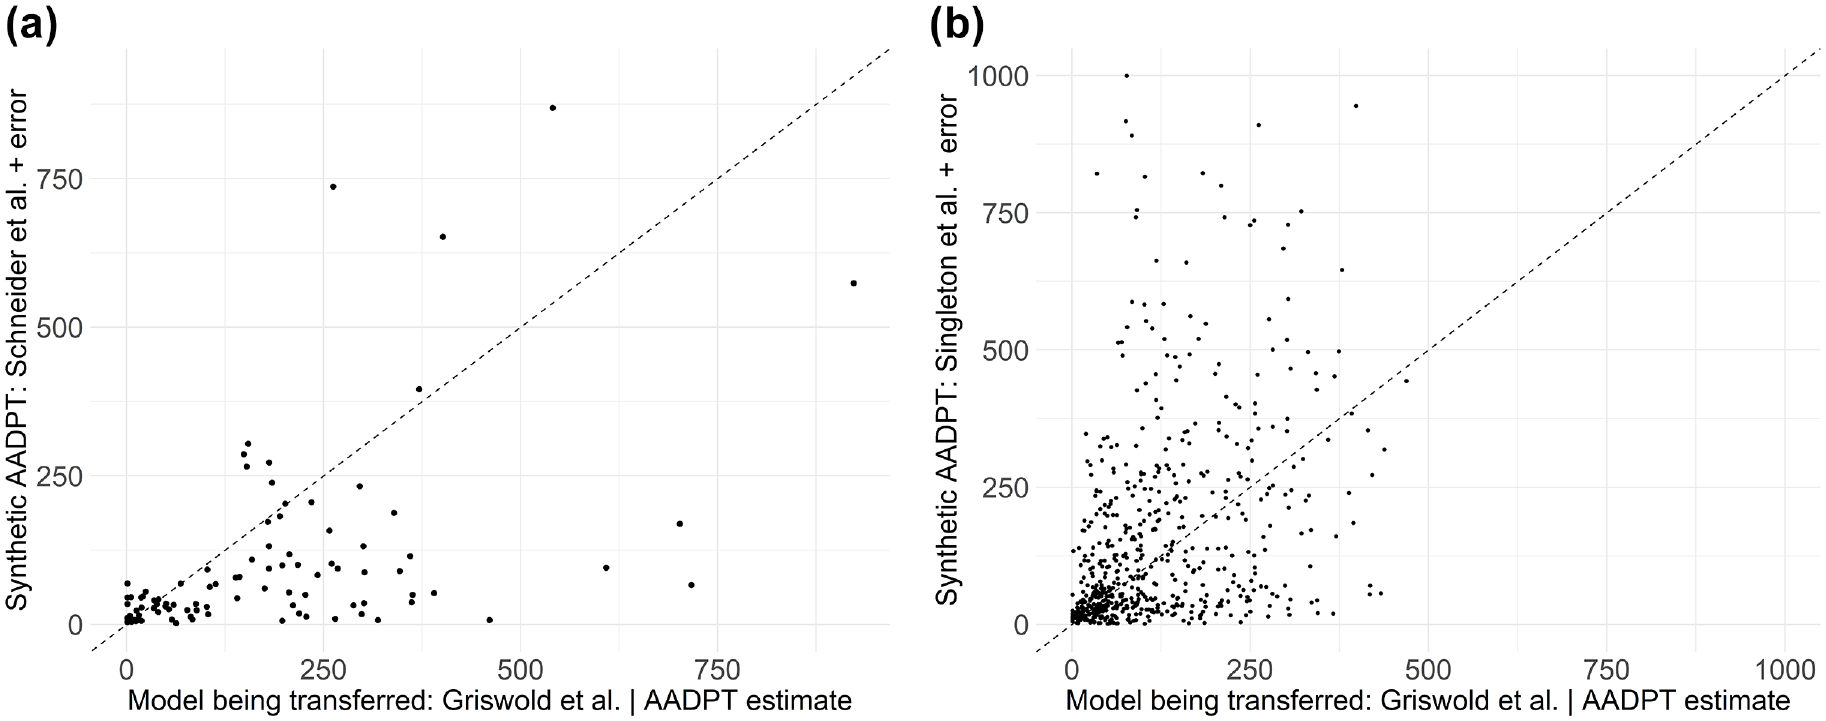
Scatterplots of estimated AADPT versus synthetic AADPT: (a) Milton, and (b) Pima County.
Local calibration Model A presented a different pattern (i.e., error increased as more sites were available for local calibration) than the other local calibration models in Figure 3, a and
b
, and this difference was also observed in some of the graphs that were not displayed in this work. This pattern occurred because of how Model A was formulated (Equation 2). Take the example where the ratios between the observed AADPT (
Consistent patterns for the performance of Models B to E across the graphs were observed in Figure 3. When small percentages of the total sites were available for local calibration (e.g., 2.5% and 5%), Models B to D outperformed Model E. Model E turned out to be the best option when a relatively large sample of sites was available for the local calibration (between 50 and 100 sites, depending on the jurisdiction). However, if this amount of information was availabl it would probably be preferable if the jurisdiction developed its own DD model instead of transferring and locally calibrating a DD model developed in another jurisdiction. Further research is required to confirm this statement.
Table 3 presents a summary of all 31 synthetic applications, considering the use of 10% of the sites for the local calibration. Each cell of Table 3 represents the median of
Although similar performances were observed between Models B to D, Models B and C performed slightly better than the others.
The “cost” of applying the local calibration to a jurisdiction that is similar to the one where the DD model was originally developed was low. This was exemplified by the 11 cases where the same DD model was used for both synthetic generation and local calibration. For these 11 cases, the use of local calibration Models B and C resulted in errors that were, on average, 5.7% (95% CI: 4.4% to 7.0%) larger than using naïve transferability (base model). Note that in these cases, the base model represented the best estimate that one could get, since the only difference between observed and predicted AADPTs was the random error term that was added when generating the synthetic AADPTs. Therefore, the cost may be overestimated for practical applications because it is unlikely that two different jurisdictions will present exactly the same relationship between pedestrian activity and socioeconomic/land-use features.
The “benefit” of applying the local calibration to a jurisdiction that is not necessarily similar to the one where the DD model was originally developed was about 2.5 times greater than the estimated cost in the previous item. This scenario was represented by the 20 cases in which different DD models were used for generating the synthetic AADPTs and for transferability. For these cases, the use of local calibration models B and C resulted in errors that were, on average, 14.6% (95% CI: 6.7% to 22.4%) lower than using naïve transferability (base model).
Summary of the Synthetic AADPT Approach using 10% of Sites for Local Calibration
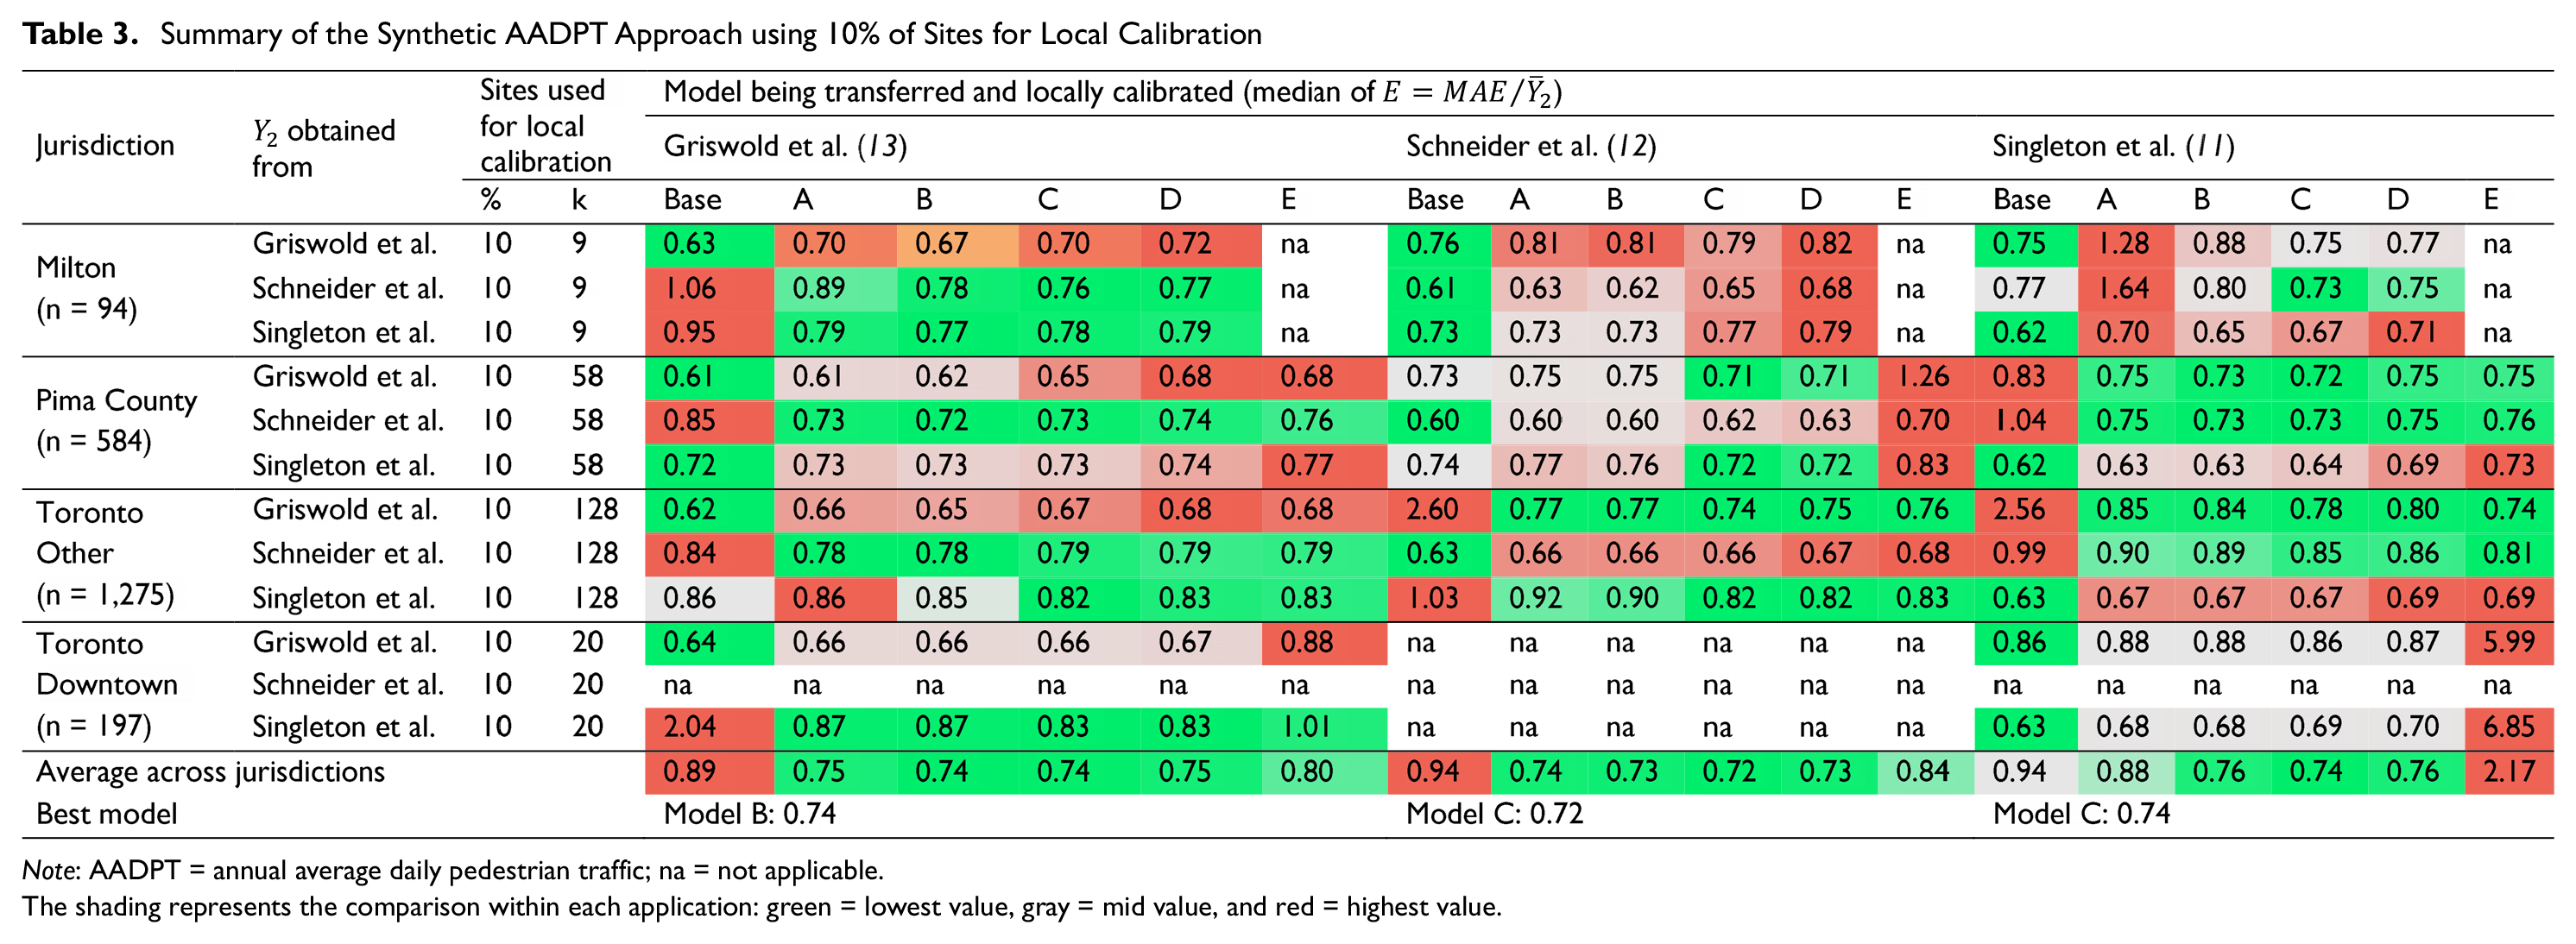
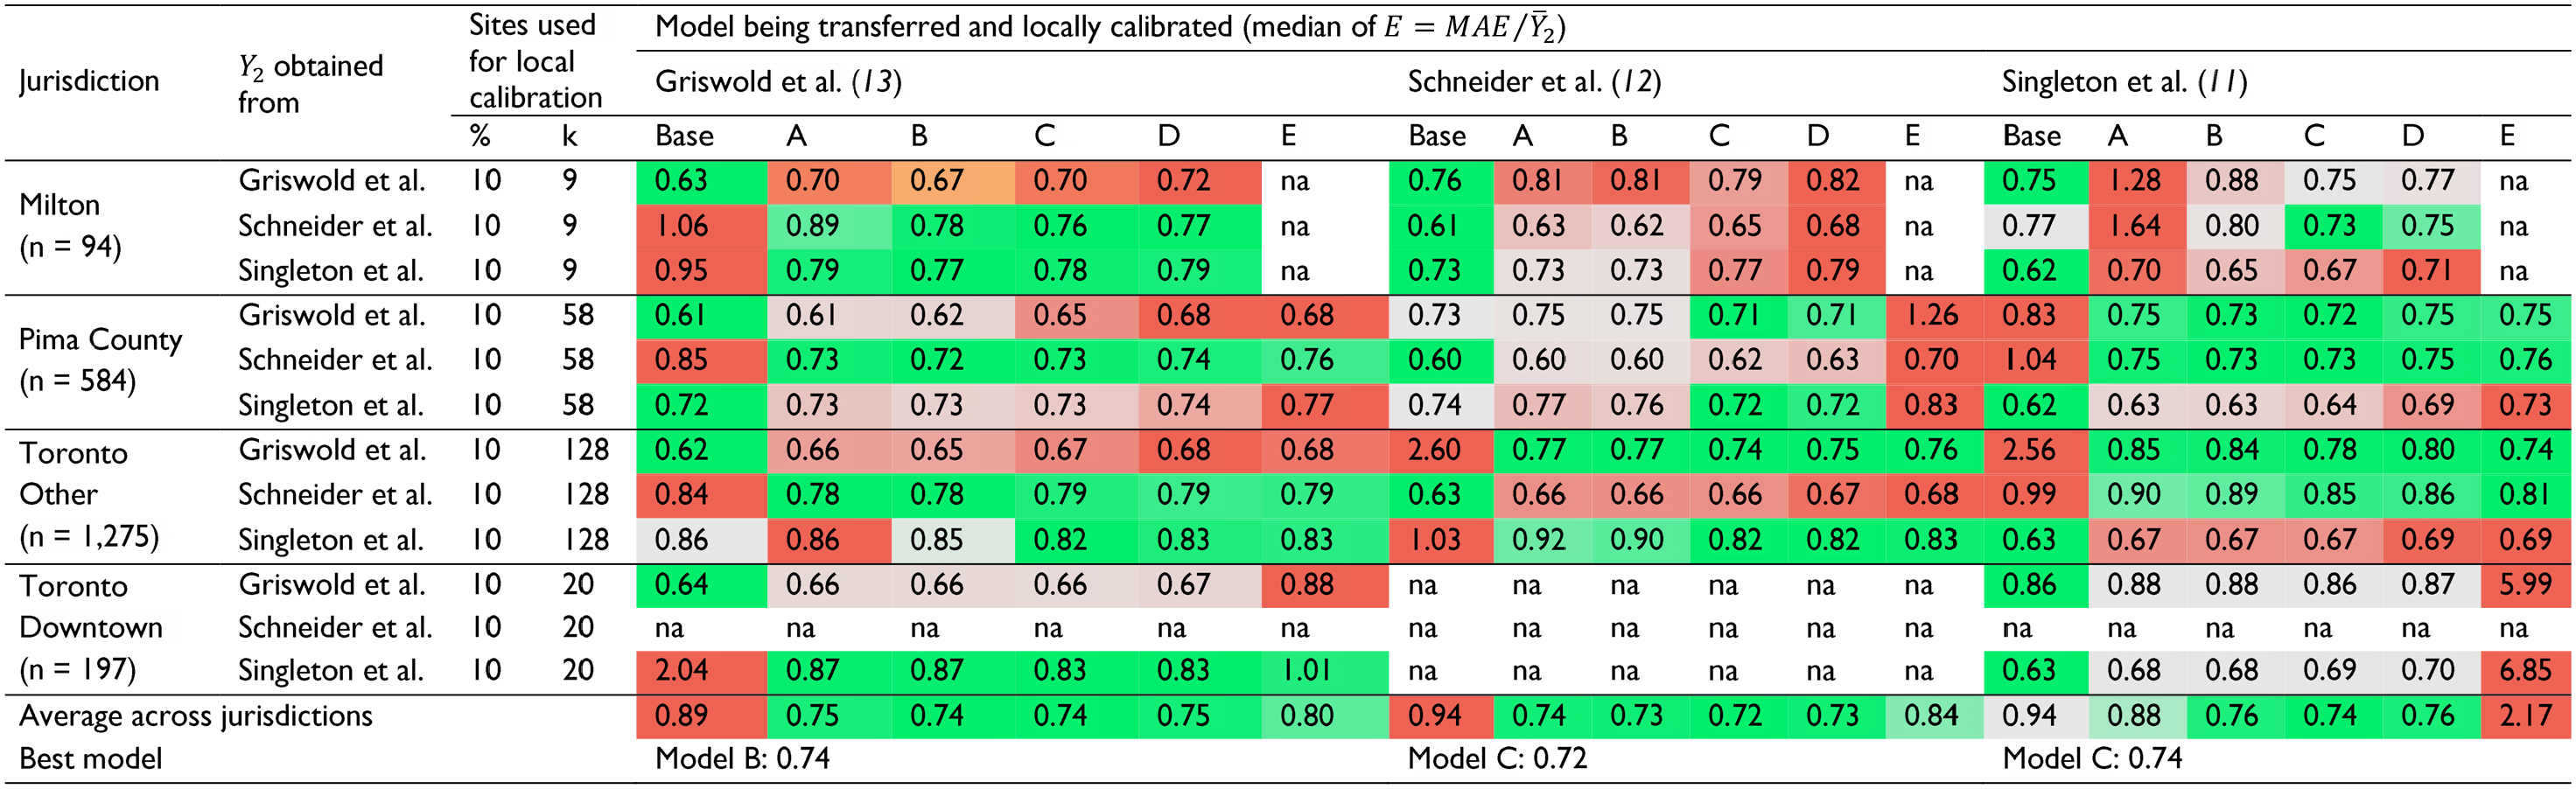
Note: AADPT = annual average daily pedestrian traffic; na = not applicable.
The shading represents the comparison within each application: green = lowest value, gray = mid value, and red = highest value.
Detailing the performance of Models B and C, Figure 5 presents the average and the 95% confidence interval around the average of the percent difference in error indicator, E, when comparing Models B and C to the base model. Each element of Figure 5 was calculated using information from the 31 different applications (i.e., including cases where jurisdictions were similar and when they were different). Positive values mean an increase in error indicator E with the local calibration, whereas negative values refer to improvements in the transferability (decrease in error). It was observed that Model B outperformed Model C when 2.5% of the sites were used for the local calibration, but we could not statistically confirm the difference in the average performance of the models (p-value for a two-tailed hypothesis test = 0.13). When 5% or more was available, the performance was similar, with Model C showing slightly better results. It was also seen that the performance was steady after reaching 10% of sites. Consequently, collecting AADPT for 10% of the sites may be the ideal number for jurisdictions that are interested in applying this approach. The application of Model C using 10% of sites resulted in an average improvement of 8.7% (95% CI: 0.6% to 16.9%). The smaller improvement values were associated with cases in which the jurisdictions were the same or similar, and large improvement values with cases in which jurisdictions exhibited greater differences.
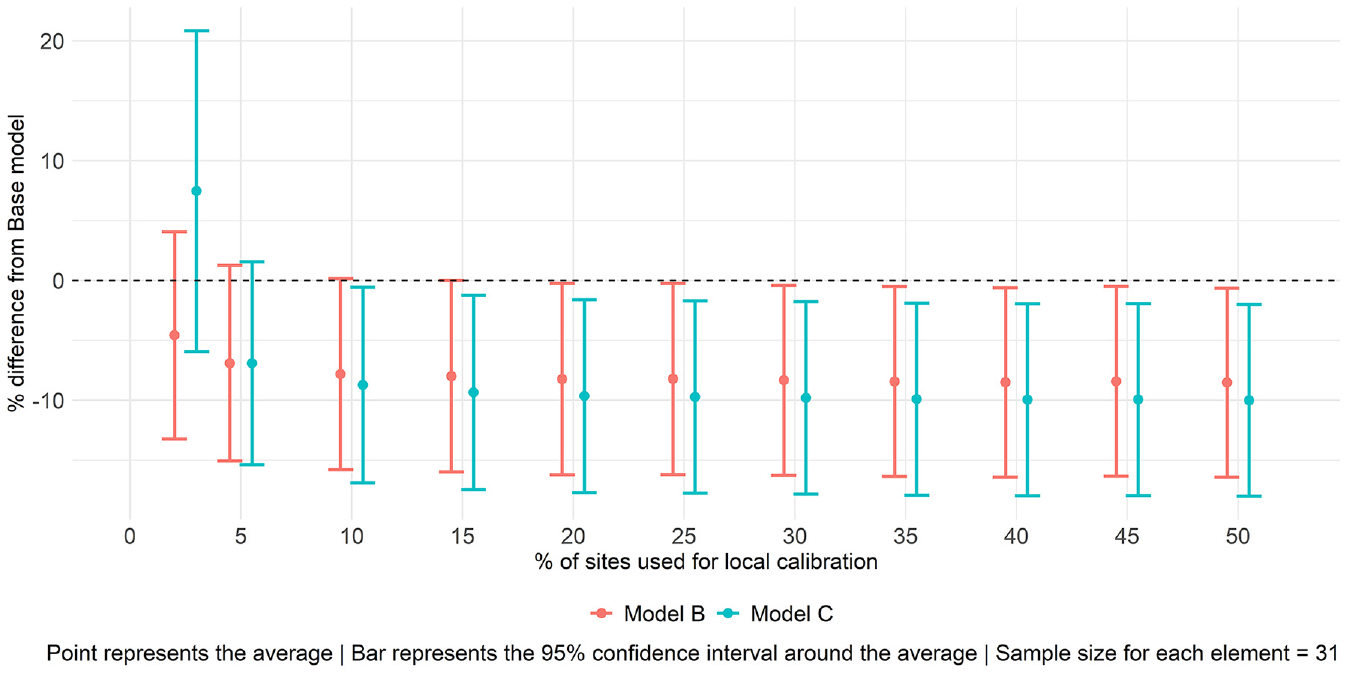
Performance of Models B and C when compared with the base model (negative values indicate improved accuracy versus base model).
We frequently associated the performance of the local calibration with the level of similarity between the target jurisdiction (where AADPT was synthetically generated using a DD model) and the jurisdiction where the DD model that was being transferred was developed. We tested three DD models that included different explanatory variables collected within different radii. In addition, we only had access to the brief descriptive analysis (e.g., average, standard deviation, minimum, and maximum) presented in the original papers to characterize each jurisdiction. Consequently, our ability to comprehensively understand the synthetic AADPTs that were generated and compare the land-use and socioeconomic attributes of the jurisdictions was constrained. This is why we could not perform a thorough analysis and limited ourselves here to investigating the differences between synthetic and estimated AADPT (Figure 4). The local calibration using real AADPTs is assessed in the next section. This allowed us to have better control over the observed AADPTs, the characteristics of the target jurisdictions (Figure 1), and the performance of the naïve transferability (Table 1); therefore, we were able to explore the effect of the level of similarity between the two jurisdictions in more detail.
Local Calibration Using Real AADPTs
Table 4 summarizes the local calibration using real AADPTs. As the number of sites where real AADPT was known was very limited, a local calibration was conducted employing small samples (at five or six sites). The results indicated that on average Model C performed the best, an outcome that was consistent with the results from the synthetic approach.Before detailing the results, we suggest the reader revisit Figure 1 and Table 1. Milton was observed to be similar to the jurisdictions where the DD models were originally calibrated with regard to attributes (Figure 1) and pedestrian activity (similar average AADPT for the application in Table 1). Pima County presented reduced magnitudes in both attributes and pedestrian activity (average observed AADPT = 28); however, the transferability of the DD models resulted in systematical overestimation of the AADPTs, suggesting that the relationship between attributes and pedestrian activity (i.e., model coefficients) was different in Pima County when compared with the jurisdictions where the DD models were developed. Downtown Toronto was a particular case because overestimation and underestimation were observed when transferring the Griswold et al. ( 13 ) and Singleton et al. ( 11 ) models, respectively.
Summary of the Real AADPT Approach
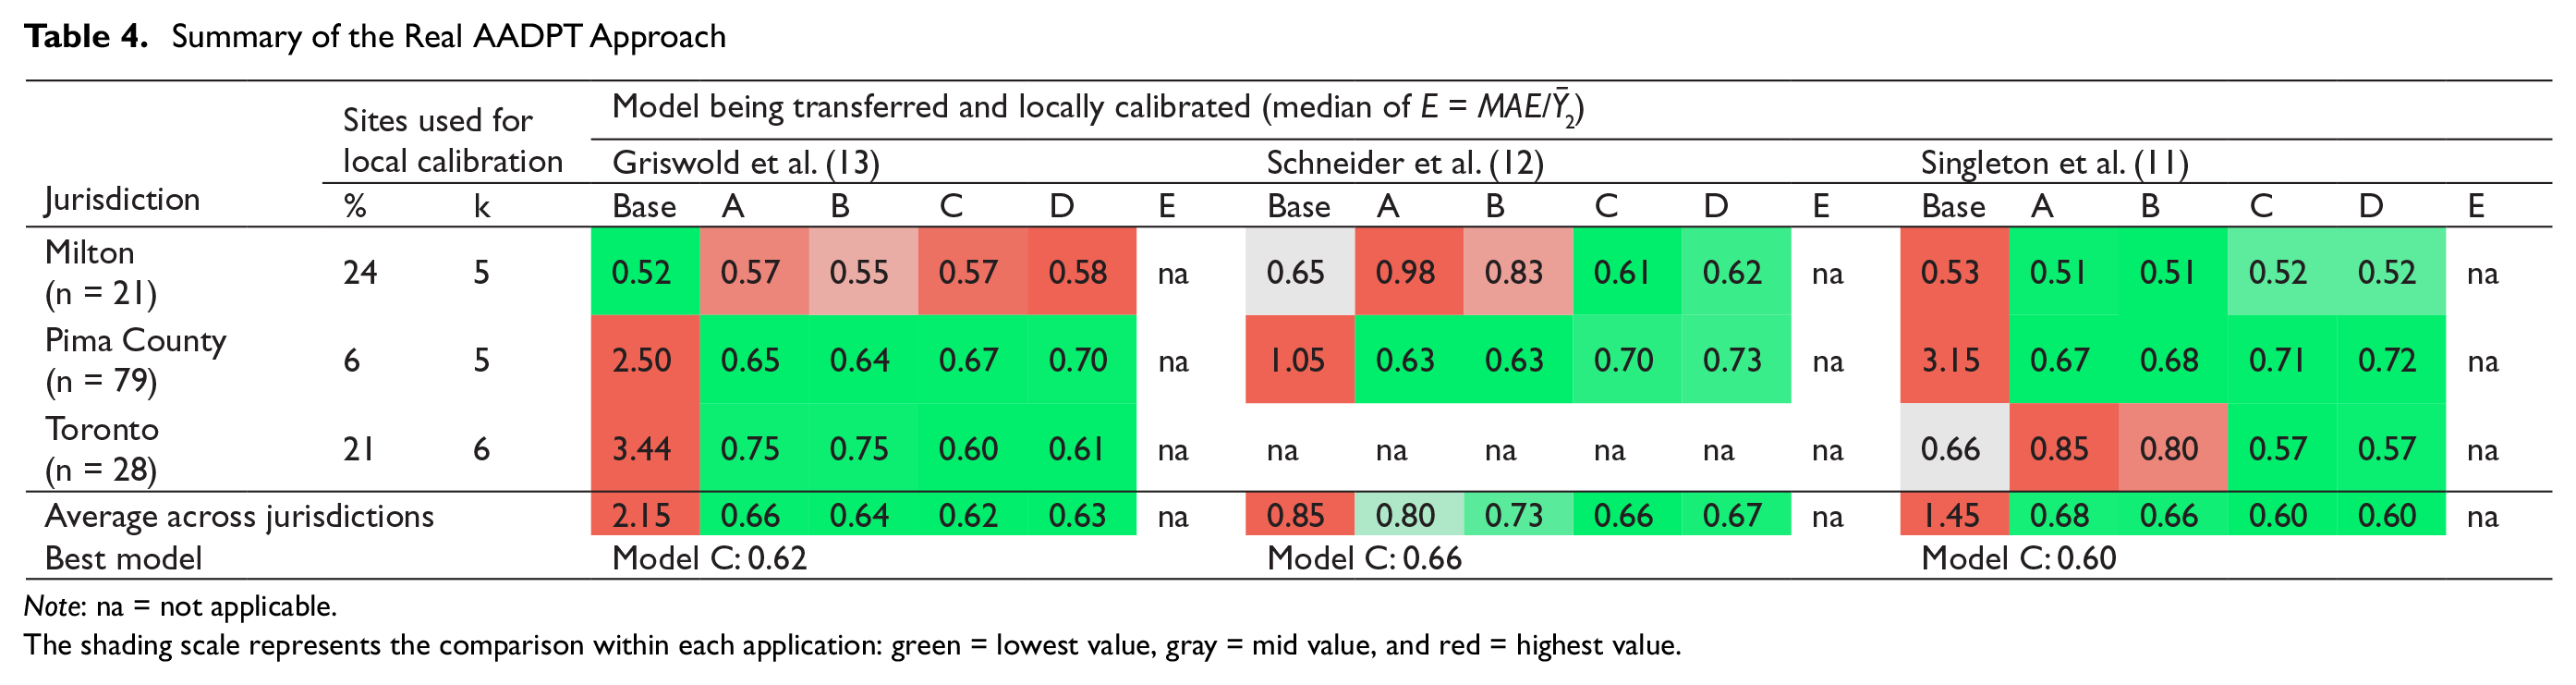
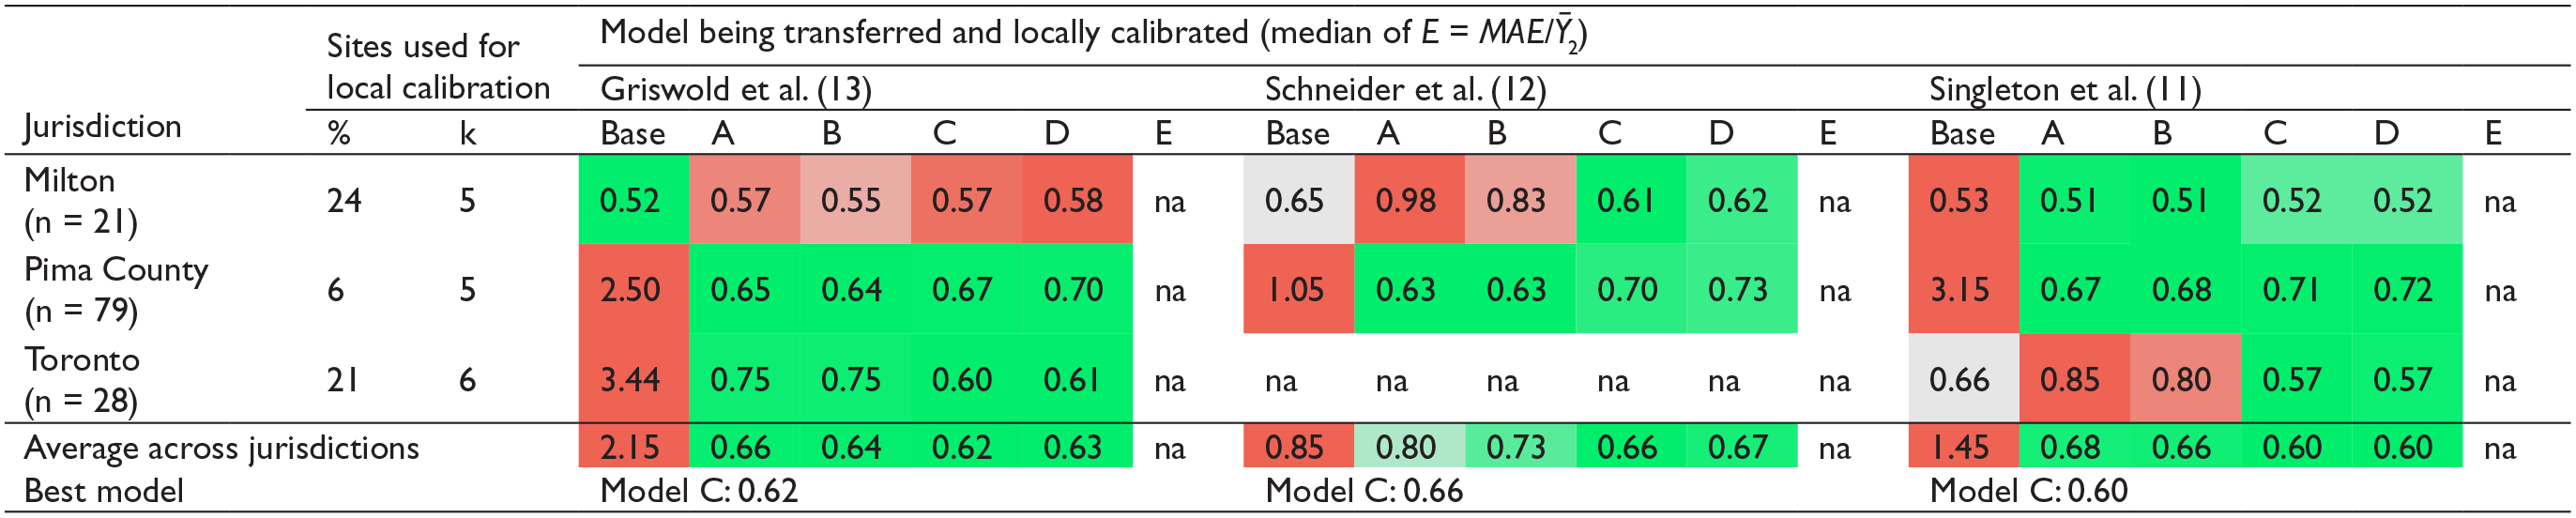
Note: na = not applicable.The shading scale represents the comparison within each application: green = lowest value, gray = mid value, and red = highest value.
The naïve transferability (base model) of the DD models for Milton performed well, providing accuracy that was compatible with—and sometimes better than—the benchmark measure of
The results for the Pima County and Toronto jurisdictions were different. The base model (naïve transferability) performed poorly, and systematic overestimation and underestimation were observed for Pima County and Toronto, respectively. Significant improvements in the error metric
Considering the results of the eight applications presented in Table 4, Model C provided an average improvement of 35.0% (95% CI: 4.5% to 65.4%) when compared with the base model (naïve transferability). These results corroborated with the findings using the synthetic AADPT approach, specifically:
If the target jurisdiction and the one where the DD model was originally developed are similar in the relationship between pedestrian activity and socioeconomic/land-use features, local calibration provided modest improvements over naïve transferability. This situation can be observed in Table 4 for the application of Griswold et al. ( 13 ) and Singleton et al. ( 11 ) models to the Milton sites. That local calibration did not provide significant benefits for these cases is acceptable because when the jurisdictions are very similar, then naïve transferability can be expected to provide adequate results.
When the jurisdictions were different, local calibration showed great potential for improving performance versus naïve transferability, even when the number of sites where AADPT was known was very limited. This is evident from Table 4 for the application of the local calibration models to the Toronto and Pima County sites.
Conclusions
This work examined the enhancement of the spatial transferability of DD models available in the literature. The models were locally calibrated in the target jurisdictions by making use of sites where AADPT is readily known. To perform the local calibration, five models were proposed and tested using datasets with (a) synthetic AADPT and (b) real AADPT. The results showed great potential for the local calibration to improve the naïve transferability of DD models.
For the synthetic application, 31 datasets were generated. In general, it was observed that the local calibration provided substantial benefits when the target jurisdiction and the one where the DD model was originally calibrated were different in relation to the relationship between pedestrian activity and socioeconomic/land-use features. In this case, an average improvement of 14.6% (95% CI: 6.7% to 22.4%) was observed when compared with the naïve transferability. Conversely, when the two jurisdictions were identical, use of the local calibration made the prediction slightly worse (average: 5.7%; 95% CI: 4.4% to 7.0%). The benefits were about 2.5 times greater than the “costs,” and one would not expect two jurisdictions to show the exact same pattern between pedestrian activity and socioeconomic/land-use features, indicating that the costs were probably overestimated.
As to the best model for performing the local calibration, Models B and C stood out. When 2.5% of the sites were used for local calibration, Model B outperformed Model C. The performances were comparable when 5% or more was available, with Model C producing slightly better results. The application of Model C using 10% of sites resulted in an average improvement of 8.7% (95% CI: 0.6% to 16.9%).
The results achieved from the real AADPT approach corroborated the findings from the synthetic approach. The naïve transferability for Milton already provided very reasonable results (
From a practical point of view, we offer some recommendations if one is willing to transfer and locally calibrate a given DD model:
Examine the similarities between the target jurisdiction and the one where the DD model was developed by comparing the magnitude of pedestrian activity (e.g., central tendencies of AADPT) and socioeconomic/land-use features considered in the DD model. This may give a clue as to the level of similarity between the two jurisdictions.
If a very limited sample size of sites where AADPT is known is available (i.e., 2.5% or lower), the use of Model B is recommended. Otherwise, Model C should be used.
If the target jurisdiction contains zones with different relationships between pedestrian activity and socioeconomic/land-use features, it is prudent to develop the local calibration separately for each zone. The City of Toronto illustrates this case. Downtown Toronto has a unique environment where, although trip generation attributes are also increased, the level of pedestrian activity is extremely high. One would expect the relationship between socioeconomic/land-use features and AADPT (i.e., DD model coefficients) to be different in Downtown than in the rest of the city.
Finally, we make three suggestions for future work:
This study used a combination of synthesized data and empirical data because a sufficiently large empirical dataset (in which pedestrian counts had not been affected by COVID-19) was not available. And though the empirical data analysis provided results that were consistent with those obtained from the analysis of the synthesized data, it would be prudent to confirm the results obtained from the synthetic approach using a database with larger sample sizes of sites where the real AADPT is known.
This work used only sites where CC stations were available, so relatively reliable AADPT estimates were considered. Many jurisdictions have STCs for a large proportion of their intersections, but a relatively small number of continuous count stations. It is recommended to extend the work from this study to examine the potential for performing local calibration of DD models with STCs expanded to AADPT or even unexpanded STCs.
It is recommended to investigate the optimal threshold (i.e., number or percentage of sites with AADPT available), separating the use of the local calibration approach from the development of a DD model for the target jurisdiction.
Footnotes
Acknowledgements
The authors gratefully acknowledge the financial support provided by Transport Canada and Natural Sciences and Engineering Research Council of Canada. The authors further gratefully acknowledge (i) the jurisdictions of Milton, Pima County, and Toronto for providing permission to use the pedestrian volume data and for providing rich open data portals that were essential sources of information for this research; and (ii) Miovision for providing access to the pedestrian data.
Author Contributions
The authors confirm contribution to the paper as follows: study conception and design: L. T. P. Sobreira, B. Hellinga; data collection: L. T. P. Sobreira, B. Hellinga; analysis and interpretation of results: L. T. P. Sobreira, B. Hellinga; draft manuscript preparation: L. T. P. Sobreira, B. Hellinga. All authors reviewed the results and approved the final version of the manuscript.
Declaration of Conflicting Interests
The authors declared no potential conflicts of interest with respect to the research, authorship, and/or publication of this article.
Funding
The authors disclosed receipt of the following financial support for the research, authorship, and/or publication of this article: This research received financial support from Transport Canada and Natural Sciences and Engineering Research Council of Canada.
Data Accessibility Statement
Some or all data, models, or code used during the study were provided by a third party. Direct requests for these materials may be made to the provider as indicated in the Acknowledgments.
The research was carried out by the authors, and the work presented in this paper solely reflects the views of the authors. No explicit or implicit endorsement of the methods or findings by funding agencies or by any of the aforementioned jurisdictions/companies is claimed or implied.