
Abstract
Direct demand (DD) models are used to estimate pedestrian volumes at intersections as a function of readily available variables, such as land use and socioeconomic features. The objectives of this paper are: (1) to identify and qualitatively assess existing DD models in the literature; and (2) to evaluate the spatial transferability of DD models for estimating annual average daily pedestrian traffic (AADPT) at signalized intersections. Six DD models developed from jurisdictions with varying characteristics were selected for spatial transferability assessment. The models were applied to three jurisdictions (Milton, Canada; Pima County, U.S.; and Downtown Toronto, Canada) that had notable differences in the level of pedestrian activity, land use, and socioeconomics. Observed pedestrian volumes were obtained for sites in each jurisdiction. The DD models performed considerably differently across jurisdictions. Five of the models performed reasonably well for Milton, a jurisdiction that is comparable to those considered in the calibration of the selected DD models and that shares characteristics with many suburban Canadian and U.S. jurisdictions. Overall, the applications for Pima County and Downtown Toronto, which have extremely low and high pedestrian volumes, respectively, provided poor accuracy. This paper demonstrated the potential for transferring existing DD models to other jurisdictions; but also identified the clear need for further research to improve the spatial transferability of DD models.
Over the past decade, there has been increasing support and encouragement for the use of active transportation modes ( 1 , 2 ), which has led to an increase in the number of walking trips ( 3 ). Consequently, there has also been a corresponding increasing need for explicitly incorporating pedestrian exposure (volume) within quantitative transportation system management decision making, such as safety analyses or site selection for design or operational improvement.
The two common sources for pedestrian volume data at an intersection level are short-term counts (STCs) and continuous counts (CCs) ( 4 ). STCs are normally collected manually over the course of one or more non-holiday weekdays. Typically, this information is a product of field surveys conducted for signal timing design or urban planning purposes. CCs are generally obtained from permanent count stations that provide long-term information and are useful for detecting systematic oscillations in pedestrian volumes (i.e., hourly, daily, and monthly patterns). When an adequate number of CC stations are available, STCs can be expanded to annual measures of exposure, referred to in this work as annual average daily pedestrian traffic (AADPT). Studies have suggested that pedestrian STCs should be renewed at intervals of between three and seven years ( 5 ). Given resource constraints, jurisdictions are likely to have sites (locations) for which temporally valid (i.e., sufficiently recent) STCs are not available, preventing comprehensive jurisdiction-wide exposure estimations. To address this issue, researchers have developed direct demand (DD) models to estimate pedestrian exposure without the need for STCs.
DD models are calibrated using sites where AADPT is known by associating it with explanatory variables that are easily accessible, such as land use, socioeconomics, spatial syntax, and operational and geometric features. The methods and explanatory variables used for DD modeling are well documented in the literature. There are already a variety of studies available, all of which were conducted in different types of jurisdiction and used varied sample sizes and levels of complexity (i.e., number of explanatory variables).
Developing a DD model for a local jurisdiction requires that the jurisdiction has: (a) STCs from a sufficient number of sites. Recent studies have shown that a sample size of around 50 to 70 sites is suitable for calibrating models with an R-squared of around 0.70 ( 6 – 8 ); and (b) a quantity of permanent stations that would allow the estimation of reliable expansion factors, accounting for potential spatial and temporal trends. This number probably ranges between 6 and 25 stations, depending on the jurisdiction’s characteristics. This estimate is based on the FHWA Traffic Monitoring Guide’s recommendation that there should be three to five CC locations for each factor group ( 5 ) and that a typical number of factor groups should be considered in non-motorized studies, which varies between two and five groups ( 9 – 11 ).
An alternative for jurisdictions that lack the data or resources required to develop a local DD model is to make use of an existing DD model that was calibrated in another jurisdiction. To the authors’ knowledge, no study has yet evaluated the spatial transferability of existing DD models. Consequently, the objectives of this paper are: (1) to identify and qualitatively assess existing DD models; and (2) to evaluate the spatial transferability of existing DD models for estimating AADPT at signalized intersections.
This work is divided into two parts. In the first part, state-of-the-art DD models are identified and evaluated with the goal of choosing them for the spatial transferability task. In the second part, the spatial transferability of the selected models is examined through the application of the models to sites in three different jurisdictions for which AADPT are known.
Existing Direct Demand Models
This section presents an assessment of DD models available in the literature, aiming at the selection of models calibrated in different contexts for the development of the spatial transferability task. In total, 20 studies (models) published in the past two decades were reviewed. Each model from the literature was assessed with respect to the following three criteria: (a) the number of sites in the calibration data set; (b) the model’s complexity, represented by the number of explanatory variables; and (c) the level of pedestrian activity observed in the original jurisdiction, represented by the calibration data set’s average AADPT. The application of these criteria resulted in six DD models that were then examined with respect to their spatial transferability. As an informational note to the reader, we tried to include a criterion to represent the level of accuracy of the models. However, as different performance metrics were used by each author, it was not possible to use this criterion.
Among the diversity of existing DD models, four studies stand out for having used more than a thousand sites for model calibration ( 12 – 15 ). The number of sites employed in these research projects is much higher than in other studies, which typically use between 50 and 200 sites. Kim et al. ( 12 ) developed a DD model using information from 10,000 sites in Seoul, South Korea. However, the authors employed a geographically weighted regression, where the model coefficients vary according to their location, making it impossible to transfer them to other jurisdictions. Miranda-Moreno and Fernandes ( 13 ) calibrated a DD model for Montreal, Canada based on data from 1,018 signalized intersections. The authors used 8-h pedestrian volume as the model outcome rather than the more common AADPT or annual volumes, making comparison with other models difficult. For those reasons, only Griswold et al. ( 14 ) and Singleton et al. ( 15 ) were chosen for the transferability task from the studies that applied the largest sample sizes.
In relation to the model’s complexity, a common number of explanatory variables varies between five and eight. Four of the selected DD models are within this range, and two of them exemplify extreme situations where three and fourteen variables were employed. To represent jurisdictions with different levels of pedestrian activity, studies that exhibited an average AADPT of 186 to 2,433 were chosen for the transferability task. Table 1 details the information for each of the six selected studies, including the model coefficients.
DD Models Selected for Transferability
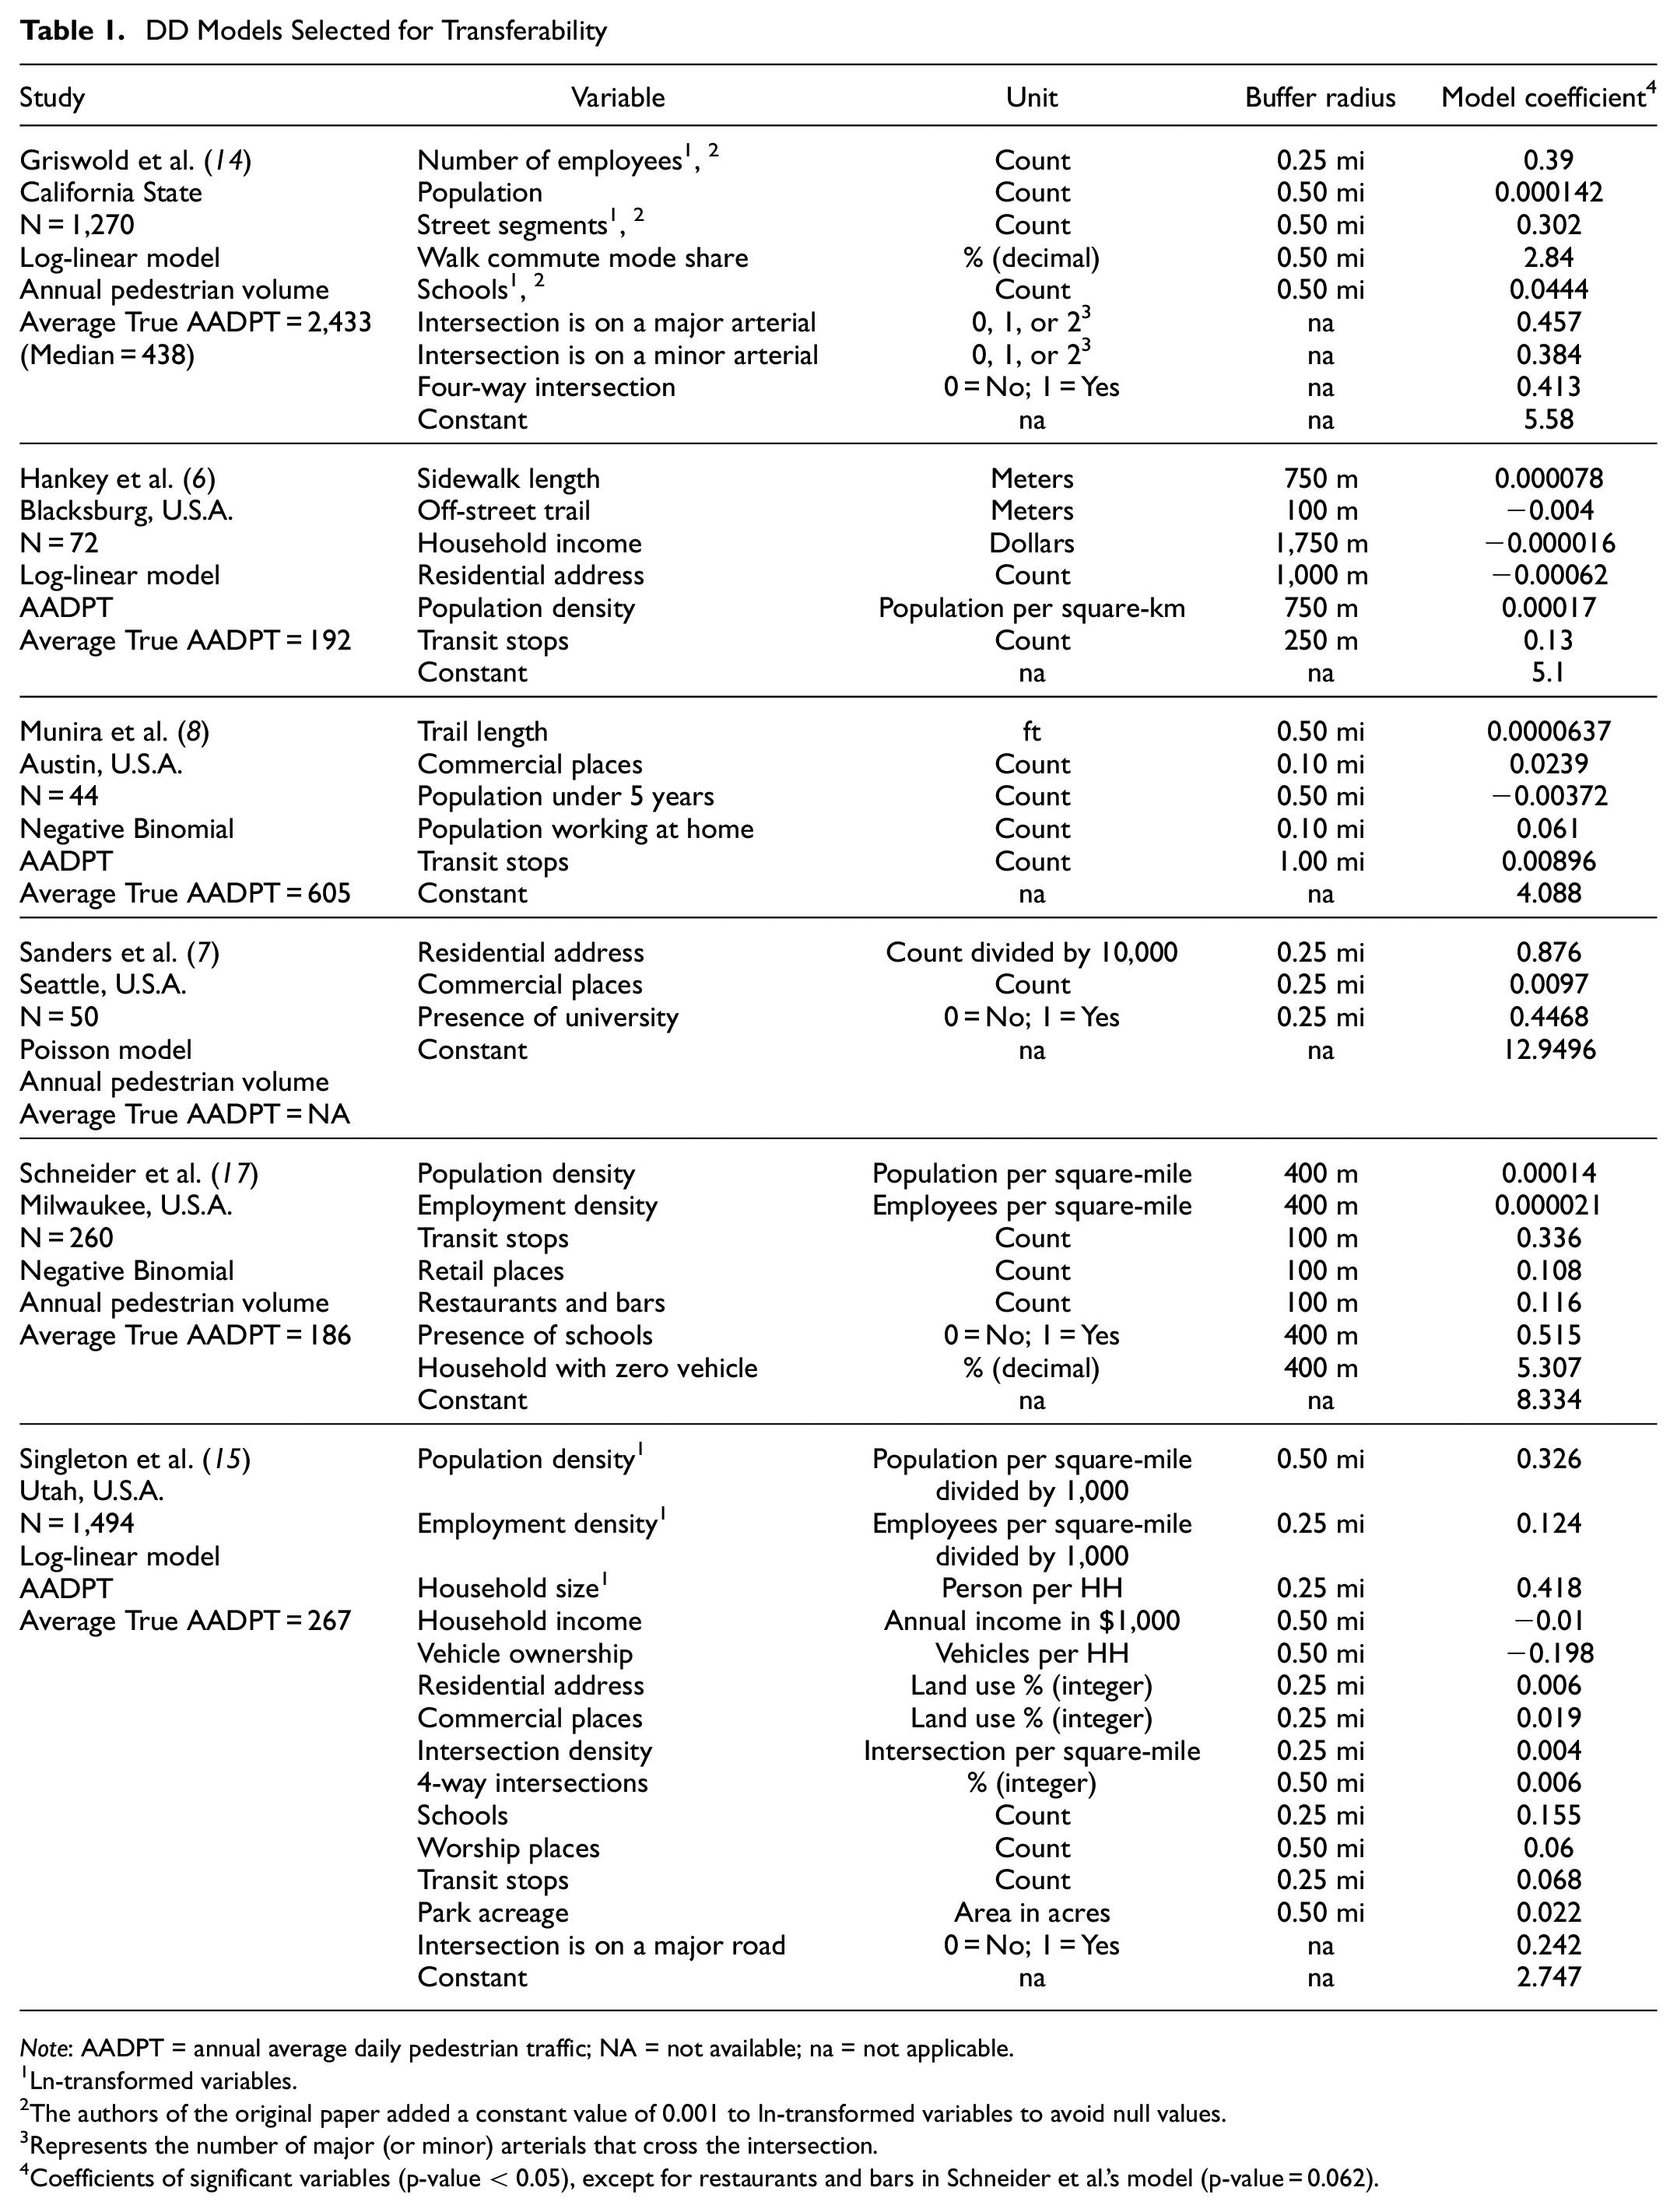
Note: AADPT = annual average daily pedestrian traffic; NA = not available; na = not applicable.
Ln-transformed variables.
The authors of the original paper added a constant value of 0.001 to ln-transformed variables to avoid null values.
Represents the number of major (or minor) arterials that cross the intersection.
Coefficients of significant variables (p-value < 0.05), except for restaurants and bars in Schneider et al.’s model (p-value = 0.062).
Table 2 presents a summary of the variables that were significant, and therefore included, in each model, divided into three categories: census-based, land use, and geometry and operation variables. With regard to census-based variables, it is observed that population and employment are important features to represent the production and attraction of trips, respectively. Besides this, the variables that characterize income and vehicle ownership indicate that increases in the level of motorization are associated with a reduced generation of walking trips. Concerning land use attributes, the presence of commercial establishments, schools, and universities in the intersection’s surroundings is linked to increases in pedestrian activity. The contribution of residential land use (e.g., sign of the coefficient) is not consistent among the models. In some models (e.g., Sanders et al. [ 7 ] and Singleton et al. [ 15 ]) the sign of the coefficient is positive indicating that increases in the number of residential addresses results in larger pedestrian volumes. In the Hankey et al model, the coefficient of residential land use is negative indicating that if the land use around an intersection is predominantly residential, the production and attraction of walking trips may be reduced. Studies have suggested that incorporating variables that represent the land use mix could be beneficial for characterizing pedestrian activity ( 16 ). In the case of geometric and operational characteristics, the presence of transit stops is certainly a generator of walking trips. Furthermore, four-way intersections and those located on major or minor arterials are associated with more pedestrian trips than three-way intersections and those located on collector streets, respectively. Similar tables to Table 2 can be found in Singleton et al. ( 15 ), Schneider et al. ( 17 ), and Munira and Sener ( 18 ).
Variables Included in each Direct Demand (DD) Model
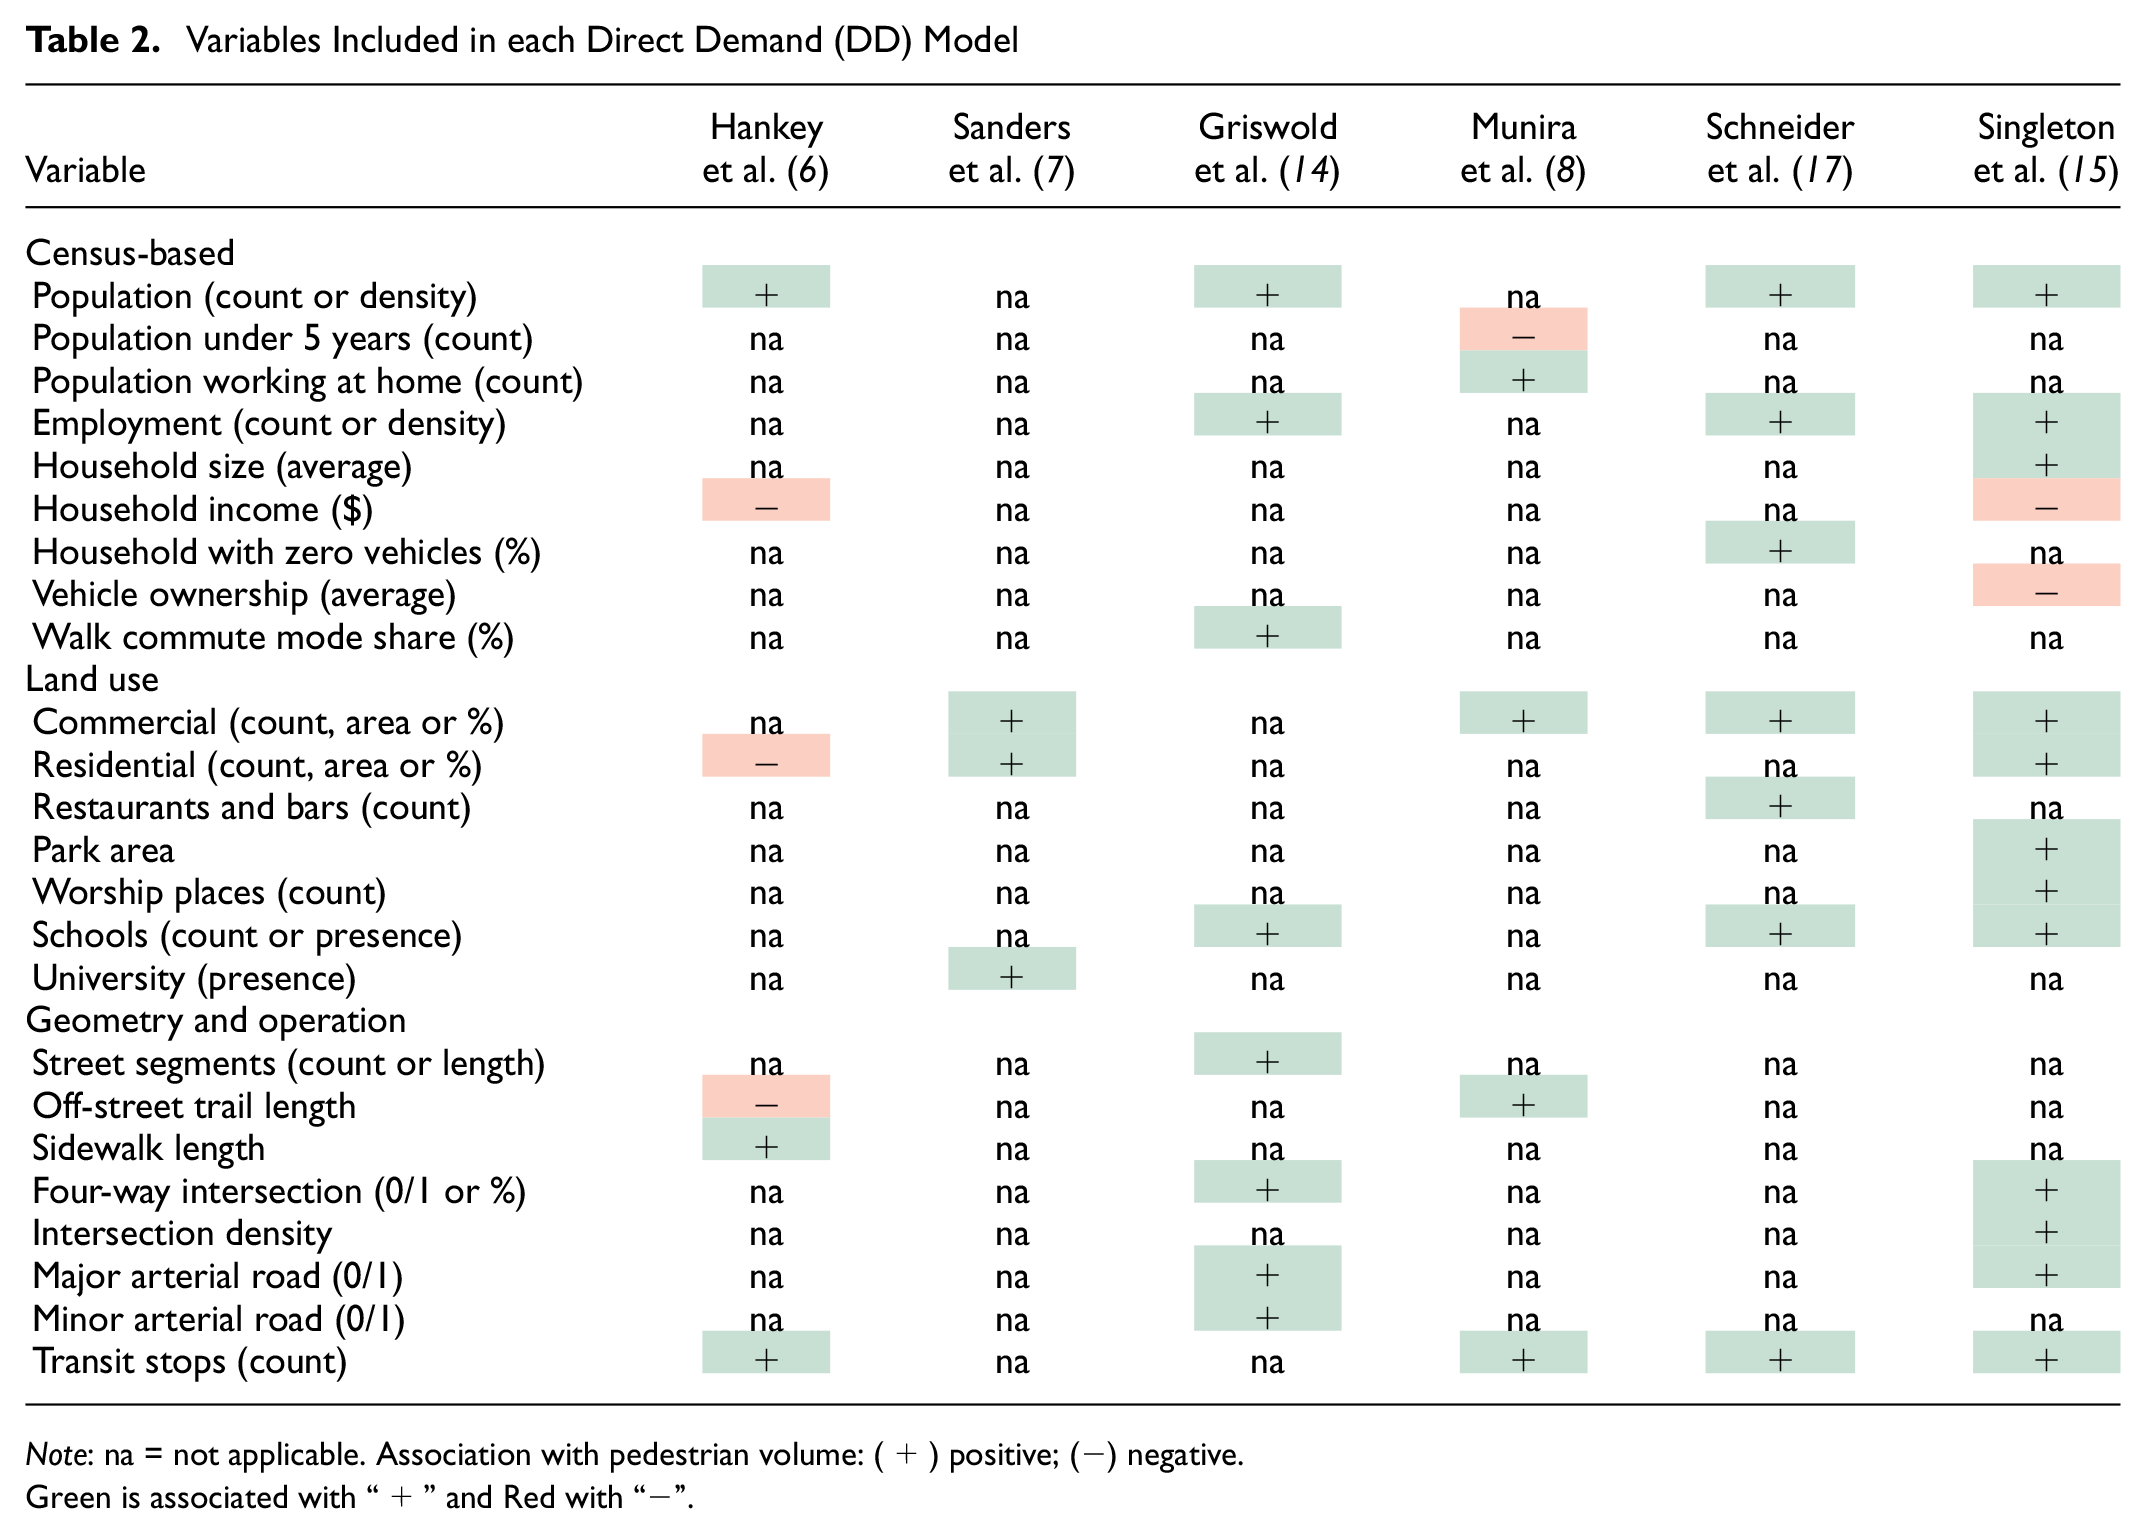
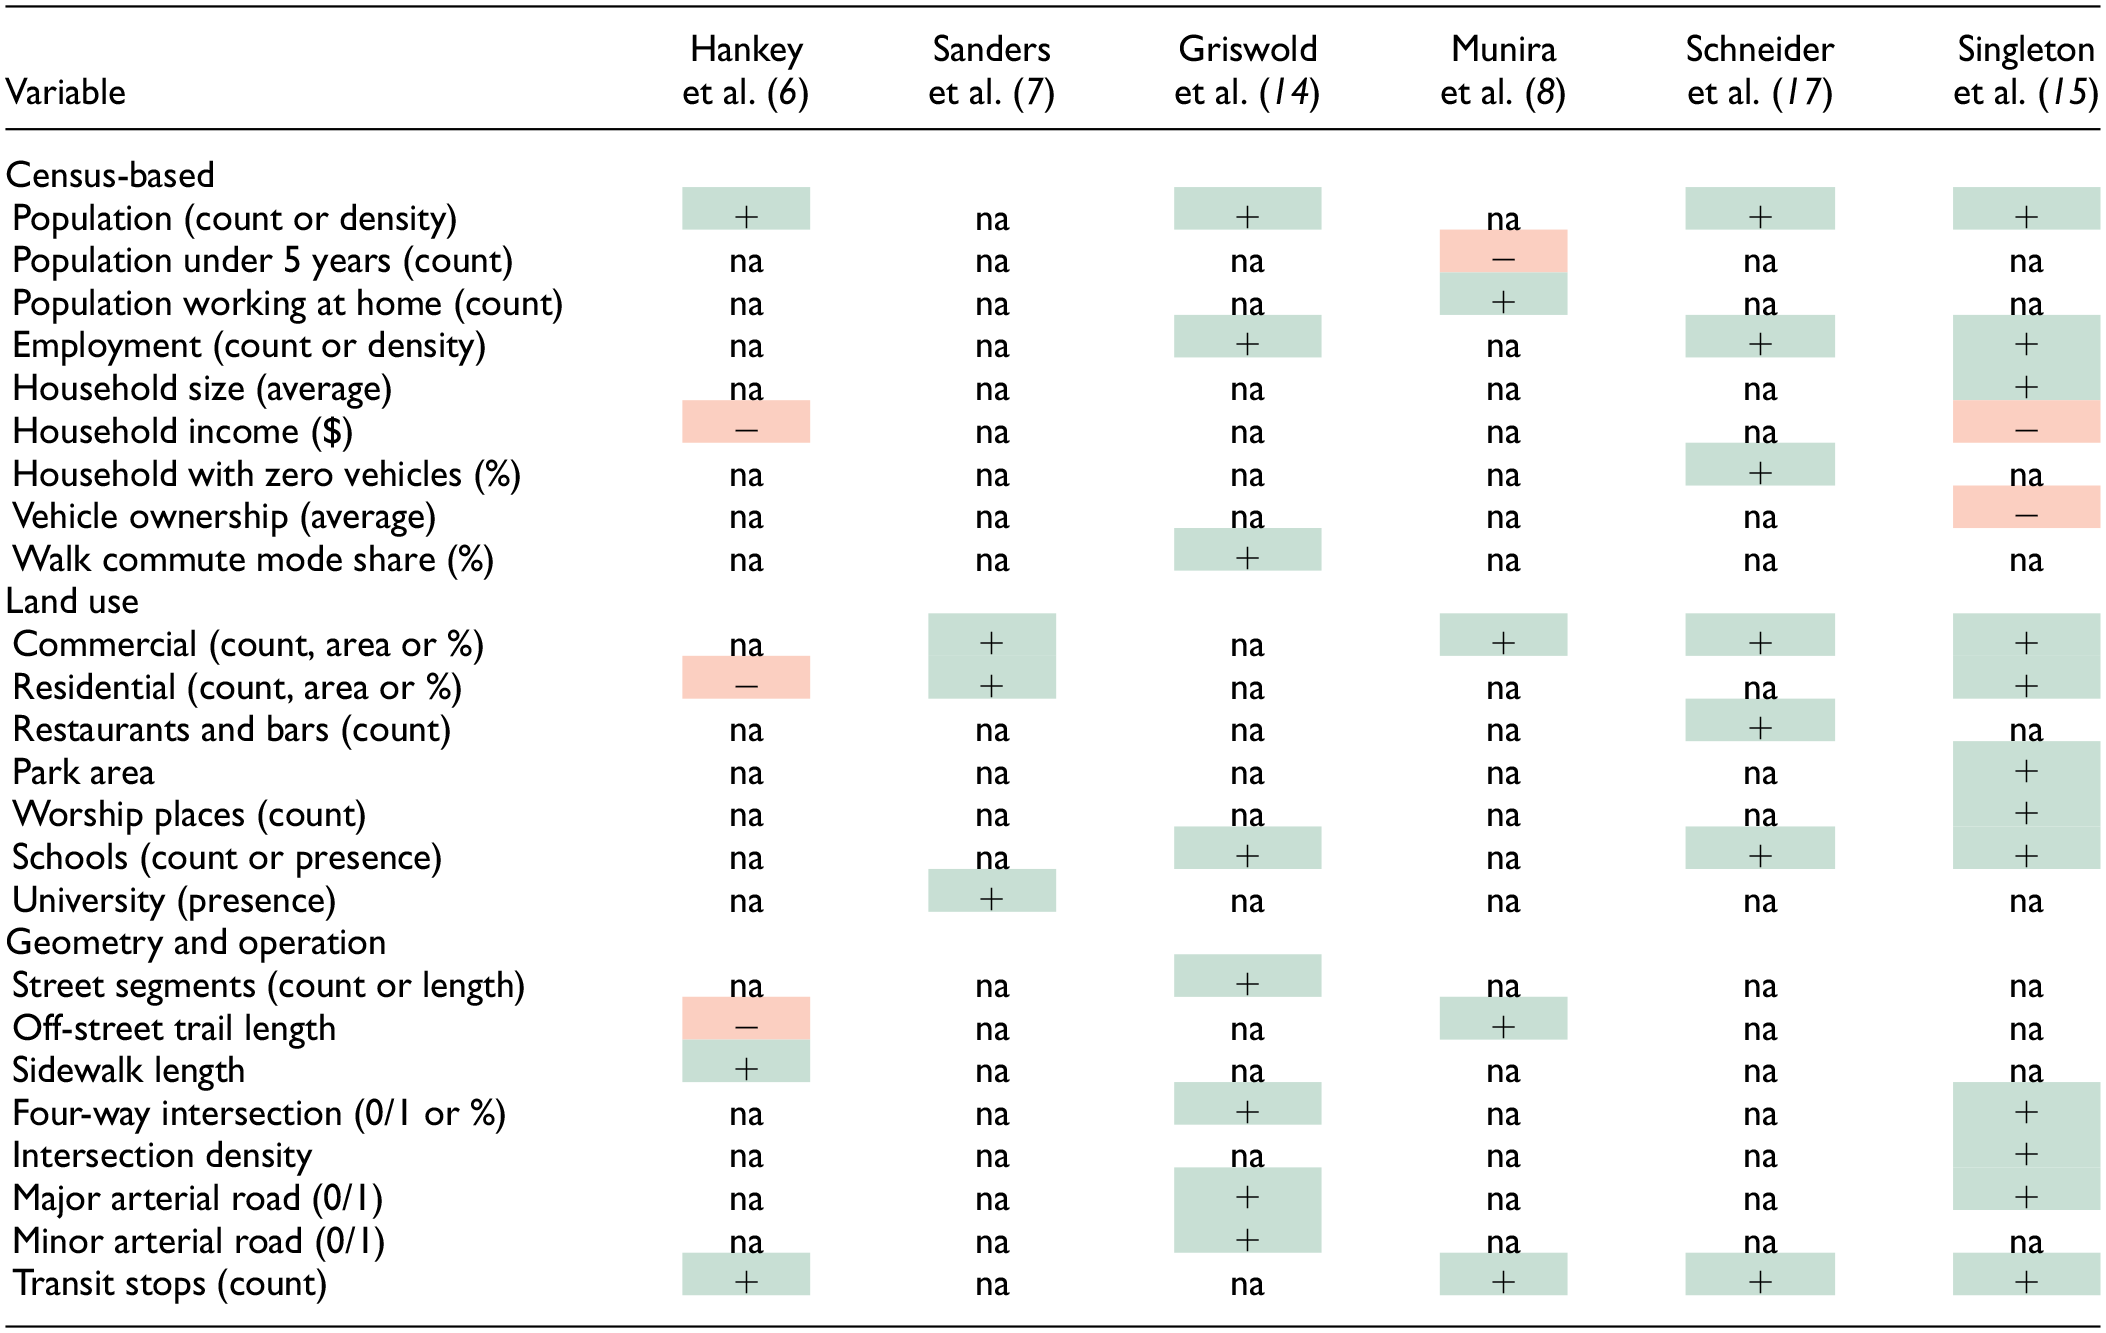
Note: na = not applicable. Association with pedestrian volume: (+) positive; (−) negative.Green is associated with “+” and Red with “−”.
In respect to the model’s formulation, log-linear, Poisson, and Negative Binomial structures are observed in the six chosen models. All these formulations apply a link function (natural logarithm transformation) to the dependent variable. The general formulation of DD models is presented in Equation 1. To convert the ln-transformed variable to AADPT or annual volume, both sides of the equation are exponentiated (Equation 2). Note that Griswold et al. ( 14 ) and Singleton et al. ( 15 ) applied a ln-transformation to some of the independent variables.


where
To the authors’ knowledge, no efforts with regard to the spatial transferability of existing DD models have yet been made. To contribute to this knowledge gap, an application of the six chosen models to three different jurisdictions is presented and discussed in the next sections.
Spatial Transferability of Direct Demand Models
With the knowledge of the explanatory variables and model coefficients from the selected models, their application to other jurisdictions depends only on the availability of the data for the explanatory variables. As indicated in Table 2, these explanatory variables generally fall into one of three categories, namely Census, Land Use, and Geometric and Operational. These data are typically available from national census data sources, jurisdiction open data sites, or regional transportation survey data sources. On the data collection, there are two categories of variables: count/length and area based. The assemblage of the first is straightforward by using GIS functions to count points or sum lengths within the designated buffer areas around the site. The second category is often associated with census and transportation survey information, where the data is gathered into zones. Two strategies have been considered to deal with this kind of data: a) taking the arithmetic average of the variable for every zone that is intersected by the buffer; and b) taking the weighted average of the variable based on the buffer intersection area. Some authors explicitly identified which strategy they followed: Schneider et al. ( 17 ) used an arithmetic average, and Hankey et al. ( 6 ) applied a weighted average. When no information is provided, the weighted average is assumed.
To assess the accuracy of the DD model application, it is also necessary to know the true pedestrian exposure for each site. We have chosen to select sites and jurisdictions for which continuous counts are available so that AADPT can be directly computed (e.g., one year of CCs available) or estimated from time series of daily counts across a relatively large number of days. This avoids the introduction of errors from using one- or two-day STCs and expanding these to AADPT using expansion factors from CC stations. Three indicators were employed to measure the errors between observed (true) and estimated AADPTs: mean absolute error (MAE) (Equation 3), mean absolute percent error (MAPE) (Equation 4), and the ratio of MAE and the average true AADPT (Equation 5).


where
Jurisdictions Chosen for the Spatial Transferability Assessment
Three jurisdictions, capturing a diverse range of geography, land use, urban form, population density, and climate were chosen for the DD model application: City of Milton, Canada; Pima County, Arizona, U.S.A.; and City of Toronto, Canada. Each of these three jurisdictions has deployed a camera-based traffic monitoring system from the same vendor. The pedestrian volume counts (aggregated to intersection daily totals) were obtained from this system for each site. Counts from time periods that were substantially affected by the COVID-19 pandemic were avoided. Given jurisdiction-specific COVID-19 impacts and particularities in the data, a different strategy was necessary to estimate AADPT for each jurisdiction:
Milton (n = 21): Continuous count data were available from six sites from more than one year. Day-of-week and month-of-year expansion factors were developed from these six sites and applied to 15 sites, from which the AADPT was estimated from samples ranging between 31 and 258 days. The counts ranged from June 2018 to March 2020. No particular pattern was observed in the pedestrian volume of the sites employed for expansion factor development, therefore no factor grouping was applied.
Pima County (n = 81): Only three sites had sufficient data for the development of expansion factors in a pre-pandemic period (before March 2020), and a significant portion of the sites have counts only for the period after March 2020. It was decided to estimate the seasonal average daily pedestrian traffic for the period between April 2021 and November 2021 and to expand it to AADPT using factors obtained from the three sites with complete pre-pandemic data from October 2018 to February 2020. By April 2021, most of the COVID-19 restrictions had been lifted in Pima County, including the school restrictions. The expansion factoring considered the presence of schools to appropriately deal with the reduced pedestrian volume in June and July because of school holidays.
Toronto (n = 28): the data available allowed for the direct calculation of AADPT for all the sites using information from January 2018 to March 2020.
Figure 1 shows the location of the sites (signalized intersections) in each jurisdiction with an indication of the AADPT estimate. It is observed that the level of pedestrian activity differs significantly in each jurisdiction. Milton, for example, presents an average AADPT of 313, which is within the range of values used to calibrate existing DD models (Table 1). On the other hand, Pima County and Toronto represent two different extremes. The sites from Pima County have extremely low pedestrian activity (average AADPT = 28), with 30% of the sites comprising daily pedestrian volumes between two and seven. The sites from Toronto are situated in Downtown Toronto, a region that is characterized by its high employment and commercial densities, which are reflected in a significant pedestrian movement (average AADPT = 23,481). The choice of such distinct jurisdictions was intended to provide the opportunity to assess the transferability of DD models in different contexts.
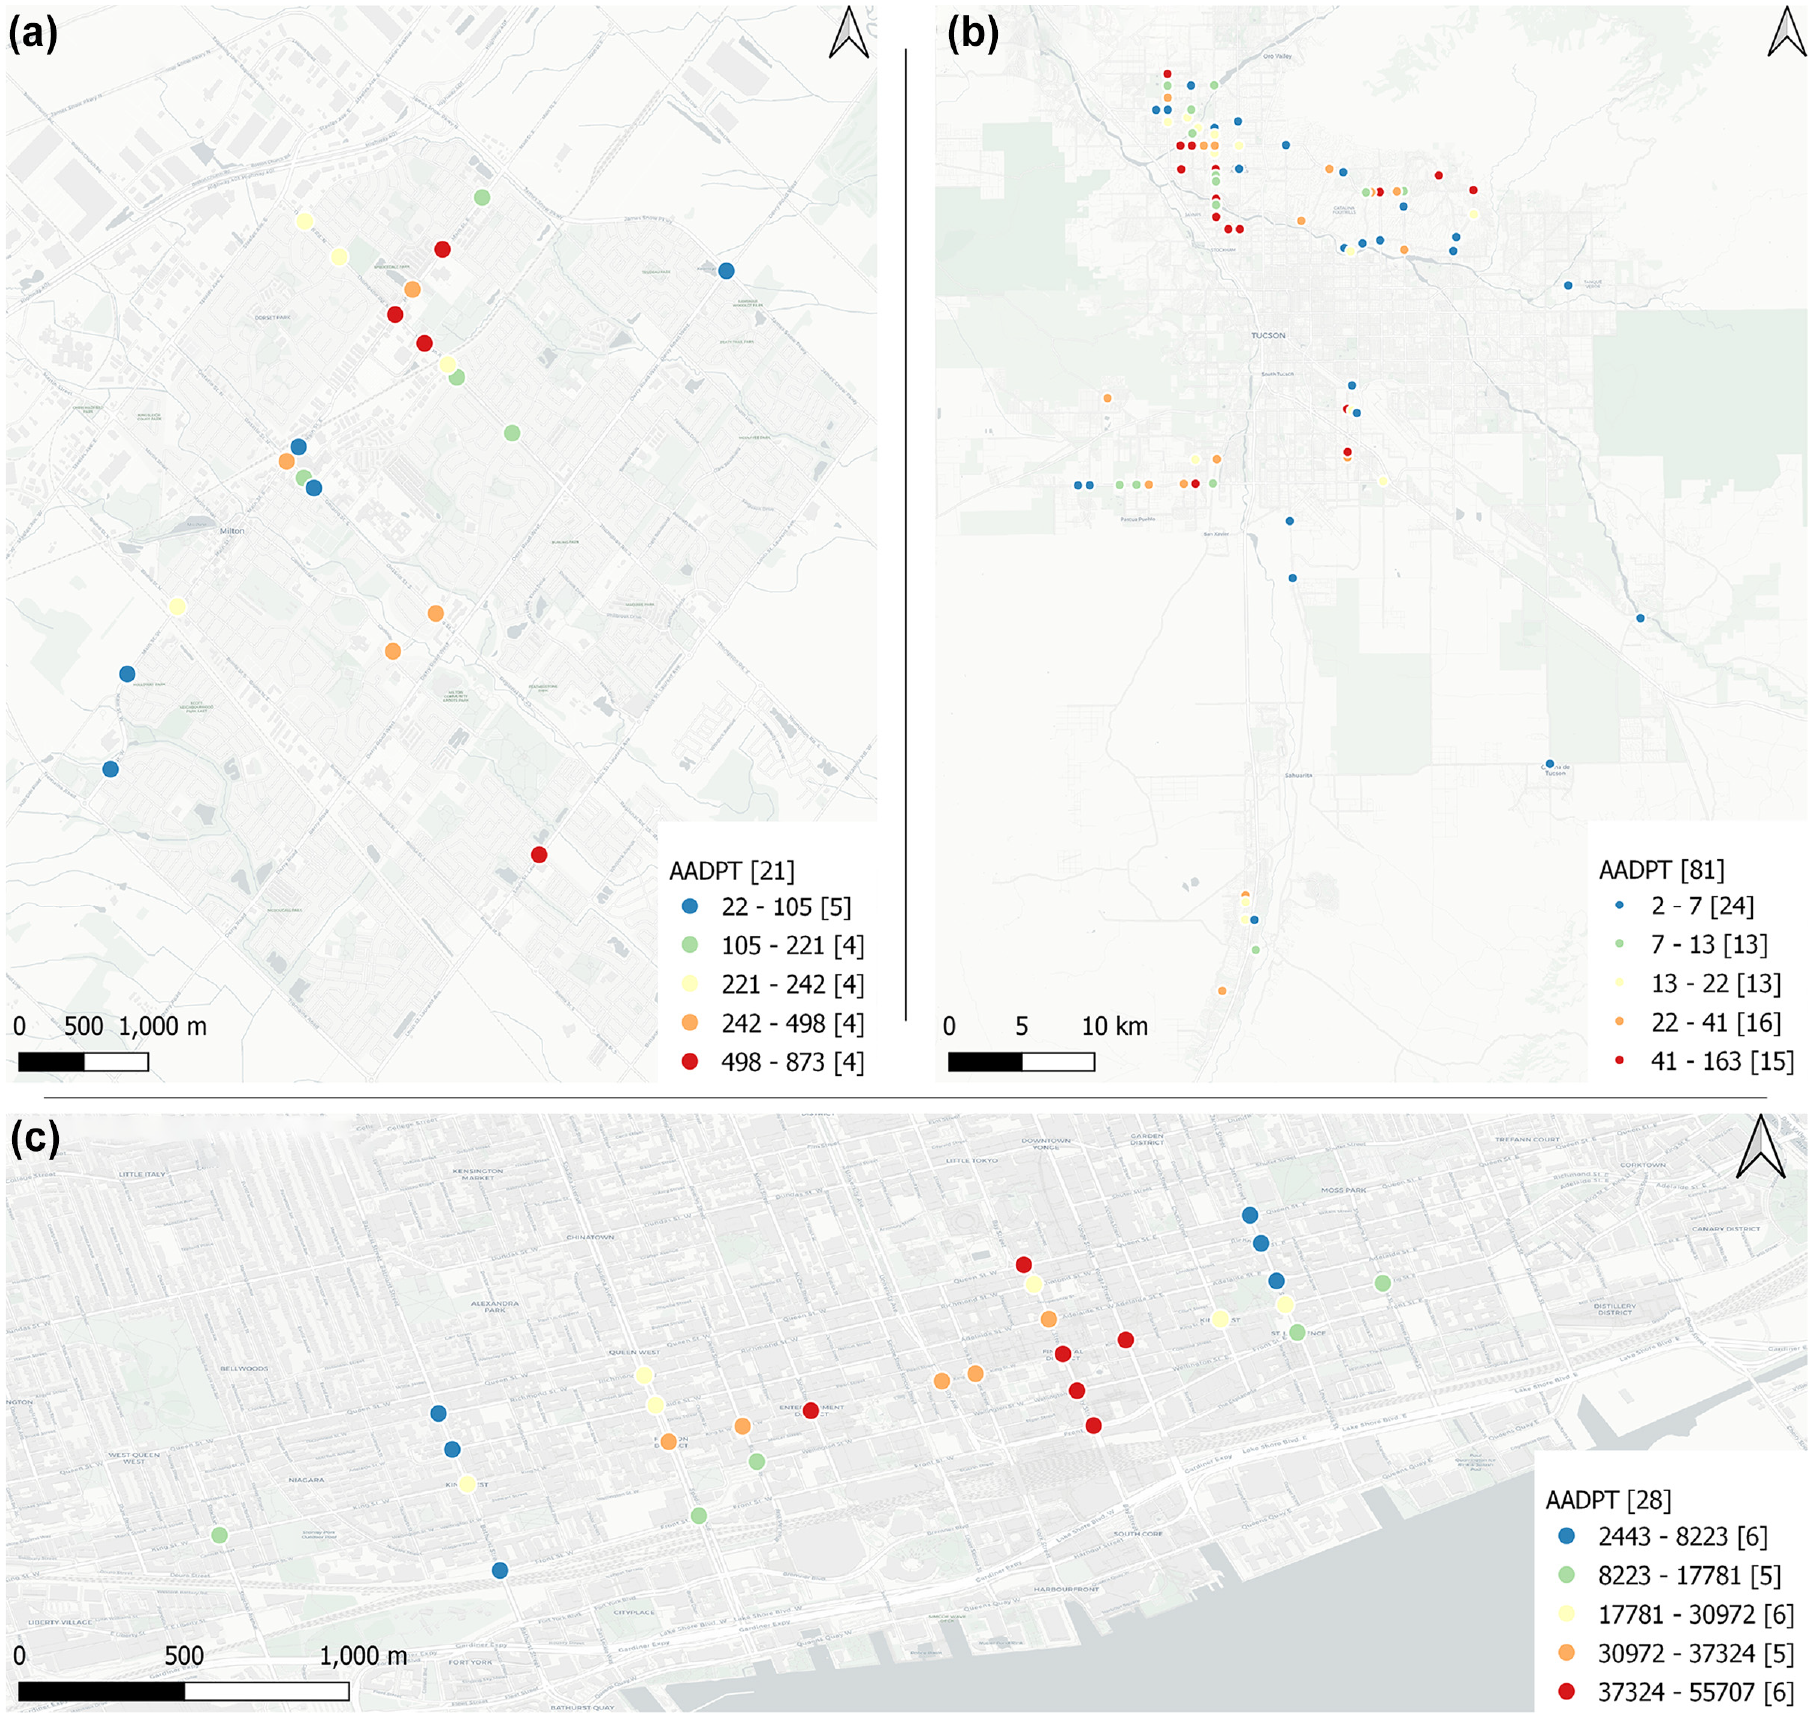
Site location: (a) Milton, (b) Pima County, and (c) Downtown Toronto.
To verify to what extent the use of post-pandemic data affected the low pedestrian volume observed in the Pima County sites, monthly average daily pedestrian traffic (MADPT) was calculated from October 2018 to February 2020 (pre-pandemic period) and compared with MADPT for the period considered in the study (April 2021 to November-2021). Using data from nine sites, an average reduction of 5.65% of the MADPT was observed for the post-pandemic period. This is an indication that pedestrian activity had returned to pre-pandemic levels during the period of the study.
Figure 2 presents the distribution of several key explanatory variables for each jurisdiction. Figure 2 also shows the mean, minimum, and maximum statistics from the jurisdiction on which the model was originally developed. The distribution of the variables follows the level of pedestrian activity found for each jurisdiction (i.e., Pima County < Milton < Toronto). Of particular note are the extremely large population and employment densities of the Downtown Toronto sites. In addition, the percentages of people who walk to work and are from households that do not own any vehicles in Downtown Toronto are also high—despite the high median income associated with the region—suggesting that the non-motorized transportation mode prevails in the region. It is also noted that some variables of the Toronto sites are outside of the range captured in the original DD model calibration data sets, which could cause issues when the DD models are applied. The variables for Milton and Pima County, in general, fall within the range of values of the DD model calibration data sets.
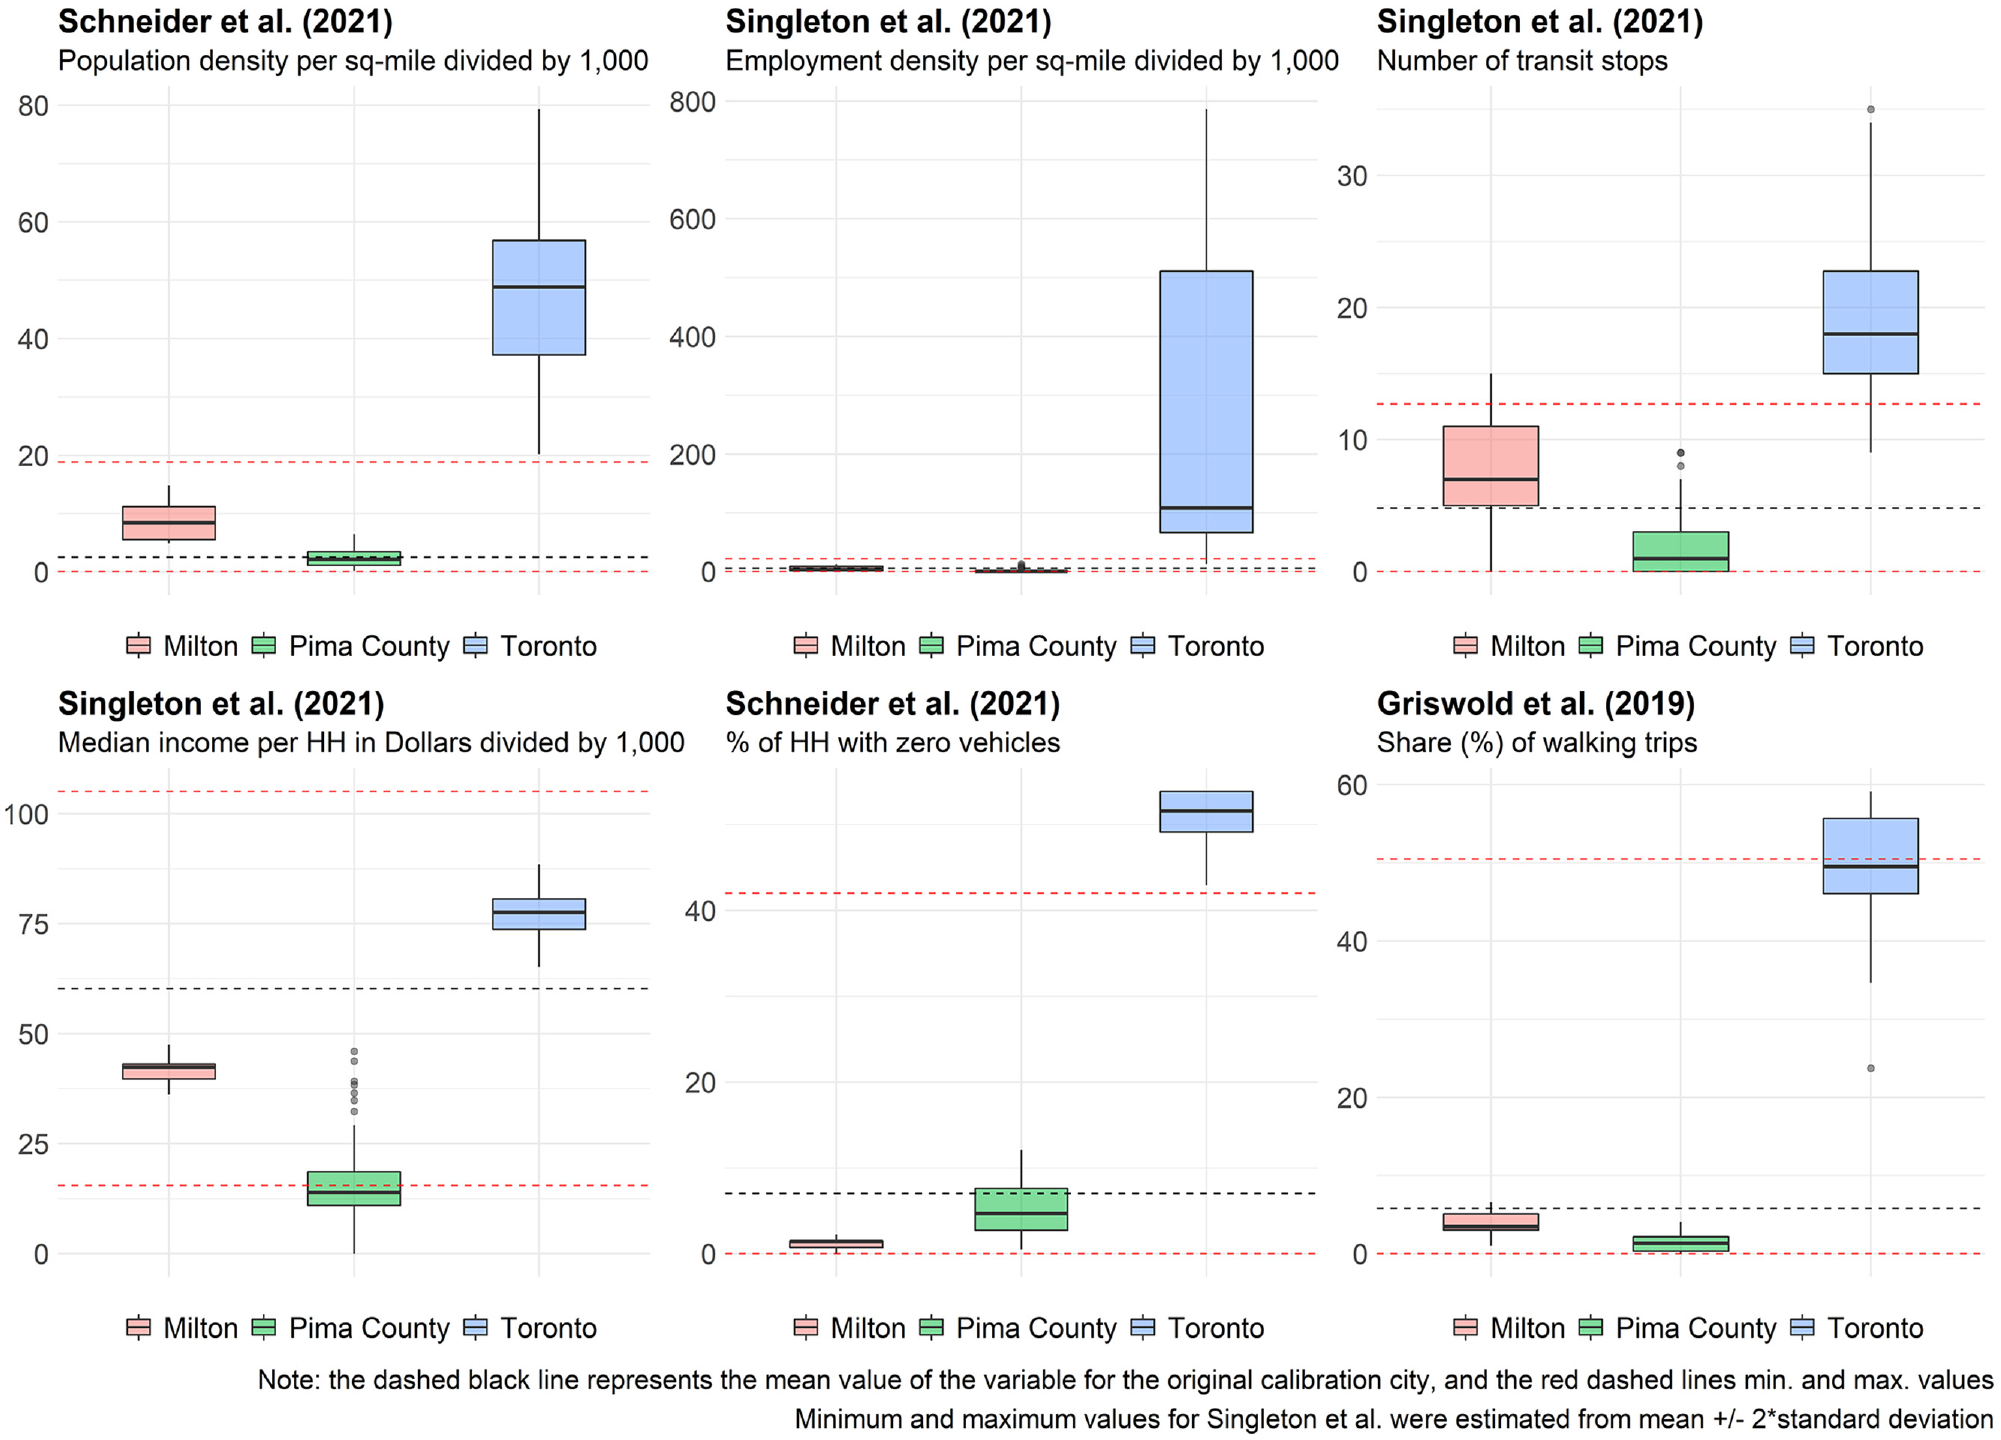
Boxplots of selected explanatory variables for selected direct demand (DD) models.
Two considerations are made with regard to the explanatory variables used in the model’s applications. The first is that one of the variables employed in Hankey et al. ( 6 ) and Singleton et al. ( 15 ) is household income. Because both models were developed in U.S. jurisdictions, U.S. dollars are the initial unit used. For the model’s application to Milton and Toronto, data sources provide household income in Canadian dollars. We had no prior knowledge of how different household incomes affect the generation of pedestrian trips across different jurisdictions (either different jurisdictions within the U.S.A. or between U.S.A. and Canada). We examined the effect on accuracy of the transferability of these two models by converting household income from Canadian dollars to U.S. dollars and found that the conversion of currency did not provide consistent improvements across the Milton and Toronto data sets. As a result, in the application of these models to the Canadian jurisdictions, household incomes were not converted to U.S. dollars. The second point is that the models proposed by Hankey et al. ( 6 ) and Sanders et al. ( 7 ) considered the count of residential addresses. The authors did not clearly state in their studies if multi-unit residential buildings are counted as one or as multiple addresses. Many open data sources report a single address per building regardless of the number of individual units in the building and consequently, the present work counted every residential address as one point.
Summary of the Applications of the DD Models
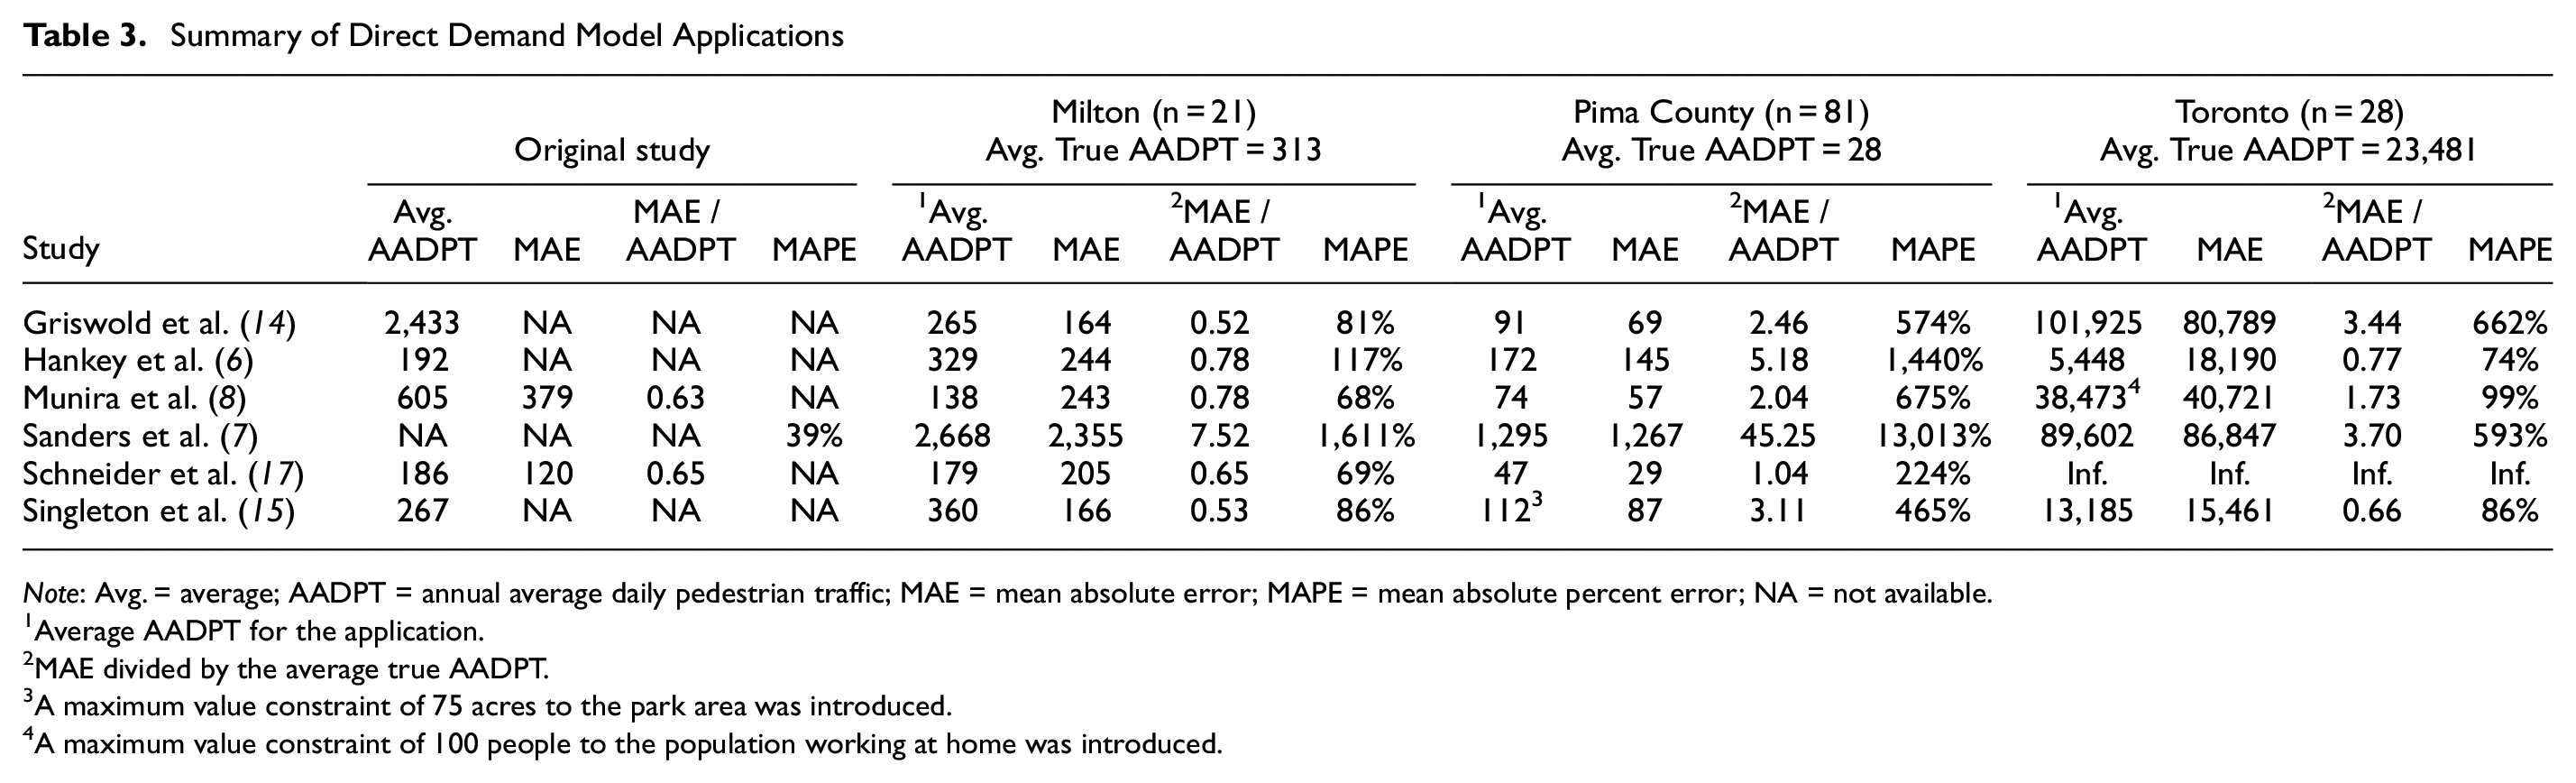
Table 3 presents a summary of the applications of the DD models to the sites in Milton, Pima County, and Toronto. Four measures of performance are shown: the average of the AADPT estimate for all sites in the jurisdiction, MAE, the ratio of MAE to the average true AADPT, and MAPE. These goodness-of-fit indicators were chosen because they were available in three of the six studies that we considered and because they enable a clear understanding of the magnitude of the errors as well as standardization across jurisdictions. The models that estimate annual pedestrian volume were converted to AADPT. The table also provides the performance measures for the original study, whenever available, to compare the magnitude of errors between the application and the original model. We note that limited information on the goodness-of-fit of the original models was provided in the studies, particularly for conventional error indicators, such as MAE and MAPE.
Summary of Direct Demand Model Applications
Note: Avg. = average; AADPT = annual average daily pedestrian traffic; MAE = mean absolute error; MAPE = mean absolute percent error; NA = not available.
Average AADPT for the application.
MAE divided by the average true AADPT.
A maximum value constraint of 75 acres to the park area was introduced.
A maximum value constraint of 100 people to the population working at home was introduced.
In computing the summary performance indications presented in Table 3 we have made adaptations to two of the DD models. The first, indicated by footnote 3 in Table 3, was to constrain the value of the “Park Area” explanatory variable in the Singleton model to a maximum value of 75 acres. Examination of the model performance showed that for a small number of sites in Pima Country, the Park Area was significantly larger than 75 acres, but these large values produced extremely large model estimates of pedestrian volumes that were clearly unrealistic.
The second adaptation, indicated as footnote 4 in Table 3, was to constrain the value of the “Number of people working from home” explanatory variable in the Munira model to a maximum of 100. For some sites in Toronto, the number of people working from home was much higher than 100 and for these sites the model predicted extremely large pedestrian volumes that were clearly unrealistic.
Both adaptations were made to avoid including model estimation errors that were clearly unrealistic and would not be used in practice. The threshold values were selected by examining the distribution of values of the explanatory variables and the resulting model estimates, but we recognize that establishing these constraints is subjective.
Discussion and Conclusions
The results of the spatial transferability analysis presented in Table 3 show that: a) the performance of each DD model varied substantially across the different jurisdictions; and b) the performance of the six DD models within a single jurisdiction also differed substantially. The model developed by Sanders et al. ( 7 ) provided the poorest accuracy, especially for the Milton and Pima County sites. Besides being the simplest model (i.e., only three explanatory variables), the model’s constant adds a significant value to the “baseline” estimate. For example, in sites with no residential addresses, commercial places, or universities, the model estimates an AADPT of 1,152 which is considerably greater than the average AADPT observed in Milton (313) and Pima County (28). None of the other models, which are discussed below, presented systematic problems.
The applications for Milton are the ones that provided the best performance. The ratios of MAE and average true AADPT ranged from 0.52 to 0.78 and are similar in magnitude to those reported for the original calibration/validation data sets of the DD models ( 8 , 17 ). We believe that there are two reasons for this good level of spatial transferability. The first is that the average pedestrian volume observed in Milton is similar to those in the jurisdictions where the models were originally calibrated. The second is that the central tendencies (e.g., average and median) and distribution of the values of the explanatory variables for the Milton sites (Figure 2) fit the range of values used to calibrate the models. These points indicate that the sites in Milton are more consistent in site characteristics and pedestrian volumes with the model calibration data sets than the sites in Pima County or in Toronto.
Figure 3 displays scatterplots of the observed and estimated AADPTs for analysis of the two models that demonstrated the highest accuracy. It is observed that both models underestimated the pedestrian volumes for the five sites with the greatest AADPTs (the same also happened for the other three DD models). An assessment of each site showed that they are all associated with the presence of schools nearby. It should be noted that both Griswold et al. ( 14 ) and Singleton et al. ( 15 ) include the count of schools in their equations. This may suggest that the presence of a school in Milton generates more pedestrian trips than in California and Utah (jurisdictions where the DD models were developed).
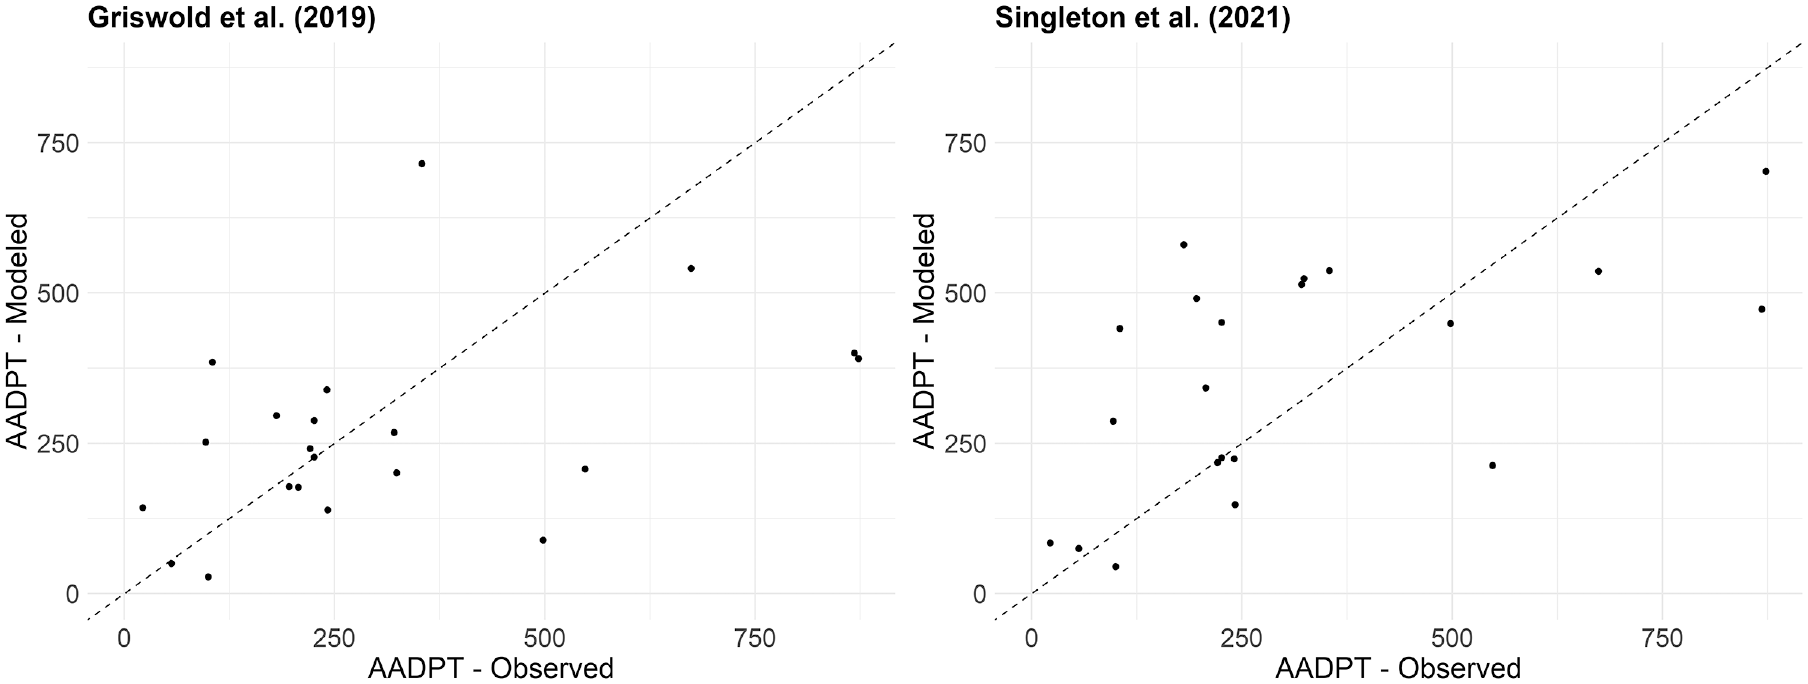
Estimated and observed AADPT for sites in Milton for the two most accurate DD models.
With regard to the application for Pima County, it is observed that the average AADPT estimates are two to three times lower than for Milton. This was expected given the reduced potential of pedestrian trip generation associated with the land use and socioeconomic attributes in the Pima County sites, as shown in Figure 2 (e.g., low population and employment densities and low percentages of people that walk to work). Nevertheless, systematic overestimation is still found for the estimations of all five DD models. The combination of these facts suggests that the pedestrian activity generated by a given attribute is lower in the Pima County sites than in the sites of the original models. For example, the presence of a commercial establishment or a school might produce fewer pedestrian trips in Pima County than in the sites from the original calibration. The Schneider et al. ( 17 ) model performed the best in Pima County and is also the one with the lowest average AADPT. Different relationships between explanatory variables and the number of produced trips (i.e., model coefficients) across jurisdictions may be related to jurisdictional specific characteristics such as level of motorization, incentives to use active transportation, land-use mix, weather, and others. In summary, none of the DD models was able to adequately account for the extremely low pedestrian activity in the Pima County sites (average AADPT = 28), probably because of the different contexts in which the models were calibrated.
Concerning Toronto, the performance of the DD models developed by Munira et al. ( 8 ), Griswold et al. ( 14 ), and Schneider et al. ( 17 ) was severely affected by the extremely large employment and population densities and the large number of people working at home observed in Downtown Toronto. The limits of these variables in the Downtown Toronto sites are significantly outside the range of the variables considered in the calibration of the models (Figure 2). For example, the maximum value of employment density observed in Schneider’s model is 111,269 employees per square mile, whereas the average and maximum values in the sites of Toronto are 255,842 and 788,478 employees per square mile, respectively. Because the models were not calibrated for this range of variables and that independent variables are exponentiated resulted in some highly unrealistic AADPT estimates, especially for the Schneider et al. ( 17 ) model.
Surprisingly, despite considering the population density as one of its explanatory variables, the Hankey et al. ( 6 ) model systematically underestimated the AADPT predictions. In their study, no information with regard to the range of the population density used for the model calibration is provided.
The Singleton et al. ( 15 ) model provided the best accuracy for Toronto. The model includes population and employment densities in its formulation, and though the distribution of both variables for the Downtown Toronto sites differs considerably from that observed in the original data set (Utah, U.S.) (see Figure 2), the authors ln-transformed both variables before the model calibration, limiting the influence that very large values of these explanatory variables have on the AADPT estimate. Figure 4 shows the Singleton’s model error as a function of the observed AADPT. It is noted that the model provided reasonable estimates up to values of AADPT close to 20,000. After that, consistent underestimation is seen.
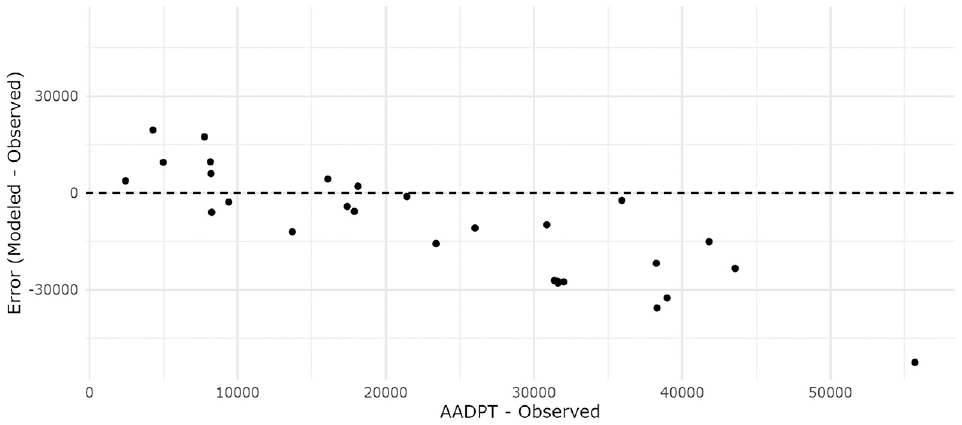
Toronto—Singleton et al. ( 15 ) model error as a function of observed AADPT.
To conclude the assessment of the DD models, Table 4 shows the rank of the models based on the ratio between MAE and true average AADPT. Overall, the models developed by Singleton et al. ( 15 ) and Sanders et al. ( 7 ) presented the best and worst transferability performance, respectively. The model proposed by Schneider et al. ( 17 ) provided reasonable accuracy for Milton, the best performance for Pima County, but showed unrealistic estimates for Toronto. The model calibrated by Hankey et al. ( 6 ) consistently overestimated for Pima County and underestimated for Toronto. The model proposed by Griswold et al. ( 14 ) provided the best accuracy for Milton, while the model developed by Munira et al. ( 8 ) showed consistent performance across all three jurisdictions.
Summary of Direct Demand Model Performance
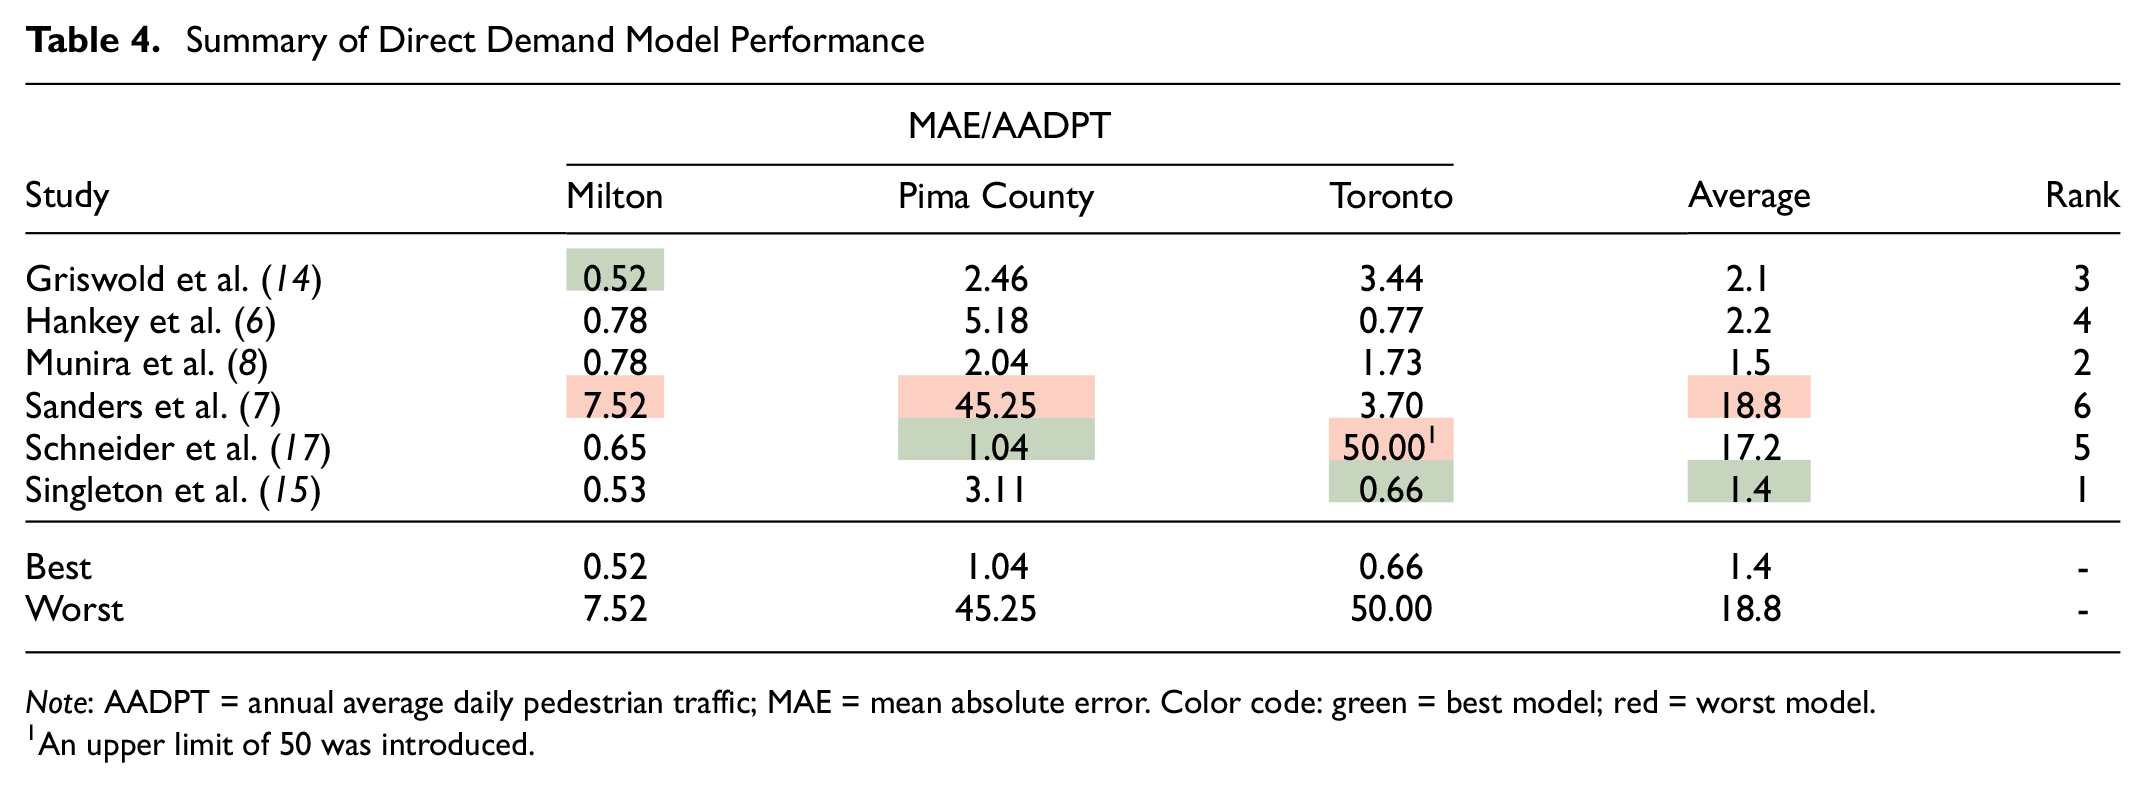
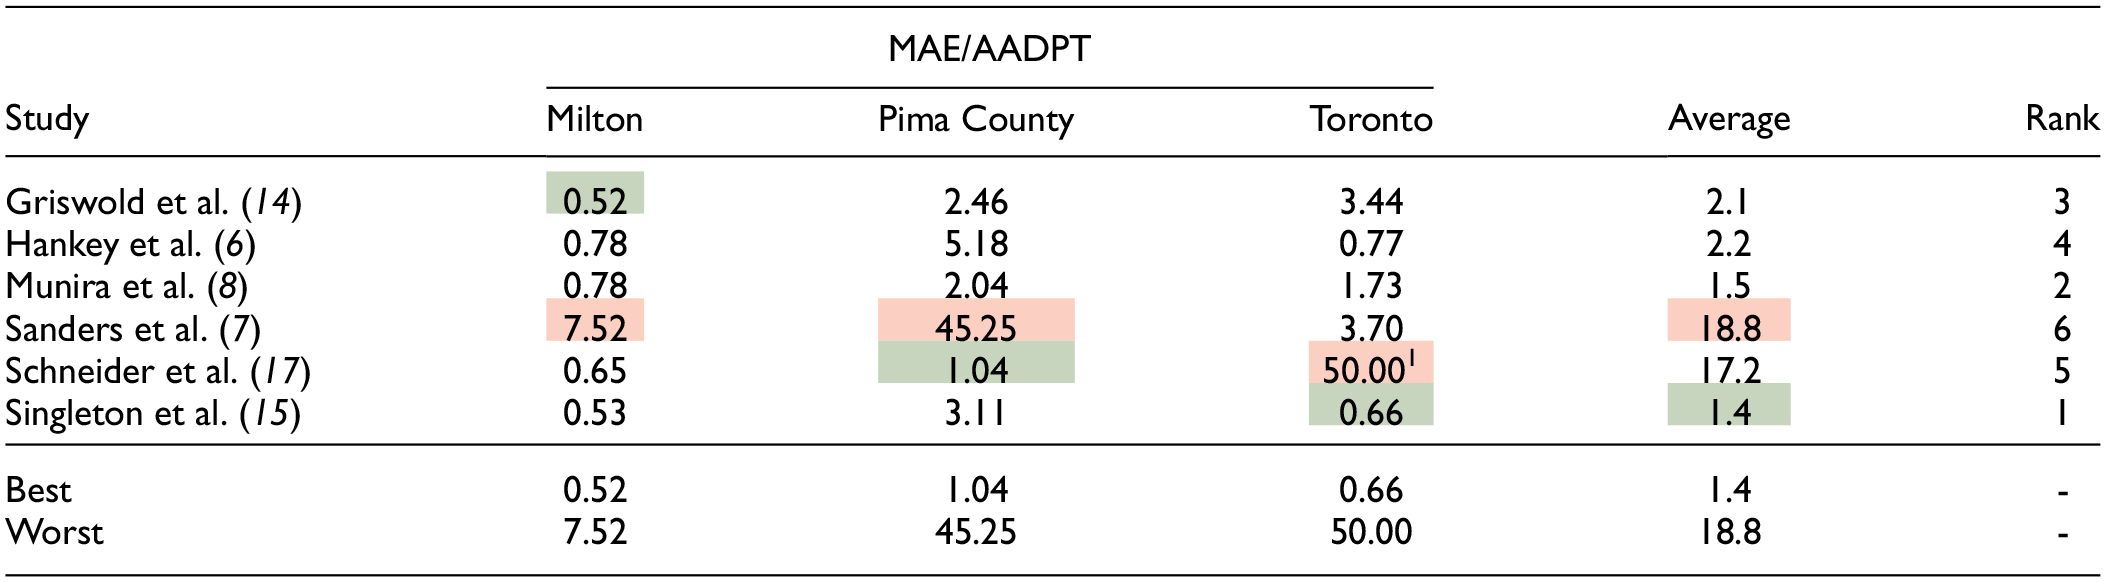
Note: AADPT = annual average daily pedestrian traffic; MAE = mean absolute error. Color code: green = best model; red = worst model.
An upper limit of 50 was introduced.
The key takeaway from this paper is that the DD models evaluated in this research performed considerably differently across jurisdictions with distinct land use and socioeconomic features and levels of pedestrian activity. Five of the models performed reasonably well for Milton, a jurisdiction that has similar characteristics to the jurisdictions on which the original DD models were calibrated. However, these models performed poorly when applied to sites in Toronto and Pima County. Furthermore, the relative performance of the models was not consistent across the different jurisdictions. It is clear that naively applying the models to jurisdictions that are substantially different from the jurisdictions where the DD models were calibrated can result is very large estimation errors and is not recommended. Establishing if the jurisdiction of interest is “substantially” different from the calibration jurisdiction can be done by examining the distribution of the explanatory variables from the jurisdiction of interest and comparing this to the range of values from the calibration data set. However, this can only be done if the model developers have reported the characteristics of the calibration data set. Furthermore, establishing that the jurisdiction of interest is not substantially different from the original calibration data set does not guarantee that the application of that model will provide pedestrian volume estimates of acceptable accuracy.
After reviewing studies reported in the literature that have developed DD models and making significant efforts to apply these models, some suggestions are made to researchers on how to make their methods and models more easily transferrable:
Describe clearly the explanatory variables used in the model. For example, defining if multi-unit residential buildings are counted as one or as multiple addresses and stating the criteria for classifying an establishment as a commercial one.
Provide a descriptive summary of pedestrian volume and explanatory variables, so other researchers can have a good understanding of the jurisdiction where the model was developed.
Include conventional indicators to assess the model’s performance, such as MAE and MAPE. As stated in previous sections, it was hard to position the studies for accuracy, since those kinds of indicators were not always available.
Place greater emphasis on using explanatory variables that are widely available across jurisdictions to enhance the opportunity for these models to be applied in different jurisdictions.
For future work, developing DD models using local data may help the assessment of spatially transferred models for their model coefficients and accuracy. There is also a need for further research to examine ways to improve the spatial transferability of existing DD models, including methods that enable the AADPT estimates to be calibrated locally using pedestrian volume data that are available for sites in the target jurisdiction. Another point that has not been explored yet is to what extent the compilation of different municipalities into a single model affects the quality of the modeling. For example, some studies used data from different municipalities within a county or state ( 14 , 15 ). If the relationship between explanatory variables and pedestrian volume (i.e., model coefficients) is different across municipalities, increasing the data set sample size by combining distinct municipalities may not be beneficial to the model.
Footnotes
Acknowledgements
The authors gratefully acknowledge: (i) the jurisdictions of Milton, Pima County, and Toronto for providing permission to use the pedestrian volume data and for providing rich open data portals that were essential sources of information for this research; and (ii) Miovision for providing access to the pedestrian data.
Author Contributions
The authors confirm contribution to the paper as follows: study conception and design: Sobreira L. T. P., Hellinga B.; data collection: Sobreira L. T. P., Hellinga B.; analysis and interpretation of results: Sobreira L. T. P., Hellinga B.; draft manuscript preparation: Sobreira L. T. P., Hellinga B. All authors reviewed the results and approved the final version of the manuscript.
Declaration of Conflicting Interests
The author(s) declared no potential conflicts of interest with respect to the research, authorship, and/or publication of this article.
Funding
The author(s) disclosed receipt of the following financial support for the research, authorship, and/or publication of this article: The authors gratefully acknowledge financial support from Transport Canada. The research was carried out by the authors, and no endorsement of the methods or findings by Transport Canada is claimed or implied.
The work in this paper reflects the views of the authors and there is no explicit or implicit endorsement by any of the aforementioned jurisdictions/agencies/companies.