
Abstract
Background
Neuroimaging studies revealed structural and functional changes in medication-overuse headache (MOH), but it remains unclear whether similar changes could be observed in other chronic pain disorders.
Methods
In this cross-sectional study, we investigated functional connectivity (FC) with resting-state functional magnetic resonance imaging (fMRI) and white matter integrity using diffusion tensor imaging (DTI) to measure fractional anisotropy (FA) and mean diffusivity (MD) in patients with MOH (N = 12) relative to two control groups: patients with chronic myofascial pain (MYO; N = 11) and healthy controls (CN; N = 16).
Results
In a data-driven approach we found hypoconnectivity in the fronto-parietal attention network in both pain groups relative to CN (i.e. MOH < CN and MYO < CN). In contrast, hyperconnectivity in the saliency network (SN) was detected only in MOH, which correlated with FA in the insula. In a seed-based analysis we investigated FC between the periaqueductal grey (PAG) and all other brain regions. In addition to overlapping hyperconnectivity seen in patient groups (relative to CN), MOH had a distinct connectivity pattern with lower FC to parieto-occipital regions and higher FC to orbitofrontal regions compared to controls. FA and MD abnormalities were mostly observed in MOH, involving the insula.
Conclusions
Hyperconnectivity within the SN along with associated white matter changes therein suggest a particular role of this network in MOH. In addition, abnormal connectivity between the PAG and other pain modulatory (frontal) regions in MOH are consistent with dysfunctional central pain control.
Keywords
Introduction
Medication-overuse headache (MOH) affects 1–2% of the general population and causes significant social and financial burden (1,2). MOH is defined as headache that develops or significantly worsens during overuse of acute pain medication (3). During medication overuse, pain thresholds in cephalic and extracephalic regions were found to be reduced in animal and human studies, probably because of drug-induced latent sensitisation of the trigeminovascular system (4,5), which was reversible after detoxification. Alterations in central modulation of trigeminal nociceptive input have been proposed in the pathophysiology of MOH. These may involve an imbalance within descending pain modulating systems towards pain facilitation (6–8).
Metabolic and structural alterations have been described in MOH, including hypometabolism in the orbitofrontal cortex (OFC) in a positron emission tomography (PET) study (9) and grey matter (GM) increases in the striatum, thalamus and the midbrain (10). After detoxification the GM increase in the midbrain including the periaqueductal grey (PAG), which is involved in descending pain modulation, was reversible in patients who improved clinically, whereas other GM changes were not (11). Hypometabolism in the OFC persisted after detoxification, whereas other hypometabolic regions such as thalamus and ventral striatum/insula returned to normal. Persistent structural GM changes and hypometabolism in OFC after detoxification have been related to patients’ dependence on the analgesic compound or predisposition to medication-overuse relapse (9,11).
It is assumed that the human brain is highly active in the absence of explicit input or output (12). Resting-state functional magnetic resonance imaging (RS-fMRI) examines spontaneous low-frequency fluctuations in the blood oxygenation level-dependent (BOLD) signal in absence of external tasks or stimuli and can provide a measure of functional connectivity (FC) between various brain regions (13) and networks (14). RS networks, i.e. spatially distinct areas of the brain that show synchronous BOLD signal fluctuations at rest, have been consistently identified using various methodological approaches (14,15), including the default-mode network (DMN), fronto-parietal attention network (FPN), sensorimotor network (SMN), or saliency network (SN), which comprises the bilateral insulae and dorsal anterior cingulate cortex (ACC). One study has examined RS FC in MOH and reported decreased FC between the precuneus and fronto-parietal regions within the DMN and increased FC between precuneus and hippocampal/temporal areas (16). Increased FC between the PAG and both nociceptive and somatosensory regions was found in patients with episodic migraine between the attacks (17). Attack frequency correlated negatively with FC between the PAG and prefrontal regions, ACC and thalamus, probably reflecting impaired pain modulation. The PAG is functionally and anatomically connected with forebrain structures involved in pain processing (18,19) and is probably involved in the pathophysiology of migraine and MOH (11,17,20).
White matter (WM) changes have been documented in migraine and other chronic pain conditions. These microstructural alterations are inferred from diffusion tensor imaging (DTI) indices, such as fractional anisotropy (FA), which quantifies the degree of preferential restriction in water diffusion, and mean diffusivity (MD), which measures the overall magnitude of water diffusion (21). Patients with episodic migraine showed lower FA in the thalamocortical tract, trigeminothalamic tract and (in patients without aura) ventrolateral PAG (22), as well as reduced FA in the visual-motion processing network (23). Yet, whole-brain WM alterations have not been investigated in patients with MOH.
In the present study we performed a multimodal imaging approach to investigate FC and WM changes in patients with MOH compared to healthy controls (CN), as functional and structural changes are probably interrelated. A group of patients with chronic myofascial pain (MYO) without evidence of comorbid MOH was also studied as a second control group, to investigate which changes might be attributable to chronic pain rather than specifically to MOH. MYO is a common, widespread musculoskeletal pain syndrome that is thought to be associated with central sensitisation (24). In MYO, e.g. fibromyalgia, FC differences have been described within the SN and FPN (25,26). For the FC analysis, we applied a data-driven approach on the network level: the independent component analysis (ICA). We hypothesised that there is altered FC in the SN of MOH and MYO and hypoconnectivity in the FPN in MOH compared to controls, based on previous studies (24,25,27). Next, we performed a seed-based analysis to investigate correlations between the spontaneously fluctuating BOLD signal in the seed region (PAG) and all other brain regions, similar as in Mainero et al. (17). We hypothesised that there is altered FC to somatosensory regions in MOH. Functional hyperconnectivity indicates a stronger coupling within a neural network or between a seed region and the rest of the brain in one than in the other group, as a result of more similar spontaneously fluctuating fMRI signal time courses. WM changes were examined at the whole-brain level using tract-based spatial statistics (TBSS), and local between-group WM differences were further explored and linked to clinical symptom scores. TBSS provides measures of FA and MD to determine deviations in WM (microstructural) integrity and membrane density, respectively. We hypothesised finding altered WM integrity in frontal brain regions, such as the OFC and insular cortex, as it is known that these regions show structural changes in MOH (10).
Material and methods
Participants
Demographics and clinical characteristics.

CN: healthy controls; MOH: medication-overuse headache; MYO: myofascial pain; M/F: male/female; VAS: visual analogue scale; HADS-A: Hospital Anxiety and Depression Scale-Anxiety score; HADS-D: Hospital Anxiety and Depression Scale-Depression score; n.s.: not significant; n.a.: not applicable. aMOH vs. MYO. bMYO vs. CN and MOH vs. CN.
Clinical assessment
Participants were excluded if they had evidence of structural lesions in the MRI, cardiovascular disease, any signs of neurological disease – other than the studied disorder or severe psychiatric disorders – and standard contradictions for MRI (28). All MYO patients were evaluated in a multidisciplinary setting involving neurologists, psychologists and orthopaedists. The diagnosis of MYO was established according to published clinical criteria (24). All patients with MYO had normal nerve conduction studies, somatosensory-evoked potentials and thermography. Inflammatory rheumatologic disease was excluded by laboratory tests. In all participants depression and anxiety were assessed using the Hospital Anxiety and Depression Scale (HADS) questionnaire (28). Pain intensity during scan was assessed using a visual analogue scale (VAS), ranging from 0 (no pain) to 10 (strongest pain). Duration of pain disorder (years) and headache days per month in MOH were also recorded.
Functional imaging
Whole-brain RS-fMRI data were acquired with a T2*-weighted echo planar imaging (EPI) single-shot sequence and an eight-channel head coil. The following recording parameters were used: repetition time (TR)/echo time (TE): 2 s/35 ms, EPI factor: 53, flip angle: 78 degrees, number of slices: 30, voxel resolution: 3 × 3 × 4 mm, scan order: ascending, scan duration: 6:30 minutes. MR-compatible headphones and cushions were used to minimise patients’ head motion. Participants were instructed to lie still, fixate on a white cross on a dark background, to be relaxed, but to remain awake.
fMRI pre-processing
Pre-processing and statistical analysis of the fMRI data was performed with SPM8. For each participant, we applied realignment (head motion correction), normalisation, co-registration (of the functional images to the T1-weighted images), and smoothing. In brief, images were realigned using rigid body transformations (29) to the first scan to correct for head motion (three translation and three rotation parameters), followed by slice-timing correction by temporally aligning all slices to the same reference time point (first slice). We chose to perform realignment first to minimise the effect of inter-slice movement (30). Data were then normalised to the Montreal Neurological Institute (MNI) brain template. The normalised functional images were smoothed with an isotropic Gaussian kernel of 8 mm with full width at half maximum.
FC by ICA
fMRI data were decomposed into intrinsic functional networks using spatial ICA using the GIFT toolbox V3.0a (http://mialab.mrn.org/software/gift). Spatial ICA applied to fMRI data aims to separate spatially independent patterns from their linearly mixed BOLD signals via maximisation of mutual independence among components (31). We limited the number of independent components (ICs) to 25, similar to previous pain-related FC studies (26,32,33). ICA is capable of extracting scanner or physiological noise and motion artefacts from the dataset (34), i.e. all non-neuronal ICs (e.g. respiration or head motion) were removed. To validate the stability of the resultant ICs, we employed ICASSO (35) (100 runs with random initiation) on the pre-processed data matrix for our model order of k = 25 (ICs). In doing so, one IC was removed from subsequent analysis, as the stability Index Iq was below 0.8 (out of 1). From the pool of remaining neuronal ICs (estimated across participants), we selected functionally relevant ICs using spatial correlation with previously defined templates, so that the final set of ICs consisted of the following networks: DMN, FPN, SN, SMN, posterior DMN (precuneus and posterior cingulate), anterior DMN (medial prefrontal cortex), inferior temporal, and visual network. Additionally, it was ensured that all remaining ICs had a similarity below 0.2 (1 = identical), which were estimated from a cluster merging similarity dendrogram to minimise the chance of overlapping networks. Similar networks have been described in a study using a model of sustained deep tissue pain (32). Group ICA differences were reported at p < 0.05 (using Bonferroni correction for multiple comparisons). We also extracted network-based FC strength (using GIFT) and correlated this parameter with structural markers. For simplicity, we focus on FC-FA interactions.
FC by seed-to-whole-brain analysis
Seed-to-whole-brain FC (bandwidth 0.01–0.1 Hz) was examined by spatiotemporal cross-correlations using CONN toolbox (v13o, http://www.nitrc.org/projects/conn/). WM, cerebrospinal fluid (CSF), and the six motion parameters were used as covariates of no interest. Only the WM and CSF signals were removed to avoid any bias introduced by removing the global signal (i.e. GM) (36,37). This approach should ‘normalise’ the distribution of voxel-to-voxel connectivity values as effectively as including the global signal as a covariate of no interest, but without the potential problems of the latter method. Although we did not record respiration and cardiac responses, it has been demonstrated that non-neuronal physiological noise (e.g. cardiac and respiratory signal) can successfully be removed by the ‘CompCor’ algorithm (36), as implemented in the CONN toolbox. As it is centrally involved in pain processing, the seed was placed in the mid-PAG region (MNI coordinates: x = −1, y = −28, and z = −6). Similar MNI coordinates for the PAG have been used in another FC study in pain patients (17). We first estimated FC maps on the single participant level. For second-level analysis, we then applied a univariate analysis of variance (ANOVA) to test for the main effect of the group. Between-group comparisons were then performed using post-hoc unpaired two-tailed t-tests. The statistical threshold was first set to p < 0.001 (uncorrected, t > 3.2), as used in other fMRI studies of pain (38,39). We then applied an additional cluster extent correction of k ≥ 24 voxels to correct for multiple comparisons using the false discovery rate (FDR) correction (40) in order to achieve p < 0.05 (corrected). Patient-specific anxiety, depression, pain intensity (VAS), and headache frequency (MOH only) values were linked to FC strength using Pearson’s correlations. To limit the number of multiple comparisons, FC strength was first extracted from the PAG-related FC and then masked by the regions showing FC group differences for the contrasts: MOH > CN, MOH < CN, MYO > CN, and MYO < CN.
Structural imaging
The T1-weighted volume sequences of the whole brain were acquired using a three-dimensional magnetisation-prepared rapid gradient echo (MPRAGE) sequence (TR: 8.7 ms, TE: 2.3 ms, flip angle: 8.0°, voxel size 0.86 mm × 0.86 mm × 1.0 mm, axial slice orientation, matrix size 256 × 256) on a 3T Philips Achieva scanner (Philips Healthcare, Best, The Netherlands), equipped with an eight-channel head coil as used in previous studies (10,11).
DTI
A 32-directional DTI scan was performed in all participants with the following parameters: number of slices: 60, TR: 10’331 ms, TE: 55 ms, field of view: 224 × 120 × 224, duration: 7.1 min, number of diffusion b0-values: 2, slice thickness: 2 mm, gap: 0 mm, voxel resolution: 3.6 mm × 3.6 mm, flip angle: 90°, and b value = 1000 s/mm2.
DTI pre-processing
DTI data were processed and analysed using FMRIB Software Library (FSL) software 5.0.7 (Oxford Centre for Functional Magnetic Resonance Imaging of the Brain Software Library; http://www.fmrib.ox.ac.uk/fsl) according to the default TBSS pipeline. Diffusion data were corrected for eddy-currents using the FMRIB’s Diffusion Toolbox (FDT). Brains were extracted from non-brain tissues using the ‘bet’ procedure (41). FA and MD images were created using the ‘dtifit’ procedure by fitting a DT model at each voxel.
DTI analysis and statistics
Voxelwise statistical analysis of the FA data was carried out using TBSS (42), implemented on FSL (43). All participants’ FA data were non-linearly registered to an FMRIB58_FA standard-space image (FMRIB Centre, University of Oxford, Department of Clinical Neurology, John Radcliffe Hospital, Headington, Oxford, UK; http://www.fmrib.ox.ak.uk/FMRIB58_FA.html) and nonlinearly transformed into MNI space. The mean image of all aligned FA images was created and thinned to provide a skeletonised mean FA image which represents the centre of all tracts common to the group. A threshold of FA at 0.2 was used to exclude GM or CSF and control for high inter-individual variability. Each aligned FA image of all participants was then projected onto this skeleton and the resulting data fed into voxelwise cross-participant statistics. Similar steps were carried out using the ‘tbss_non_FA’ script to obtain MD images which were also projected onto the mean FA skeleton. A quality control was performed by visual inspection of all FA images. Voxelwise statistical analysis on FA and MD was performed via a permutation-based inference for nonparametric statistical thresholding (5000 permutations) using FSL’s ‘randomise’ tool and two-sample t tests (CN vs. MOH, CN vs. MYO, MOH vs. MYO). Age, gender and total intracranial volume (TIV) were included as ‘covariates of no interest’ in all TBSS analyses to attenuate any potential confounding effect on the variable of interest. TIV was used as a variable of no interest as TIV was shown to influence FA and MD (44). The resulting statistical maps were thresholded at p < 0.05 (family-wise error (FWE) corrected) using the threshold-free cluster enhancement (TFCE) method (45). Results were also evaluated at a TFCE uncorrected statistical level (p < 0.001), as used in other TBSS-related DTI studies in headache that have applied the TFCE method (44,46–49). Regions were labelled anatomically by mapping the statistical map to JHU-WM Tractography and JHU ICBM-DTI-81 WM labels atlases. The association between disease duration, pain intensity, HADS-Anxiety (HADS-A) and Depression (HADS-D) scores to FA and MD values (in clusters with significant between-group differences) was examined at p < 0.001 (uncorrected). Further, we looked at interactions between FA, MD, and FC values using Pearson’s correlations.
Statistical analysis of demographical and clinical data
Chi-square (χ2) test was used to analyse categorical data (e.g. gender) whereas one-way ANOVA followed by Tukey’s post-hoc comparisons was applied for continuous variables (e.g. age, headache duration and frequency, anxiety and depression scores). The level of statistical significance was set at p < 0.05.
Results
Demographics and clinical characteristics
Medication in MYO and MOH groups.

MOH: medication-overuse headache, MYO: myofascial pain.
fMRI: independent-component analysis
Head motion parameters during fMRI did not differ between groups with respect to rotation and translation values (all ps > 0.1, unpaired two-tailed t tests). In none of the examined groups did total displacement exceed 1 mm or 1 degree, respectively, along the fMRI run. Hence, all participants could be included in the subsequent FC analyses. We first applied the ICA to examine group differences on the network level (Figure 1 and Table 3). As shown in Figure 1, significant FC increases were seen in the SN (MOH > CN and MOH > MYO) and inferior temporal network (MOH > CN, MOH > MYO). In contrast, significant FC decreases (MOH < CN and MYO < CN) were seen in the bilateral FPN (including the PAG) in both patient groups.
Summary of the functional connectivity (FC) results, using an independent component analysis (ICA). Statistical group comparisons are shown in a colour code (white bar: p > 0.05, green bar: p < 0.05 (using Bonferroni correction for multiple comparisons). CN: healthy controls; MOH: medication-overuse headache; MYO: myofascial pain; PAG: periaqueductal grey. (a) fronto-parietal attention network (with PAG), (b) inferior temporal network, (c) saliency network. ICA results. Significant group differences are indicated by a(p < 0.05, using Bonferroni correction for multiple comparisons). ICA: independent component analysis; CN: healthy controls; MOH: medication-overuse headache; MYO: myofascial pain.

fMRI: Seed-to-voxel analysis (seed: PAG)
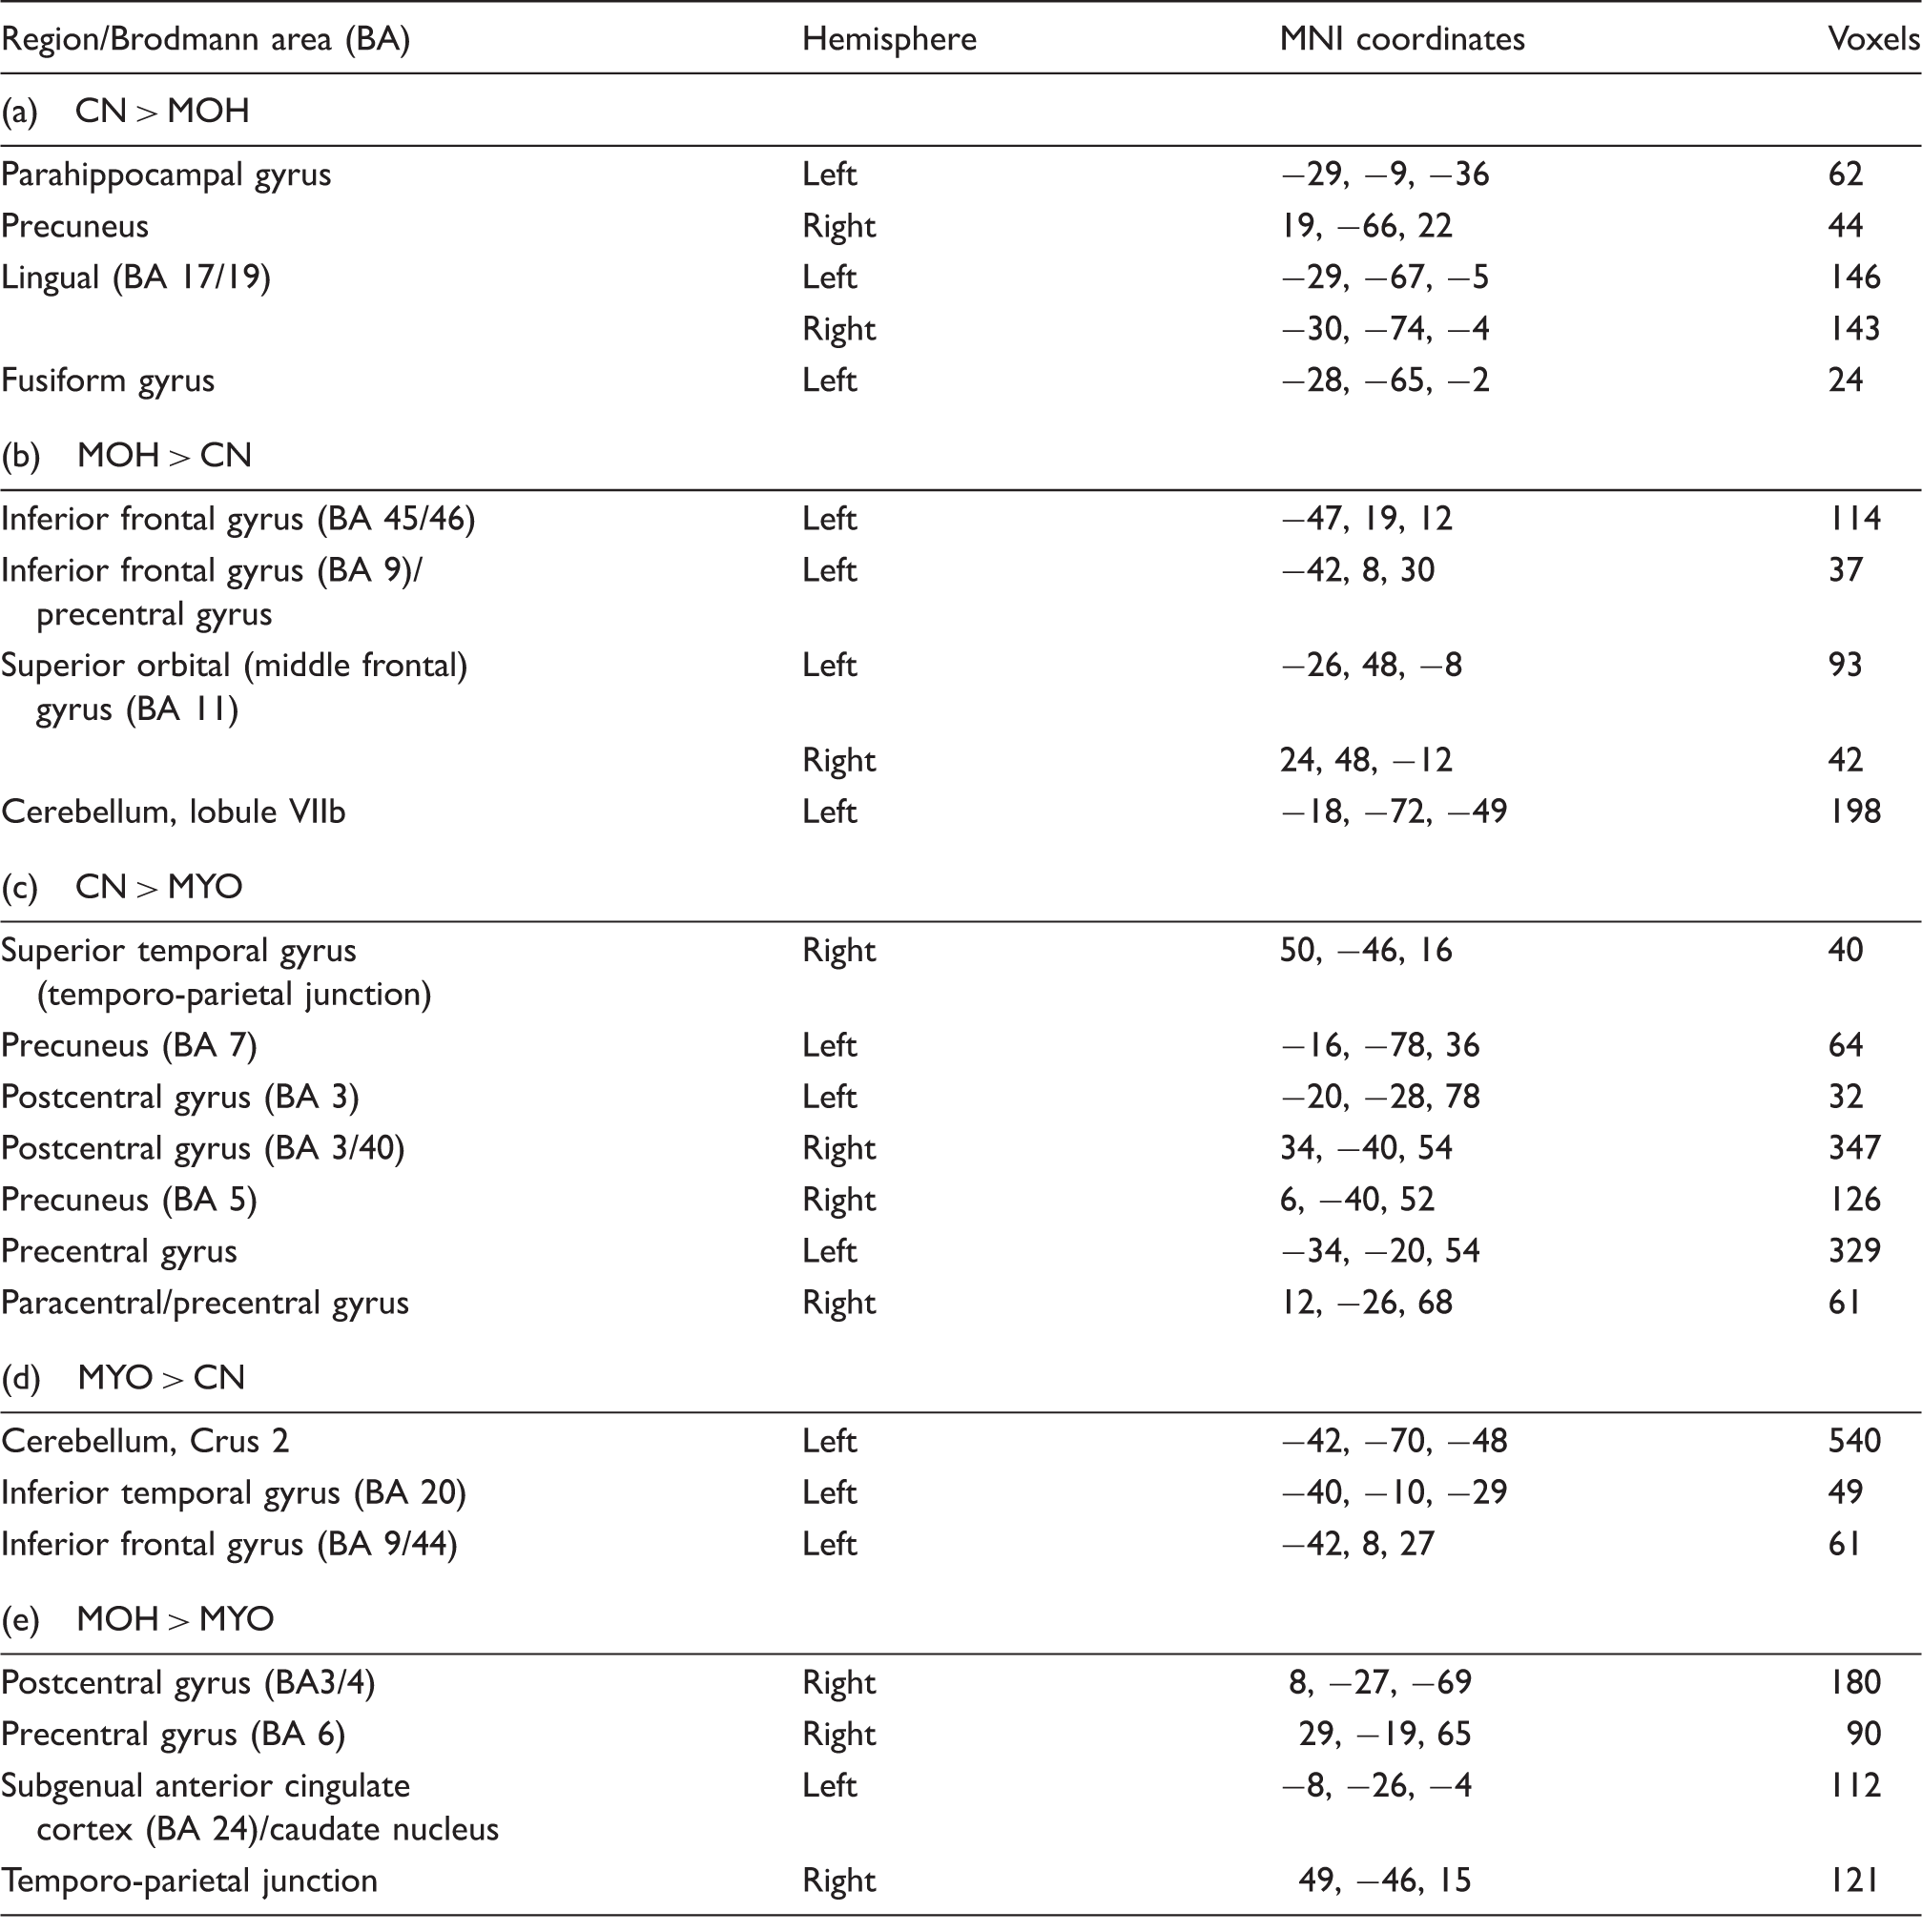
The within-group seed-to-voxel analysis (Figure 2) showed that the CN group demonstrated FC between the PAG and dorsal ACC (label A), thalamus, posterior insula and visual areas, similar to recent FC studies using the PAG as seed region (17,19). FC between PAG and the supplementary motor area (SMA, label B) was detected in both the CN and MYO groups, which was not significant in MOH. In contrast, the MOH group exhibited FC of the PAG with the parietal cortex (including the precuneus and posterior cingulate cortex (label C), and rostral anterior cingulate cortex (ACC, label D). Further, both patient groups as well as the CN group showed FC between the PAG and surrounding midbrain regions. Between group differences are summarised in Table 4, Figures 3 and 4. Both patient groups showed higher FC between the PAG and left inferior frontal gyrus (IFG) and left cerebellar regions than CN (Figure 4(b) and (d)). MOH had lower FC to regions including the visual cortex, precuneus and temporal regions and higher FC to precentral regions and OFC. In contrast, MYO had decreased FC to pre- and postcentral regions compared to CN and MOH (Figures 3 and 4). The direct comparison of both patient groups (Figure 4) revealed significant differences for the contrast MOH > MYO only, with higher PAG-mediated FC to the pre- and postcentral gyri (BA 3/4/6, Figure 4, label 1), left subgenual ACC/caudate nucleus (Figure 4, label 2), and the right temporo-parietal junction (TPJ) (Figure 4, label 3).
Within-group seed-to-voxel results. The seed was placed in the PAG (MNI coordinates: −1, −28, −6). Letters correspond to the following brain regions: A = dorsal anterior cingulate cortex, B = supplementary motor area, C = posterior cingulate cortex and adjacent (posteriorly located) precuneus, D = rostral anterior cingulate cortex. The statistical threshold is set to p < 0.05 (FDR corrected t > 3.2). PAG: periaqueductal grey; MNI: Montreal Neurological Institute; CN: healthy controls, MOH: medication-overuse headache, MYO: myofascial pain; FDR: false discovery rate. Seed-to-voxel results comparing healthy to pain groups. The seed was placed centrally in the PAG (MNI coordinates: −1, −28, −6). Labels indicate different brain regions. The statistical threshold is set to p < 0.05 (FDR corrected, t > 3.2). PAG: periaqueductal grey; MOH: medication-overuse headache, MYO: myofascial pain; CN: healthy controls; PAG: periaqueductal grey; MNI: Montreal Neurological Institute; FDR: false discovery rate. (a) CN > MOH, (b) MOH > CN, (c) CN > MYO, (d) MYO > CN. Seed-to-voxel results comparing medication-overuse headache (MOH) to myofascial pain (MYO). The seed was placed centrally in the PAG (MNI coordinates: −1, −28, −6). Labels indicate different brain regions. The statistical threshold for MOH > MYO is set to p < 0.05 (FDR corrected, t > 3.2). 1: caudate nucleus, 2: postcentral gyrus, and 3: right temporo-parietal junction. FDR: false discovery rate; PAG: periaqueductal grey; MNI: Montreal Neurological Institute. Seed-to-voxel group differences. The seed was placed in the central PAG. All results are shown at p < 0.05 (corrected for multiple comparisons using the false discovery rate (FDR) correction). PAG: periaqueductal grey; CN: healthy controls; MOH: medication-overuse headache; MYO: myofascial pain; MNI: Montreal Neurological Institute.


Correlation of FC strength with clinical parameters
No significant correlations were found between (PAG-mediated) FC strength and clinical values at p < 0.001 (uncorrected).
DTI: Whole-brain WM analysis
No significant differences were found in total mean FA across groups (CN (mean, SD): 0.335, 0.011; MOH (mean, SD): 0.334, 0.012; MYO (mean, SD): 0.335, 0.009; p = 0.999) and MD (CN (mean, SD): 0.513 × 10⁻³ mm2/s, 0.013 × 10⁻³ mm2/s; MOH (mean, SD): 0.507 × 10⁻³ mm2/s, 0.015 × 10⁻³ mm2/s, MYO (mean, SD): 0.512 × 10⁻³ mm2/s, 0.012 × 10⁻³ mm2/s; p = 0.611). No significant group differences were detected at p < 0.05, corrected with FWE. Significant group differences at p < 0.001 (uncorrected) are reported in Table 5. Compared with CN, MOH had significantly reduced FA in the right parietal operculum (OP, Figure 5a, bottom panel) and increased FA in the left insula compared to CN (Figure 5a, top panel). On the other hand, patients with MYO showed increased FA in the right insula relative to CN (posterior part, Figure 5a, top panel).
Summary of the diffusion tensor imaging (DTI) group results. Displayed are the group differences between CN and MOH, CN and MYO. Statistical threshold is set to p < 0.001 (uncorrected). CN: healthy controls; MOH: medication-overuse headache; MYO: myofascial pain. (a) Differences in functional anisotropy (FA) of the right insular cortex and parietal operculum (OP) for the contrast MOH − CN and MYO − CN. (b) Differences in mean diffusivity (MD) of the left insular cortex for the contrast MOH − CN. DTI results. Group differences on WM microstructure based on TBSS analysis. DTI: diffusion tensor imaging; WM: white matter; MNI: Montreal Neurological Institute; TBSS: tract-based spatial statistics; FA: fractional anisotropy; MD: mean diffusivity; CN: healthy controls; MOH: patients with medication-overuse headache; MYO: patients with myofascial pain; R: right hemisphere; L: left hemisphere; SLF: superior longitudinal fasciculus. Results are displayed at p < 0.001 (uncorrected).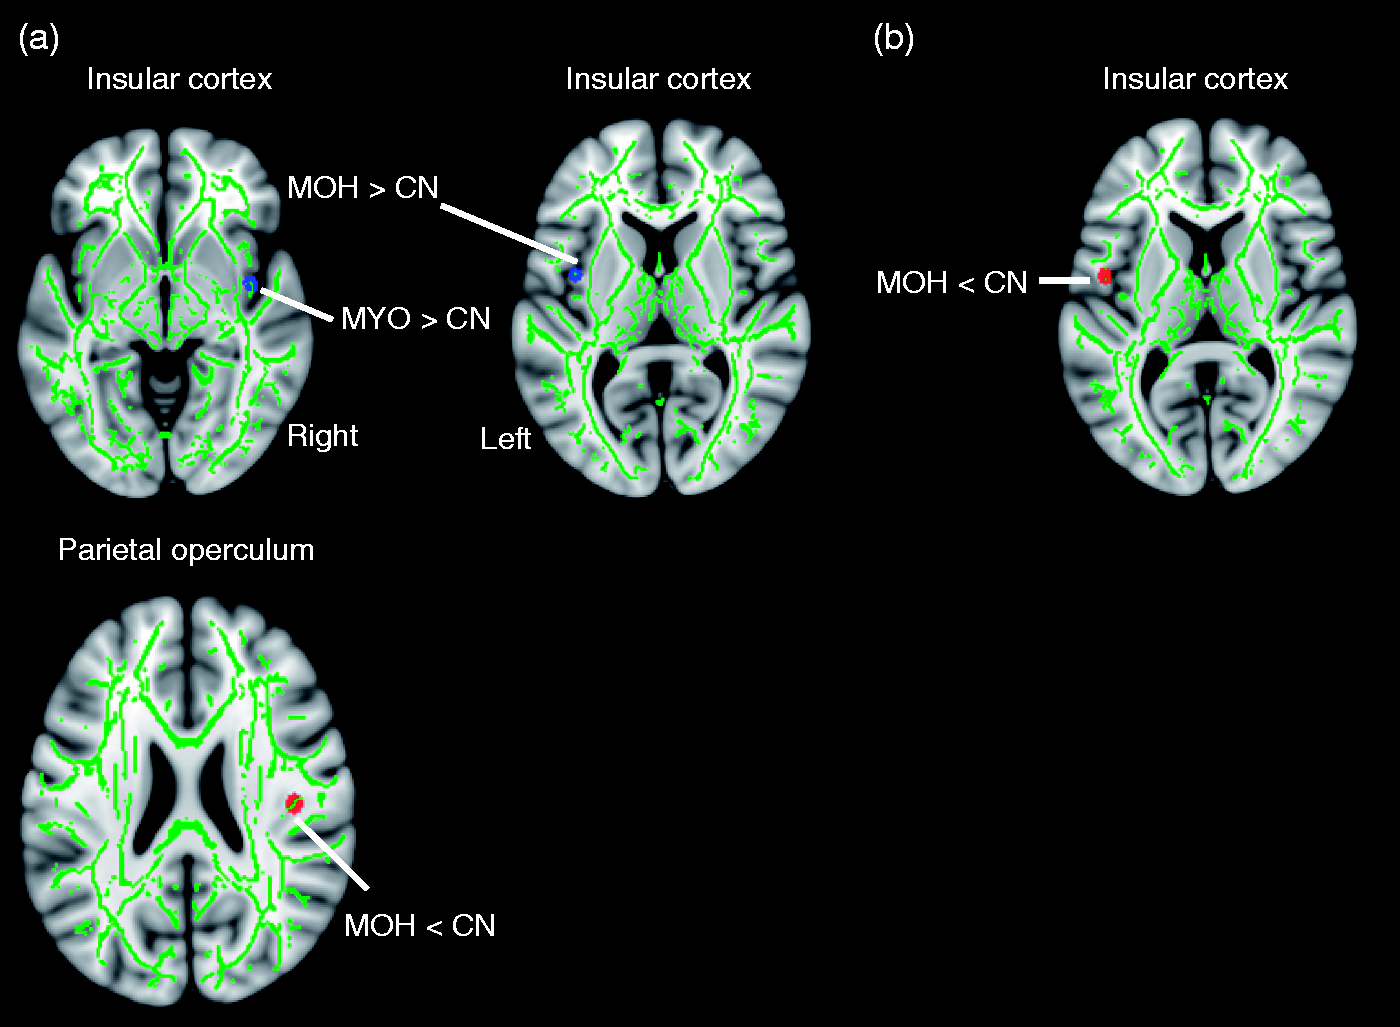

MD was significantly decreased in MOH compared to CN in the left insula (Figure 5b, top panel). There were no significant changes in MD in MYO (relative to CN). The comparison ‘MOH vs. MYO’ did not reveal any significant differences in FA values. Decreased MD values were found in MOH relative to MYO in several clusters located in the cerebellum (mostly right inferior and middle cerebellar peduncle and adjacent pontomedullary area), left lingual gyrus, pallidum, and fusiform gyrus (Table 5).
DTI: Correlation of DTI with clinical parameters
We then examined the correlations of FA and MD values with clinical scores. After controlling for age, gender and TIV within the MOH group, we found no significant correlation, which survived p < 0.001 (uncorrected).
DTI-fMRI: Correlation of network-based FC with FA
We next calculated if group FC differences (e.g. MOH > CN) were linked to group differences in FA. We found that FC of the SN was paralleled by higher FA values of the insular cortex for MOH > CN (right insular cortex, r = 0.86, p < 0.001, Figure 6; left insular cortex: r = 0.58, p = 0.008, not shown) and across all patients (right insular cortex: r = 0.43, p = 0.04, results not shown).
Interaction between functional connectivity (FC) strength and structural (neuronal) integrity. In MOH, FC of the SN was positively linked to functional anisotropy (FA) of the right (a) and left (b) insular cortex at p < 0.001.
Discussion
In the present study we found changes in FC and WM integrity in patients with MOH and MYO. At the network level, hypoconnectivity in the FPN was detected in both pain groups. In contrast, hyperconnectivity within the SN and inferior temporal network were features only in MOH (relative to CN and MYO). Both pain groups had increased FC of the midbrain PAG with lateral frontal and cerebellar regions, whereas hyperconnectivity with orbitofrontal regions was found only in MOH. In contrast, MYO had lower FC between the PAG and sensorimotor cortex. Using DTI, increased FA was seen in the insula (both pain groups) and decreased FA in right OP (MOH only). MD changes were found in the left insula in MOH. In MOH, insular WM changes correlated with FC of the SN.
Our findings provide evidence that FC and WM alterations in MOH cannot be solely attributed to neuronal processes linked to chronic pain.
FC: ICA results
FC alterations (relative to CN) have been reported in migraine patients without aura (27), MOH (16), and fibromyalgia (25,26). In the study by Russo et al. (27) FC was lower in the right FPN (= executive-working memory network) in patients with migraine without aura, including the middle frontal gyrus and dorsal ACC. In our study we found bilateral hypoconnectivity in the FPN in both pain (MOH and MYO) groups compared to CN, suggesting a disturbed functionality of the executive network in chronic pain disorders, which is consistent with the notion of impaired executive (and memory) function in chronic pain (50). However, executive function was normal in patients with episodic migraine without aura (27).
Further, we observed disturbed, saliency-related, functional communication in MOH, reflected by hyperconnectivity within the SN for MOH relative to CN and MYO. In addition, in the left insula we found increased FA and decreased MD (see below) in MOH. In MOH, FC strength of the SN was associated with FA in the insular cortex, suggesting that hyperconnectivity could ultimately lead to structural changes in parts of the SN, at least in the insular cortex. The insula and ACC are key structures within pain processing systems and have been related to attentional and perceptive aspects of pain (51). The ACC is involved in descending pain modulation, being functionally and anatomically connected with the PAG (18,19). A previous study found increased FC between the ACC and anterior insula in high-frequency compared to low-frequency migraine (52). Morphometric studies found decreased GM in the bilateral insula in MOH, not reversible after detoxification (10,11) and decreased cortical thickness in cingulate cortex and insula in high-frequency vs. low-frequency migraine (52). Hence consistent functional and structural alterations within the SN are demonstrated in MOH. In contrast, a recent study on episodic migraine without aura reported decreased interhemispheric FC in the ACC and decreased FA in the corpus callosum (52,53). In our study, MYO did not show significantly different FC relative to CN in the saliency regions, which was unexpected, as increased FC between insula and ACC has been reported in chronic pain (25).
Nevertheless, our results are in agreement with studies demonstrating a link between FC strength and structural markers of neuronal integrity such as FA (54,55).
FC: seed-based results
The investigation of PAG-mediated FC analysis was motivated by the observation that the PAG shows (a) reversible structural alterations in MOH (10,11) and (b) has disturbed FC to several brain areas within nociceptive and somatosensory processing pathways in episodic migraine (17). The PAG is organised in distinct longitudinal columns that receive selective input from forebrain regions including the OFC and cingulate cortex as well as sensory neurons from the trigeminal nucleus and dorsal horn (18). It is a substantial component of the descending pain modulatory network, and exerts an inhibitory or excitatory control on nociceptive input via the rostral ventromedial medulla, which in turn projects to the spinal and medullary dorsal horns (56). In the present study only one midbrain seed including right and left ventrolateral PAG was selected, because the FC between them was very high, consistent with previous studies (17,19). Both patient groups showed increased FC between the PAG and left frontal and cerebellar regions, which suggests an association with chronic pain states rather than a pattern specific for MOH. The dorsolateral prefrontal cortex is considered a part of pain processing matrices (51). The cerebellum is often reported in studies on chronic pain, and is functionally connected to the PAG (19,57). In addition, PET studies reported hypermetabolic activity of the cerebellum in MOH patients before medication withdrawal (9).
Patients with MOH had a distinct pattern of FC between PAG (relative to MYO) in several regions implicated in the pathophysiology of migraine and MOH: stronger FC to the bilateral OFC and weaker FC to occipital and mid-cingulate regions. The OFC shows hypometabolism in MOH that persisted after withdrawal and GM volume in OFC predicted treatment response (9,11). Dysfunction of the OFC has been implicated in maladaptive decision making in dependence-related disorders, and MOH has been discussed in this context (58).
Cortical spreading depression (CSD), the pathophysiological correlate of migraine aura, starts in the visual cortex (59). Clinically ‘silent’ CSDs probably occur in migraine without aura and the vulnerability for recurrent CSDs was found to be increased in an animal model of MOH (20,60). Decreased connectivity between the PAG and occipito-parietal regions might reflect dysfunction of these regions with increased susceptibility for CSD and disturbed interplay with pain modulation in the brainstem.
In MYO, connectivity between the PAG and SMN was decreased. Alterations in RS activity in the SMN have been described in a model of MYO. Specifically, connectivity of the SMN is disrupted after continuous painful stimulation, and shifted to the SN (32).
Comparing PAG-related connectivity between MOH and MYO, we found decreased FC to the SMN in MYO, similar to the comparison with controls. In addition, we observed increased FC between the PAG and the right TPJ and left subgenual ACC in MOH compared to MYO. The right TPJ is involved in the processing of social interactions and in the empathy for pain (61,62). The subgenual ACC – which projects to the ventromedial striatum and the accumbens area – is involved in reward processing and addiction (63,64). We conclude that these FC increases in MOH may be the result of a disturbed interplay between nociceptive and cognitive control brain regions.
DTI results
WM changes in patients with chronic pain conditions might occur due to (progressive) maladaptive plasticity over pain chronic manifestation (65). The notion of maladaptive plasticity in pain regions is in line with our findings of both increased FA in the insular cortex in MOH and MYO, as well as decreased FA in the right parietal operculum (MOH only). Several factors may contribute to decreased FA, including increased branching, more crossing fibres or axons, oedema, changes to protein filaments, cell membrane disruption and/or decreased myelin. Prolonged nociceptive activity may be related to central sensitisation that contributes to chronic pain manifestation and the initiation of central neuroinflammatory processes (66,67).
It is known that the OP, posterior insula and cingulate cortex receive a large proportion of the spinothalamic cortical input in primates via the central ascending nociceptive pathway and have been implicated in response to painful stimulation (51). Group differences (MOH < CN) in the OP region are hence fully in line with a recent interpretation of the medial and parietal opercular regions as somatosensory regions devoted to the processing of spinothalamic inputs (51,68).
The insula has been implicated in the perception of pain (51) both in acute and chronic pain conditions. From a functional point of view, the posterior and mid insular cortex are predominantly associated with the sensory aspect of pain (69–71), whereas the anterior insula has been implicated in the cognitive-affective dimension of pain which is sensitive to contextual manipulations (72,73). A recent combined structural and FC analysis of insular subdivisions (74) further supported that the anterior insular part is predominantly connected to (pre)frontal regions (e.g. OFC and ventrolateral prefrontal), whilst the posterior insular part is strongly connected to somatosensory regions. The mid insula integrates sensory and cognitive emotional information (75) and displays widespread connections with the parietal and temporal regions, the IFG, OFC and premotor cortex (76). According to the same insular subdivision system, we found increased FA in the mid insular part in MOH and in the right posterior insular part in patients with MYO. (74,77,78).
Limitations of the study
In contrast to previous studies on episodic migraine, patients with MOH were not scanned during pain-free intervals but experienced headaches during scans. This approach was chosen as most patients had almost daily headaches. The MYO group was also not pain free during scans. Also, abstinence from acute pain medication was not requested, as this might induce acute withdrawal headaches. An influence of chronic medication use on FC and DTI measures (such as FA and MD) is unknown to date but cannot be fully excluded. Pain duration differed between patient groups. As pain duration was not associated with changes in FC or WM integrity, an effect on group comparisons was considered unlikely.
DTI findings are reported at p < 0.001 uncorrected, as the sample size was rather small, similar to previous studies (46,47). However, structural and functional changes overlapped in the insula showing a significant correlation between functional and structural measures. All statistical comparisons for fMRI survived a threshold of p < 0.05 (corrected), which underlines the robustness of these findings.
Interpretation
Chronic pain may be associated with changes in RS FC and WM tracts, independent from the underlying aetiology. Hyperconnectivity (relative to controls) within the SN along with associated WM changes therein suggest a particular role of this network in MOH. Further, in MOH regions related to internal control, pain modulation and CSD showed impaired connectivity with the PAG, probably related to an imbalance between descending pain facilitation/inhibition.
Key findings
Functional connectivity identifies different networks in medication-overuse headache (MOH) and myofascial pain (MYO). MOH and MYO demonstrate lower functional connectivity in the fronto-parietal attention network than controls. MOH show increased functional connectivity in the saliency network. Diffusion tensor imaging indicates disturbed white matter integrity in the insular cortex in MOH and MYO as well as in the parietal operculum (MOH only). Functional connectivity strength of the saliency network was positively correlated to structural neuronal integrity of the insular cortex in MOH.
Footnotes
Declaration of conflicting interests
The authors declared no potential conflicts of interest with respect to the research, authorship, and/or publication of this article.
Funding
The authors disclosed receipt of the following financial support for the research, authorship, and/or publication of this article: This work was supported by a grant (DFL_MF 1149) from the Centre for Clinical Research, University and University Hospital Zurich to author Franz Riederer. Foteini Christidi is supported by the State Scholarships Foundation (I.K.Y.), the Action ‘State Scholarships Foundation’s mobility grants programme for the short-term training in recognised scientific/research centres abroad for candidate doctoral or postdoctoral researchers in Greek universities or research centres’, and the ‘IKY Fellowships of Excellence for Post-Graduate Studies in Greece-Siemens Program’.