
Abstract
Objective
To evaluate the resting-state visual network functional connectivity in patients with migraine with aura and migraine without aura during the interictal period.
Population and methods
Using resting-state functional magnetic resonance imaging, the resting-state visual network integrity was investigated in 20 patients with migraine with aura, 20 age- and sex-matched patients with migraine without aura and 20 healthy controls. Voxel-based morphometry and diffusion tensor imaging were used to assess whether between-groups differences in functional connectivity were dependent on structural or microstructural changes.
Results
Resting-state functional magnetic resonance imaging data showed that patients with migraine with aura, compared to both patients with migraine without aura and healthy controls, had a significant increased functional connectivity in the right lingual gyrus within the resting-state visual network (p < 0.05, cluster-level corrected). This abnormal resting-state visual network functional connectivity was observed in the absence of structural or microstructural abnormalities and was not related to migraine severity.
Conclusions
Our imaging data revealed that patients with migraine with aura exhibit an altered resting-state visual network connectivity. These results support the hypothesis of an extrastriate cortex involvement, centred in the lingual gyrus, a brain region related to mechanisms underlying the initiation and propagation of the migraine aura. This resting-state functional magnetic resonance imaging finding may represent a functional biomarker that could differentiate patients experiencing the aura phenomenon from patients with migraine without aura, even between migraine attacks.
Introduction
Migraine arises from a primary brain dysfunction that leads to episodic activation and sensitization of the trigeminovascular pain pathway. About one-third of patients with migraine experience transient neurological symptoms during attacks, so-called ‘aura’, among which the most common is visual aura (1). An altered cortical excitability and its correlation to cortical spreading depression seem to underlie the aura symptoms (2).
In the last decades, visual pathways have been extensively explored in patients with migraine using different experimental approaches. Imaging studies have provided conflicting evidence of visual pathways morphological changes in patients with migraine (3–6), whereas visual cortex functional abnormalities have been consistently reported in these patients (7–9). In particular, an extrastriate cortex hyper-responsiveness seems to play a critical role in the initiation and propagation of the migraine aura (10).
In recent years, the development of resting-state functional magnetic resonance imaging (RS-fMRI) has advanced the assessment of brain functional connectivity (11,12). Previous RS-fMRI studies have shown a disruption in the resting-state visual network (RS-VN) topological organization in patients with migraine without aura (MwoA) (13,14). Nevertheless, to our knowledge, no RS-fMRI studies have been specifically conducted to evaluate RS-VN integrity in patients with migraine with aura (MwA). Therefore, in the present study we aimed to explore the RS-VN functional integrity (11) in patients with MwA, during the interictal period, when compared to both healthy controls (HC) and patients with MwoA. We hypothesize that this network might be altered in patients with MwA, even during the interictal period. Furthermore, we used voxel-based morphometry (VBM) (15) and diffusion tensor imaging (DTI) (16) to assess whether possible connectivity changes were dependent on structural or microstructural brain differences.
Methods
Patient population
According to the International Headache Society criteria of International Classification of Headache Disorders (ICHD-II, 2004) for ‘typical aura with migraine headache’ (17) and to the more recent ICHD-3 beta version criteria for ‘typical aura with headache’ (18), 23 consecutive patients with exclusively MwA were prospectively recruited. Specifically, patients with MwA suffered only from visual aura in the course of their MwA attacks. Contextually, 23 consecutive patients with episodic MwoA (17,18) were also recruited. All patients were right-handed and had a normal neurological examination. Exclusion criteria were the presence of any other type of headache, somatic or psychiatric conditions or intake of daily medication. To avoid any possible aura, migraine or pharmacologically related interferences on blood-oxygenation-level-dependent (BOLD) signal fluctuation, patients were both aura and migraine-free and not taking rescue medications for at least three days before scanning. The patients had never taken migraine preventive drugs in the course of their life. Patients were interviewed three days after the MRI scan to ascertain that they were also migraine-free in this period. Of the enrolled patients with MwoA, two were excluded for experiencing a migraine attack during this follow-up period. Furthermore, data from four patients have been excluded from final statistical analyses because of motion-related signal artefacts.
Clinical characteristics of patients with MwoA, MwA and HC.
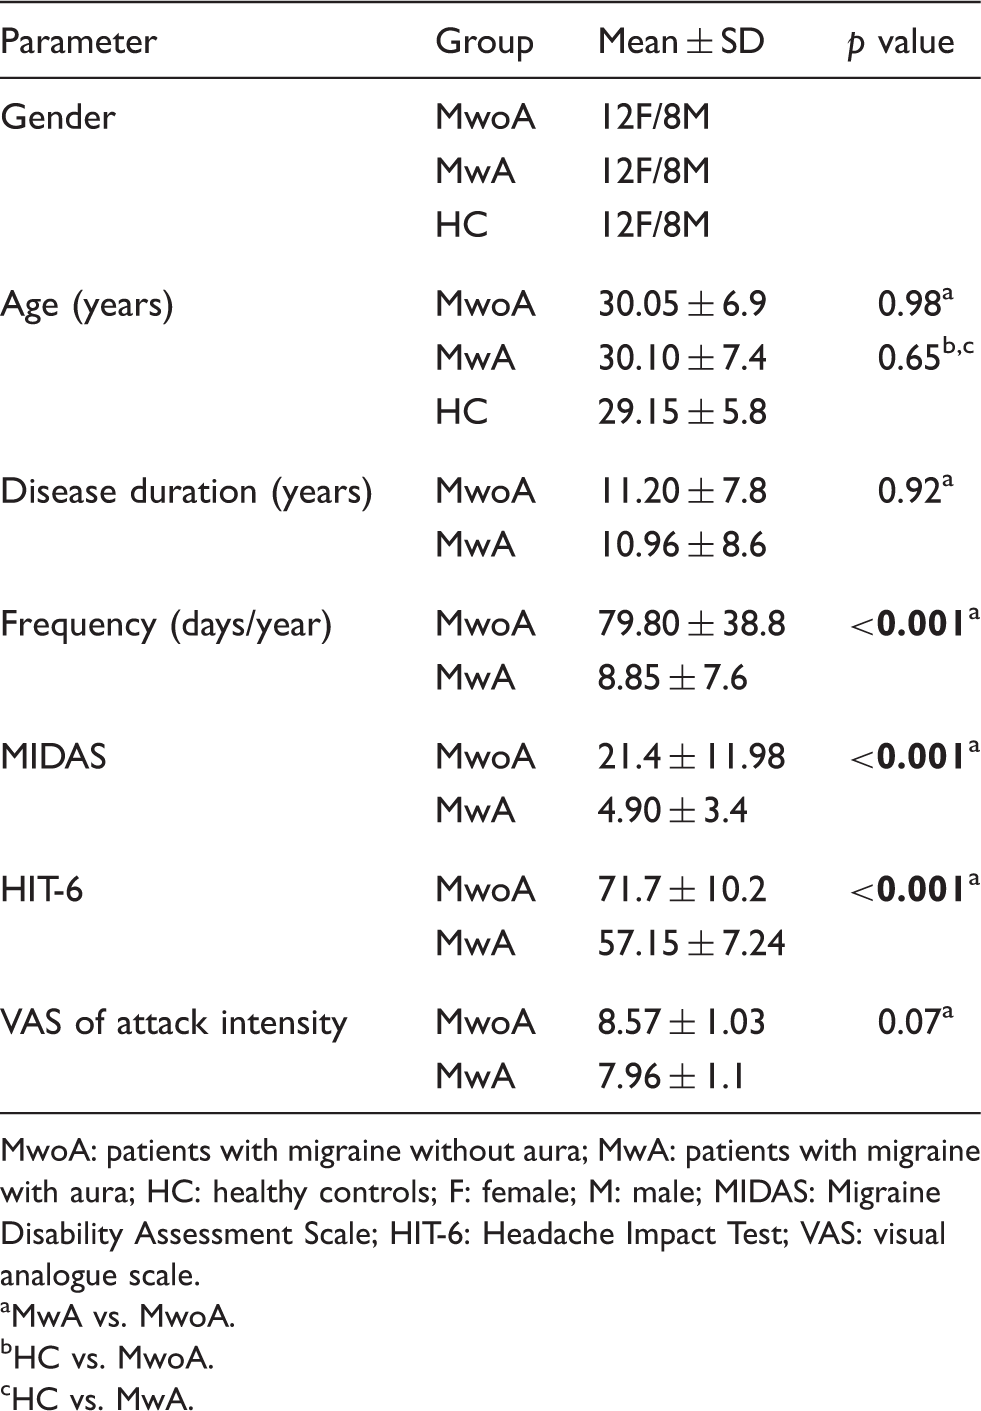
MwoA: patients with migraine without aura; MwA: patients with migraine with aura; HC: healthy controls; F: female; M: male; MIDAS: Migraine Disability Assessment Scale; HIT-6: Headache Impact Test; VAS: visual analogue scale.
MwA vs. MwoA.
HC vs. MwoA.
HC vs. MwA.
All migraine patients and HC underwent preliminary MRI examination before entering the present study, to exclude any relevant structural abnormality.
Standard protocol approvals, registrations and patient consent
The experiments conformed to the principles of the Declaration of Helsinki and were approved by the Ethics Committee of the Second University of Naples. All participants provided informed, written consent after the experimental procedure had been explained.
Imaging parameters
MRI was performed on a 3 Tesla GE (General Electric, Minneapolis, MN, USA) Medical System whole-body scanner ‘‘Signa HDxt’’ equipped with an eight-channel parallel head coil. fMRI data consisted of 240 volumes of a repeated gradient-echo echo planar imaging T2*-weighted sequence (TR = 1508 ms, axial slices = 29, matrix = 64 × 64, field of view (FOV) = 256 mm, thickness = 4 mm, interslice gap = 0 mm, 10 discarded scans at the beginning). During the functional scan, subjects were asked to simply stay motionless, awake and relaxed, and to keep their eyes closed. Three-dimensional high-resolution T1-weighted sagittal images (GE sequence IR-FSPGR, TR = 6988 ms, TI = 1100 ms, TE = 3.9 ms, flip angle = 10, voxel size = 1 × 1×1.2 mm3) were acquired for registration and normalization of the functional images as well as for atrophy measures and VBM analysis.
Whole-brain DTI was performed using a GRE EPI sequence (repetition time = 10,000 ms, echo time = 88 ms, FOV = 320 mm, isotropic resolution = 2.5 mm, b value = 1000 s/mm2, 32 isotropically distributed gradients, frequency encoding RL). A T2-fluid-attenuated inversion recovery (T2-FLAIR) sequence (repetition time = 9.000 ms, echo time = 1.200 ms, inversion time = 2.500, axial slices = 44, matrix = 224,448, FOV = 240mm, thickness = 3 mm, interslice gap = 0 mm) was also acquired in all subjects.
Statistical analysis of clinical data
Demographic and clinical features of patients with MwoA, MwA and HC were compared using a t-test for independent samples or χ2, as appropriate. Computation was supported by the Statistical Package for the Social Sciences (SPSS 16.0) software. Significance threshold was set at p < 0.05.
MRI analysis
MRI analysis was performed by a single experienced observer. Due to the reported high prevalence of white matter (WM) lesions in patients with migraine (20), WM hyperintensities (WMH) load was measured using the software Medical Image Processing, Analysis and Visualisation (MIPAV; Centre for Information Technology, National Institutes of Health, Bethesda, MD, USA) (21). Using this fast and accurate semi-automatic post-processing application, the WMH load of all migraine patients and HC was identified and evaluated in terms of their volumetric features and signals.
RS-fMRI pre-processing and statistical analysis
Standard image data preparation and pre-processing, statistical analysis and visualization were performed with the BrainVoyager QX software (Brain Innovation BV, The Netherlands). Nuisance signals (global signal, WM and cerebro-spinal fluid (CSF) signals and motion parameters) were regressed out from each data set. Single-subject and group-level independent component analysis (ICA) were carried out, respectively, using the fastICA and the self-organizing group ICA algorithms. For each subject, 40 independent components were extracted. All single-subject component maps from all subjects were then ‘clustered’ at group level, resulting in 40 single-group average maps that were visually inspected to recognize the main physiological resting-state networks (RSNs). The selection of the RSN components entailed identifying in each group component map the presence of anatomically relevant areas that reproduced the layouts of the main physiological RSNs, as already reported in earlier RS-fMRI studies conducted with identical or similar ICA methodologies (11,12,22). A group-level random effects (RFX) analysis was carried out treating the individual subject map values as random observations at each voxel (11).
Single group contrasts were used to map the whole-brain distribution of the RS-VN components (p = 0.05, cluster level corrected). Then, an inclusive mask was created from these maps to define the search volume for within network group comparisons (patients with MwA vs. HC and patients with MwoA). These entailed calculating two-group contrasts at each voxel of the mask and accepting regional differences surviving a threshold of p = 0.05 (cluster-level corrected). The resulting statistical maps were overlaid on the standard ‘Colin-27’ brain T1 template.
To correct for multiple comparisons in all RFX maps, regional effects were only accepted for clusters surviving the joint application of a voxel- and cluster level statistical threshold chosen with a non-parametric randomization approach. Namely, an initial voxel-level threshold was set to p = 0.05 (uncorrected) and a minimum cluster size was estimated after 1000 Montecarlo simulations that protected against false-positive clusters up to 5%. Individual ICA z-scores were extracted from regions identified in the above analyses and used in linear correlation analyses, by means of Spearman's rho, with clinical parameters of migraine severity. In fact, ICA z-scores express the relative modulation of a given voxel by a specific ICA component activity and hence reflect the amplitude of the correlated fluctuations within the corresponding functional connectivity network.
Grey matter (GM) atrophy
On 3D T1-weighted images, normalized volumes of the whole brain were obtained by means of a fully automated method called structural imaging evaluation of normalized atrophy methodology (Siena) (23), which allows measuring longitudinal and cross-sectional changes in brain volumes and is part of the FMRIB Software Library (www.fmrib.ox.ac.uk/fsl). In the current study, the cross-sectional version of this tool (SIENAX) was used. This software performs the separation of brain from non-brain tissue, estimates the outer skull surface and uses these results to drive the spatial transformation to a standard template for normalizing with regard to the skull size. Next, a probabilistic brain mask derived in standard space is applied to ensure that certain structures, such as eyes or optic nerves, have not been included in the brain segmentation. Finally, random field model based segmentation is used to further isolate different tissue types and provide the normalized volumes of total brain, GM, WM and CSF.
Furthermore, data were processed and examined using SPM8 software (Wellcome Trust Centre for Neuroimaging, London, UK; http://www.fil.ion.ucl.ac.uk/spm), in which we applied VBM implemented in the VBM8 toolbox (http://dbm.neuro.uni-jena.de/vbm.html) with default parameters incorporating the DARTEL toolbox (24). Images were bias-corrected, tissue-classified and registered using linear (12-parameter affine) and nonlinear transformations (warping) within a unified model (15). Subsequently, the warped GM segments were affine-transformed into Montreal Neurological Institute (MNI) space and were scaled by the Jacobian determinants of the deformations to account for the local compression and stretching that occurs as a consequence of the warping and affine transformation (modulated GM volumes). The modulated volumes were smoothed with a Gaussian kernel of 8-mm full-width at half maximum.
The GM volume maps were statistically analysed using the general linear model based on Gaussian random field theory. Statistical analysis consisted of an analysis of covariance with total intracranial volume, age and gender as covariates of no interest. We assessed whole-brain regional differences between the three experimental groups, as well as differences over region of interest (ROI) based on the results of the whole-brain between groups RS-fMRI analysis. Statistical inference was performed at the voxel level, with a family-wise error (FWE) correction for multiple comparisons (p < 0.05).
WM damage
Tract-based spatial statistics (TBSS) analysis was performed by using the Functional MRI of the Brain (FMRIB) Software Library (FSL) software package (www.fmrib.ox.ac.uk/fsl) (25). Pre-processing included eddy currents, motion correction and brain-tissue extraction. For these group analyses, DTI images were warped to the MNI152 template, available as standard T1 data set in the FSL software package.
TBSS was run with fractional anisotropy (FA) maps to create the ‘skeleton’, which represents the centre of all fibre bundles in common to all subjects, and which was used for all other maps. To this purpose, FA images of all subjects were aligned to a common target (FMRIB58_FA standard space) using nonlinear registration, thereby FA, mean diffusivity (MD), radial diffusivity (RD) and axial diffusivity (AD) maps were calculated using the FSL FMRIB's Diffusion Toolbox tool and aligned to a 1 × 1×1 mm MNI152 standard space.
A mean FA skeleton was then created with threshold of FA > 0.2. The resulting statistical maps were thresholded at p < 0.05 corrected for multiple comparisons at a cluster level using the threshold-free cluster enhancement approach (25). All analyses were re-run with the inclusion of age, gender and WMH load as covariates of no interest.
Results
Clinical and structural MRI findings
WMH load and global atrophy in patients with MwoA, MwA and HC.
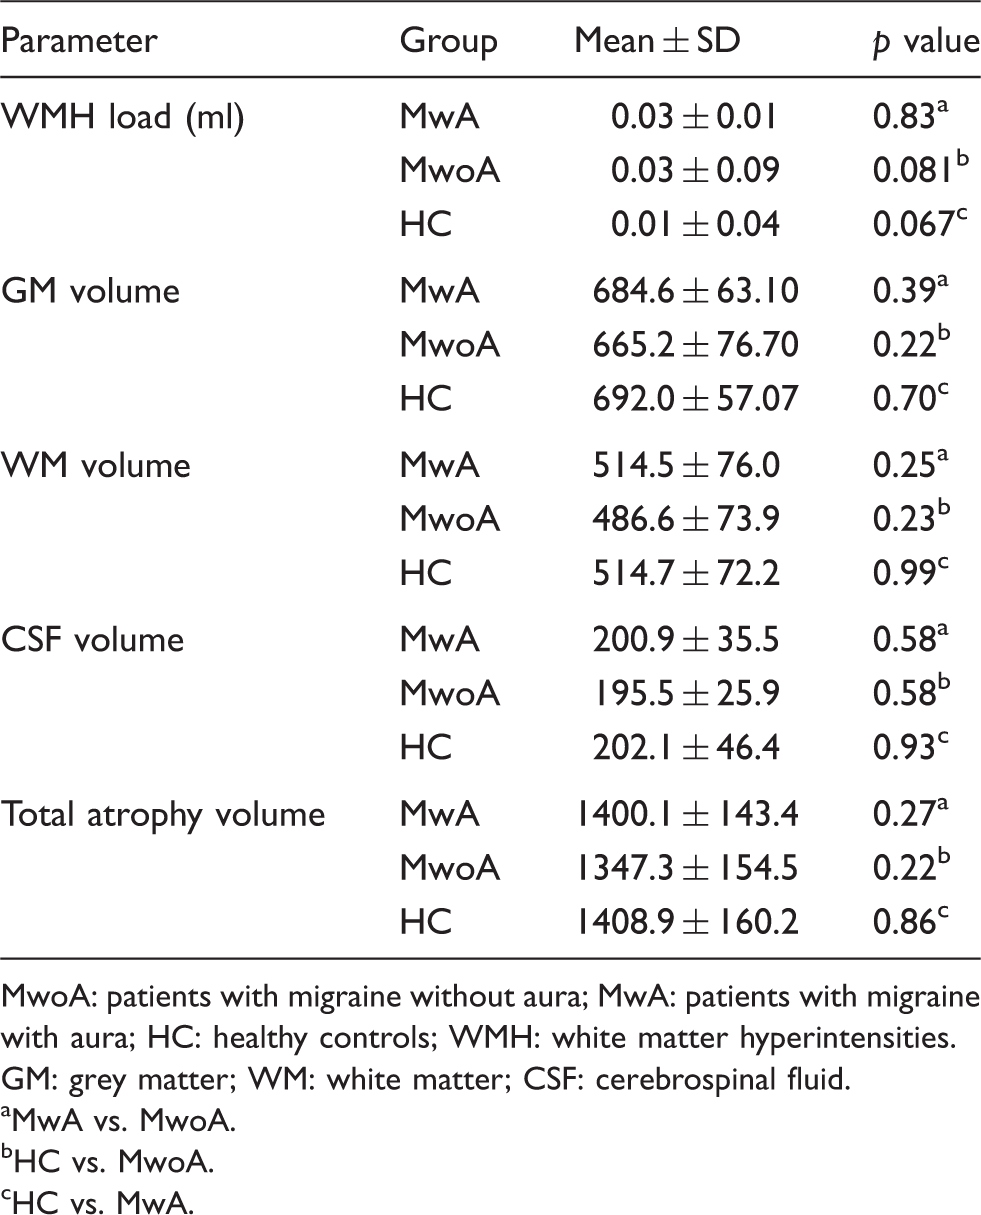
MwoA: patients with migraine without aura; MwA: patients with migraine with aura; HC: healthy controls; WMH: white matter hyperintensities. GM: grey matter; WM: white matter; CSF: cerebrospinal fluid.
MwA vs. MwoA.
HC vs. MwoA.
HC vs. MwA.
RS-fMRI, VBM and DTI
As illustrated in Figure 1, RS-VN corresponded, as previously described (11,22), to a brain circuitry encompassing retinotopic occipital cortex and temporo-occipital regions, including the middle temporal area (MT) in both migraine patients and HC groups. RS-VN exhibited statistically significant regional differences in the groups' comparison between patients with MwA and HC and patients with MwoA. Specifically, the two-sample t-tests revealed significant group differences in right lingual gyrus (LG) (Talairach coordinates x, y, z: 19; –63; –4; Brodmann area 19), indicating that this area had an increased component activity in patients with MwA compared to both HC and patients with MwoA (Figure (2a,b)). There were no statistically significant differences in the comparison between patients with MwoA and HC.
Group level RS-VN connectivity in patients with MwA, MwoA and HC. Statistical maps were overlaid on inflated 3D brain surface from the ‘Colin 27’ atlas (p < 0.05, cluster-level corrected). MwA: migraine with aura; MwoA: migraine without aura; HC: healthy controls. Significant between-groups differences (patients with MwA, MwoA and HC). (a) T-maps of statistically significant differences within the RS-VN between patients with MwA, patients with MwoA and HC groups (p < 0.05, cluster-level corrected). Talairach coordinates (x,y,z): 19; –63; –4. (b) Bar graphs of the ROI-averaged ICA z-scores ( ± SE) for patients with MwA, patients with MwoA and HC groups (patients with MwA: 2.31 ± 0.4; patients with MwoA: 0.91 ± 0.2; HC: 0.92 ± 0.2; p = 0.001). MwA: migraine with aura; MwoA: migraine without aura; HC: healthy controls.

There were no differences in global GM, WM and CSF volumes between the three groups (see Table 2). Moreover, both the whole-brain and ROI-based analyses of local regional GM volume did not reveal any significant differences in local GM, WM and CSF nor in global atrophy between patients with MwoA and MwA and HC, neither at a statistical threshold corrected for multiple comparisons (FWE p < 0.05) nor at an uncorrected threshold (p < 0.001; cluster size: 100) (see Table 2).
TBSS showed no significant differences among patients with MwA, patients with MwoA and HC for FA, MD, RD and AD maps. TBSS ROI-analysis, based on RS-fMRI results, revealed no significant microstructural differences in the right LG among the three groups (p < 0.05 cluster level corrected).
Finally, post-hoc correlation analyses revealed that individual ROI averaged ICA scores in the right LG did not exhibit any significant correlation with clinical parameters of disease severity in the whole group of patients with migraine and in patients with MwA and MwoA separately.
Discussion
In the present study, we report for the first time significant changes in RS-VN functional connectivity in patients with MwA during the interictal period. Specifically, we demonstrate an increased functional connectivity in the right LG, part of the extrastriate cortex, related to different high order functions of vision, such as visuospatial ability and perception as well as to sensory integration (26). This abnormal RS-VN functional connectivity was observed in the absence of structural or microstructural abnormalities and was not related to clinical parameters of migraine severity.
It is noteworthy that, in the last decades, based on the prominent role played by the visual cortex in migraine aura pathophysiology, visual pathways have been extensively explored in patients with MwA both during the aura phase and the interictal period. Visual evoked potentials studies have revealed, although with conflicting results, an abnormal visual information processing in patients with migraine, subtending abnormalities in habituation and sensitization mechanisms (27). In addition, other electrophysiological approaches have consistently demonstrated an increased brain responsiveness to visual stimuli in patients with MwA compared to patients with MwoA (27,28).
Subsequently, functional neuroimaging has allowed us to better shape our understanding of the neurobiological correlates of migraine aura. The majority of these studies have demonstrated an abnormal visual pathways excitability in response to visual stimulation in patients with MwA, compared to patients with MwoA, also in the interictal period (7–10).
In the last few years, RS-fMRI has allowed the exploration of whole-brain functional connectivity with minimal bias towards a specific motor, cognitive or sensory function. In fact, albeit not induced by a specific functional task, RS-fMRI BOLD signals are topographically organized in highly reproducible functional networks with biological relevance, called RSN (11,12,22). Recently, RS-fMRI development has advanced the assessment of brain functional connectivity in patients with MwoA (13,14). In the present work, we focused on the RS-VN, a RSN emerging from the brain circuitry encompassing retinotopic occipital cortex and temporo-occipital regions, including MT, which represents the neuronal correlate of visual processing (11,22).
Our RS-fMRI data are in line with recent EEG findings suggesting a close relationship between the aura phenomenon and neural connectivity in migraine during photic stimulation (29). Specifically, an increased effective connectivity in beta band, an EEG rhythm previously related to BOLD signal fluctuations into RS-VN (11), has been observed in patients with MwA (29).
Furthermore, our findings are in agreement with previous structural, functional and metabolic imaging evidence demonstrating a specific LG involvement in patients with MwA. Indeed, Hadjikhani and colleagues observed that aura-related changes appeared first in the extrastriate cortex (10) during triggered and spontaneous MwA attacks. Furthermore, an increased cortical surface area of the LG has been recently shown in patients with MwA compared with patients with MwoA and HC (30).
More recently, the right LG appeared metabolically more active in patients with persistent positive visual phenomena (a clinical syndrome worsened by co-existent migraine) when compared with HC (31). Interestingly, the same cerebral area showed hyperperfusion during high luminous stimulation in patients with migraine in interictal period (8) and during low light stimulation in spontaneous migraine attacks (9). These findings support the LG relevance in photophobia as well as in trigeminal pain multisensory integration also in patients with MwoA.
Assuming that differences in RS-VN functional connectivity could be related to activation changes during task-related fMRI experiments (32), RS-VN functional connectivity might correlate with a hyper-responsive visual pathways activity in patients with MwA (7–10). Similarly, this may explain the role of bright or flickering light as attack precipitating factors in patients with MwA (1,2). Probably, this increased RS-VN functional connectivity may require high energetic processes, justifying the described greater expensive energetic metabolism in patients with MwA compared with HC and patients with MwoA (33).
Our RS-VN functional connectivity data are likely not related to GM atrophy or WM microstructural abnormalities as suggested by our VBM and DTI negative results. Some studies have supported a migraine association with structural or microstructural abnormalities in patients with MwA and MwoA (3,5,6), likely correlated to migraine subtypes and burden. Nevertheless, since other authors have failed to demonstrate significant morphological changes in patients with migraine (4), it is not possible to draw any firm conclusions on this issue, up to date (34). However, a recent study has revealed a higher sensitivity of surface-based methods in the detection of migraine-related structural changes (30). Furthermore, the observed functional connectivity differences were not influenced by the WMH load.
Finally, our RS-fMRI findings showed no correlations with migraine clinical features such as disease duration, frequency and duration of migraine attacks in patients with MwA. None of these parameters, except for migraine frequency, were different between the two groups as these are general to the migraine population. Nevertheless, lack of correlation between BOLD response in visual pathways and clinical aspects of migraine has been previously reported (7). Thereby, we believe that visual aura phenomenon per se could justify RS-VN connectivity changes observed exclusively in patients with MwA.
We are aware that the present study is not exempt from some limitations. First, possible mechanisms underlying increased RS-VN functional connectivity in patients with MwA are currently unknown and we can only speculate on the nature of these functional changes. Second, we do not know whether the observed differences in RS-VN are a primary phenomenon due to hereditary liability, predisposing to MwA, or a secondary phenomenon due to visual pathways plastic changes as a result of migraine aura experience. Indeed, experience-dependent functional modifications in the visual pathways are related to structural remodelling of synaptic connectivity, in terms of growth or loss of dendritic spines, likely involving glutamatergic neurotransmission (35). Finally, it is not possible to know whether the increased RS-VN connectivity is due to a brain lack of habituation or to a hyper-responsiveness in patients with MwA.
In conclusion, we confirm that the visual pathways play a prominent role in the pathophysiology of MwA, which exhibits a different pattern of visual connectivity compared with MwoA. Therefore, our data support the view that considers MwA and MwoA as separate entities with a peculiar functional pattern in a strategic brain region as the visual cortex (36).
Future multi-parametric imaging studies will be central to further elucidate the complex scenario of the pathophysiological mechanisms underlying aura initiation and propagation.
Clinical implications
Compared with patients with migraine without aura (MwoA) and healthy controls, patients with migraine with aura (MwA) showed a significantly increased extrastriate cortex connectivity, centred in right lingual gyrus (LG). Resting-state functional abnormalities are not explained by morphological changes and appear independent of MwA clinical symptoms. Given that a specific extrastriate involvement has been observed exclusively in patients with MwA, we suggest that:
a) MwA should be viewed as a relatively distinct entity from MwoA on a peculiar extrastriate cortex functional pattern; b) increased extrastriate cortex connectivity may represent a functional biomarker that could differentiate patients experiencing the aura phenomenon from patients with MwoA, even between migraine attacks.
Footnotes
Funding
This research received no specific grant from any funding agency in the public, commercial, or not for-profit sectors.
Conflict of interest
Professor Tessitore: has received speaker honoraria and funding for travel from Novartis, Schwarz Pharma/UCB, Lundbeck, Abbvie and Glaxo. Professor Tedeschi: has received speaker honoraria from Sanofi‐Aventis, Merck Serono, Bayer Schering Pharma, Novartis, Biogen‐Dompe` AG; has received funding for travel from Bayer Schering Pharma, Biogen‐Dompe`AG, Merck Serono, Novartis and Sanofi Aventis; serves as an Associate Editor of Neurological Sciences.