
Abstract
Background
Inter-regional covariation in grey-matter (GM) structure may provide insights into disease mechanisms. Given that migraine with aura (MA) has been linked to occipital GM alterations, it is plausible that altered occipital GM covariance may also exist in MA.
Methods
Structural magnetic resonance images were obtained from 50 MA patients, 50 migraine patients without aura (MO) and 50 healthy controls (HC). Mean GM densities were extracted according to the Automated Anatomical Labeling atlas and regional and global network metrics were compared among the three groups. The local measures primarily focused on occipital regions. We further examined whether voxel-wise covariance of the significant regions was associated with clinical parameters.
Results
Increased nodal degree was observed in the right lingual gyrus in MA when compared with HC (p < 0.001, p(FDR) = 0.018) and MO (p = 0.005, p(FDR) = 0.059), though the latter did not pass correction. In MA, the right lingual gyrus was identified as a hub region and its covariance with the right posterior insula and the left ventral postcentral gyrus was negatively correlated with migraine duration. Global network measures did not differ among the groups.
Conclusion
MA was associated with localized changes in the GM-network of the visual system, which may interact with pain-related brain regions depending on the duration of the disorder.
This is a visual representation of the abstract.
Introduction
Migraine auras are reversible neurological symptoms that precede the headache attack in a subset of migraine patients. Among the various aura phenotypes, visual aura is by far the most common (1). While visual auras manifest as heterogeneous symptoms (2), all features are thought to be generated by cortical spreading depression arising from within the occipital cortex (3). To date, no specific brain dysfunction has been identified that predisposes to cortical spreading depression in typical migraine. Furthermore, the long-term consequence of recurring aura attacks remains poorly understood.
Several studies have reported altered grey-matter structure within the occipital cortex in migraine with visual aura (MA) (4–7). Common to these studies is the focus on regional brain changes. However, the brain is increasingly being viewed in the context of large-scale networks, consisting of widespread, interacting brain regions. An alternative to focusing on regional changes is to characterize inter-regional relationships in grey-matter structure. This type of analysis is, in part, based on the assumption that functionally related regions may exhibit coordinated regional structural changes, reflecting neurodevelopment, aging, experience-related plasticity, or disease progression (8). In this context, positive correlations between grey matter volumes of different regions are assumed to be an indirect measure of connectivity.
From a network perspective, the human brain has been shown to follow a small-world organization, which optimizes the balance between local specialized processing (segregation) and global integration of specialized information (9). Furthermore, the topological organization of grey-matter covariance networks in migraine patients appears to be disrupted. Grey-matter networks have been shown to be highly segregated, with higher network segregation observed in chronic migraine than in episodic migraine (10). This is partly corroborated by other studies in which increased global segregation and reduced local integration were observed in episodic migraine (11) or reduced local and global integration were observed in chronic migraine (12). However, since none of these studies specifically examined the network topology in MA, it remains unknown whether this subtype of migraine exhibits distinct grey-matter network disruptions.
In the present cross-sectional study, we sought to address whether MA is associated with altered structural network topology. Specifically, we compared the local and global topological organization of grey-matter covariance networks in MA to those in healthy controls (HC) and migraine without aura (MO). Since visual auras are thought to be generated in the occipital cortex (3) and MA has been associated with altered grey-matter structure in this region (4–7), we hypothesized that grey-matter structure within the occipital cortex would exhibit altered network topology compared to HC and MO. The relationship with migraine-specific parameters was further investigated.
Methods
Data overview
Recruitment and scanning took place between July 2016 and July 2020 after approval of the study by the Institutional Review Board of Taipei Veterans General Hospital (2015-01-004CC; 2015-11-002B). The sample size was based on the available data during the study interval. All participants received functional and anatomical scans. Data from the study have previously been analyzed, and these results have been reported elsewhere (7). The analysis and results in the present study are complementary to our previous results, but represent an entirely different approach.
Study population
Migraine patients were recruited from the Headache Clinic of Taipei Veterans General Hospital. All patients met the diagnostic criteria for migraine with or without aura as proposed by the International Classification of Headache Disorders, 3rd edition (ICHD-3) (13). At the first visit during the enrollment, patients completed a structured questionnaire on demographics and clinical profile. Potential participants were required to keep a daily headache diary for three months. The following clinical information was collected from the diaries and questionnaires: headache and migraine frequency (days/month); maximum and mean headache severity (0–10 on a numerical rating scale) in the previous year; age at headache onset; aura phenotype (visual/sensory/aphasia/other); the presence of photophobia (yes/no); usage of acute or preventive medication (type, dosage and days/month); and past medical history. The Migraine Disability Assessment questionnaire (MIDAS) and the Beck Depression Inventory (BDI) were completed on the day of scanning. Patients were enrolled in the study if they had: 1) low-frequency episodic migraine attacks (1–9 headache days/ month); 2) no migraine attacks within 48 h before and after the scanning, as confirmed by the headache diary and telephone follow-up; and 3) not received any prophylactic medication within six months of the experiment. All MA patients were required to have at least one migraine with visual aura per month. Healthy controls were required to have no history of primary or secondary headaches. Both patients and healthy controls were normal in physical and neurological examinations and did not have any systemic diseases, psychiatric disorders or conditions incompatible with magnetic resonance imaging. All participants gave written, informed consent to participate in the study in accordance with the Helsinki Declaration (6th revision).
Image acquisition
Imaging data were acquired at Taipei Veterans General Hospital on a 3-Tesla GE Discovery MR750 scanner fitted with an eight-channel phased array head coil (GE Healthcare, Waukesha, WI, USA). To diminish motion artifacts during scanning, participants’ heads were immobilized with cushions inside the coil and they were asked to keep still. Brain structural images were acquired using a T1-weighted, 3D-fast spoiled gradient echo pulse sequence (repetition time/inversion time/flip angle: 9.156 ms/3.68 ms/12 degrees) with the parameters: matrix, 256 × 256 × 168; field of view, 256 × 256 mm2; voxel size: 1 × 1 × 1 -mm3.
Image processing
The Computational Anatomy Toolbox (CAT12.8.2, http://www.neuro.uni-jena.de/cat/), an extension to the Statistical Parametric Mapping 12 software package (SPM12; https://www.fil.ion.ucl.ac.uk/spm/software/spm12/), was used to segment grey-matter images from the anatomical images and to extract the total intracranial volume. The East Asian brain template was used for affine registration. The grey-matter images were spatially warped to standard Montreal Neurological Institute space. While the grey-matter images entering into the structural covariance matrices retained their original spatial resolution (1 × 1 × 1 -mm3), those entering voxel-wise analyses were resampled to a resolution of 1.5 × 1.5 × 1.5 -mm3. Spatial warping was performed with the tissue volume preserved (modulated). Images entering the voxel-wise analyses were further spatially smoothed with a 6 × 6 × 6 -mm3 Gaussian kernel. The quality of the images was examined by inspecting the weighted overall image quality of each participant. No outliers were found.
Grey matter network analysis
The Graph Analysis Toolbox (GAT) was used to compute local and global network metrics and to compare them among the three groups (14). GAT is in part based on the Brain Connectivity Toolbox (9). Initially, the mean grey-matter volumes were extracted from 90 cortical and subcortical regions by means of the REX toolbox (http://web.mit.edu/swg/software.htm). These regions were parcellated according to the Automated Anatomical Labeling (AAL) atlas (15) and excluded the cerebellum (Online Supplementary Figure 1). The effect of age and total intracranial volume was then regressed out. Association matrices across the 90 regions were calculated using pair-wise regional Pearson correlations within each group. Only positive correlations were included as the methodology is not able to account for negative correlations (9). Furthermore, self-correlations were also removed prior to the network analysis. The resulting matrices were binarized, with one denoting covariation between pairs of regions and zero representing no covariation. As various schemes can be used to threshold the association matrices prior to binarization, a range of network densities were used as thresholds. The lower bound of the range was set as the minimum density at which the networks of the two groups being compared were not fragmented (i.e., all nodes had at least one connection). As recommended, the maximum density was set at 0.45 (45%) to avoid non-biological random networks (14). The step size between the minimum and maximum density was set to 0.02. In summary, binarized matrices and network metrics were computed for each step. The area under the curve (AUC) of the resulting cross-density graph was used to assess each metric, thus avoiding the bias associated with choosing a particular density.
In context of graph theoretical analysis, the regions in the network matrix are labelled as nodes and the inter-regional pair-wise correlations are labelled as edges. Three metrics were used in the local network analysis: clustering coefficient, nodal degree, and nodal betweenness (9,14). The clustering coefficient is defined as the fraction of a node's immediate neighbors that are also neighbors of each other and reflects how densely connected a network is around a particular node. It is considered a measure of network segregation. The degree of a node is defined as the number of edges connected to that node and betweenness is defined as the fraction of all shortest paths that pass through that node. Node degree and node betweenness are measures of centrality and represent the importance of the node. A node was assigned as a hub region if its node degree or node betweenness exceeded two standard deviations of the mean network value.
Global metrics of the network were calculated as the mean across all nodes in the network. The following metrics were calculated globally: assortativity coefficient; characteristic path length; clustering coefficient; global efficiency; node betweenness; small-world index; and Louvain modularity (9,14). Assortativity indicates whether a node tends to link to other nodes with the same or similar degree and is considered a measure of network resilience. The characteristic path length is the average shortest path length in the network and the global efficiency is the average inverse shortest path length in the network. Both metrics are measures of network integration. The small-world index is given as the ratio between the clustering coefficient and the characteristic path length. Each of these measures are obtained relative to a value calculated from random networks (20 random networks were used). Finally, Louvain modularity denotes the extent to which a network can be divided into non-overlapping groups of nodes, i.e., maximal within-module connections and minimal between-module connections. This metric was estimated by an optimization algorithm repeated 100 times (default value).
Between-group differences in network metrics were assessed by non-parametric permutation tests with 10,000 repetitions (MA vs. HC, MA vs. MO, MO vs. HC). Two-tailed p-values were calculated by placing the actual between-group difference in the permutation distribution. As per our hypothesis, the primary focus of the regional analysis was on the occipital cortex which was divided into six regions per hemisphere (calcarine, cuneus, lingual, inferior occipital, mid occipital, and superior occipital) (see Figure 1). For each measure in the regional analysis, p-values obtained from the 12 regions in three between-group comparisons were further corrected for the multiple comparisons (36 p-values) using the false discovery rate (FDR). The seven p-values obtained from the global network analysis were also FDR corrected for the multiple comparisons across the three between-group comparisons (21 p-values). In all instances, p(FDR) < 0.05 was considered significant.

Occipital regions-of-interest in the left and right hemispheres overlaid on the mean anatomical image in coronal and sagittal planes. Six regions in each hemisphere were parcellated according to the Automated Anatomical Labeling atlas. The six regions were the lingual gyrus (green), calcarine sulcus (red), cuneus (blue), inferior occipital (violet), mid occipital (yellow), and superior occipital (cyan). Coordinates are provided in MNI standard space.
Voxel-wise covariance analysis
For regions with significant between-group differences in the above analyses, we further explored whether the voxel-wise structural connectivity to the rest of the brain was associated with clinical parameters. Using the Brain Covariance Connectivity Toolkit (https://github.com/JLhos-fmri/NeuroimageTools), the mean grey matter volume within the region of interest was extracted from each participant and further used as seed-points. The modulatory effect on seed-to-voxel correlations was then examined for headache frequency, migraine frequency and headache duration, separately, using general linear models (16) with age and total intracranial volume included as covariates of no interest. Statistical maps were thresholded at an uncorrected voxel-wise threshold of p < 0.001. To obtain a cluster-level threshold corrected for family-wise errors (FWE), p(FWE) < 0.05, the smoothness of the T-maps resulting from the above analysis was assessed in the Data Processing and Analysis for Brain Imaging toolbox (http://rfmri.org/DPABI) and the extent threshold then calculated.
Other statistical analyses
Descriptive statistics were calculated for demographic variables (age, height, weight), clinical characteristics (headache and migraine frequencies, mean and maximum headache severity, headache duration), questionnaire scores (BDI, MIDAS), and total intracranial volume (IBM SPSS, v21.0). Furthermore, between group differences were assessed by independent t-tests or one-way analysis of variance for continuous variables and chi-square tests for categorical variables. For all tests, a two-tailed p < 0.05 was considered significant.
Results
Demographics and clinical characteristics
The study cohort used in the present study is the same as previously described in Niddam et al. (7). Fifty patients with migraine with visual aura, 50 patients with migraine without aura, and 50 healthy controls were included in the study (Table 1). All patients were in the interictal state. The three groups showed no differences in demographic factors, except for age, where MA patients were found to be significantly younger than MO patients (post-hoc Tukey: p = 0.022). Significant differences between the two patient groups were not found in any of the clinical characteristics examined. In the MA group, additional sensory aura was observed in 13 (26%) patients and aphasic aura in five (10%) patients. Furthermore, 25 (50%) patients had unilateral visual aura, seven (14%) had bilateral visual aura and 18 (36%) had sometimes unilateral and sometimes bilateral aura. Information about the side of the unilateral aura was not obtained. All MA patients reported scotomas and 42 (82%) reported jagged lines and/or blurry vision. Other aura features comprised flickering (all MA patients) and moving (32 (64%) MA patients) qualities.
Demographics and clinical characteristics of patients with migraine and healthy controls.

Mean ± SD is provided for continuous data. BDI, Beck Depression Inventory; HC, healthy controls; MA, migraine with visual aura; MIDAS, The Migraine Disability Assessment questionnaire; MO, migraine without aura. Mean headache severity was estimated in the year prior to recruitment. *included migraine with and without aura. Significant p-values are marked in bold. The Chi-square test, One-way ANOVA or independent t-test were used when appropriate.
Network analysis
The minimum densities of the structural covariance networks for the between-group comparisons were: 0.15 (MA vs. HC), 0.17 (MA vs. MO), and 0.13 (MO vs. HC). Binarized connectivity matrices thresholded at a density of 0.17 are shown for the three groups in Figure 2. Of the three local metrics examined within the occipital cortex, only nodal degree exhibited a between-group difference (Table 2). Nodal degree of the right lingual gyrus was found to be significantly higher in MA than HC (p < 0.001, p(FDR) = 0.018). This was also the case when comparing MA with MO, however, without reaching significance when correcting for the multiple comparisons (p = 0.005, p(FDR) = 0.059). A significant difference in nodal degree was not observed for the right lingual gyrus when comparing MO with HC (p = 0.806, p(FDR) = 0.967). Furthermore, nodal degree of the right inferior occipital gyrus was found to be significantly higher in MO than HC (p = 0.003, p(FDR) = 0.049), but not when comparing MO with MA, (p = 0.030, p(FDR) = 0.219) or HC with MA (p = 0.727, p(FDR) = 0.942).

Binarized connectivity matrices thresholded at a density of 0.17 for each of the three groups. Blue denotes no connectivity and yellow denotes connectivity between pair-wise regions. For display purposes, only regions in the left hemisphere are labeled.
Regional between-group differences within the occipital cortex for the clustering coefficient, nodal degree and nodal betweenness.

FDR, false discovery rate; Inf, inferior; L, left; mid, middle; orb, orbital; R, right; sup, superior; uncorr, uncorrected p-value. Significant p-values are marked in bold.
The right lingual gyrus was identified as a hub region in the MA group using both nodal degree and nodal betweenness (Table 3). This was not the case for the other two groups. In the MA group, other hub regions found using nodal betweenness included the left and right insula and the left orbitofrontal cortex. The right insula was also found to be a hub region in HC. However, there was no overlap in hub regions between MA and MO. The right inferior occipital gyrus was not found to be a hub region in any of the groups. The grey-matter networks in the three groups were found to have approximately the same number of modules (MA: 7 modules; HC: 8 modules; MO: 8 modules) (Figure 3). In all groups, the module including the right lingual gyrus also included other regions in the occipital cortex as well as regions in the parietal and temporal cortices (spheres colored in cyan in Figure 3). The insula was not in the same module as the right lingual gyrus in any of the groups.
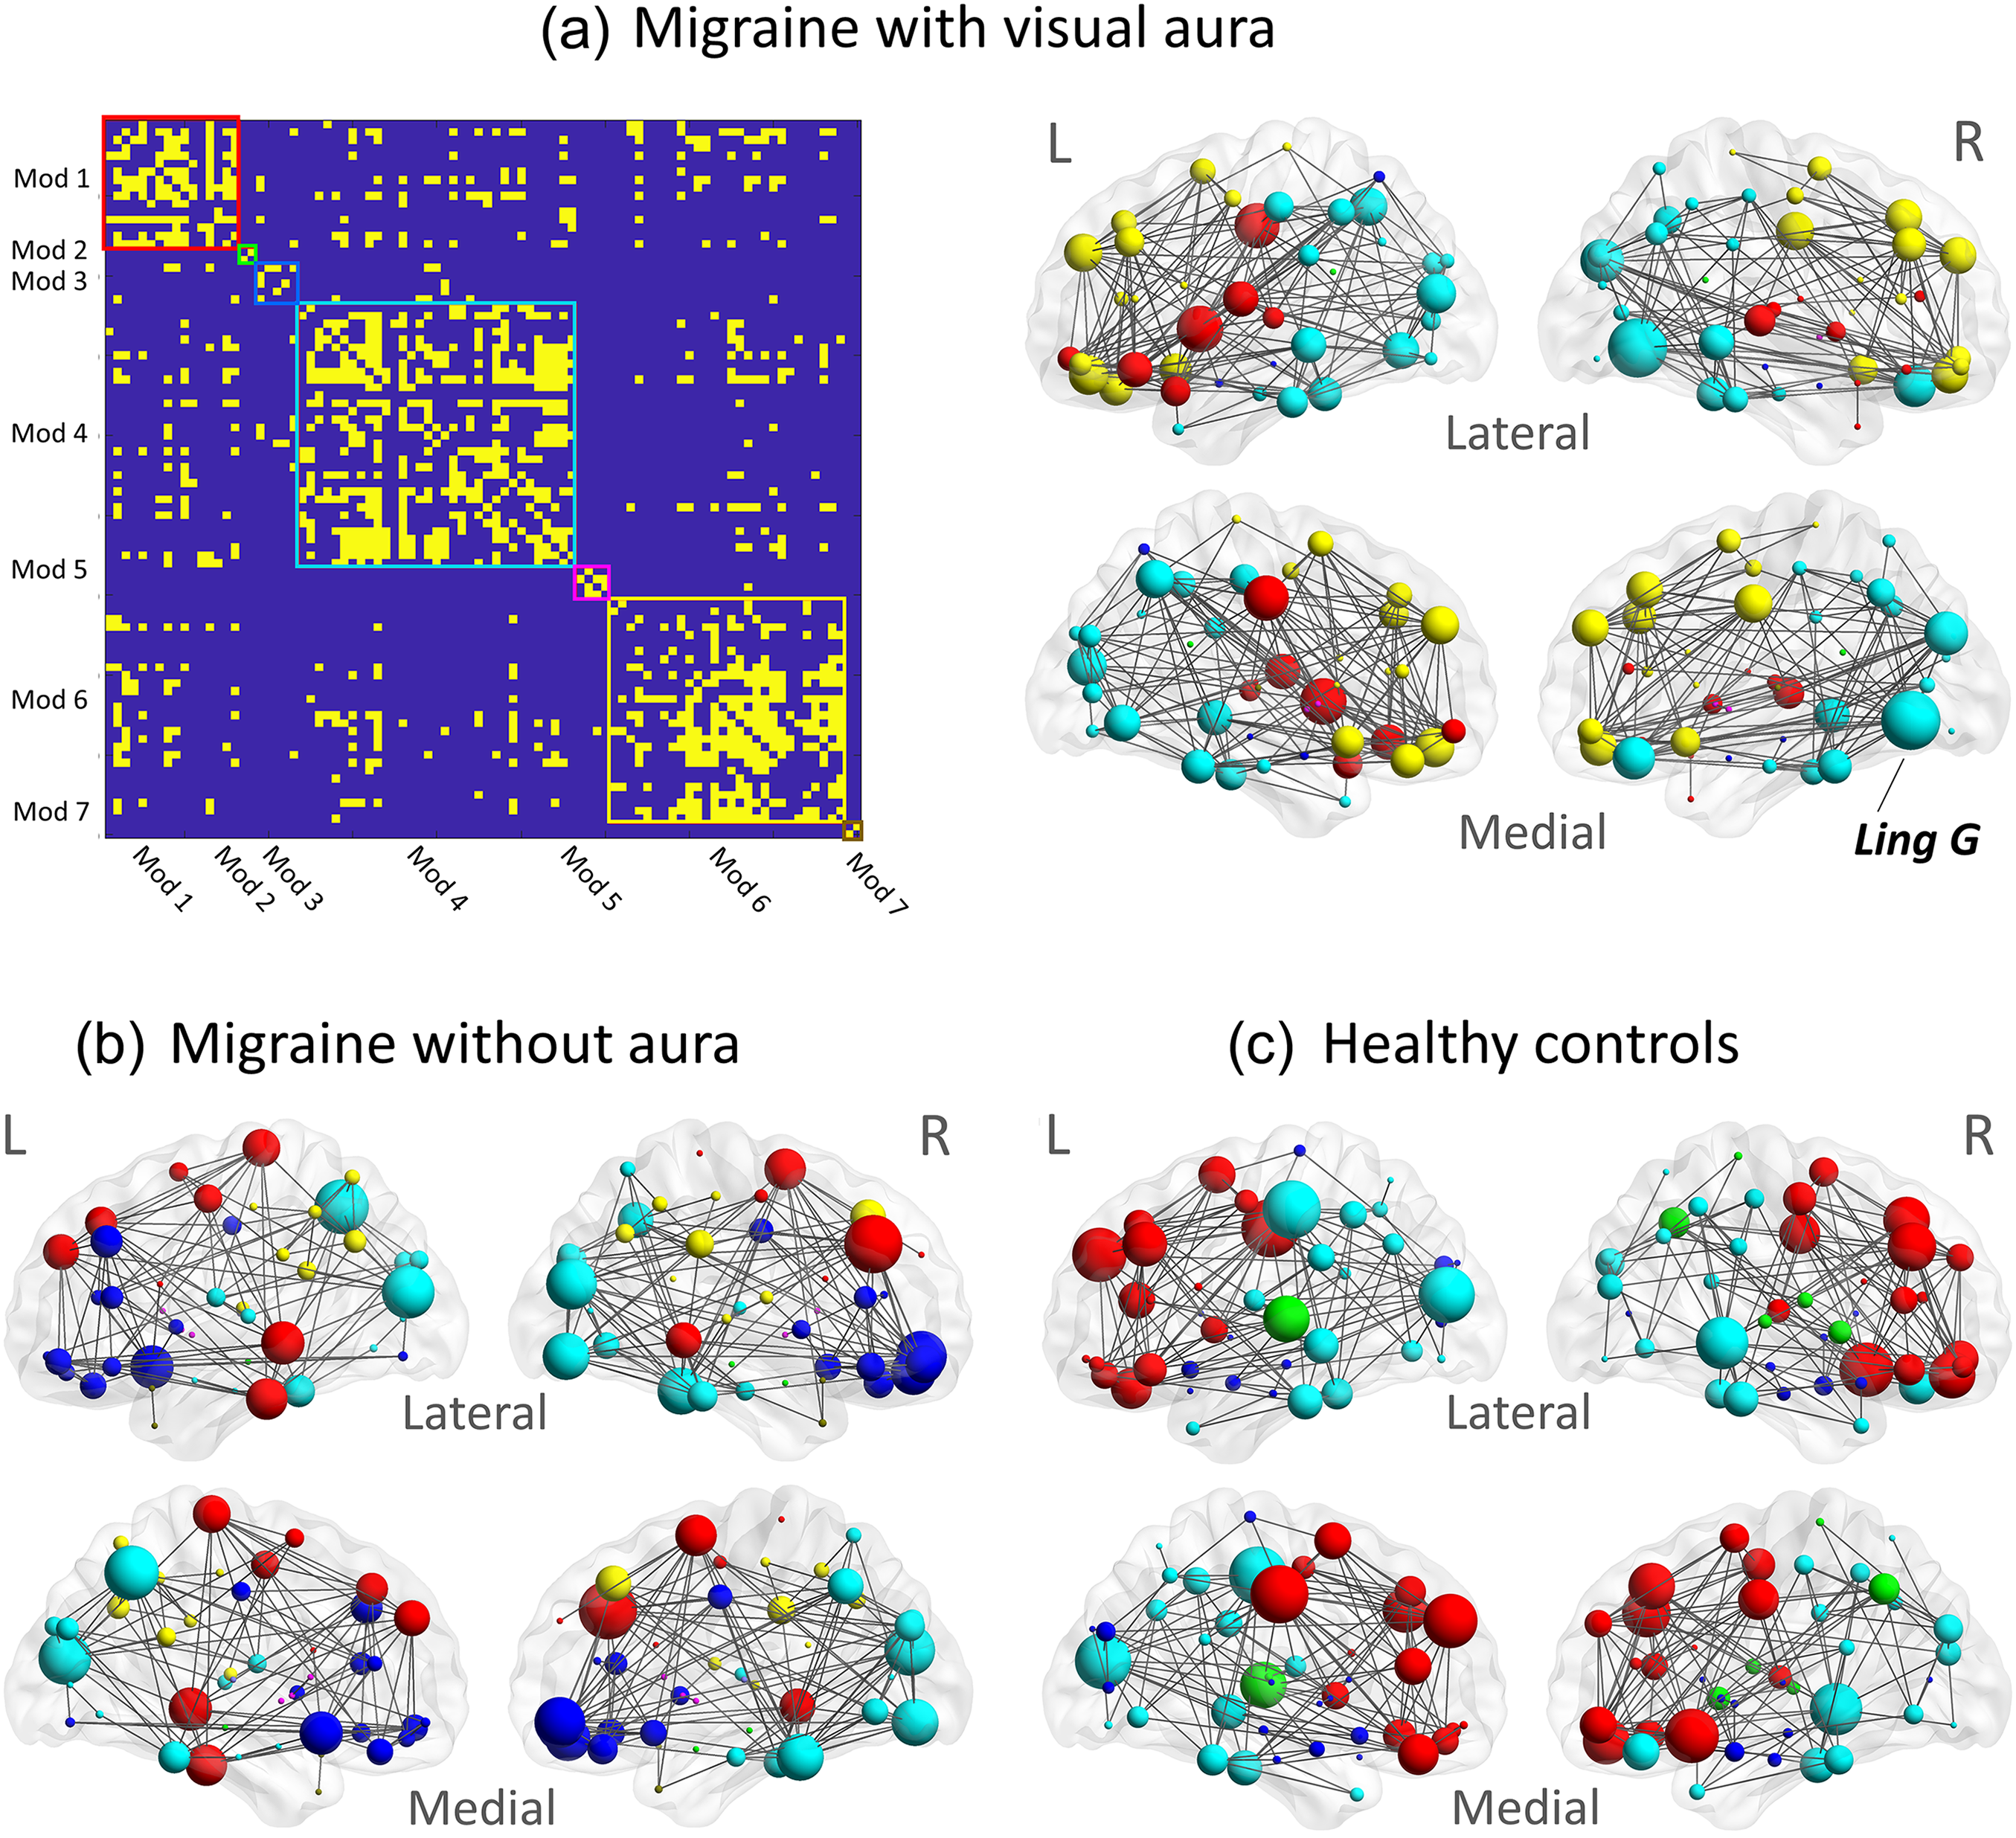
(a) the binarized connectivity matrix in the visual aura group, reorganized according to the modular organization. Seven modules (Mod) were identified, each outlined in a different color. The module including the right lingual gyrus is highlighted in cyan. The corresponding node locations and their connectivity (edges), color matched to the module demarcations in the connectivity matrix, are also shown. The volume of the spheres represents the magnitude of the nodal degree. Node locations, edges and modules in (b) migraine without aura and in (c) healthy controls. The nodes representing the right lingual gyrus (Ling G) are labeled and the nodes in the corresponding module are colored in cyan across all groups. The colors of other modules do not correspond to the same modules across groups due to different composition.
Hub regions for the three group-wise comparisons.

Hubs were defined as regions with a metric exceeding two standard deviations of the mean across all nodes. The area under the curve across densities was used to assess metrics.
Cing, Cingulum; F, frontal; Inf, inferior; L, left; Lb, Lobule; Occ, Occipital; mid, middle; orb, orbital; Parahip, Parahippocampal; R, right; sup, superior; Temp, Temporal.
Seven global network measures were also assessed across densities. However, MA did not differ from HC or MO in any of the comparisons. MO also did not differ from HC, although lower global efficiency was found using an uncorrected p-value (p = 0.041; Table 4; Figure 4(a) and (b)). This was mainly due to decreased values at lower densities. It is noteworthy that all groups exhibited a small-world organization of their respective grey-matter networks, as indicated by an index larger than one (see Figure 4(c) and (d) and Online Supplementary Figure 2).
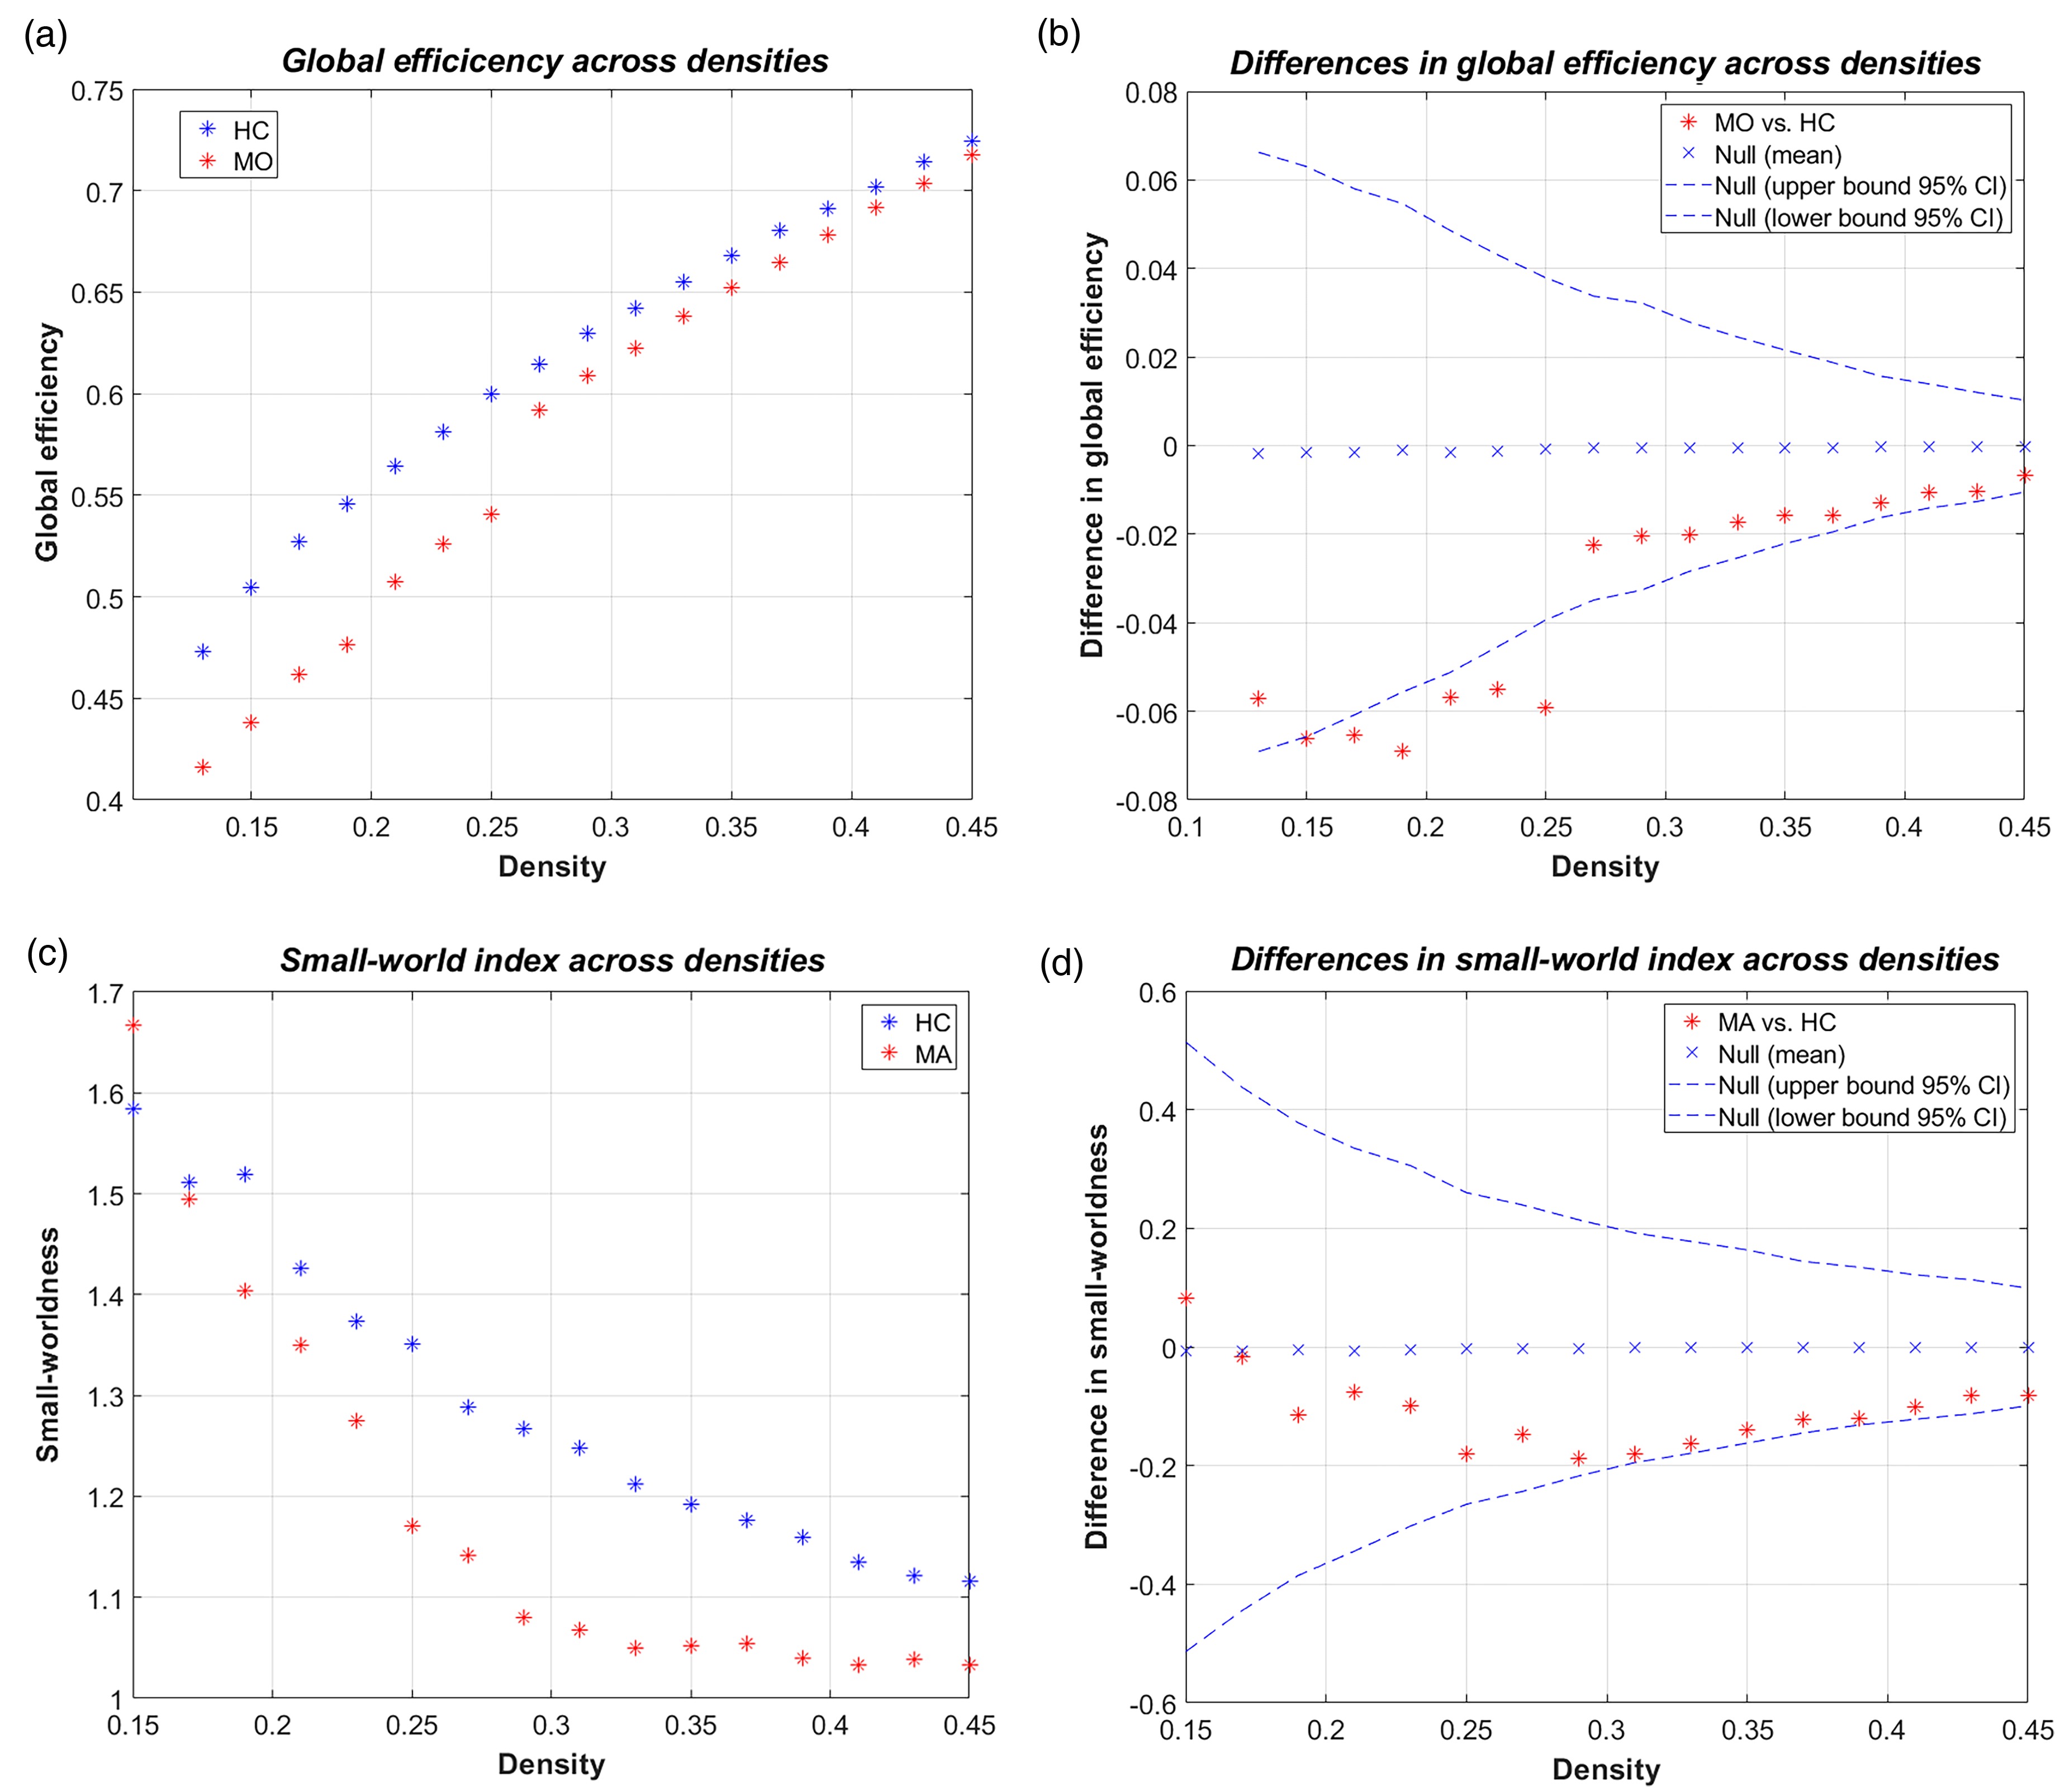
Between-group differences in global efficiency and small-world index across densities. (a) Global efficiency in migraine without aura (MO) and healthy controls (HC) as a function of network density. (b) The corresponding between-group differences in global efficiency exceeded the 95% confidence interval (CI) at smaller densities but were not significant when using corrected P-values for the area under the curve. The null distribution differences are also shown. (c) The small-world index in migraine with visual aura (MA) and HC as a function of network density. (d) The corresponding between-group differences in the small-world index did not exceed the 95% CI at any density. Negative values in (b) and (d) indicate smaller values in the patient groups than in HC.
Between-group comparisons of global measures (p-values).

p-values are uncorrected for the multiple comparisons across measures and groups Uncorrected p-values smaller than 0.05 are marked in bold.
Voxel-wise analysis
We further investigated whether clinical parameters modulated the whole-brain voxel-wise covariance of the right lingual gyrus in MA and the right inferior occipital gyrus in MO. It is noteworthy that while the binarized connectivity matrices in the previous network analysis only included positive covariance, the voxel-wise analysis can reveal both positive and negative covariance. Within the MA group, a significant negative associated with headache duration was found in the right posterior insula (center of gravity coordinate: [x y z] = [−20, 18, 38]; extent: 281 voxels) and in the left ventral postcentral gyrus, extending to the inferior parietal lobule ([−63, -26, 22]; extent: 197 voxels) (Figure 5(a)). Within the MO group, a significant negative associated with headache duration was found in the left superior parietal cortex ([−19 −53 6]; extent: 197 voxels) and the right cerebellum ([37, −80, -30]; extent: 245 voxels) (Figure 5(b)). Additionally, a significant positive association with headache frequency was found in the left superior temporal gyrus ([−46, -52, 16]; extent: 190 voxels) and the right postcentral gyrus ([−27, 42, 48]; extent: 191 voxels). Finally, a significant negative association with headache frequency was found in the right putamen ([1, 6, 26]; extent: 397 voxels) and in the right pre-central gyrus ([−26, 23, 59]; extent: 316 voxels) (Figure 5(c)).

Modulation of grey-matter covariance of the right lingual gyrus and right inferior occipital gyrus by clinical parameters. (a) A significant negative modulation by headache duration was found for clusters located in the right posterior insula and in the left ventral postcentral gyrus in migraine with visual aura. In migraine without aura, (b) a significant negative modulation by headache duration was found in the left superior parietal cortex and the cerebellum. (c) Significant positive (red) and negative modulation by headache frequency was also found in the left superior temporal gyrus, the right putamen and the right (blue) pre- and (red) post-central gyri. Coordinates are provided in MNI standard space.
Discussion
The present study addresses whether altered grey-matter network topology exists in MA relative to HC and MO. The study cohort is identical to the one previously described in Niddam et al. (7). We showed that: (i) the nodal degree of the right lingual gyrus was increased in MA patients relative to healthy controls, (ii) the right lingual gyrus was a hub region in MA but not in HC and MO, (iii) global network measures in MA did not differ from those in HC and MO, and (iv) grey-matter covariance of the right lingual gyrus with the right posterior insula and the ventral portion of the left postcentral gyrus was associated with the duration of the disorder.
In agreement with our hypothesis, differences in regional network measures were found within the occipital cortex in the MA group. More specifically, the nodal degree of the right lingual gyrus was found to be higher in MA compared with HC. This was also the case when MA was compared with MO, albeit without reaching significance when correcting for the multiple comparisons. The increased centrality of the right lingual gyrus in MA suggests that this region may have a more influential role in the structural covariance network than in the other two groups. Nodes with a higher centrality in the network have the potential to participate in a larger number of functional interactions (14). The increased importance is further corroborated by the identification of the right lingual gyrus as a hub region in MA, but not in HC or MO. Hub regions may not only facilitate the integration of information from within their close network neighbors, but may also extend their influence beyond the immediate local network (9). The module that included the right lingual gyrus also encompassed most of the other regions-of-interest within the occipital cortex in all three groups. In addition, the module included regions in the parietal and temporal cortices, suggesting an involvement in primary and higher-order visual and somatosensory processes. Interestingly, the nodal degree of the right inferior occipital gyrus was found to be higher in MO than HC. However, as the region is not a hub, this may suggest a limited influence.
The lingual gyrus is located in the extrastriate medial occipital cortex and is a core component of the visual network (7). Functionally, the region is involved in higher order visual processes, including visual memory and spatial selective attention (17–19). The lingual gyrus has, furthermore, been implicated in neurological disturbances such as visual snow (20). Interestingly, increased functional resting-state connectivity of the right lingual gyrus with the visual network has been reported in interictal MA patients relative to HC and interictal MO (21). The increased nodal degree, together with the modular organization of the right lingual gyrus, as observed in the present study, may be the structural equivalent of this finding as structural covariance networks in part converge with functional networks (8,22). Using the same study population as in the present study, we recently showed that grey-matter structure within the functionally defined medial visual networks, in part covering the lingual gyri, contains multivariate information that can be used to discriminate MA from HC or MO (7). Furthermore, increased cortical surface area or cortical thickness of the lingual gyrus has been found in MA relative to HC and MO (4–6). Thus, several lines of evidence suggest that grey matter in the lingual gyrus may have an important role in visual aura-related mechanisms.
To further investigate whether regional covariance was related to clinical parameters, a whole-brain voxel-wise modulation analysis was performed for significant regions. Disease duration was found to be negatively associated with the covariance between the right lingual gyrus and the right posterior insula, as well as the ventral portion of the left postcentral gyrus. The latter possibly corresponds to the face representation of the primary somatosensory cortex (23). As the aforementioned regions are known to be involved in sensory-discriminative aspects of pain processing (24), the negative association may represent a compensatory mechanism between visual and pain systems that progresses as the migraine disorder remains unresolved. The right insula was also identified as a hub region in MA, using node betweenness, albeit not in the same module as the lingual gyrus. This is congruent with hub regions interacting with other segregated network elements. That interactions between the insula and the visual system may have an important role in MA is further corroborated by a previous study of ours, in which the functional connectivity between visual areas, including the lingual gyrus, and the anterior insula was reduced in MA but not in HC or MO (25).
Global network measures were also examined in the present study. However, MA did not differ significantly from HC or MO for any of the global measures assessed. Furthermore, all three study groups exhibited a small-world organization that did not differ between groups, suggesting an optimized balance between local specialized processing (segregation) and global integration of specialized information (9). In a study using similar methodology to the present study, i.e., grey-matter density and the same parcellation scheme, MO patients were found to have a higher global mean clustering coefficient than HC (11). The discrepancy with our study cannot be explained by our use of a wider density range or the AUC for cross-density assessment, as the difference in the global mean clustering coefficient did not exceed the upper or lower bounds of the confidence interval at any density in our study (results not shown). The number of participants and the mean headache frequency were also comparable in the two studies. Hence, other factors known to affect structural covariance networks, such as segmentation methods (SPM5 versus CAT12) or scanner type (GE EXCITE versus GE Discovery), may have contributed to the observed difference (9).
A number of limitations to our study need to be considered. Beyond migraine-specific factors, brain structure and network organization can be influenced by various other factors, including ethnicity, genetics, environmental exposures, emotional distress, and age. In our study, all participants were ethnically Chinese and recruited from the same clinic. While this homogeneous cohort enhances internal validity and minimizes recruitment-related confounders, it may also introduce selection bias and limit generalizability. Notably, differences in regional brain volumes, including in the occipital lobe, have been observed between Chinese and Caucasian populations (26,27). Further studies involving diverse ethnic groups are warranted to confirm the broader applicability of our findings. Emotional distress may also impact brain structure and network measures (28,29). Our patient cohorts had minimal or mild depression scores, with no significant differences between the two groups. Although depression has not been linked to changes in regional network measures in the occipital lobe (28), its potential contribution to the observed differences cannot be ruled out, given that depression scores were not obtained for healthy controls. However, although depression may be associated with increased global efficiency (28), we observed a trend toward reduced global efficiency in MO patients and no difference in MA patients, suggesting that emotional distress had a minimal impact on our findings. Age is also known to affect brain structure and network organization (30). In our study, a significant age difference was found between MA and MO, but not between MA and HC. To account for this, we regressed out the effect of age before network analysis and included it as a covariate of no interest in the voxel-wise analysis. We therefore believe our main findings are unlikely to be driven by age-related effects. Finally, as we did not register the side of the unilateral aura, we are not able to ascertain whether our regional finding of increased nodal degree in the right lingual gyrus is related to aura laterality.
From a methodological perspective, structural covariance networks and their associated metrics depend on the imaging measure and the applied parcellation scheme (9,31). We used the AAL atlas to parcellate the grey-matter density images. Other migraine studies have used cortical thickness, together with other atlases (10,12). Direct comparisons with the results reported in these studies are therefore not possible. Furthermore, although the parcellation scheme applied in the present study is commonly used, the lack of anatomical detail, especially in brainstem and subcortical regions, may limit the interpretation of our results. The sample size can also influence the reliability and generalizability of findings in structural covariance networks. A sample size larger than 30 participants per group has been recommended (32). The group sizes used in the present study were substantially larger than this and comparable to most other studies on structural covariance in migraine. Nevertheless, our sample size was insufficient for a robust analysis of aura subtypes.
Article highlights
Migraine with visual aura is associated with localized grey-matter network alterations in the occipital cortex. In migraine with visual aura, the right lingual gyrus was identified as a network hub with increased nodal degree. In migraine with visual aura, grey matter covariance of the right lingual gyrus with the right posterior insula and the left ventral postcentral gyrus negatively correlated with migraine duration. Grey matter in the lingual gyrus may have an important role in visual aura-related mechanisms.
Supplemental Material
sj-docx-1-cep-10.1177_03331024251353146 - Supplemental material for Grey-matter network topology in migraine with aura
Supplemental material, sj-docx-1-cep-10.1177_03331024251353146 for Grey-matter network topology in migraine with aura by David M. Niddam, Kuan-Lin Lai, Yi-Ting Hsiao, Yen-Feng Wang and Shuu-Jiun Wang in Cephalalgia
Footnotes
Ethics
All participants gave written, informed consent to participate in the study in accordance with the Helsinki Declaration (6th revision).
Funding
The authors disclosed receipt of the following financial support for the research, authorship, and/or publication of this article: This work was supported by grants from the Ministry of Science and Technology and the National Science and Technology Council (111-2314-B-A49-075-MY2; 110-2321-B-010-005; 111-2321-B-A49-004; 111-2314-B-A49-090-MY3; 111-2321-B-A49-011; 112-2321-B-075-007; 113-2423-H-003-004) and the Brain Research Center, National Yang Ming Chiao Tung University, from the Featured Areas Research Center Program within the framework of the Higher Education Sprout Project by the Ministry of Education of Taiwan.
Declaration of conflicting interests
The authors declared the following potential conflicts of interest with respect to the research, authorship, and/or publication of this article: DMN, KLL, YTH, and YFW report no disclosures. SJW has received honoraria as a moderator from AbbVie, Biogen, Eli-Lilly, Hava Biopharma, and Pfizer, has received consulting fees from AbbVie, Eli-Lilly Taiwan, Percept Co., and Pfizer Taiwan, and has been the PI in trials sponsored by Eli-Lilly, Lundbeck, and Novartis. He has received research grants from Taiwan branches of Eli Lilly, Novartis, and Orient Europharma.
Supplemental material
Supplemental material for this article is available online.
References
Supplementary Material
Please find the following supplemental material available below.
For Open Access articles published under a Creative Commons License, all supplemental material carries the same license as the article it is associated with.
For non-Open Access articles published, all supplemental material carries a non-exclusive license, and permission requests for re-use of supplemental material or any part of supplemental material shall be sent directly to the copyright owner as specified in the copyright notice associated with the article.