
Abstract
Background
Various CACNA1A missense mutations cause familial hemiplegic migraine type 1 (FHM1), a rare monogenic subtype of migraine with aura. FHM1 mutation R192Q is associated with pure hemiplegic migraine, whereas the S218L mutation causes hemiplegic migraine, cerebellar ataxia, seizures, and mild head trauma-induced brain edema. Transgenic knock-in (KI) migraine mouse models were generated that carried either the FHM1 R192Q or the S218L mutation and were shown to exhibit increased CaV2.1 channel activity. Here we investigated their cerebellar and caudal cortical transcriptome.
Methods
Caudal cortical and cerebellar RNA expression profiles from mutant and wild-type mice were studied using microarrays. Respective brain regions were selected based on their relevance to migraine aura and ataxia. Relevant expression changes were further investigated at RNA and protein level by quantitative polymerase chain reaction (qPCR) and/or immunohistochemistry, respectively.
Results
Expression differences in the cerebellum were most pronounced in S218L mice. Particularly, tyrosine hydroxylase, a marker of delayed cerebellar maturation, appeared strongly upregulated in S218L cerebella. In contrast, only minimal expression differences were observed in the caudal cortex of either mutant mice strain.
Conclusion
Despite pronounced consequences of migraine gene mutations at the neurobiological level, changes in cortical RNA expression in FHM1 migraine mice compared to wild-type are modest. In contrast, pronounced RNA expression changes are seen in the cerebellum of S218L mice and may explain their cerebellar ataxia phenotype.
Introduction
Familial hemiplegic migraine (FHM) is a rare Mendelian subtype of migraine with aura that is characterized by transient hemiparesis during the aura phase (1). FHM type 1 (FHM1) is caused by specific missense mutations in the CACNA1A gene that encodes the pore-forming α1 subunit of voltage-gated CaV2.1 calcium channels, which are involved in the regulation of neurotransmitter release (2). CACNA1A is expressed throughout the central nervous system, but expression is particularly high in the cerebellum (3). The clinical phenotype with FHM1 mutations can range from pure hemiplegic migraine (e.g. with mutation R192Q (4)) to a severe complex phenotype of hemiplegic migraine with cerebellar ataxia, seizures, and mild head trauma-induced cerebral edema that can result in fatal coma in the case of mutation S218L (5,6).
To investigate the neurobiological consequences of FHM1 mutations, we generated transgenic knock-in (KI) mouse models in which we introduced the FHM1 R192Q or the S218L mutation in the mouse Cacna1a gene by a gene-targeting approach (7,8). At the neurobiological level, both KI mutants show an increased neuronal calcium influx and neurotransmitter release. In addition, both KI mutants revealed an increased susceptibility to cortical spreading depression (CSD), a wave of neuronal and glial cell depolarization that originates in the occipital cortex and slowly propagates over the brain cortex and is considered the cause of the migraine aura (9). These neurobiological consequences are more pronounced in S218L mice. In line with the more complex phenotype seen in S218L patients, only S218L KI mice exhibit cerebellar ataxia and an increased susceptibility to seizures and mild head trauma-induced edema (5,6,8). For the present study we wanted to know whether neurobiological differences and cerebellar ataxia can be explained by changes at the RNA level. To this end we focused our RNA expression profiling to two brain regions: the caudal part of the cortex containing the occipital cortex and the cerebellum. The caudal cortex was chosen because it is the brain region where CSD waves start. The cerebellum was investigated because this brain region is involved in ataxia. We hypothesized that expression differences under basal conditions might highlight (molecular) mechanisms related to migraine aura (reflected in the caudal cortical profiles) or ataxia (reflected in the cerebellar profiles). Whereas cortical RNA expression profiles were shown to be remarkably similar between genotypes, specific differences in gene expression in the cerebellum could be linked to ataxia-relevant mechanisms.
Materials and methods
Animals
Experimental groups of mice.

The numbers in parentheses indicate the number of independent biological replicates that were included per experimental group.
Dissections of brain structures
Animals were sacrificed by cervical dislocation and brains were rapidly removed from the skull. Brain material was dissected and snap-frozen in liquid nitrogen within 15 minutes and stored at −80℃ until RNA isolation. Brain material was dissected in nine parts: the cerebellum (in two halves), both hemispheres of the cortex (with each hemisphere further dissected in three equal parts; the most caudal part containing the occipital cortex), and the brainstem.
RNA isolation
The right half of the cerebellum and the most caudal third of the right cortex were chosen for expression profiling. For total RNA isolation, the Machery Nagel RNA isolation kit (Düren, Germany) was used in combination with an Ultra-turrax T25 Polytron (Janke & Kunkel, Staufen, Germany) mechanical homogenizer. In brief, frozen tissue was crushed using a mortar under liquid nitrogen. Subsequently, tissue was homogenized in lysis buffer using the Polytron. Total RNA was bound to silica membrane of Macherey Nagel columns, while contaminating DNA was removed by rDNase. At the end of the procedure, total RNA was eluted with RNase-free water. RNA integrity was determined using the Agilent 2100 Bioanalyzer total RNA nanochips (Agilent, Foster City, CA, USA). All RNA samples that were included in the study had a minimal RNA integrity number (RIN) value of 7.0.
Gene expression profiling using Illumina microarrays
Biotin-labeled cRNA was produced using a linear amplification kit (IL1791; Ambion, Austin, TX, USA) using 300 ng of total RNA as input. cRNA samples were hybridized on Illumina mouse-6 Bead Chips, which contain 44,505 probes. Chip hybridizations, washing, Cy3-streptavidin (Amersham Biosciences, Uppsala, Sweden) staining, and scanning were performed on an Illumina Bead Station 500 platform (San Diego, http://www.illumina.com) using reagents and protocols supplied by the manufacturer.
Gene expression profile data analysis
Resulting data files were loaded into Rosetta Resolver version 7.2 (Rosetta Biosoftware, Seattle, WA, USA). Raw data were normalized using the standard Rosetta error model for Illumina arrays. Differences in gene expression between groups were evaluated using an error-weighted two-way analysis of variance (ANOVA) with genotype and gender as factors and Benjamini-Hochberg FDR was used for multiple testing corrections (FDR, p < 0.05). Post-hoc analysis was performed using Tukey-Kramer (FDR, p < 0.05). Caudal cortex and cerebellum profiles were analyzed separately. A “cortical signature” representing genes that are differently expressed in the caudal cortex of both mutant mice was selected based on ANOVA statistics and post-hoc analysis. Genes with a significant ANOVA p value for the parameter genotype, and that based on the post-hoc analysis were differently expressed between mutant mice (both S218L and R192Q strains) and wild-type mice, were selected. Similarly, an “ataxia signature” was created that represents genes that were differently expressed in the cerebellum of S218L but not of R192Q mice.
Using DAVID (http://david.abcc.ncifcrf.gov/home.jsp) (10), function labels from the PANTHER Classification System were ascribed to each gene. Genes were grouped into categories according to these function labels to determine enrichment of certain categories, and corrected for multiple testing using Benjamini-Hochberg FDR. These enrichment analyses were performed only on gene sets containing at least 100 genes.
Literature-based relationships
Literature-based relationships between genes in the specific gene sets and migraine were studied using the Anni text-mining program (Anni version 2.1) (11). For each gene or disorder a concept profile was generated by the program. A concept profile is a summary of all concepts directly co-mentioned with the disease or gene concept (i.e. the main concept) in PubMed abstracts. The strength of association for each concept with the main concept is calculated using 2 × 2 contingency tables and the uncertainty coefficient. The association between two concept profiles is calculated using vector-based matching (e.g. inner product score) over the concepts that the two profiles have in common.
Quantitative real-time-PCR
Biologically independent RNA samples were used for evaluation of microarray results by qPCR. Selection of differentially expressed genes (DEGs) for validation by qPCR was based on; 1) expression fold-changes equal or higher than 1.3, 2) expression levels high enough to be detectable by qPCR, and 3) the genes should represent pathways that are overrepresented in the data set based on the gene ontology (GO) term analysis. Only genes from the “ataxia gene signature” were selected, as the GO term analysis for the “caudal cortical signature” did not show overrepresented pathways.
First-strand cDNA was synthesized using random hexamer primers. Subsequently, qPCRs were performed on the MyiQ™ Single-Color Real-Time PCR Detection System (Bio-Rad, Hercules, CA, USA) using gene-specific primers (Supplemental Table 1). cDNAs were analyzed in duplicate, after which the average cycle threshold (Ct) was calculated per sample. Analyzed Ct values ranged from 18 to 33, and primer efficiencies ranged between 90% and 105%. Expression differences between mutant and wild-type samples were calculated using the ΔΔCt method using Gapdh as housekeeping gene (genotype and gender showed no effect on Gapdh expression in both caudal cortical and cerebellar tissue). Differential expression was calculated using Student’s t test.
Immunohistochemistry of TH
Mice were anaesthetized with Nembutal (50 mg/kg, intraperitoneally (i.p.)) and perfused intracardially with phosphate-buffered saline (PBS) followed by 4% paraformaldehyde in 0.1 M phosphate buffer (pH 7.4). Post-fixation was performed for two hours in 4% buffered paraformaldehyde followed by overnight incubation in 10% sucrose in 0.1 M phosphate buffer at 4℃. Next, tissue was embedded in 10% sucrose with 11% gelatin, fixed with 30% sucrose in 4% buffered paraformaldehyde for 2.5 hours at room temperature, followed by overnight incubation in 30% sucrose in 0.1 M phosphate at 4℃. Tissue was cut into 40 µm sagittal sections and processed for free-floating immunohistochemistry. Briefly, sections were incubated in 10% heat-inactivated normal horse serum, 0.5% Triton X100 in Tris-buffered saline (TBS) for two hours and then incubated with primary rabbit anti-Th antibody (AB152, 1:2,000; Chemicon, Temecula, CA, USA), diluted in TBS containing 1% normal horse serum, 0.4% Triton X100 at 4℃. Secondary biotin-labeled goat anti-rabbit antibody (1:200; Vector Laboratories, Burlingame, CA, USA) incubation was performed for two hours at room temperature. Finally, for detection, sections were incubated with the avidin-biotin kit (Vector Laboratories) for two hours at room temperature, washed, and developed in 0.1 mg/ml diaminobenzidine with 0.005% H2O2.
Single nucleotide polymorphism (SNP) analysis
Using the Mouse Genome Informatics (MGI) database (http://www.informatics.jax.org/), SNPs surrounding the Cacna1a locus on mouse chromosome 8 were selected that could distinguish C57BL/6 J- and 129/Ola-derived sequences. Using genomic tail DNA, SNP genotypes for all mutant mice that were included in the study were determined by standard PCR combined with direct sequencing.
Results
Expression levels of genes encoding pore-forming subunits of CaV channels.
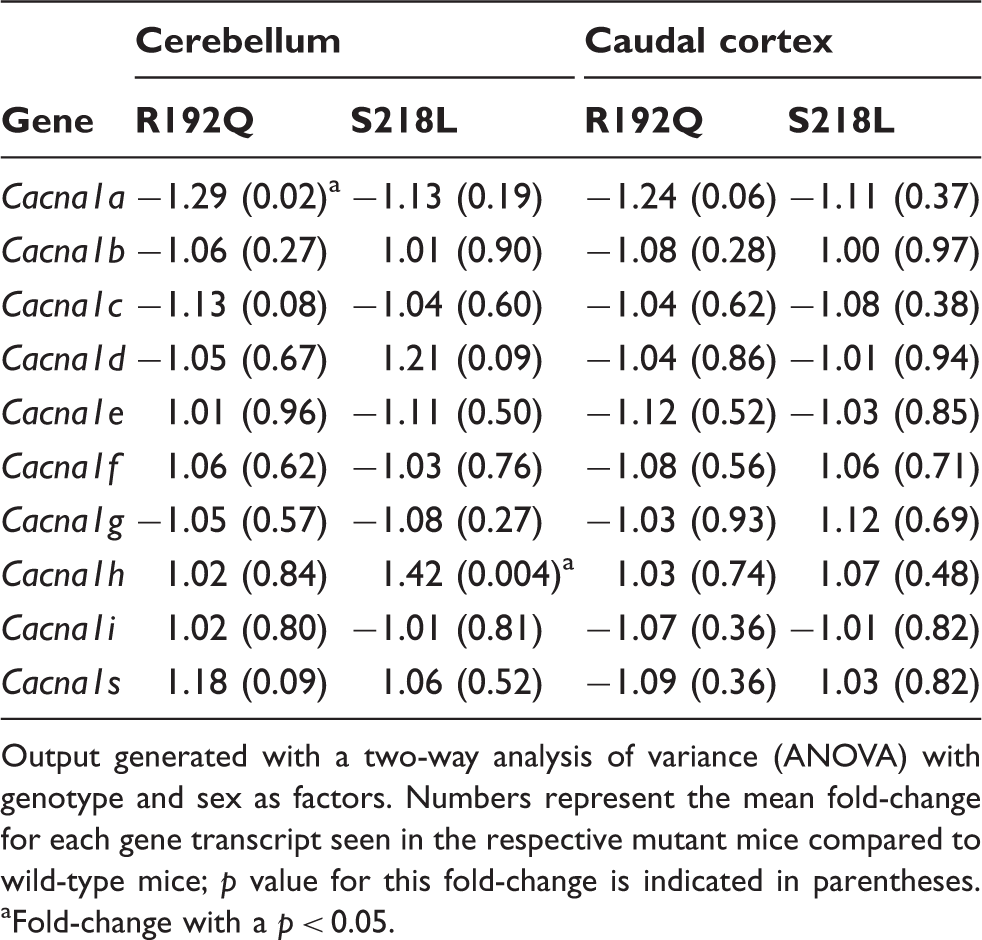
Output generated with a two-way analysis of variance (ANOVA) with genotype and sex as factors. Numbers represent the mean fold-change for each gene transcript seen in the respective mutant mice compared to wild-type mice; p value for this fold-change is indicated in parentheses. aFold-change with a p < 0.05.
To statistically evaluate differences in gene expression profiles between Cacna1a KI and wild-type mice, a two-way ANOVA was performed for cerebellum and caudal cortex separately, with genotype and gender as factors. The effect of gender on gene expression was minimal; only a few genes were significantly differentially expressed between males and females in both structures. When comparing the expression profiles for the different genotypes (i.e. wild-type, S218L, and R192Q), we noticed that both for the cerebellum and caudal cortex a large portion of significant DEGs is located on chromosome 8 (in the caudal cortex: 64% and 87%, and in the cerebellum 41% and 19%, for R192Q and S218L, respectively). Chromosome 8 contains the Cacna1a gene that was modified by gene targeting. Although KI mice were backcrossed with C57BL/6 J for several generations, the region directly flanking the mutated Cacna1a gene remained of 129/Ola genetic background. The “chromosome 8 genes” are likely differently expressed because of genetic background differences (12) although some may be in fact because of the presence of the FHM1 mutation. We determined the genomic boundaries of 129-derived chromosome 8 regions in the FHM1 mice and could show that the 129/Ola-derived region flanking the Cacna1a gene extended maximally 37 Mb upstream to 46 Mb downstream of the R192Q mutation and 37 Mb upstream and 52 Mb downstream of the S218L mutation. As the 129/Ola-derived region involved a rather large part of chromosome 8 in some of the mice, we decided to exclude all genes located on chromosome 8 from the gene signatures used for subsequent analyses. No such enrichment of DEGs was found for other chromosomal loci, indicating that the expression differences for genes not located on chromosome 8 do not result from remaining 129/Ola genetic background regions. For the caudal cortex few DEGs remained after exclusion of chromosome 8 genes (i.e. 22 for R192Q KI and 10 for S218L KI) (Supplementary Tables 3 and 4). For the cerebellum, the number of DEGs that remained after chromosome 8 gene exclusion was considerably higher: 82 for R192Q KI and 335 for S218L KI mice (Supplementary Tables 5 and 6).
Because the caudal cortex is most relevant for the observed increased susceptibility to CSD in KI mice, we selected a “cortical gene signature” by selecting genes that were differentially expressed in the caudal cortex of both mutant mouse models (Figure 1(a)). Nine genes were differentially expressed in both strains of mutant mice (Table 3); all showed modest fold-changes (between –1.6 and 1.5). Six genes (i.e. Lsm10, Gpr34, Gpr23, Ctxn3, Gli3, and Tnnc1) were upregulated in both strains, whereas Cort was upregulated in one and downregulated in the other. Camkk1 and Tom1l2 were downregulated in both strains.
(a). Differentially expressed genes in the caudal cortex of mutant knock-in (KI) mice. Only nine genes are differentially expressed in the caudal cortex of both KI mouse models (“cortical gene signature”). (b) Differentially expressed genes in cerebellum. No less than 296 genes are differentially expressed in the cerebellum of S218L KI mice compared to R192Q KI and wild-type mice (“ataxia gene signature”). Genes that are differentially expressed in the caudal cortex of both R192Q and S218L mice (“cortical” signature). ANOVA: analysis of variance. Genes from chromosome 8 were excluded. Numbers represent the mean fold-change for each gene transcript seen in the respective mutant mice compared wild-type mice. The numbers in parentheses represent the p value for the respective fold-change.

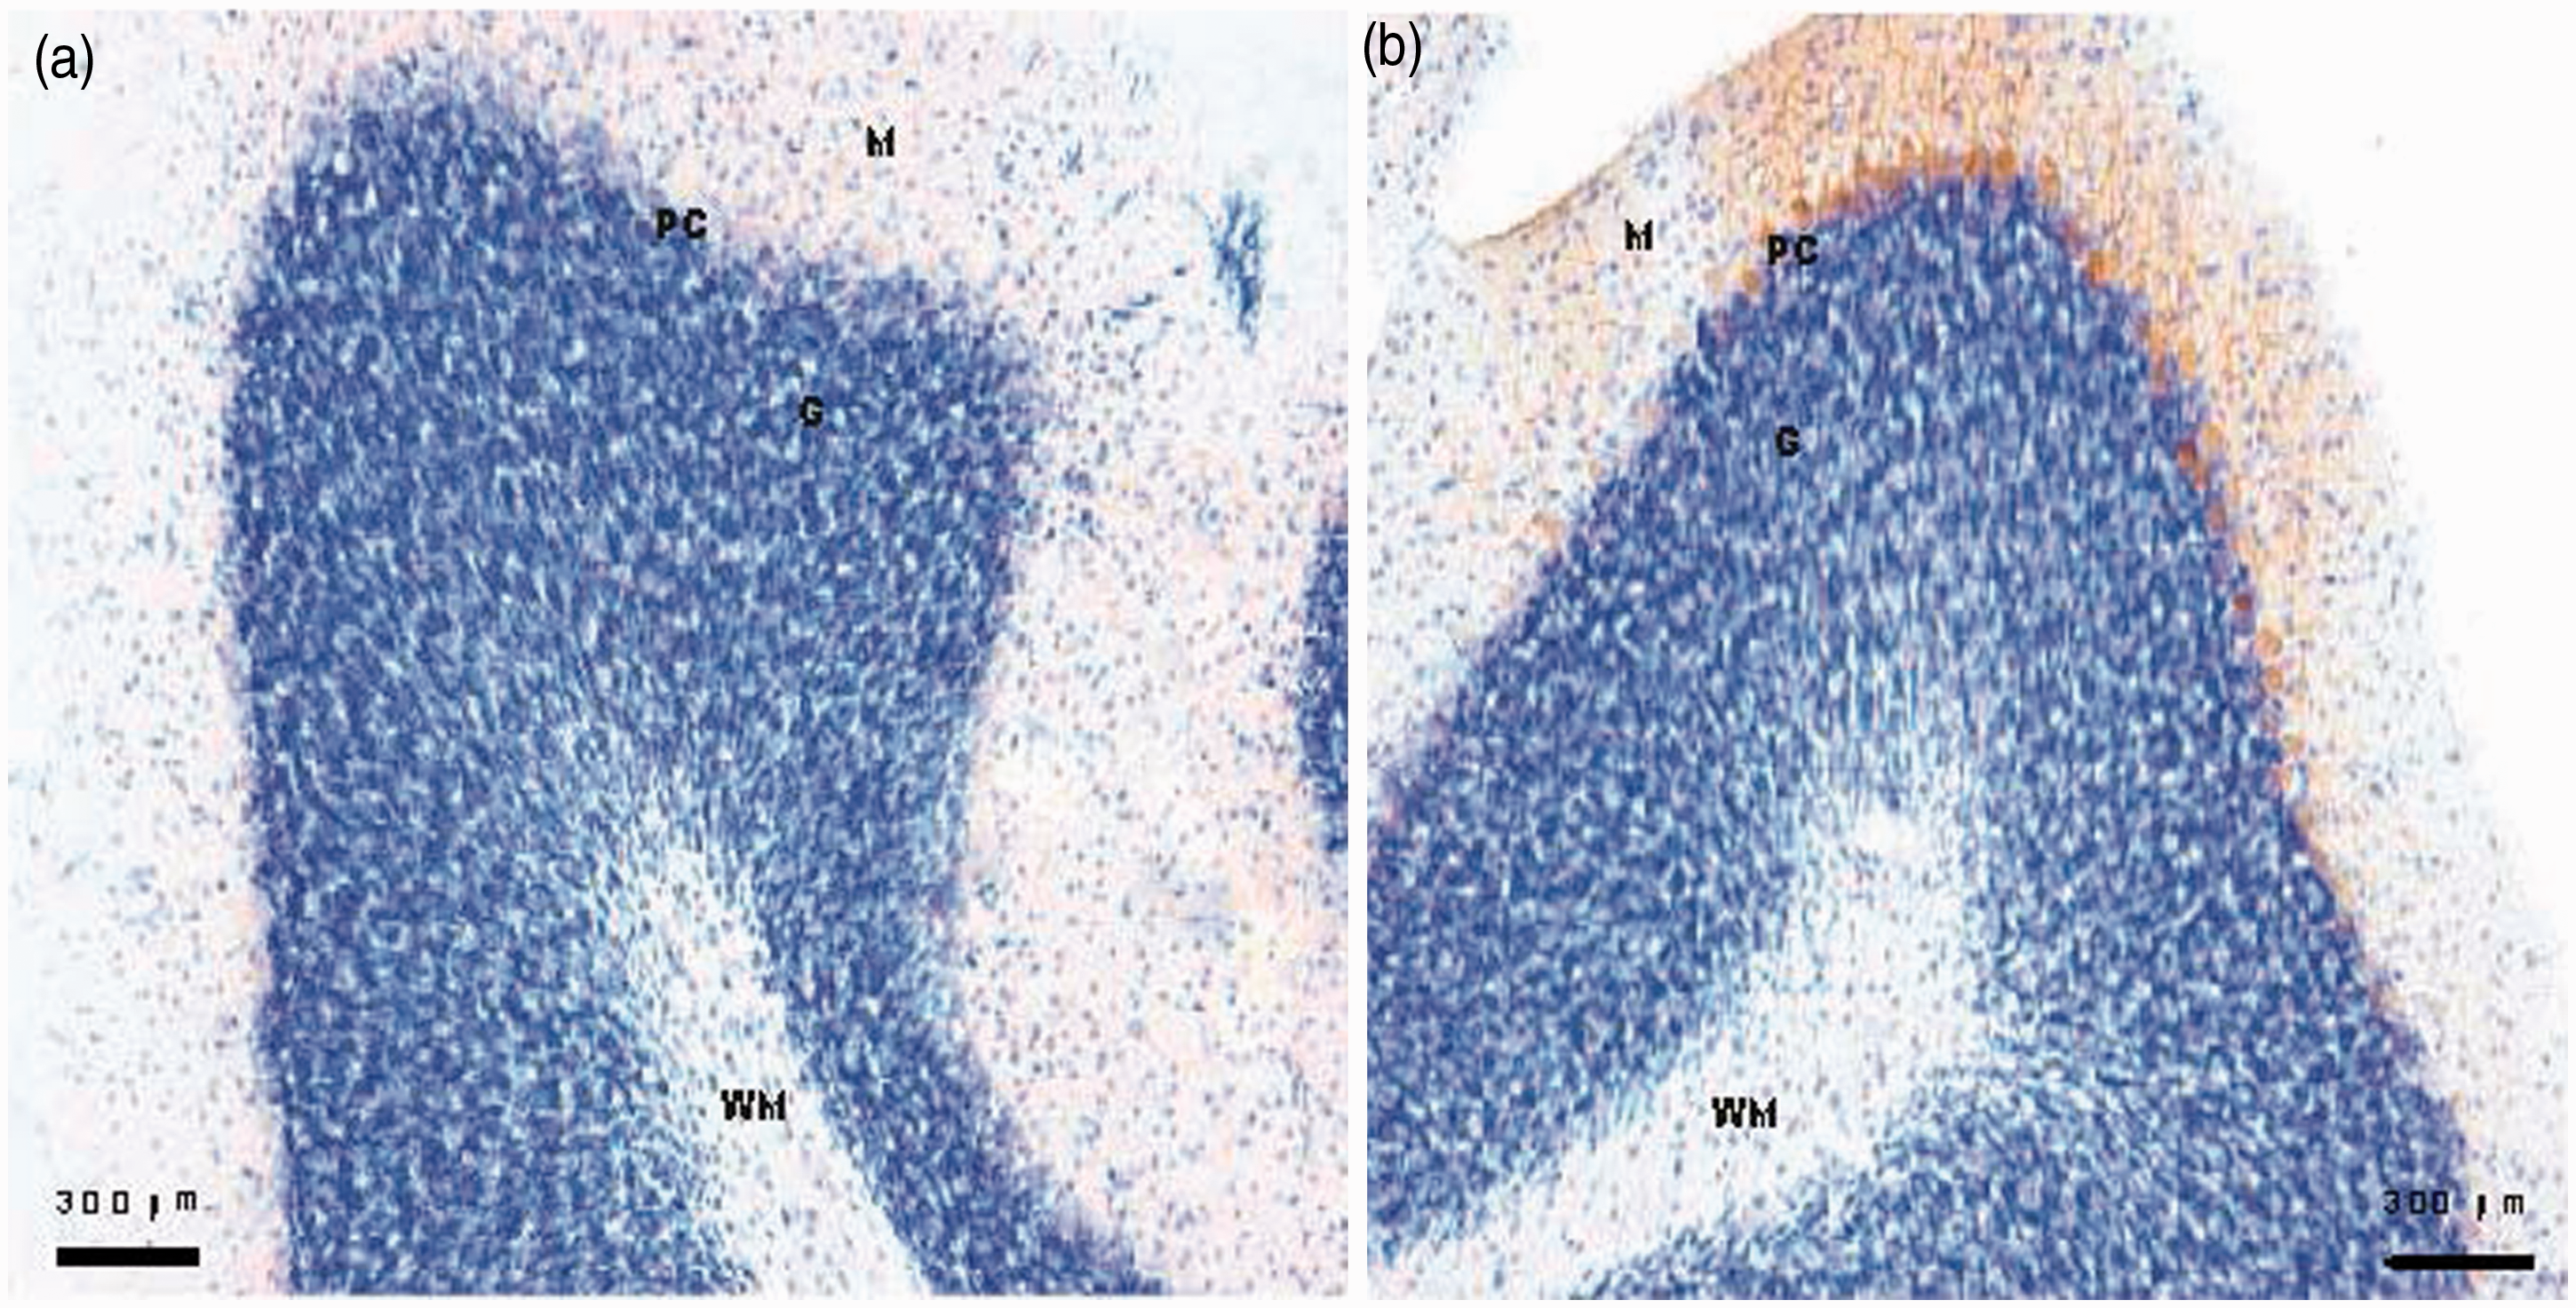
For the cerebellum, we extracted an “ataxia gene signature” containing genes that were differentially expressed in the cerebellum of S218L KI mice (when compared to R192Q KI and wild-type mice). The “ataxia gene signature” contained 296 genes (Figure 1(b)). Using bioinformatic resource DAVID, a GO term and pathway analysis was performed to identify enrichment of functional GO categories. This resulted in significant over-representation of three biological process GO terms, two molecular function GO terms, and one pathway (Table 4). Several were related to signal transduction and neurotransmitter synthesis. Subsequently, qPCR analyses were performed for five DEGs from these pathways in biologically independent samples that were backcrossed for seven additional generations to better assess that the identified gene expression differences are indeed due to effects related to mutated calcium channels. The results confirmed the findings of the microarray experiments (Figure 2). Using the Anni text-mining program we investigated possible literature-based relationships between the term ataxia and the genes in the “ataxia gene signature.” The Ppp2r2b gene, encoding brain-specific regulatory subunit of the protein phosphatase PP2A, and the Gfap gene, encoding glial fibrillary acidic protein, showed most obvious literature-based relationships with ataxia. Notably, mutations in these genes cause spinal cerebellar ataxia type 12 (SCA12) (13) and Alexander disease (14), which can involve ataxia as a symptom. Ppp2r2b and Gfap were both upregulated in the cerebellum of the S218L KI mice with a fold-change of 1.2 (p = 6.4 × 10⁻⁴) and 1.6 (p = 2.9 × 10⁻⁴), respectively. The most striking fold-change in the “ataxia gene signature,” however, was observed for tyrosine hydroxylase (Th) (fold-change 13.1; p = 3.92 × 10⁻²⁰). Th upregulation was confirmed at the protein level as evidenced by the strong immunoreactivity in Purkinje cells of S218L mice (Figure 3).
Quantitative PCR analysis of genes altered in the cerebellum of S218L mice. Data are derived from a set of biologically independent samples, and are expressed as fold changes (means ± SD), normalized to Gapdh mRNA expression, where the values for wild-type mice were set at 1.00. *p < 0.05 compared to the wild-type mice. Protein expression of tyrosine hydroxylase (Th) in the cerebellum. Immunohistochemistry using Th-specific antibody (brown signal). Some Purkinje cells stain positive in the S218L mutant. Left panel: wild-type, right panel: S218L. M: molecular layer; PC: Purkinje cell layer; G: Granule cell layer; WM: white matter. Pathways that are significantly overrepresented in the “ataxia” gene signature (p < 0.05 after Benjamini-Hochberg correction for multiple testing). Output generated using DAVID. Genes in bold were selected for validation by quantitative polymerase chain reaction (qPCR). BP: biological process, MF: molecular function.

Discussion
Here we performed the first gene-expression profiling study in transgenic KI mouse models with human FHM1 mutations R192Q and S218L to investigate whether the mutations lead to expression differences in migraine-related mouse brain tissues. We investigated the caudal part of the cortex that included the visual cortex because CSD, the electrophysiological substrate of the migraine aura, originates in this area of the cortex (9,15). We also studied the cerebellum because cerebellar ataxia originates from this area of the brain and cerebellar ataxia is a prominent part of the migraine-associated phenotype of S218L mice.
In line with earlier studies on these mouse models that revealed comparable numbers of functional CaV2.1 channels at the plasma membrane without up- or downregulation of other CaV channel types (7,8), mRNA expression levels of the mutated Cacna1a gene and genes encoding other subunits of CaV channels did not show major alterations of CaV subunits as a mechanism for the compensation of the gain-of-function of CaV2.1 channels. Consequently, we postulate that the clinical features seen in mice and patients with FHM1 gene mutations are more likely the result of changed functionality of CaV2.1 channels, perhaps in combination with changes in downstream targets of these channels.
As both KI mutants were generated on a mixed C57BL/6J × 129/Ola genetic background (7,8), despite being back-crossed to C57BL/6J for several generations, gene sequences on chromosome 8 directly flanking the mutated Cacna1a gene are still of 129/Ola origin. Valor and Grant have shown that remnant 129/Ola sequences may lead to subtle gene-expression differences in transgenic mouse models because of mixed genetic differences surrounding the gene that was modified during the transgenesis process (12). When comparing expression profiles from our mutant KI and wild-type mice, we indeed observed an overrepresentation of DEGs located in close proximity to the mutated Cacna1a gene. It is unlikely that all these DEGs are the direct result of the introduced FHM1 mutation. We postulate that the presence of a small number of nucleotides that were introduced during the targeting procedure might as well have exerted a cis-effect on gene expression of some of the neighboring genes on chromosome 8. For this reason, we decided to exclude chromosome 8 genes from further analyses.
Previous molecular and electrophysiological studies have shown that neuronal excitability and cortical glutamate release is increased in the KI mutants (7,8,16). Here, we could show that the increased neuronal excitability is not accompanied by prominent gene expression changes in the caudal cortex (at least under unchallenged conditions). Only nine genes were differentially expressed in the cortex of mutant KI mice; Camkk1, Cort, Ctxn3, Gli3, Gpr23, Gpr34, Lsm10, Tnnc1, and Tom1l2. Differential expression of cortical Camkk1, Gpr34, Tom1l2, and Cort gives an indication for an immune-related component, as these genes seem involved in the immune response (17–21).
In contrast to the limited amount of nonchromosome 8 genes differentially expressed in the cortex, a total of 378 genes were differentially expressed in the cerebellum of the mutant KI mice, of which 296 specifically in the cerebellum of S218L mice that exhibit cerebellar ataxia (all not located on chromosome 8). GO term analysis with the S218L-specific “ataxia gene signature” showed significant overrepresentation of genes belonging to pathways related to neurotransmitter synthesis and intracellular signaling. Especially genes related to the synthesis of the neurotransmitter serotonin were differentially expressed (Table 4).
In the S218L-specific “ataxia” gene signature, the largest fold-change was observed for the Th gene that encodes the rate-limiting enzyme of the biosynthetic pathway of catecholamines, dopamine, norepinephrine, and epinephrine (22). Th overexpression was confirmed at the protein level with immunohistochemistry (Figure 3). Th is transiently expressed in the cerebellum during development, but is absent (or very low expressed) in the cerebellum of adult mice (23). Hence, Th expression in the adult Purkinje cells is considered a marker for delayed maturation of the cerebellum. Interestingly, other ataxic mouse models with naturally occurring Cacna1a mutations (i.e. Rolling Nagoya, Tottering, and Leaner) also show a high, persistent Th expression in adult cerebellum (24). However, as phosphorylation of several serine residues was shown to be absent in upregulated Th in these mice, but important for Th activity (25), it is unclear whether Th function is abnormal in Cacna1a mutant mice. Notably, an expression profiling study in Purkinje cell degeneration mice, which are characterized by degeneration of cerebellar Purkinje cells and progressive ataxia, showed a two-fold increase in expression of the Th gene (26).
Several genes in the S218L-specific “ataxia” gene signature can be linked to cerebellar ataxia relevant pathways. For example, 5’ noncoding CAG expansions in the PPP2R2B gene, which encodes a brain-specific regulatory subunit of the protein phosphatase PP2A holoenzyme, cause SCA12 (13). The repeat expansion results in an increased PPP2R2B expression (27), similar to what was observed in the cerebellum of the S218L KI mice. Gain-of-function mutations in glial fibrillary acidic protein (GFAP) are associated with infantile and juvenile Alexander disease, a rare leukodystrophy of the cerebellum (14), with gait ataxia as a clinical feature in many patients with adult-onset Alexander disease (28). Transgenic mice in which wild-type human GFAP was overexpressed were presented as a mouse model for Alexander disease (29). Overexpression of Gfap was also observed in the “ataxia gene signature” in the cerebellum of S218L mice.
Previous studies showed increased neuronal calcium influx and neurotransmitter release in FHM1 KI mice. Here we show that these neurobiological consequences of migraine gene mutations are not accompanied by prominent RNA expression differences in the cortex of these migraine mouse models. These neurobiological consequences could perhaps be linked to, for instance, post-transcriptional and/or epigenetic mechanisms, or expression changes that become pronounced only after a trigger, which would be in line with the episodic nature of migraine. Future studies need to show whether expression profiles in other brain regions or after a trigger, like CSD induction, will show expression changes between migraine mice and wild-type mice. Another important message from this study is that gene-expression studies in transgenic animals may result in identification of multiple DEGs on the targeted chromosome resulting from background strain differences instead of being due to the introduced mutation. This should be taken into account when interpreting the gene-expression profiles derived from the targeted chromosome. Clear differences in RNA expression profiles were observed in the cerebellum of S218L KI mice that may reflect the chronic ataxic phenotype in this strain of mice.
Clinical implications
Gene-expression data from familial hemiplegic migraine type 1 (FHM1) knock-in mice can be used to study neurobiological consequences of CACNA1A mutations. The R192Q CACNA1A gene mutation does not lead to profound gene-expression changes. The S218L CACNA1A gene mutation is associated with pronounced gene-expression changes in the cerebellum that might explain the cerebellar ataxia part of the phenotype.
Footnotes
Funding
This work was supported by grants from the Netherlands Organisation for Scientific Research (NWO) (Vici grant number 918.56.602, M.D.F), the EU “EUROHEAD” grant (grant number LSHM-CT-2004-504837; M.D.F, R.R.F, A.M.J.M.v.d.M) and the Center of Medical System Biology (CMSB) established by the Netherlands Genomics Initiative/NWO (NGI/NWO).
Conflict of interest
None declared.
Acknowledgments
We thank Dr Nicole A. Datson for her scientific comments on the manuscript.
References
Supplementary Material
Please find the following supplemental material available below.
For Open Access articles published under a Creative Commons License, all supplemental material carries the same license as the article it is associated with.
For non-Open Access articles published, all supplemental material carries a non-exclusive license, and permission requests for re-use of supplemental material or any part of supplemental material shall be sent directly to the copyright owner as specified in the copyright notice associated with the article.