
Abstract
Objectives: It can be difficult to distinguish vestibular migraine (VM) from Menière’s disease (MD) in its early stages. Using vestibular-evoked myogenic potentials (VEMPs), we sought to identify test parameters that would help discriminate between these two vestibular disorders.
Methods: We first recorded ocular and cervical VEMPs (oVEMP/cVEMP) to air-conducted clicks and bone-conducted vibration in 30 control participants, 30 participants with clinically definite VM and 30 participants with clinically probable VM. Results were compared with a group of 60 MD patients from a previous study. oVEMPs and cVEMPs were then recorded at octave frequencies of 250 Hz to 2000 Hz in 20 controls and 20 participants each with clinically definite VM and MD. Inter-aural amplitude asymmetry ratios and amplitude frequency ratios were compared between groups.
Results: For click, tendon-hammer-tap and minishaker-tap VEMPs, there were no significant differences in reflex amplitudes or symmetry between controls, definite VM and probable VM. Compared with MD patients, participants with VM had significantly fewer reflex abnormalities for click-cVEMP, click-oVEMPs and minitap-cVEMPs. The ratio of cVEMP amplitude generated by tone bursts at a frequency of 0.5 kHz to that generated by 1 kHz was significantly lower for MD affected ears than for VM or controls ears. cVEMP asymmetry ratios for 0.5 kHz tone bursts were significantly higher for MD than VM.
Conclusions: The 0.5/1 kHz frequency ratio, 0.5 kHz asymmetry ratio and caloric test combined, separated MD from VM with a sensitivity of 90.0% and specificity of 70.0%.
Introduction
The coexistence of vertigo and migraine is higher than can be attributed to the prevalence of each disorder in the community (1,2). Vestibular migraine (VM), while not currently recognized by the International Headache Society (IHS), has been proposed as a distinct diagnostic entity accounting for 6–10% of episodic vertigo (3,4). Episodic spinning and non-spinning vertigo, unsteadiness, positional vertigo and visually induced vertigo lasting seconds to days have been described in the context of VM (4–9). Menière’s disease (MD) is an inner ear disorder that is characterized by episodic rotatory vertigo, tinnitus, aural fullness and hearing loss. Its underlying pathophysiology is derived from an excess of inner ear fluid (endolymphatic hydrops), which over time can contribute to permanent loss of hearing and vestibular function. Early Menière’s disease can present with episodic vertigo only, and can be difficult to separate from VM. The separation of these two entities is further complicated by the higher than average life-time prevalence of migraine in patients with MD (10).
Vestibular evoked myogenic potentials (VEMPs) provide a quick and non-invasive means of assessing vestibular-otolith function in patients with recurrent vestibular symptoms. The test exploits the use of non-physiological stimuli, either loud air-conducted (AC) sound or vibration, to deflect the sensory hair cells within the otolith macula. When recorded from the contracted sternocleidomastoid muscles, the response consists of an inhibitory potential representing the ipsilateral projections from the otolith organs to the neck, referred to as the cervical VEMP or cVEMP (11,12). The ocular VEMP (oVEMP) reflex is an excitatory potential representing the otolith ocular pathways (13,14).
In 60 patients with clinically definite or probable VM, classified according to Neuhauser criteria (4), Baier et al. (15) reported a high prevalence (68%) of lowered cVEMP amplitudes in response to 400 Hz AC tone bursts. Because lowered amplitudes were also recorded in 69% of participants with MD, they hypothesized that the saccule was involved in both disorders (16). Hong et al. (17) examined rates of reflex detection in response to 500 Hz AC tone-burst stimuli and found a higher prevalence of absent responses in VM patients than in normal controls. However, Murofushi et al. (18), also using 500 Hz AC tone bursts, found that amplitudes in VM were similar to those of control participants, with both controls and VM patients having a higher rate of reflex detection than the affected ears of MD patients. Altered VEMP frequency tuning in 3/11 VM patients and 5/11 MD patients led them to conclude that they shared a common pathophysiology.
Migraineurs show large visual and auditory evoked responses, as shown from grand averages of multiple subjects, and show a lack of habituation to repetitive stimuli (19,20). By comparing changes in cVEMP amplitudes over successive stimulus averages, Roceanu et al. (21) demonstrated a similar lack of habituation in the vestibulocollic reflex pathways. Reduced suppression of oto-acoustic emissions (OAEs) is thought to represent sensory dysmodulation in the auditory brainstem pathways of migraineurs (22,23). Bithermal caloric tests demonstrate hyper-responsiveness (24,25), and sinusoidal vestibulo-ocular reflex testing shows increased gain (26) and prolonged time constants (27). We thus expected large vestibular evoked potentials in VM.
We first sought to define the oVEMP and cVEMP profiles of VM patients using AC and bone-conducted vibration (BCV) stimuli. We expected large symmetrical VEMPs in VM, which would enable its separation from MD, which is characterized by asymmetrical cVEMPs and/or oVEMPs to AC sound in 60% of participants (28).
The diagnosis of both VM and MD relies on clinical criteria. However, in the early stages of each disease, not all clinical criteria are likely to be fulfilled. We hypothesized that the conventional vestibular function test profiles and the VEMP profiles of VM and MD might differ, thus enabling their separation. The VEMP test has the additional advantage of not provoking nausea or dizziness and is therefore well tolerated by patients with motion sensitivity and migraine. The present study explores the ability of VEMPs to AC and BCV stimuli and conventional vestibular function tests to separate clinically definite VM from MD.
Methods
Participants
Sixty patients fulfilling Neuhauser criteria (4) for clinically definite (26 females, four males; mean age ± SD 41.0 ± 12.1) or clinically probable VM (26 females, four males; mean age 43.7 ± 13.7) and 30 controls (25 females, five males; mean age 41.9 ± 13.3) were studied. Our published data from 60 patients fulfilling the American Academy of Otolaryngology Head and Neck Surgery criteria for definite unilateral Menière’s disease (28) were used for comparison with definite VM patients. Thus, for all patients with Menière’s disease, unilateral sensorineural hearing loss had been documented on at least one occasion.
Screening and classification
Controls with any current or previous history of vertigo, migraine headaches, visual phenomena or hearing loss (other than presbycusis) were excluded. Patients who fulfilled the Neuhauser et al. criteria (4) for definite or probable VM were classified by their migraine type, according to the International Headache Society (IHS) ICDH-2 criteria (29). Patients underwent interictal bedside neuro-otological examination, audiometry and tympanometry. Only participants with normal middle ear function were included in the study. Results of bithermal caloric testing using videonystagmography, the subjective visual horizontal test, and rotational vestibulo-ocular reflex to a trapezoidal stimulus from −50°/s to + 50°/s (acceleration for 5 s at 20°/s2) were documented. An abnormal caloric response was defined as canal paresis greater than 25%, based on the slow phase velocity component of nystagmus. An abnormal subjective visual horizontal result, determined from the mean of seven consecutive trials was an angular offset greater than 2.5°.
Stimuli used for VEMPs
For our baseline study, AC clicks (0.1 ms at 140 decibels peak-sound pressure level (dB SPL) of alternating polarity were presented monaurally at 5/s via calibrated telephonics dynamic headphones (TDH)-49. In a second study, VEMP amplitudes and thresholds were recorded in response to 4 ms (1 ms rise/fall time) AC tone bursts (250 Hz, 500 Hz, 1 kHz and 2 kHz) of alternating polarity, from 20 controls (age 43.4 ± 12.6) and 20 patients with definite VM (age 43.0 ± 14.3) and 20 patients with MD (age 43.5 ± 12.9). Tone-burst stimuli were presented at a fixed maximum intensity of 100 dB normal hearing level (nHL). The nHL reference scale was used to control for the effects of the middle ear transfer function, which in humans enhances the transmission of frequencies between 650 Hz and 2 kHz (30).
BCV stimuli were delivered by either a minitap or tendon hammer. The minitap stimulus consisted of vibration pulses (condensation polarity, 20 V amplitude) of 1 ms delivered at 5/s by a hand-held bone vibrator (Bruel and Kjaer 4810 minishaker) at Fz (in the midline, at 30% of the distance between the nasion and the inion). This is equivalent to an intensity of 147 dB force level (24 N). Calibration of the minitap was achieved using a Bruel and Kjaer sound level meter and an artificial mastoid (Bruel and Kjaer 4930). Forehead taps were delivered manually over Fz via a custom-made tendon hammer with a trigger switch at 1/s.
Testing procedure for baseline click and BCV recordings
For our baseline study, participants were tested in the supine position. The methods and procedures are described in detail in Taylor et al. (28). cVEMP and oVEMP reflexes were recorded separately using the electrode montage illustrated in Figure 1A. oVEMP reflexes were recorded during maximum upward gaze. Unrectified electromyographic activity was band-pass filtered from 3 Hz to 1000 Hz and sampled at 10 kHz. Responses were averaged for 100 AC stimuli and 50 BCV stimuli. cVEMP reflexes were recorded during bilateral activation of the sternocleidomastoid muscles during head elevation from the supine position. Rectified and unrectified electromyographic activity was recorded from 20 ms before the stimulus to 80 ms after the onset of the stimulus. Responses to 125 AC or 50 BCV stimuli were band-pass filtered (20–2000 Hz), sampled (10 kHz) and averaged.
(A) Electrode montage for recording cVEMP and oVEMP: for oVEMP recordings (top trace), the active (inverting polarity) electrodes were positioned just below the lower lid margin in line with the pupil, with the reference electrode approximately 2 cm below this. For the cVEMP (bottom trace), the active (inverting polarity) electrode was positioned on the upper third of the sternocleidomastoid muscle, referenced to the middle of each clavicle. (B) ICDH-2 classification of migraine headache of our participants. (C) Vestibular symptoms of our participants. Episodic vestibular symptoms included spinning and non-spinning vertigo; additional symptoms including unsteadiness and mal de debarquement were grouped under ‘other’. Thirty-seven patients (74%) reported more than one type of ‘dizzy’ sensation. Tinnitus was binaural in 65.7% (n = 23) and monaural in 34.3% (n = 12). Tinnitus was temporally correlated with vertigo and either headache or photophobia in six patients, all fulfilling the criteria for definite VM. All patients had normal head impulse tests in horizontal canal planes, normal smooth pursuit and saccadic eye movements on bedside interictal assessment. Four patients had unidirectional spontaneous nystagmus that was <1°/s (on video oculography) and four had head-shaking nystagmus during interictal examination.
Frequency tuning for cVEMP and oVEMP
Tone-burst cVEMP and oVEMP reflexes were simultaneously recorded in the seated position, while the participant rotated their head contralateral to the stimulus and gazed upward at a fixed target. The stimulus intensity was reduced in 5–10 dB decrements to determine the reflex threshold. An absent reflex at the maximum intensity was recorded as zero in the amplitude data and a threshold of 105 dB nHL was assumed. The order of stimulated ear (right or left) and stimulus frequency were randomized. Mean rectified electromyographic activity was monitored throughout by the experimenter to ensure a consistent level of sternocleidomastoid muscle activation (intra-session variability <20 µV) for each participant.
Analysis
Reflex amplitudes were considered abnormal when absent, asymmetrical or reduced relative to control data (outside the mean ± 2SD). Amplitude asymmetry was determined using Jongkee’s formula: 100 × (Al − Ar)/(Al + Ar) (where Al and Ar represent the amplitude of the left and right side, respectively). Reflex latencies were measured from stimulus onset to the first positive (p13) and negative (n10) peaks of the cVEMP and oVEMP waveforms, respectively. The mean ± 2SD for healthy controls defines the normal range of all responses. Complete absence of a response was considered if a response could not be determined above the noise floor. Ears were always checked for collapsing ear canals before the careful positioning of the earphones. For the cVEMP, a minimum level of average rectified sternocleidomastoid muscle activation (100 µV) was confirmed before judging an absent response. In some instances cVEMP responses to BCV stimuli could not be reliably separated from a later non-vestibular potential, probably a stretch reflex. These, referred to as ‘non-separating reflexes’, were considered missing values.
In the frequency tuning experiment, we compared the following amplitude and threshold pairs: 250 Hz to 1 kHz; 250 Hz to 2 kHz; 500 Hz to 1 kHz; 500 Hz to 2 kHz. Threshold differences were calculated by subtracting the threshold obtained for the higher frequency from that of the lower frequency tone burst. VEMP amplitudes generated by tone bursts of two different frequencies were expressed as a frequency ratio (FR) using Jongkee’s formula:

Statistical analysis
Baseline study
Data were analysed using SPSS (version 18.0). In our baseline study of VM, a repeated measures 2 × 3 × 3 factor ANOVA was separately performed for cVEMP and oVEMP. The reflex amplitudes and latencies were dependent variables. The ear (left/right) and stimulus (click/minitap/tendon hammer tap) were within-participant factors; the group (controls/definite VM/probable VM) were between-participant factors. Paired t-tests or independent t-tests with Bonferroni-Holm corrections were used for post-hoc comparisons of normally distributed data. Because much of the data were not from a normal distribution (Kolmogorov-Smirnov test), alternative non-parametric statistical tests were used. The Kruskal-Wallis test was used for the comparison of asymmetry ratios. When comparing the prevalence of reflex abnormalities between definite VM, probable VM and control participants, we used Fisher’s exact test. Odds ratios were used to express the likelihood of a given abnormality in definite VM versus definite MD. Mann-Whitney U tests were used for the analysis of vestibulo-ocular reflex time constants and gains.
Frequency tuning study
Separate repeated measures of 3 × 4 ANOVA models were used to compare the effect of tone-burst frequency on cVEMP thresholds and amplitudes between VM, control and unaffected MD ears, and between VM, control and affected MD ears. For the frequency tuning of oVEMP, amplitudes were analysed separately for each group using Friedman tests, with Wilcoxon signed ranks tests for post-hoc comparisons. Left-right asymmetry ratios and frequency ratios were compared between groups with Kruskal-Wallis tests, and within groups using Friedman tests. Mann-Whitney U and Wilcoxon signed ranks tests were used for the respective post-hoc comparisons.
Results
Baseline study of cVEMPs and oVEMPs in VM vs normal controls
Reflex parameters for normal control participants

oVEMP amplitudes are expressed in μV; cVEMP amplitudes are corrected for baseline electromyographic activity and are a ratio without units.
Baseline study: definite vestibular migraine and definite Menière’s disease
Figure 2 compares the prevalence of VEMP, caloric and subjective visual horizontal abnormalities for VM and MD. The odds of a unilateral VEMP abnormality was significantly higher in patients with definite MD compared to patients with definite VM for the AC cVEMP (odds ratio 9.33, p = 0.004: 95% CI 2.03–42.88), AC oVEMP (odds ratio 6.25, p = 0.002: 95% CI 1.92–20.31) and minitap cVEMP (odds ratio 7.73, p = 0.050: 95% CI 0.95–62.69).
Prevalence of vestibular test abnormalities in definite VM and definite MD. VEMP results are included for all definite VM (n = 30) and definite MD (n = 60) patients. Subjective visual horizontal (SVH) and bithermal caloric test results were available for n = 23/30 and n = 27/30 definite VM patients, respectively, and for n = 40/60 and n = 55/60 definite MD patients.
The odds of an abnormal caloric test result was 26.36 for MD compared with VM (p < 0.001: 95% CI 6.91–100.48). Ten of 27 patients with definite VM had prolonged autonomic responses (profound nausea, vomiting and diaphoresis) to caloric stimulation. Twenty-four received reduced irrigation times (10–35 s) and two were tested using a monothermal test protocol (cool or warm water only). In contrast, of the 55 MD patients who underwent caloric testing only three had prolonged autonomic reactions and 13 received reduced irrigation times.
Vestibulo-ocular reflex gain and time constants for trapezoidal rotation were compared between 20 participants with definite VM and 20 age-matched definite MD patients (mean age ± SD: VM 44.3 ± 9.0; MD 44.5 ± 9.9). When comparing VM and MD for chair rotation towards the affected MD ear, the gain was significantly reduced (mean ranks MD = 16.0; VM = 25.0; p = 0.014) and the time constants were significantly shorter (mean ranks MD = 15.7; VM = 25.3; p = 0.009) in MD than in VM. There were no significant group differences in gain (mean ranks MD = 17.9; VM = 23.1; p = 0.165) for rotation toward the unaffected MD ear, but time constants in VM were still significantly longer (mean rank MD = 16.6; VM = 24.4; p = 0.033).
VEMP frequency tuning characteristics in controls, VM and MD
We examined reflex detection rate, amplitude and threshold for the two independent variables of participant group and tone-burst frequency. Descriptive statistics are summarized in Appendix 4.
Reflex amplitude: the effect of tone-burst frequency on reflex amplitude
When cVEMP amplitudes for unaffected MD ears were compared with VM and control ears, there were no significant group differences (F(2, 57) = 0.412; p = 0.662). Ears in these groups demonstrated higher amplitudes in response to 500 Hz than to all other tone-burst frequencies (p < 0.001) (Figure 3A). cVEMP amplitude comparisons between affected MD ears, VM and control ears revealed a significant interaction effect (F(6, 171) = 2.366; p < 0.032). cVEMP amplitudes for affected MD ears were significantly lower overall (p < 0.001) and tended toward maximum amplitudes to 1 kHz stimuli.
Effect of tone-burst frequency on oVEMP and corrected cVEMP amplitudes. Mean ± 1 SE cVEMP (A) and oVEMP (B) reflex amplitudes for MD (affected and unaffected ears), VM and normal control ears. cVEMP amplitudes are corrected for baseline electromyographic activity.
Tone-burst frequency had a significant effect on oVEMP amplitudes (Figure 3B) for all groups (controls: χ2 = 19.831, p < 0.001; VM: χ2 = 18.171, p < 0.001; unaffected MD χ2 = 12.077, p = 0.007; affected MD χ2 = 10.452, p = 0.015). Both 500 Hz and 1 kHz were optimal stimulus frequencies for controls and VM ears, producing significantly higher amplitudes than 250 Hz and 2 kHz stimuli (p-value range = 0.001–0.016). These frequency comparisons also produced the largest differences in unaffected MD ears (p-value range = 0.016–0.058). In contrast, for affected MD ears only the 1 kHz stimulus produced significantly larger amplitudes when compared with 2 kHz (p = 0.016) and 250 Hz (p = 0.019) stimuli. An example ‘frequency-tuning shift’ for an affected MD ear is compared with a normal tuning response from a VM ear in Figure 4.
VEMP reflexes to AC tone bursts for a patient with VM (top set of traces) illustrates the most common pattern of tuning seen in both VM and normal controls: cVEMP amplitudes are larger at 500 Hz and oVEMP amplitudes are equally large at 500 Hz and 1 kHz. In a patient affected with MD (bottom set of traces), cVEMP and oVEMP tuning is shifted upward with maximum reflex amplitudes in response to a 1 kHz stimulus. cVEMP amplitudes are normalized to account for differences in sternocleidomastoid muscle activation for the two patients.
Reflex amplitude: the effect of tone-burst frequency on asymmetry ratios
Asymmetry ratios for controls, VM and MD are illustrated in Figure 5. Asymmetry ratios were consistently higher in MD compared to controls (p value range: 0.001–0.141) and VM (p value range: <0.001−0.024). There were no significant differences in asymmetry ratios between controls and VM (Mann-Whitney U: p value range: 0.194–0.640). The prevalence of reflex abnormalities in MD was higher for 500 Hz tone bursts (60%) than for clicks (30%) (McNemar test: p = 0.031). No other stimulus asymmetry ratio comparisons were significant.
Mean (+ 2 SE) asymmetry ratios for Controls, VM and MD across stimulus frequencies. Asymmetry ratios are higher for MD compared to Controls and VM.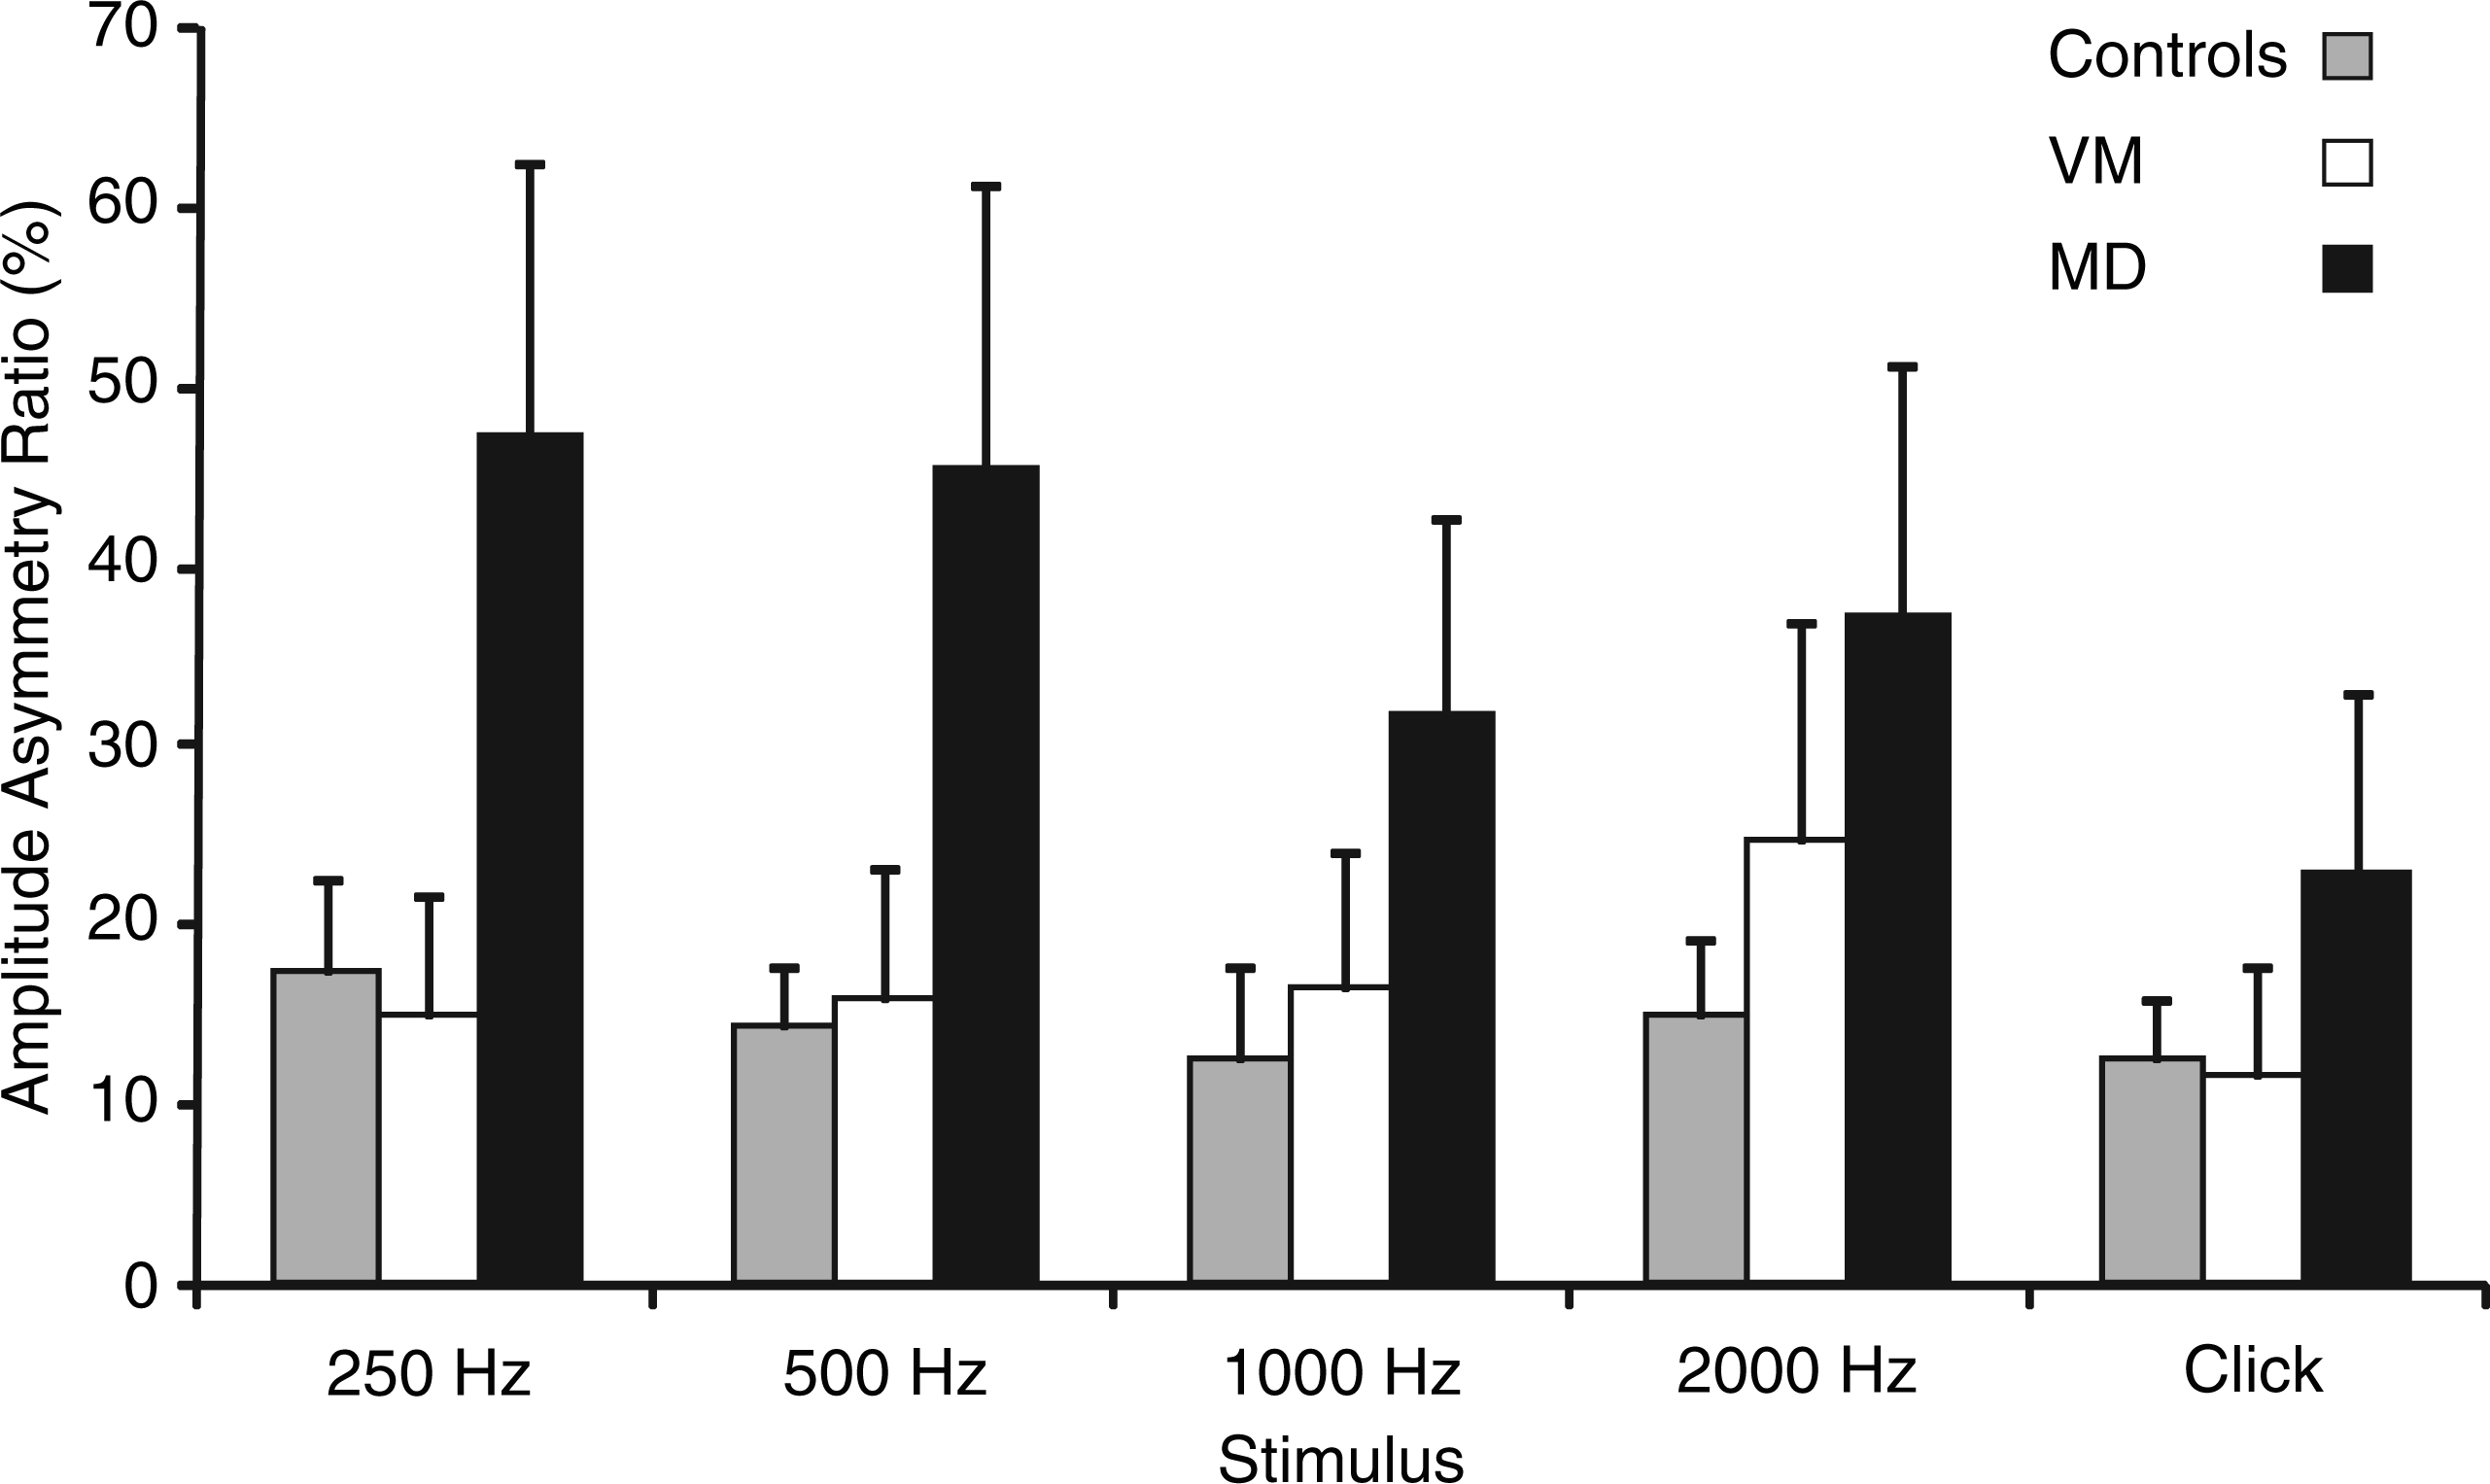
Because there were many missing values for oVEMP reflexes, especially at 250 Hz and 2000 Hz, we were unable to reliably examine and compare the oVEMP asymmetry ratio across frequency.
Reflex amplitude: frequency ratios in controls, VM and MD
For cVEMP FR comparisons between control, VM and affected MD ears, only the 0.5/1 kHz frequency ratio revealed significant differences (χ2 = 10.001, p = 0.007). The 0.5/1 kHz frequency ratio was not significantly different between controls and VM (p = 0.301) but was significantly higher in control ears than in affected MD ears (p = 0.018). When using the 0.5/1 kHz frequency ratio alone, 7/20 of affected MD ears were abnormally low (below mean – 2SD of –20.4%). The false positive rate was 2/20 (10.0%) for both control and VM patients and 1/20 (5%) for unaffected MD ears. Using an abnormally low 0.5/1 kHz frequency ratio and/or an elevated 0.5 kHz asymmetry ratio, MD was separated from VM with a sensitivity of 75.0% and specificity of 80.0%. Adding the caloric test improved the sensitivity to 90.0%, but reduced the specificity to 70.0%. The caloric test separated VM from MD with a sensitivity of 74.5%.
Reflex thresholds: The effect of tone-burst frequency
There were no significant group differences for threshold comparisons between unaffected MD, VM and control ears (F(2,57) = 1.389, p = 0.258). For these ears, the lowest thresholds were recorded in response to a 500 Hz stimulus (p value range:<0.001–0.006). When affected MD ears were compared with VM and control ears, there was a significant interaction effect (F(6,171) = 53.888, p = 0.045). Thresholds for affected MD ears were significantly higher overall (p < 0.001) and demonstrated altered frequency tuning, with a trend towards lower thresholds in response to 1 kHz stimuli.
The effect of tone-burst frequency on oVEMP thresholds could not be analysed owing to the limited range of responses.
Reflex thresholds: threshold differences in controls, VM and MD
On the basis of the analysis of paired frequency comparisons, the 500 Hz to 1 kHz threshold difference showed group differences of borderline significance (χ2 = 5.836, p = 0.054). The modal reflex threshold differences (500 Hz to 1 kHz) were −5 and+5 for control ears and affected MD ears, respectively, and 0 dB for VM and unaffected MD ears. Adopting a threshold difference criterion of ≥ +5 dB gave a sensitivity of 45.0%, but with a false positive rate of 40% and 25% for control and VM participants, respectively.
Discussion
The VEMP profiles of both clinically definite and probable VM were similar to those of normal controls. For both VM and controls, oVEMPs and cVEMPs were symmetrical and had similar amplitudes and latencies. The evoked potential profiles of MD and VM differed significantly in that MD was associated with a significantly higher prevalence of AC cVEMP, AC oVEMP and minitap cVEMP asymmetry, and showed altered frequency tuning. Abnormalities on the subjective visual horizontal and caloric testing were more prevalent in the MD group. These attributes are likely to help separate VM from MD.
A recent study by von Brevern et al. (31) found evidence of a peripheral vestibular deficit in only 3/20 VM patients studied. For most patients, their examination results were consistent with a central cause of vertigo. Our results, indicating a predominantly normal interictal VEMP and caloric profile in VM, are consistent with von Brevern’s (31) findings. However, our observations differ from those of Baier et al. (15), who studied an equally large group of participants (26 definite and 37 probable VM) using 400 Hz 7.5 ms AC tone bursts. Unlike us, this group recorded lower mean cVEMP amplitudes for VM than for controls. Whereas they found abnormalities in 68% of the entire VM group, only two participants in our group of 60 had abnormal AC cVEMPs. The prevalence of AC cVEMP abnormalities in their MD group was 69% in comparison with 40% in our MD group. However, we defined our normal range in terms of the mean ± 2 SD for the sample, whereas Baier et al. used the 95% confidence interval for the population mean (mean ± 2 SE). This narrower normal range may have resulted in a higher proportion of ‘abnormal’ results in their study than in ours. Their higher rate of abnormalities in MD may also be due to the different stimuli; our results indicate that low frequency tone bursts are more sensitive than clicks for detecting abnormalities in MD. However, this still does not explain the high prevalence of abnormalities in VM since our results suggest that tone-burst VEMP responses for VM are similar to those for normal controls. In contrast to Hong et al. (17), who observed lower rates of reflex detection in VM, we were able to elicit cVEMP responses to 500 Hz stimuli at maximum intensity in all control and VM participants, with the two groups demonstrating similar reflex thresholds. By ensuring a high level of sternocleidomastoid muscle activation (>100 µV) through pre-stimulus monitoring of sternocleidomastoid muscle activation, we were able to distinguish clearly between an abnormal response and a spurious result due to insufficient participant effort.
The distinction between MD and VM is made on the basis of clinical presentation and audiometry. In particular, the documentation of a unilateral hearing loss is required for a definitive diagnosis of MD. In the early stages of MD, hearing fluctuation is common (32) and unless the audiogram is performed serially at precisely the right time, thresholds may be recorded as normal. For some patients it can be several years from the onset of vertigo until a hearing loss even develops (33). When clinical and audiometric criteria are not fulfilled, characteristic abnormalities of vestibular function tests (e.g. canal paresis and VEMP asymmetry) may be helpful in separating MD from VM. The prevalence of vestibular asymmetry is also likely to be influenced by disease duration. Further studies that explore vestibular test parameters in VM and MD as a function of disease duration are needed to enable a more complete assessment of the likelihood of each disorder based on vestibular test profile.
For the present study, the higher prevalence of cVEMP asymmetry in MD when using 500 Hz tone bursts compared with clicks is likely to reflect the presence of endolymphatic hydrops and altered inner ear mechanics (34). The resonant frequency of a mechanically based biological system, including the inner ear, is dependent on components of mass and stiffness. Increased endolymphatic fluid volume can be expected to restrict membrane compliance (increased stiffness) and reduce sensitivity to low frequency stimulation. Consequently, the resonant frequency is likely to increase. Consistent with other studies (34,35), our cVEMP results indicate maximum sensitivity to 1 kHz in MD ears and 0.5 kHz in normal controls. We found the 0.5/1 kHz FR to be the most effective means of quantifying this tuning shift in MD ears. Like Murofushi et al. (18), we observed altered cVEMP tuning in a small proportion of VM patients when using a 0.5/1 kHz frequency ratio (n = 2/20). However, both these cases were distinguishable from MD in that the tuning shifts were bilateral, and there was no abnormal left-right asymmetry for VEMP or caloric tests.
As recently reported by Winters et al. (36), the present study confirms that frequency tuning of oVEMP amplitudes is also altered in MD. However, the low rate of oVEMP reflex detection in our study significantly limits its clinical utility. We used an intensity of 100 dB nHL because this was the maximum possible output for the 250 Hz stimulus. To increase reflex detection, the stimulus intensity could have been increased to 105 dB nHL for 500 Hz and 1 kHz stimuli. However, it would not then have been possible to compare amplitudes and thresholds across the full range of frequencies.
We conclude that VM is most commonly associated with a normal interictal VEMP profile and symmetrical caloric responses, indicating that peripheral vestibular function is usually preserved. This provides an important point of difference between VM and MD, which can present similarly in the early disease stages. MD, in contrast, has a comparatively high prevalence of unilateral AC VEMP abnormalities and is more likely to show altered VEMP tuning. On the basis of our findings, we recommend using the bithermal caloric, AC oVEMP and AC cVEMP to separate VM from MD. Sensitivity and specificity is optimal when a 500 Hz cVEMP amplitude asymmetry ratio (>29.2%) is used in combination with the 0.5/1 kHz amplitude frequency ratio (<−20.4%).
Footnotes
Acknowledgements
We acknowledge the technical assistance of Satendra Pratap, Leigh McGarvie and Michael Todd in design and maintenance of equipment used in this study.
Funding
This research was funded by the National Health and Medical Research Council (APP1010016). MSW is supported by the Garnett Passe and Rodney Williams Memorial Foundation.
Appendix 1. Reflex amplitudes and latencies for VM patients and normal controls
| AC cVEMP | AC oVEMP | Minitap cVEMP | Minitap oVEMP | Hammer cVEMP | Hammer oVEMP | |
|---|---|---|---|---|---|---|
|
|
||||||
| R (definite VM) | 11.8 (0.8) | 8.5 (0.4) | 12.2 (0.6) | 8.9 (0.3) | 12.2 (0.6) | 8.6 (0.4) |
| L (definite VM) | 11.6 (0.6) | 8.7 (0.4) | 12.3 (0.7) | 9.0 (0.4) | 11.9 (0.7) | 8.7 (0.5) |
| R (probable VM) | 11.5 (0.7) | 8.3 (0.4) | 12.3 (1.0) | 8.9 (0.4) | 12.1 (0.6) | 8.7 (0.6) |
| L (probable VM) | 11.4 (0.7) | 8.4 (0.4) | 12.2 (0.7) | 9.0 (0.4) | 11.8 (0.9) | 8.8 (0.6) |
| R (normal) | 11.6 (0.6) | 8.5 (0.4) | 12.8 (1.1) | 9.0 (0.5) | 12.3 (0.7) | 9.0 (0.5) |
| L (normal) | 11.5 (0.5) | 8.9 (0.9) | 12.5 (0.9) | 9.2 (0.6) | 12.1 (0.9) | 8.8 (0.8) |
|
|
||||||
| R (definite VM) | 2.0 (0.6) | 10.3 (5.9) | 2.3 (0.7) | 24.2 (11.2) | 3.1 (1.2) | 29.1 (15.4) |
| L (definite VM) | 1.9 (0.7) | 9.9 (5.4) | 2.0 (0.6) | 22.9 (11.7) | 2.9 (1.0) | 29.2(13.5) |
| R (probable VM) | 2.0 (0.6) | 11.5 (7.0) | 2.1 (0.8) | 20.8 (11.6) | 3.0 (0.9) | 27.5 (14.0) |
| L (probable VM) | 2.0 (0.6) | 12.1 (8.4) | 2.1 (0.7) | 23.8 (12.0) | 2.6 (1.0) | 29.8 (13.9) |
| R (normal) | 2.1 (0.5) | 10.7 (7.4) | 2.2 (0.8) | 22.5 (11.4) | 3.0 (1.0) | 29.1 (14.8) |
| L (normal) | 1.9 (0.6) | 8.9 (5.9) | 2.0 (0.6) | 20.1 (10.9) | 2.5(0.8) | 25.1 (13.1) |
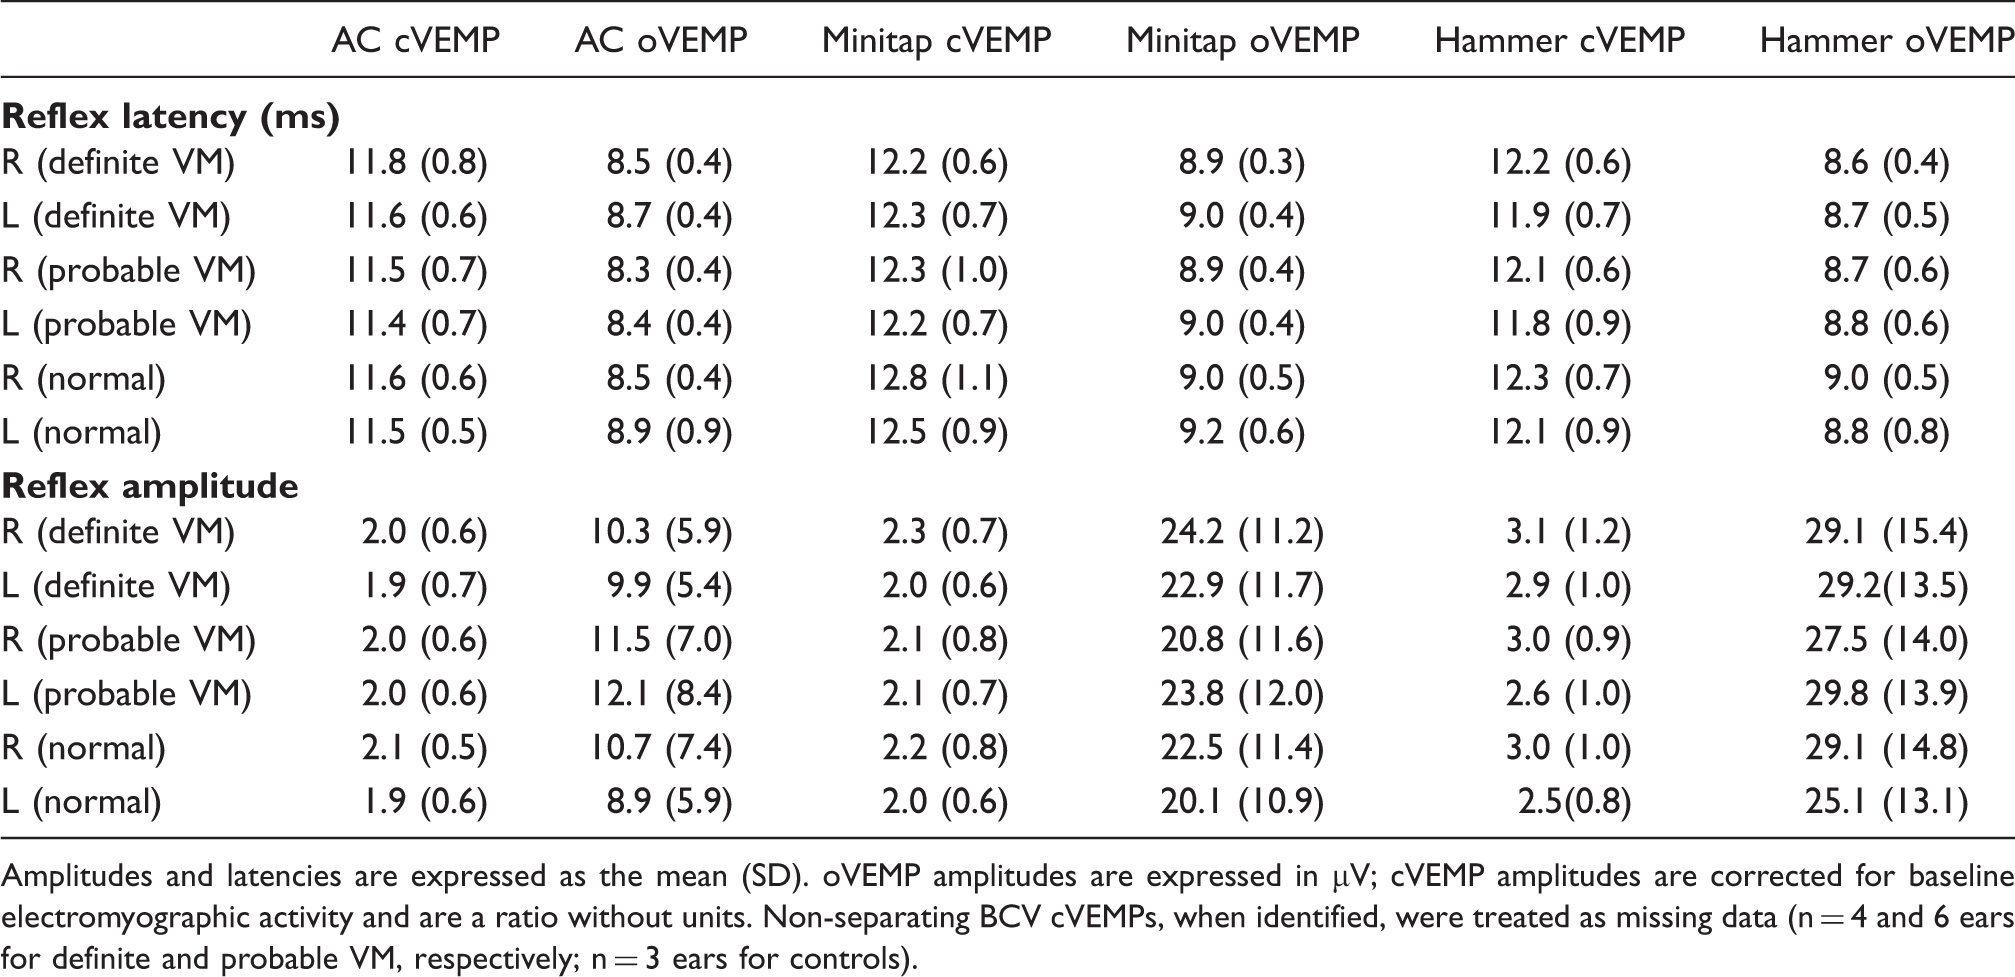
Amplitudes and latencies are expressed as the mean (SD). oVEMP amplitudes are expressed in μV; cVEMP amplitudes are corrected for baseline electromyographic activity and are a ratio without units. Non-separating BCV cVEMPs, when identified, were treated as missing data (n = 4 and 6 ears for definite and probable VM, respectively; n = 3 ears for controls).
Appendix 2. Prevalence of unilateral VEMP abnormalities for VM patients and normal controls
| Click | Minitap | Tendon hammer | |
|---|---|---|---|
| cVEMP definite | n = 2 (6.7%) | n = 0 (0.0%) | n = 1 (3.7%) |
| Probable | n = 0 (0.0%) | n = 2 (6.7%) | n = 0 (0.0%) |
| n = 1 (3.3%) | n = 2 (6.7%) | n = 1 (3.6%) | |
| Controls | |||
| oVEMP definite | n = 4 (13.8%) | n = 0 (0.0%) | n = 0 (0.0%) |
| Probable | n = 2 (6.9%) | n = 0 (0.0%) | n = 0 (0.0%) |
| Controls | n = 2 (6.9%) | n = 1 (3.3%) | n = 0 (0.0%) |
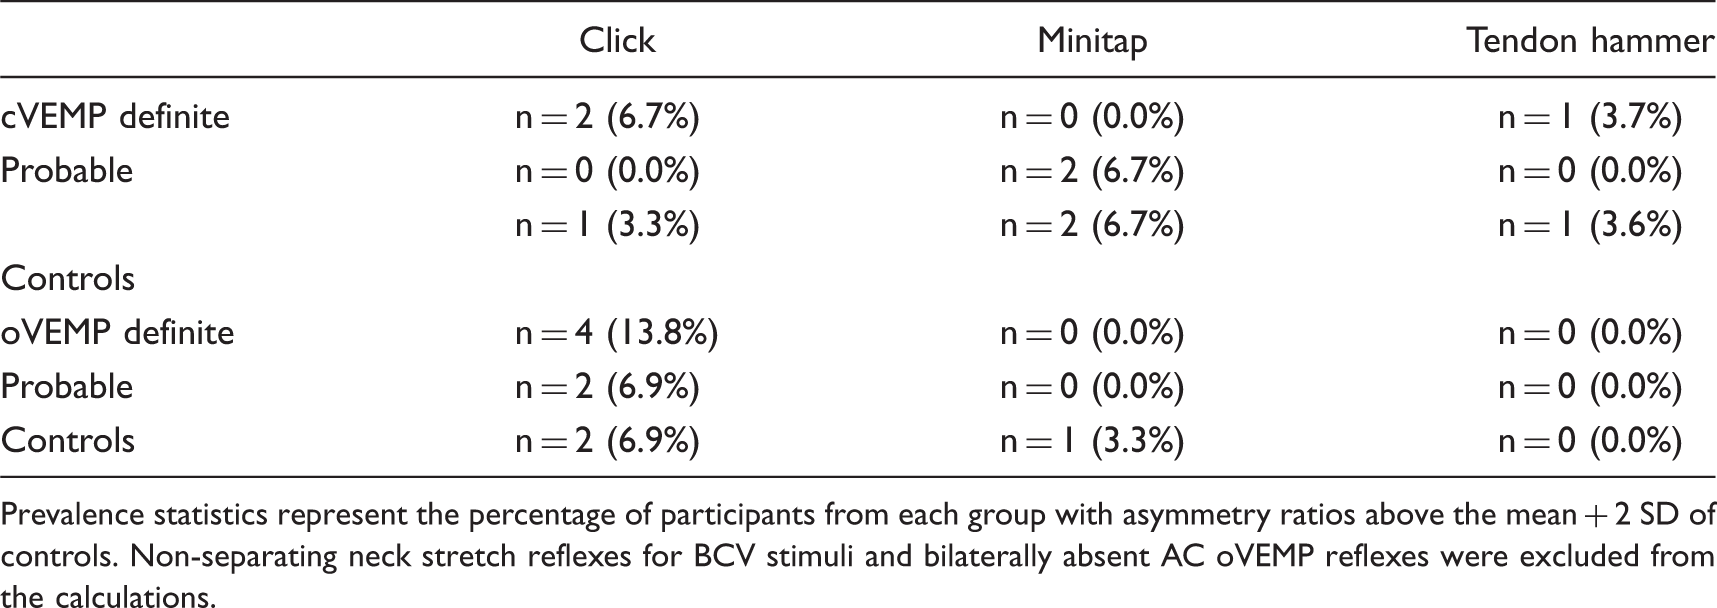
Prevalence statistics represent the percentage of participants from each group with asymmetry ratios above the mean + 2 SD of controls. Non-separating neck stretch reflexes for BCV stimuli and bilaterally absent AC oVEMP reflexes were excluded from the calculations.
Appendix 3. Summary of migraine characteristics,caloric and VEMP asymmetry ratios for 12 VM patients with significant asymmetry on at least one VEMP test
| N | IHS | Neuhauser criteria | Caloric | cVEMP click | oVEMP click | cVEMP minitap | oVEMP minitap | cVEMP hammer | oVEMP hammer |
|---|---|---|---|---|---|---|---|---|---|
| 1 | MA | Probable | 3.0 | 10.99 | 13.77 | 6.63 | 0.24 |
|
18.05 |
| 2 | MO | Definite | −10 | 2.5 | 22.0 | 16.6 | 16.1 |
|
27.9 |
| 3 | BM | Probable | 6.0 | 5.4 | 23.2 |
|
18.3 | 13.8 | 13.25 |
| 4 | MA | Definite |
|
2.15 |
|
6.13 | 12.77 | 19.39 | 10.50 |
| 5 | MA | Definite | DNT |
|
32.82 | 15.44 | 20.79 | 12.37 | 30.65 |
| 6 | MA | Definite | −5 | 20.1 |
|
11.4 | 23.5 | 1.8 | 10.6 |
| 7 | MO | Probable | 0 | 32.4 |
|
5.39 | 6.51 | 18.36 | 13.26 |
| 8 | MA | Definite | 3.0 | 5.26 |
|
6.62 | 8.57 | 15.43 | 16.34 |
| 9 | MO | Definite |
|
3.70 |
|
16.14 | 13.30 | 9.92 | 5.94 |
| 10 | MO | Probable |
|
21.27 |
|
1.47 | 4.70 | 3.07 | 4.93 |
| 11 | MO | Definite | 16 |
|
7.69 | 3.43 | 4.58 | 30.14 | 11.55 |
| 12 | MO | Probable | −10 | 0.84 | 28.13 |
|
11.797 | 9.83 | 22.05 |

MO: migraine without aura, MA: migraine with aura, BM: basilar type migraine. Abnormal results are in bold.
Appendix 4. Parameters of cVEMP and oVEMP reflexes for each tone-burst frequency
| Test frequency | Parameter | Controls | VM | MD affected | MD |
|---|---|---|---|---|---|
| unaffected | |||||
| cVEMP | |||||
| 250 Hz | Prevalence (%) | 100 | 100 | 75 | 95 |
| Reflex amplitude (SD) | 1.7 (1.1) | 1.6 (0.9) | 0.7 (0.6) | 1.6 (1.1) | |
| Mean (SD) AR | 17.5 (11.5) | 15.1 (14.6) | 47.3 (34.5) | - | |
| Abnormal AR (%) | 0 | 5 | 40 | - | |
| Threshold (dB nHL) | 89.5 | 89.8 | 97.3 | 90.8 | |
| 500 Hz | Prevalence (%) | 100 | 100 | 80 | 100 |
| Reflex amplitude (SD) | 1.9 (0.9) | 1.9 (0.9) | 0.8 (0.8) | 1.8 (0.9) | |
| Mean (SD) AR | 14.3 (7.4) | 15.9 (16.4) | 45.7 (35.1) | - | |
| Abnormal AR (%) | 5 | 10 | 60 | - | |
| Threshold (dB nHL) | 85.8 | 87 | 96 | 89 | |
| 1 kHz | Prevalence (%) | 100 | 100 | 95 | 100 |
| Reflex amplitude (SD | 1.7 (0.8) | 1.7 (0.7) | 0.9 (0.6) | 1.4 (0.9) | |
| Mean (SD) AR | 12.6 (11.5) | 16.5 (17.2) | 31.9 (24.6) | - | |
| Abnormal AR (%) | 0 | 15 | 40 | - | |
| Threshold (dB nHL) | 88 | 88.3 | 94.5 | 90.8 | |
| 2 kHz | Prevalence (%) | 100 | 95 | 75 | 90 |
| Reflex amplitude (SD) | 1.0 (0.7) | 0.9 (0.6) | 0.5 (0.4) | 0.7 (0.4) | |
| Mean (SD) AR | 14.9 (10.1) | 24.6 (27.5) | 37.4 (31.9) | - | |
| Abnormal AR (%) | 5 | 15 | 30 | - | |
| Threshold (dB nHL) | 95 | 96 | 99 | 98 | |
| oVEMP | |||||
| 250 Hz | Prevalence (%) | 40 | 65 | 35 | 35 |
| Reflex amplitude (μV) | 2.1 | 2.8 | 1.9 | 2.8 | |
| Threshold (dB nHL) | 101.8 | 101 | 102.8 | 101.5 | |
| 500 Hz | Prevalence (%) | 70 | 80 | 45 | 70 |
| Reflex amplitude (μV) | 5 | 5.3 | 3 | 5.8 | |
| Threshold (dB nHL) | 98.5 | 98.5 | 101.5 | 99 | |
| 1 kHz | Prevalence (%) | 75 | 85 | 70 | 70 |
| Reflex amplitude (μV) | 5.2 | 5.7 | 4.2 | 5.2 | |
| Threshold (dB nHL) | 98.3 | 97.8 | 100.3 | 99.8 | |
| 2 kHz | Prevalence (%) | 40 | 50 | 30 | 40 |
| Reflex amplitude (μV) | 2.4 | 2.5 | 2.6 | 2.7 | |
| Threshold (dB nHL) | 102.5 | 101.8 | 102.8 | 101.8 | |
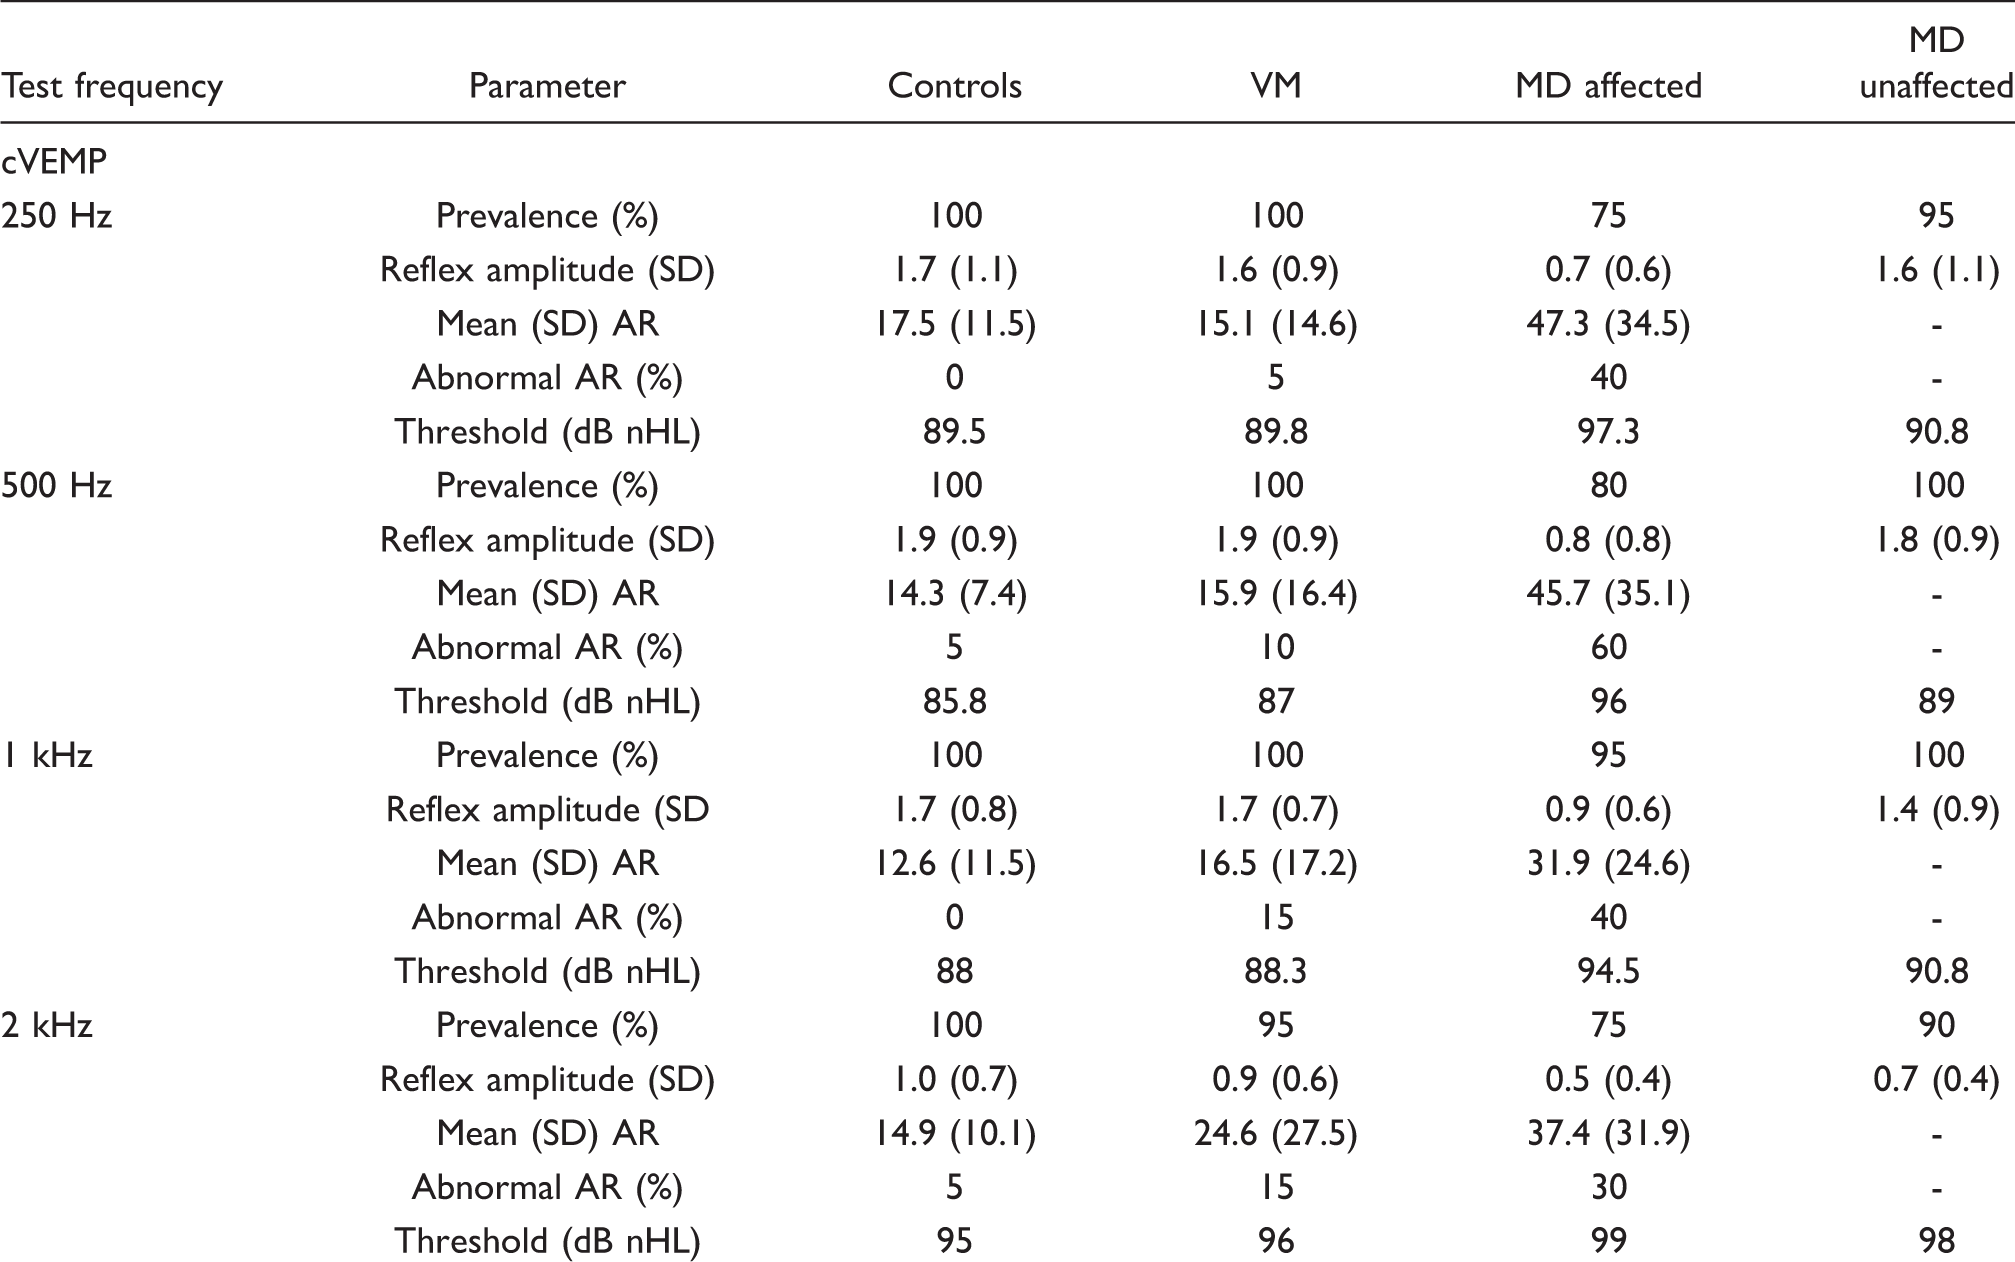
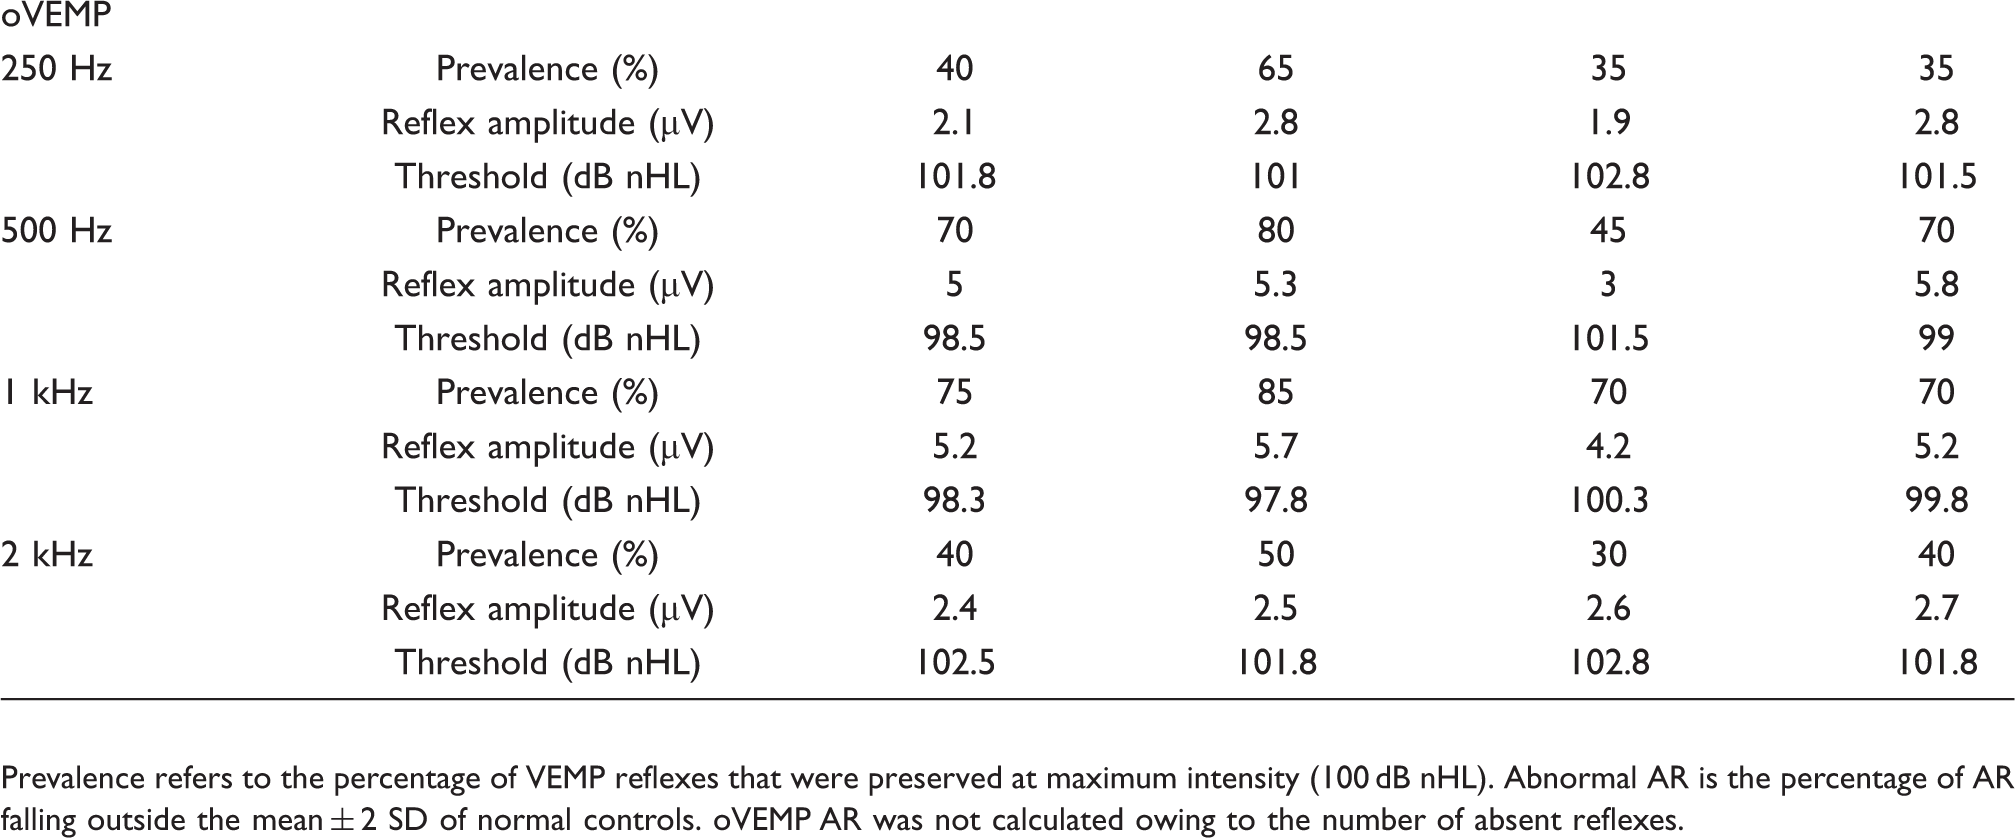
Prevalence refers to the percentage of VEMP reflexes that were preserved at maximum intensity (100 dB nHL). Abnormal AR is the percentage of AR falling outside the mean ± 2 SD of normal controls. oVEMP AR was not calculated owing to the number of absent reflexes.