
Abstract
Background:
Mechanical behavior is difficult to monitor in experimental environments, usually because of geometric or technology implementation limitations. Nevertheless, thermography has been shown to overcome these issues.
Objectives:
The aim of this study was to evaluate four types of assemblies between a Jaipur foot and a polyethylene tube using infrared thermography in order to find the best mechanical configuration in terms of thermal behavior.
Study Design:
Mechanical testing.
Technique:
An infrared camera captured short videos every 5 min over 10 h in six different positions (three in the back and three in front of the Jaipur foot) around a prosthesis subjected to repetitive stresses (axial force 980 N) simulating kinematic variables like joint angles. We established a region of interest around the foot–ankle assemblies and calculated maximum temperatures and thermographic indices.
Results:
In this study, the best foot–ankle assembly used epoxy adhesive because it presented the lowest temperature in the six positions and the lowest thermal index.
Conclusions:
Thermographic techniques can be used to study mechanical behaviors in complex experimental situations.
Background
Research has been recently conducted to develop and implement better low-cost prostheses by improving their design and manufacturability as well as extending their life span.1,2 However, to optimize the design of the Jaipur foot, a low-cost prosthesis, we need a better understanding of how and where damage to the prosthesis occurs. 2 Furthermore, different types of foot–ankle assemblies in Jaipur feet should be studied as recent analyses have shown that 10.1% of such prosthesis exhibit damage in that particular area after use. 2
In this study, we tested a Jaipur foot attached to a High-Density Polyethylene (HDPE) tube to examine four configurations of the foot–ankle assembly: Two Opposite Screws (TOS), Four Equidistant Screws (FES), Single Self-drilling Bolt (SSB), and Epoxy Adhesive (EAD) (Figure 1). Comparing the mechanical performance of these configurations is difficult due to the complex geometries.3,4
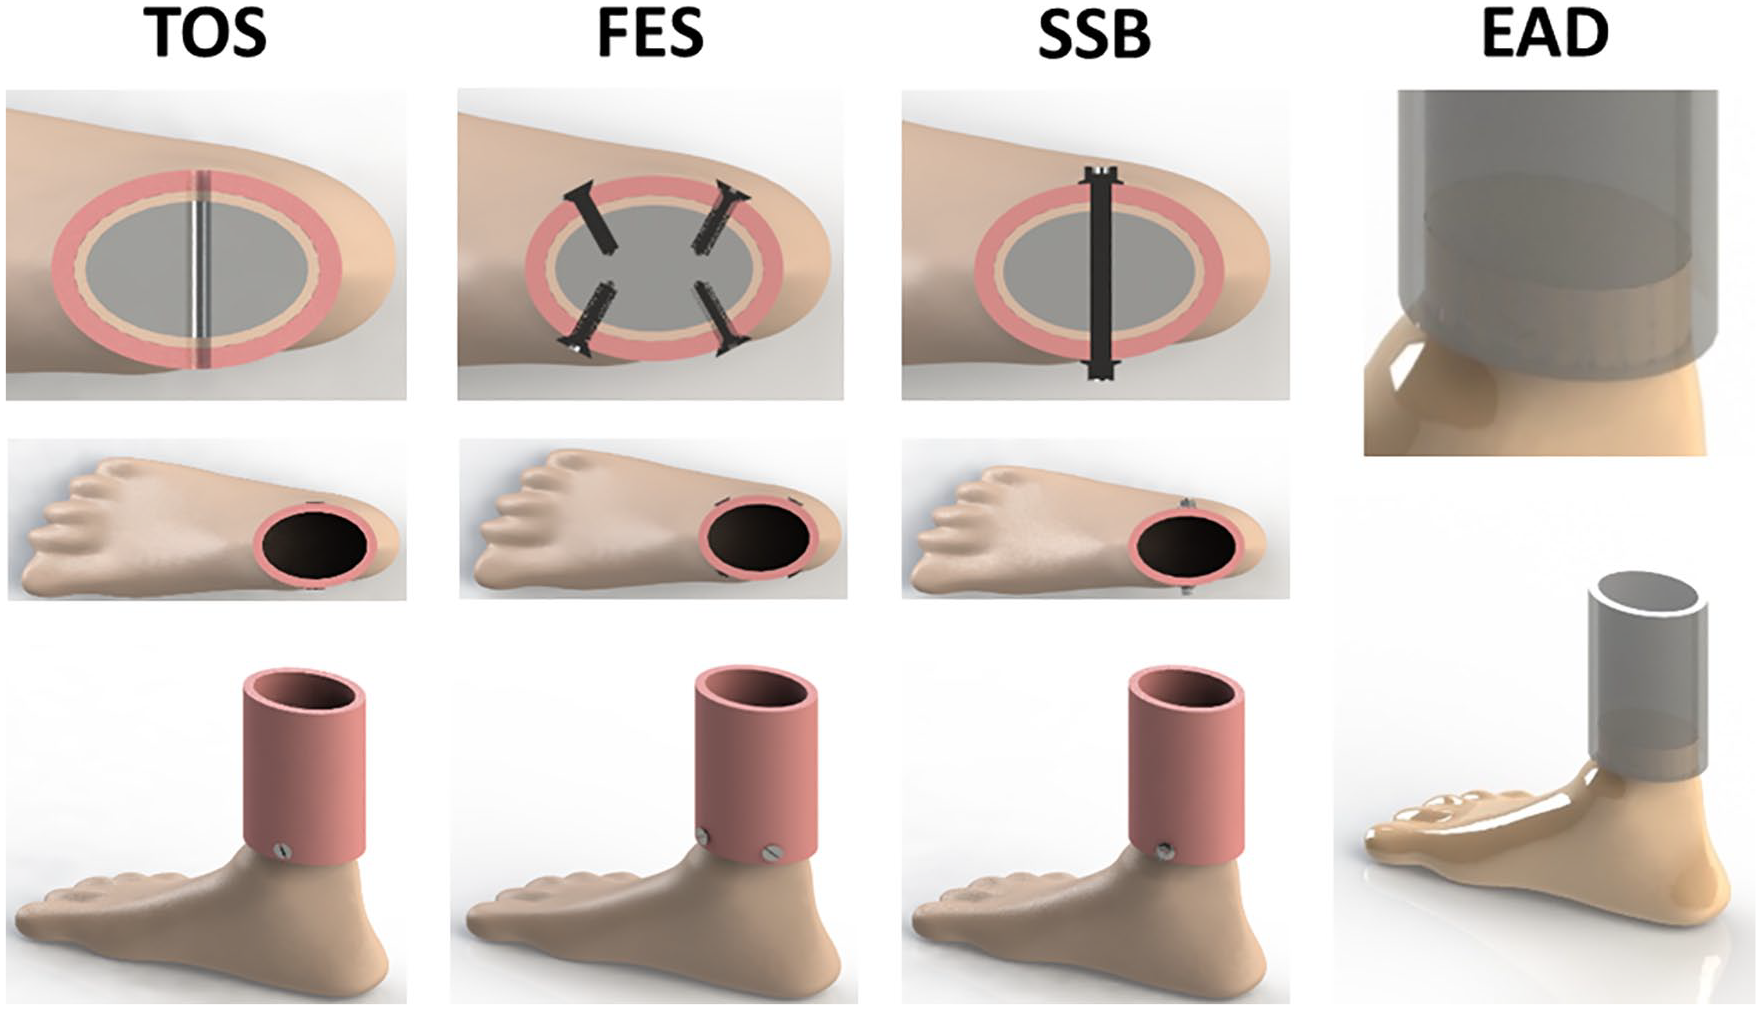
Foot–ankle assemblies.
Infrared thermography (IRT) can be used as an experimental tool to accurately measure the surface temperature of a body/object in real time, in a non-invasive way, and with good spatial resolution. 5 Thanks to high-sensitivity, infrared instruments that can detect temperature changes and thermal radiation very precisely. This is especially suitable for applications involving whole components or small test samples because the consistency of the thermal data is improved compared with other techniques. 6 Specifically, in the field of mechanics, it is an excellent technique for monitoring the evolution of the surface temperature during mechanical deformations, and it provides early warnings of failure areas during tensile loading.7–9
Therefore, the purpose of this study was to qualitatively evaluate the mechanical behavior of different foot–ankle assemblies in the low-cost prosthesis mentioned above, using infrared thermography as an experimental technique, in order to find the best assembly.
Technique
We used a thermal camera to record, for 10 consecutive hours, four foot–ankle assemblies, that is, TOS, FES, SSB, and EAD (Figure 1), undergoing mechanical stresses that simulated human gait.
The stance phase of the walking cycle was simulated by a prototype device that used a pneumatic actuator controlled by a solenoid valve applying 980 N of force to the prosthesis. The latter was placed on a tilting platform with a cadence of 90 steps/min, reproducing ankle kinematics in the sagittal plane with an amplitude from 10° plantar flexion to 20° dorsiflexion (Figure 2). An FLIR A655SC thermal camera (FLIR Systems Inc., Portland, OR, USA) was used to record temperature changes in the long wavelengths of the infrared band, from 7.5 to 14 μm, with a spatial resolution of 640 × 480 pixels, an accuracy of ±2°C, a noise-equivalent temperature difference (NETD) under 30 mK, and an FOL25 lens. The camera was turned on and left unoperated for 15 minutes then, we configured the emissivity (0.97), reflected temperature (22.9°C), and object distance (0.84 m). The measurements were obtained in a laboratory with controlled atmospheric temperature (22°C) and relative humidity (42%). To have a better view and not interfere with the gait device, a single camera was placed manually in six different positions: three in front of and three behind the Jaipur foot, 45° and 40° apart, respectively.
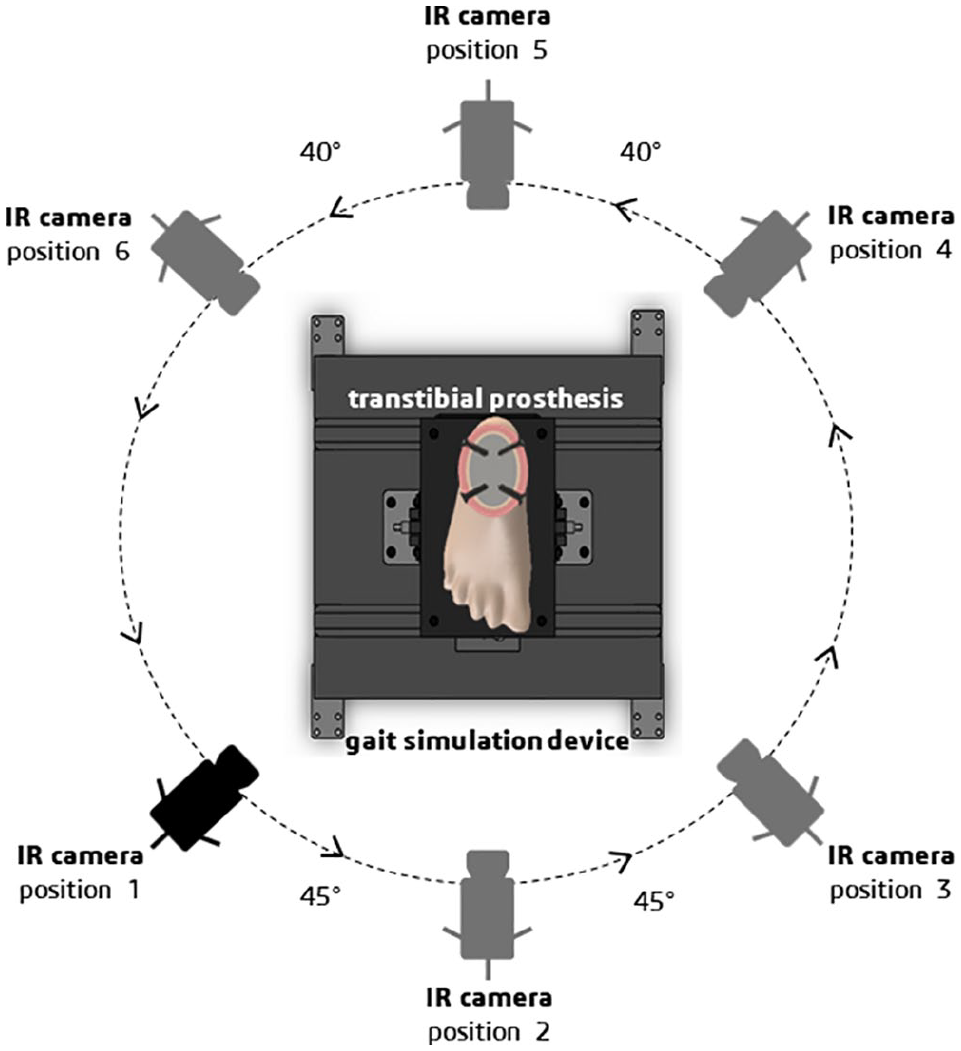
IRT camera positions around the prosthesis. Top view. 3
For 10 h, a series of 15 s videos were recorded in each position with a 5 min interval every hour. FLIR R&D 3.3 software was used to analyze the videos, and the same oval region of interest (ROI) that contained the assembly was used to calculate the maximum temperature every hour.
The thermographic index was calculated using the expression
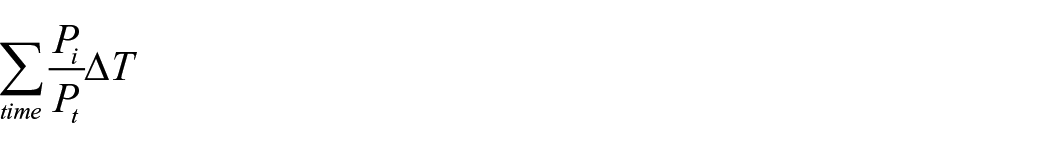
where Pi is the number of pixels in the isothermal region, Pt is the number of pixels in the whole thermogram; and ∆T is the Tmaximum − Tinitial in each experiment. The thermographic index reflects isothermal region variation ratio at a temperature range. This index was used to compare temperature changes over the ROI in each of the four assemblies.
Results
Figure 3 shows the maximum temperature of the ROIs for the different assemblies from each camera position during the 10 h test. All the assemblies exhibited a similar logarithmic behavior. The most important temperature change occurred during the first hour of the test; then, after the fourth hour, the temperature became stable.
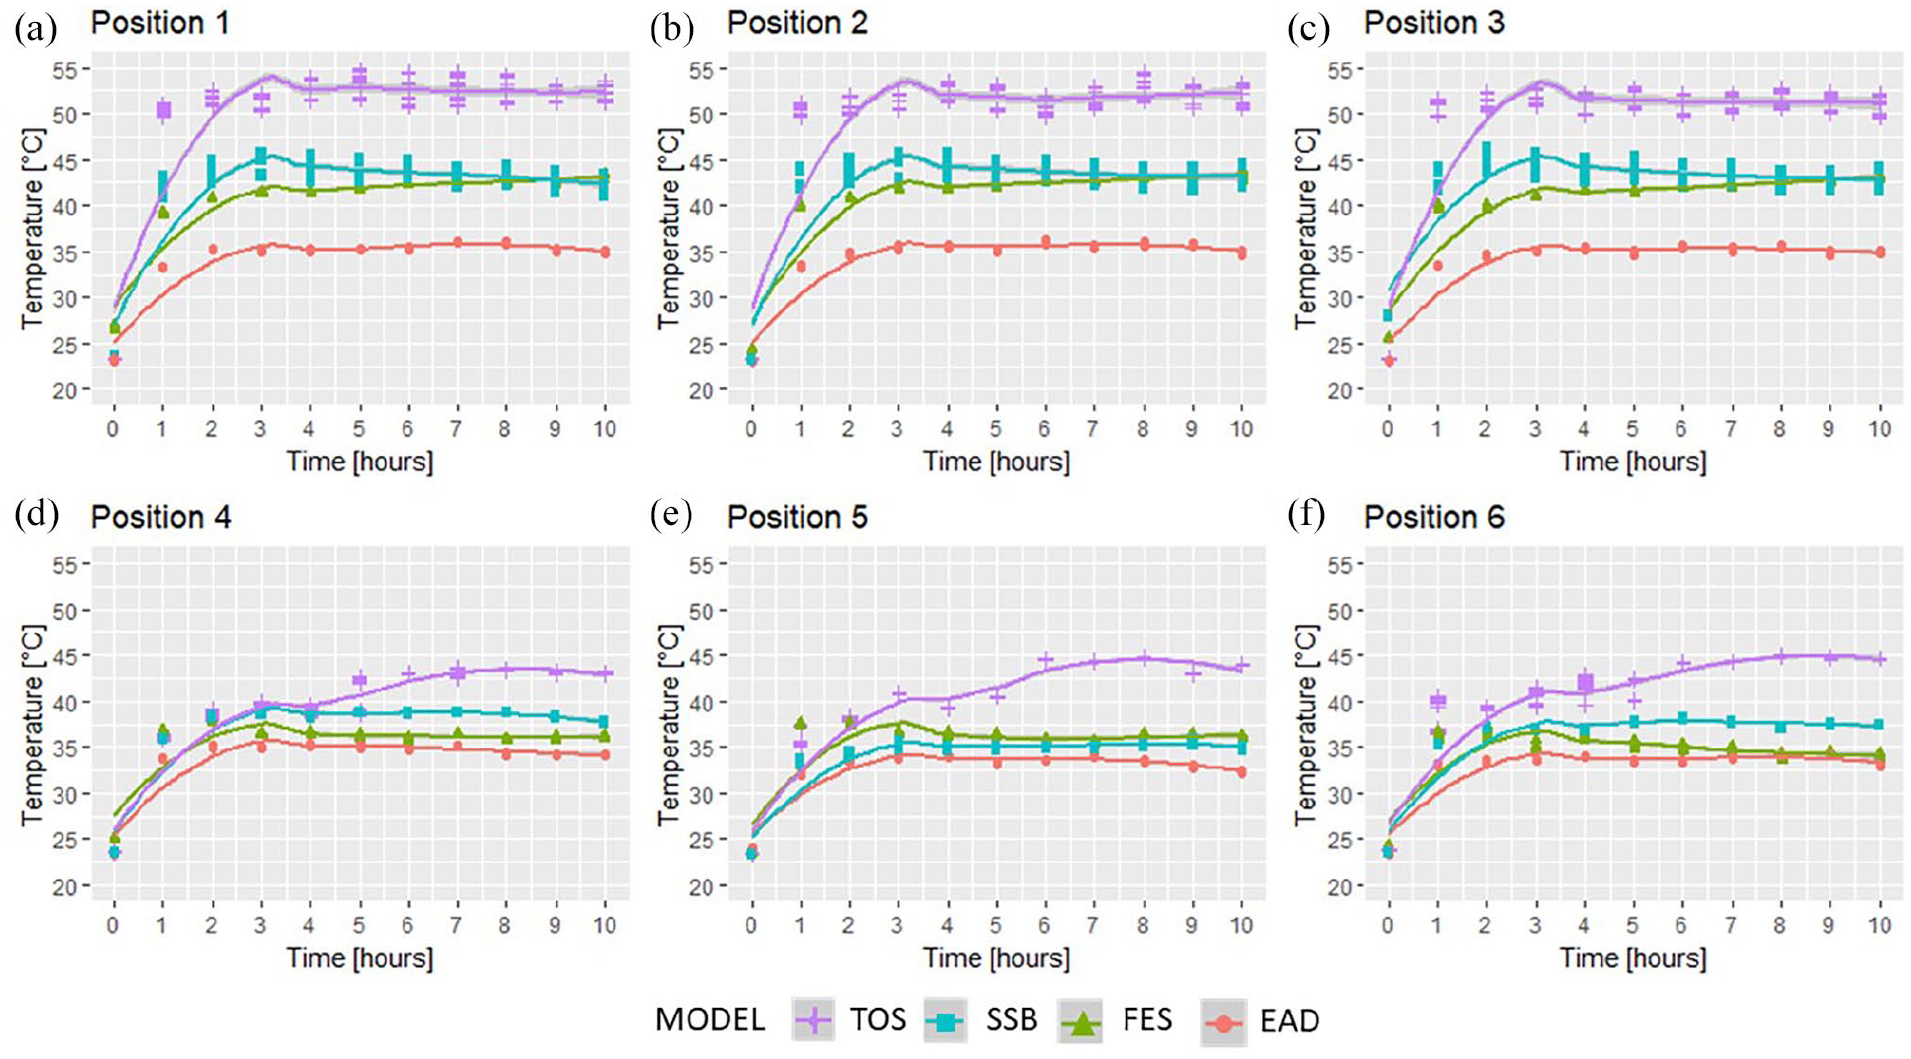
Temperature of the assemblies from the six positions during the 10-h test: (a–f) Positions 1–6.
The temperatures in the front of the foot (positions 1, 2, and 3) were slightly higher and more scattered than the recordings from when the camera was positioned in the back of the foot (positions 3, 4, and 5). TOS presented the highest temperature, while EAD showed the smallest increase from all camera positions. In turn, SSB exhibited a slightly higher temperature than FES from all camera positions except position 5.
In the thermograms, the configurations that included screws (FES or TOS) or bolts (SSB) showed maximum temperatures around those elements in addition to regions in which the temperature was constant, the isothermal region, both on the HDPE tube and the rubber of the Jaipur Foot. Conversely, in the adhesive assembly (EAD), only the rubber presented maximum temperatures (see Figure 4).
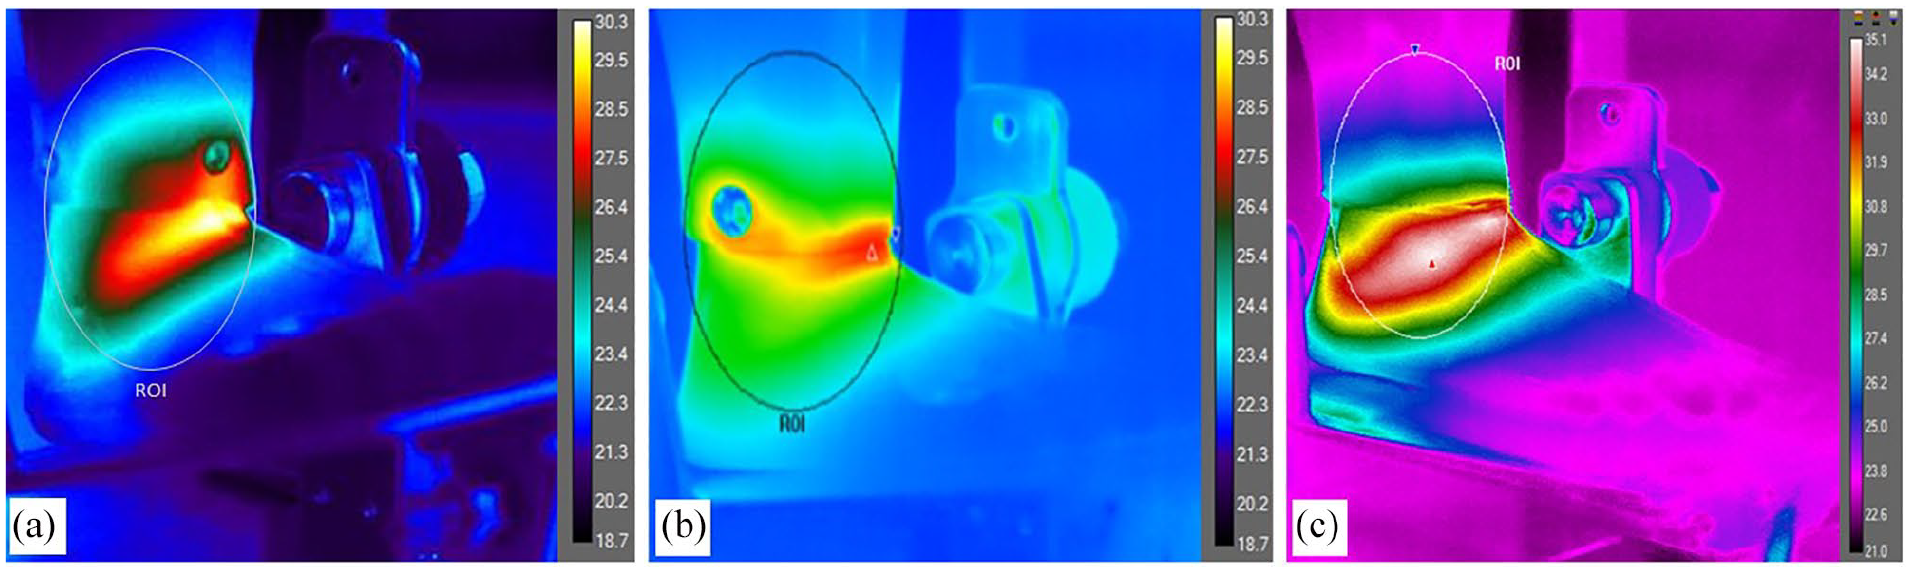
Example of isothermal areas of (a) FES, (b) SSB, and (c) EAD assemblies.
The thermographic indices of the assemblies in Table 1 show that EAD produced the lowest value and TOS the highest.
Thermographic indices of the foot–ankle assemblies.
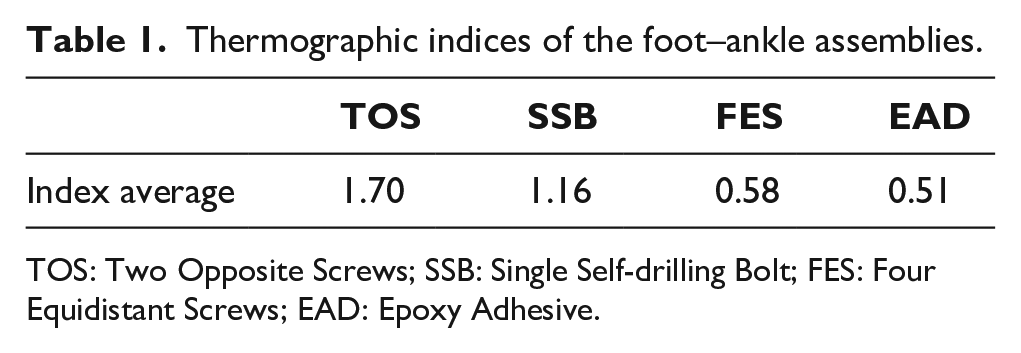
TOS: Two Opposite Screws; SSB: Single Self-drilling Bolt; FES: Four Equidistant Screws; EAD: Epoxy Adhesive.
We observed physical changes in both the front and back areas of the TOS configuration 3 h into the test. Likewise, two of the screws in the FES configuration failed (one in the front and one in the back). The two other assemblies did not exhibit physical changes after the test (see Figure 5).
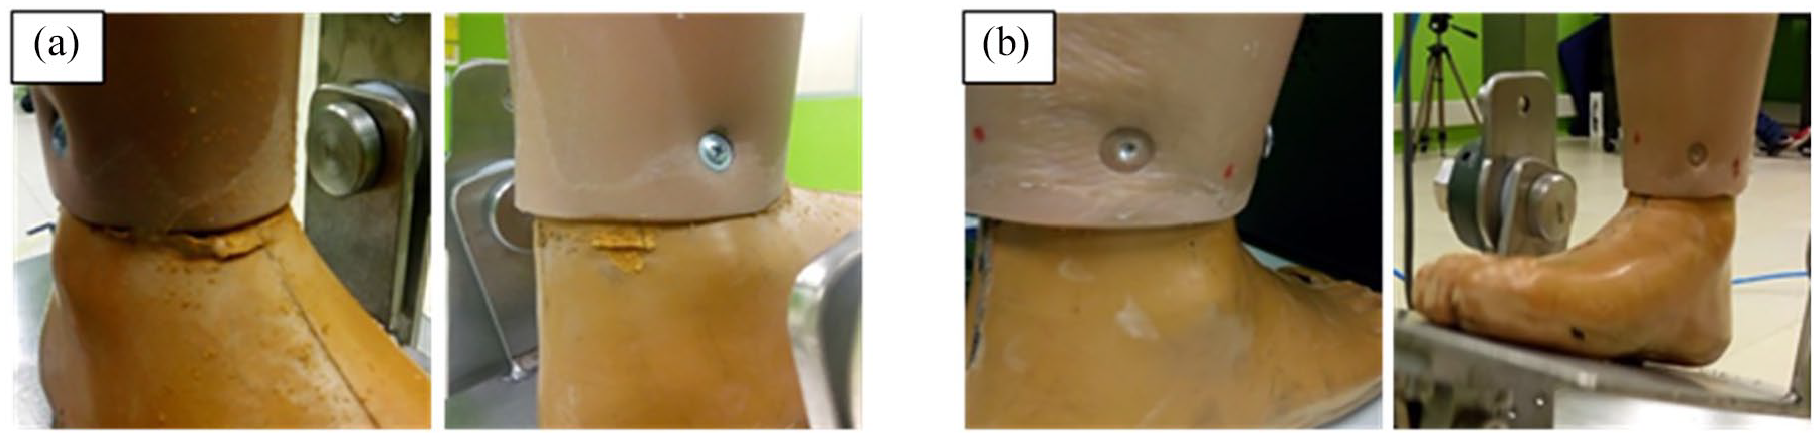
Physical damage in two assemblies: (a) TOS, rubber surface wear and (b) FES, screw failure.
Discussion
The logarithmic behavior of the temperature over time was caused by the thermoelastic effect of the materials in the prosthesis subjected to a cyclic loading that simulated human gait. Initially, the materials were deformed and their temperature increased, but the latter became stable when the internal structure of the material was re- arranged.6,10–12 Under cyclic loading, the stabilized temperature changes because the thermoelastic coupling equals zero. 13 After some cycles, the temperature variations become progressively periodic and symmetric with respect to the time axis. 14
The higher temperatures in the front positions may be due to the fact that the dorsiflexion was more restricted than the plantar flexion because the prosthesis model was rigid and did not have a joint that simulated the movement of the ankle. Since temperature measurements provide information about the internal energy of an object, the assemblies that imposed less restrictions to movement contributed to an increase in the kinetic energy of the material and, therefore, higher temperatures. 8 The maximum temperatures of the assemblies depended on their individual levels of movement restriction. TOS presented the least restriction and, therefore, more wear due to the movement, as well as temperature increase of up to 22°C. EAD did not impose a physical barrier as that of the screws or bolt, but it presented a more restricted movement due to the adhesive used around the whole perimeter, resulting in less torque. Therefore, EAD restricted movement made the temperature of its ROI increase less (12°C). The same occurs when analyzing just the size of the isothermal region, where EAD showed the lowest number of pixels compared to the other configurations. The thermograms showed an isothermal region of maximum temperature around the bolt and the screws on the Jaipur foot and the HDPE tube. This pattern was caused by the fact that the metal parts act as heat sinks, changing the temperature distribution over that region of the assembly. 15 A similar situation was observed when comparing the size of the almost equal isothermal region for TOS and SSB, when a higher thermographic index for TOS was observed. This showed more heat dissipation in SSB due to the bolt size compared with the screws.
High thermographic indices in an ROI are associated with significant temperature increases. Hence, when the mechanical behavior of a prosthesis is evaluated using thermography, low indices are desirable because a high index would indicate that the region is undergoing greater mechanical stress.
The physical changes reported in this study are due to temperature increases that are caused by more collisions between molecules. Such collisions break the polymer chains and produce a visible rupture of the material. In materials subjected to elastic cycles, dislocations oscillate slightly, even at low cyclic stress amplitudes. Cycle after cycle, dislocations gradually accumulate to create persistent slip bands, which are microscopic zones where plasticity develops. This microplasticity development finally leads to microcracks followed by rupture. 14
Infrared thermography offers an innovative solution for non-destructive testing because it is a contactless, real-time, full-field measurement technique. However, it only provides information about the surface thermal radiation, hindering the thermal study of internal structural changes. The experiment described in this article could be complemented with calculations of the relationship between temperature change and deformation with larger sample size and different kinds of transtibial prosthesis to capture the non-uniformity of Jaipur foot samples.
Conclusion
Our experimental thermography showed that the screw-based assemblies presented the highest temperature and thermographic indices, also suffered more stress. Therefore, the epoxy adhesive assembly was the most adequate option to attach an HDPE tube to a Jaipur foot.
Footnotes
Acknowledgements
The authors would like to thank the Biomechanics and Rehabilitation Laboratory at the Metropolitan Institute of Technology in Medellín for providing the infrastructure and the assistant staff to conduct this study. We also thank the organization Bhagwan Mahaveer Viklang Sahayata Samiti (BMVSS) for making their Jaipur Limb technology available.
Author Contributions
The author(s) disclosed the following roles as contributors to this article: Natali Olaya Mira and Carolina Viloria Barragan were responsible for Writing—Reviewing and Editing, Project Administration, Funding Acquisition, Conceptualization, Supervision, Methodology, Software, Writing—Original draft preparation, Validation, Formal Analysis, Investigation, Resources, Data curation, Visualization. Jesus Alberto Plata Contreras was responsible for Clinical Implications and Samples Preparation.
Declaration of Conflicting Interests
The author(s) disclosed no potential conflicts of interest with respect to the research, authorship, and/or publication of this article.
Funding
The author(s) disclosed receipt of the following financial support for the research, authorship, and/or publication of this article: This work was part of project P17204, funded by Instituto Tecnológico Metropolitano through its 2016 internal call for proposals.