
Abstract
Background:
Assessments of human movement are clinically important. However, accurate measurements are often unavailable due to the need for expensive equipment or intensive processing. For orthotists and therapists, shank-to-vertical angle is one critical measure used to assess gait and guide prescriptions. Smartphone-based sensors may provide a widely available platform to expand access to this measurement.
Objectives:
Assess accuracy and repeatability of smartphone-based measurement of shank-to-vertical angle compared to marker-based 3D motion analysis.
Study design:
Repeated-measures.
Methods:
Four licensed clinicians (two physical therapists and two orthotists) measured shank-to-vertical angle during gait with a smartphone attached to the anterior or lateral shank surface of unimpaired adults. We compared the shank-to-vertical angle calculated from the smartphone’s inertial measurement unit to marker-based measurements. Each clinician completed three sessions/day on two days with each participant to assess repeatability.
Results:
Average absolute differences in shank-to-vertical angle measured with a smartphone versus marker-based 3D motion analysis during gait were 0.67 ± 0.25° and 4.89 ± 0.72°, with anterior or lateral smartphone positions, respectively. The inter- and intra-day repeatability of shank-to-vertical angle were within 2° for both smartphone positions.
Conclusions:
Smartphone sensors can be used to measure shank-to-vertical angle with high accuracy and repeatability during unimpaired gait, providing a widely available tool for quantitative gait assessments.
Clinical relevance
Smartphone sensors demonstrated high accuracy and repeatability for monitoring shank-to-vertical angle during gait. Measurement of shank-to-vertical angle from the front of the shank was more accurate than the side of the shank. Smartphones may expand access to quantitative assessments of gait.
Keywords
Background
Clinical gait analysis is a standard of practice used to assess movement, guide treatment decisions, and evaluate outcomes.1–3 However, quantitative gait analysis remains expensive, requiring equipment, trained personnel, and intensive processing, which limits its use largely to surgical procedures and large hospitals.3,4 Quantitative gait analysis has been used in other clinical specialties, such as orthotic and prosthetic prescription, but its required resources reduce feasibility for common use. 2 Widely available sensor technology, such as the accelerometers or gyroscopes embedded in smartphones, provide a potential platform to support quantitative gait analysis. However, the accuracy and repeatability of smartphone-based sensors for gait analysis remains unknown.
One particular measure of clinical interest is the shank-to-vertical angle (SVA), defined as the orientation of the lower leg with respect to vertical in the global sagittal plane. 5 For orthotists and prosthetists, SVA is a metric used for device prescription.5–10 While marker-based 3D motion analysis remains the gold standard for assessing human movement, 3 the technology and personnel required is generally not available in the clinic. Instead, measures like SVA can be used to prescribe devices and guide treatment decisions. Segmental kinematics, in particular shank position at temporal midstance, can facilitate proper ground reaction force alignment relative to knee and hip joint rotation centers, leading to improved stability, spatiotemporal parameters of gait, and self-reported function. 5 Consequently, multiple groups have created prescription recommendations for ankle-foot-orthoses (AFO) using SVA.7,11,12
When instrumented gait analysis is unavailable, goniometers or video are the current tools commonly used to measure SVA in the clinic. Goniometry is widely available, but isolated to static measurements. Goniometers can only detect significant differences in body orientation greater than five degrees,13,14 which often does not provide the resolution needed for comparing different orthoses or conditions. Sagittal-plane video can also be used to calculate SVA by employing custom-software (e.g. PnO Data Solutions or Coach’s Eye) to select specific video frames and manually draw lines to calculate the angle between the shank and vertical. This process is laborious and the accuracy of the process remains unknown.15,16 These restrictions have limited the ability of clinicians to accurately measure SVA.
Over 80% of the adult population in the United States owns a smartphone. 17 Smartphones provide clinicians with a suite of sensors to monitor human movement using technology that is already familiar to clinicians and available in the clinic.18–20 Most cellphones have a built-in inertial measurement unit (e.g. inertial measurement unit (IMU): accelerometer, gyroscope, and magnetometer) that can be used for motion analysis. Systems that use standalone IMUs (i.e. not embedded in a smartphone) have been created and commercialized for gait analysis.21,22 While these systems can provide relatively good accuracy in assessing gait compared to marker-based 3D motion analysis,23–25 these systems still require extra equipment and post-processing. Smartphone-based IMUs have shown promise for a wide variety of applications from monitoring activity level to fall detection.26–29 For clinical evaluations of kinematics, systems using a smartphone’s IMU have been developed to evaluate range of motion, exercise form, or posture, with reported accuracy within 2°–3° compared to instrumented systems.30–38 At the ankle, apps to monitor ankle tilt during static standing or lunges have been developed and reported accuracy within one degree compared to a digital inclinometer.39,40 These results make smartphones a promising platform for quick and accessible evaluation of SVA during gait in the clinic.
The goal of the present study was to evaluate whether smartphone sensors can be used to accurately and repeatedly measure SVA. We assessed the accuracy and repeatability of four licensed rehabilitation clinicians measuring SVA during gait with a smartphone, attached to either the anterior or lateral surface of the shank. These measures will provide a baseline for detecting changes in SVA during gait for orthotic tuning, prosthetic alignment, or rehabilitation.
Methods
Experimental protocol
To align with clinical standards, we followed the protocol of Schwartz et al. 41 used to establish the repeatability of traditional marker-based 3D motion analysis during unimpaired gait. This protocol systematically evaluates the repeatability of kinematic measurements between clinicians, trials, and days. Establishing the repeatability of a measurement during unimpaired gait provides a necessary foundation before extending a technique to a specific clinical population (e.g. stroke or cerebral palsy) or application (e.g. orthotic tuning). Prior research has demonstrated that the repeatability of sagittal-plane kinematics during unimpaired gait measured with marker-based 3D gait analysis can be less than 2°–3° between days, providing a threshold for evaluating changes in gait over time or after treatment.41–43 This protocol has subsequently been adopted to evaluate new marker sets, develop multi-segment foot models, quantify upper-extremity movement, and compare results between clinical laboratories.44–50 Using this protocol also lets us evaluate the accuracy of smartphone measurements compared to traditional marker-based gait analysis.
Following this established protocol, we recruited four experienced and licensed rehabilitation clinicians (two physical therapists and two orthotists, 1M/3 F with 23–43 years of experience) and assessed their ability to measure SVA with a smartphone. Each clinician repeatedly measured SVA with smartphones on two unimpaired adult participants (1M/1 F, age: 27 and 26 years). All tests were conducted with two smartphones for this research, including the two most common operating systems (Android: Google Pixel 2 and iOS: iPhone 7). We compared measurements between clinicians, and between and within days for each clinician. All clinicians and participants were informed about the study procedures and provided written consent. This study was approved in accordance with the procedures of the Human Subject Division at the University of Washington.
Clinicians were asked to position the smartphone on anterior and lateral sides of the shank, without reference to prior placements to assess the clinician’s ability to repeatedly position the smartphone across sessions. Two different smartphone positions were assessed, corresponding to the two common methods for measuring SVA (Figure 1(a)): (1) the phone was positioned on the lateral side of the shank and the clinician was instructed to align the long-axis of the phone between the lateral epicondyle (LE) and lateral malleolus (LM) and (2) the phone was positioned on the anterior side of the shank with the long-axis aligned between the tibial tuberosity (TT) and talus. A running armband (SUPCASE, Alpharetta, GA) was used for positioning the phone. These bands were selected as they provided an off-the-shelf attachment to the shank that lets the clinician fine-tune the vertical orientation of the phone. Proximal or distal positioning of the smartphone was not specified, but we found that clinicians placed the smartphone closer to the knee (e.g. Figure 1(a)), similar to where goniometer-based measurements for SVA are made.
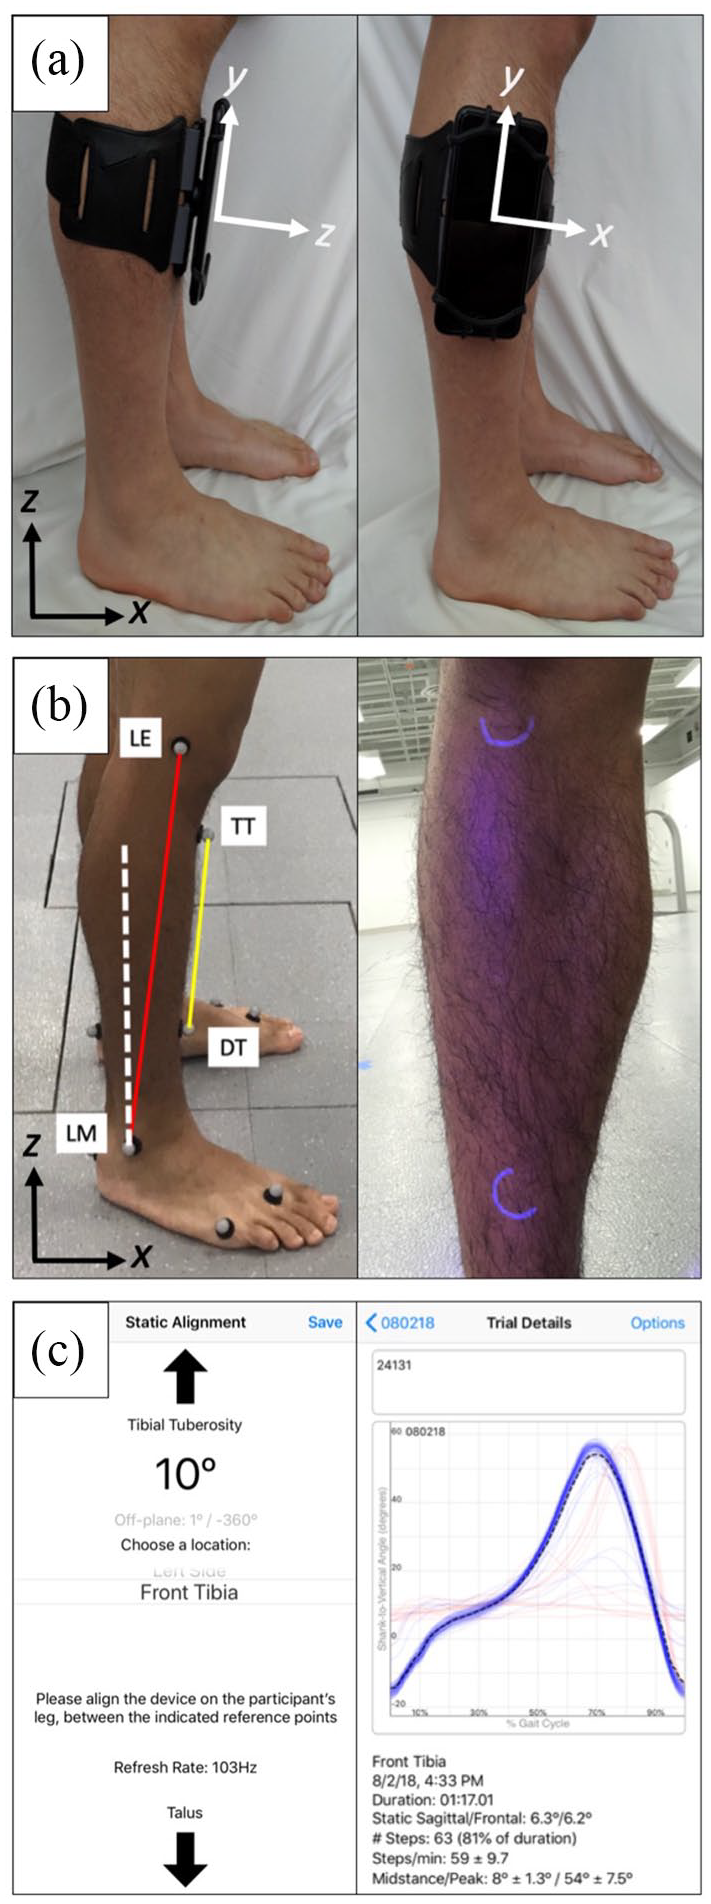
(a) Anterior and lateral positioning of the smartphone. The local (smartphone) and global (lab) coordinate systems are shown. (b) Anterior (yellow) and lateral (red) SVAs are computed with respect to the vertical (white) using 3-D Cartesian kinematic data of the tibial tuberosity (TT)—distal tibia (DT) and lateral epicondyle (LE)—lateral malleolus (LM) markers. UV light markings on the skin are also shown to keep placement of these markers constant while blinding clinicians. The global (lab) coordinate system is shown. (c) Sample screenshots of the mobile application. (Left) The set-up screen allows the clinician to view SVA in real time while positioning the phone, with guidance for anterior or lateral placements. (Right) The app automatically detects each gait cycle. Since normal SVA reaches a minimum at initial contact, the algorithm identifies each gait cycle from consecutive minima. Steps that deviate more than one standard deviation from the average, such as when the participant is turning or starting to walk, are plotted in red.
After the phone was positioned, eight reflective markers were placed on the lower leg to track SVA with motion capture cameras and assess smartphone accuracy (Figure 1(b)). The placement of these markers was kept constant between trials and concealed to clinicians by use of ultraviolet (UV) light markings on the skin (Figure 1(b)). For each session, participants performed three trials at their self-selected walking pace along a 40-foot runway and the five gait cycles from each trial were averaged and used for analysis. Following each session, smartphones were removed from the participant and the clinician was given a 40-min break. Each clinician completed three sessions within one day, which was then repeated one week later.
SVA
SVA was calculated for both anterior and lateral methods of measurement using markers placed on the shank. 6 The anterior position was assessed using markers placed on the TT and distal tibia (DT). The lateral position was assessed using markers placed on the LE and LM (Figure 1(b)). These two methods of measuring SVA have been used in clinical practice, and differences between the two methods of SVA measurement have not been previously reported.
The markers were tracked with a 10-camera Qualisys system (Goteburg, Sweden) at 120 Hz. A custom MATLAB (MathWorks, Natick, MA) script was used to calculate SVA for each pair of markers as
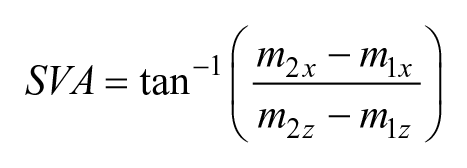
where
For measuring SVA with a smartphone, a custom mobile application (Figure 1(c)) was written to use the inertial measurement unit on Android and iOS smartphone operating systems. Both operating systems provided time-stamped measurements at roughly 100 Hz. The gravity-vector provided by the smartphone operating system was used to calculate SVA. This vector is used by many smartphones to determine device orientation, such as detecting screen rotation. Both Android (e.g. Google Pixel 2 for this research) and iOS (e.g. iPhone 7 for this research) operating systems calculate this vector by integrating measurements from the device’s accelerometer, gyroscope, and sometimes magnetometer, using signal processing filters to separate raw device acceleration from gravity. 51 Using this vector, SVA was defined as the arctangent of the gravity vector’s components, depending on the position of the mobile device on the participant’s shank. Specifically, SVA = tan−1(z, –y) when the smartphone was attached to the anterior side of the shank or SVA = tan−1(±x, –y) when the smartphone was attached to the lateral side of the shank (Figure 1(a)). The app automatically detects each gait cycle. Since normal SVA reaches a minimum at initial contact, steps were derived from the SVA by finding local minima (over a 0.35 s sliding window) in the SVA time series.
Accuracy and repeatability
We assessed the accuracy of licensed clinicians in measuring SVA during gait with a smartphone by comparing each clinician average from the custom mobile application to Qualisys. For the anterior and lateral phone positions, we calculated the average difference in SVA across the gait cycle. Since SVA is commonly evaluated at specific points of the gait cycle, especially at temporal mid-stance (30% of the gait cycle) for orthotic tuning, we normalized each gait cycle to 101 points (0%–100% of the gait cycle).
We also assessed repeatability after repositioning the smartphone using point-by-point comparisons across the gait cycle for SVA collected between clinicians, and between and within days for each clinician. Inter-clinician repeatability compared SVA averages collected between clinicians. Inter- and intra-day repeatability was evaluated for each clinician by comparing averages between and within days, respectively. This study followed similar methods as Schwartz et al. to quantify the average repeatability between trials, sessions, and clinicians (Figure 2). Inter-clinician, inter-day, and intra-day differences were determined across the gait cycle and then compared to intra-session deviations, which served as an important reference to evaluate experimental sources of error such as repositioning of the phone.
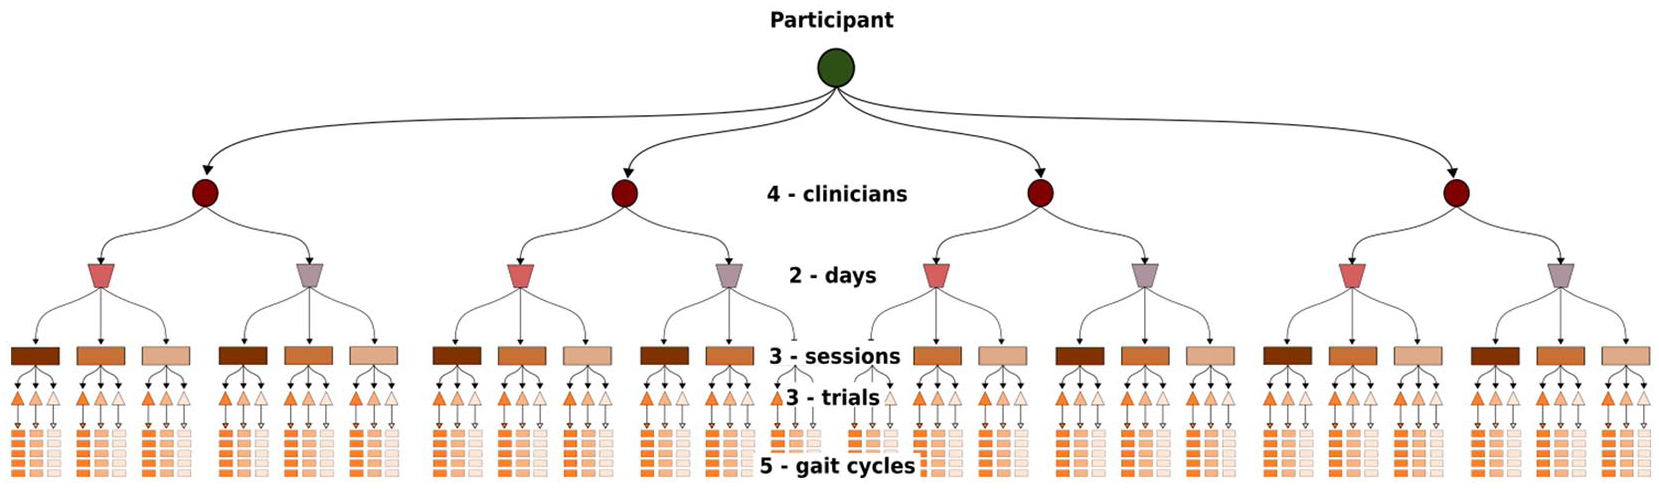
The repeated-measures experimental design adapted from Schwartz et al. 41 Each participant underwent 24 total sessions; 6 sessions conducted by each of the 4 clinicians across 2 days, with three trials acquired during each session. Five gait cycles from each trial were used for analysis. This process was repeated for two unimpaired adult participants.
Statistical Parametric Mapping (SPM) was used to evaluate accuracy and repeatability across the gait cycle.52–55 Specifically, a SPM two-tailed paired t-test (α = 0.05) was used to compare each point in the gait cycle, with adjustments based on estimates of trajectory smoothness and Random Field Theory expectations to determine significance. 56 All SPM analyses were implemented using the open-source spm1d code (v.M0.1, www.spm1d.org) in MATLAB.
Results
Accuracy
The average absolute error (±SD) in SVA measured with a smartphone compared to marker-based 3D motion analysis was 0.67 ± 0.25° and 4.89 ± 0.72° across the gait cycle for anterior and lateral positions, respectively (Figure 3). The maximum error over the gait cycle was 1.04° and 5.86° for the anterior and lateral positions, respectively. There were statistically significant deviations in SVA between systems throughout the gait cycle for both smartphone positions, although these deviations were small for the anterior placement. The smartphone consistently identified a higher SVA compared to motion analysis for the anterior position and lower SVA for the lateral position (Figure 3).
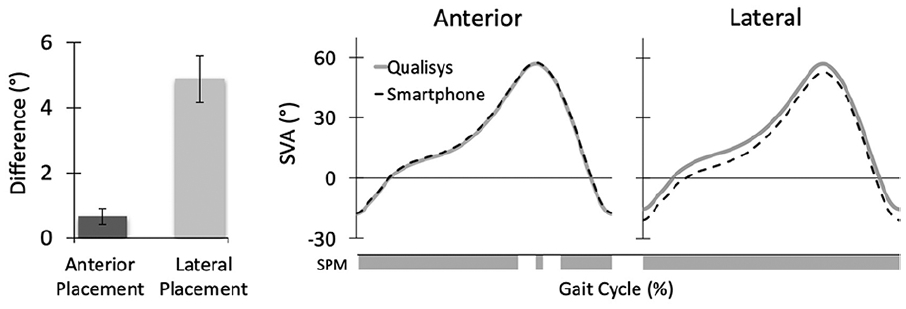
Accuracy of smartphone-based SVA measures compared to Qualisys. Average error compared to marker-based 3D motion analysis was less for the anterior placement than the lateral position (left). Comparison of average SVA across the gait cycle from a smartphone (black) or marker-based 3D motion analysis (gray) for anterior and lateral positions (right). Gray bars indicate statistically significant deviations (p < 0.05) identified from SPM.
Repeatability
The inter-clinician repeatability, comparing SVA measured with a smartphone between clinicians, was 0.72 ± 0.31° and 1.16 ± 0.28° across the gait cycle for anterior and lateral positions, respectively. Measures of SVA using the smartphone had high inter- and intra-day repeatability. The average inter-day repeatability between the first session of each day was 0.24 ± 0.15° and 1.17 ± 0.25° for anterior and lateral positions, respectively. The average intra-day repeatability between sessions within a day was 0.42 ± 0.21° and 0.25 ± 0.14° for anterior and lateral positions, respectively (Figure 4).
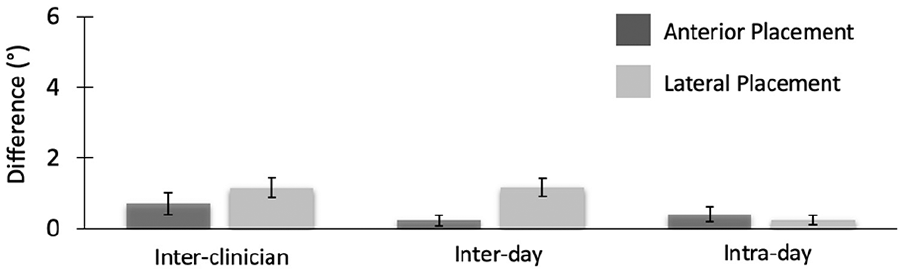
Repeatability of smartphone-based SVA measures. The average errors between clinicians, and between and within days for each clinician are shown for both anterior and lateral methods of smartphone positioning.
The variability in SVA measured with the smartphone was slightly higher than marker-based 3D motion analysis, but generally less than 3° across the gait cycle (Figure 5). Marker-based 3D motion analysis indicated that the maximum intra-session standard deviation (i.e. stride-to-stride variability) of SVA measured between trials was 1.90° and 1.95° for the anterior and lateral positions, similar to prior reports of sagittal-plane kinematics. The maximum intra-session standard deviation of SVA measured with a smartphone was 1.99° and 2.37° for the anterior and lateral positions. For both marker-based 3D motion analysis and smartphone systems, the largest variability occurred during loading response and swing.
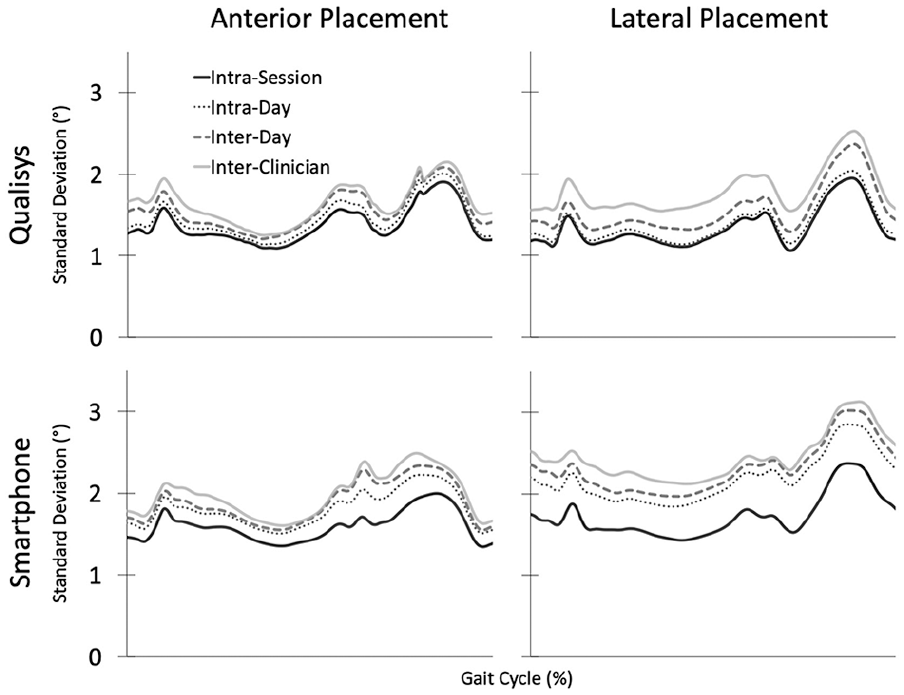
Variability in smartphone measures of SVA over the gait cycle. Intra-session deviation measured stride-to-stride variability between trials. Intra-day deviation measured the average SVA error from multiple sessions within a day, when a single clinician removed the phone and repeated SVA measurements. Inter-day deviation measured the average SVA error between the first session of each day, when a single clinician repeats SVA measures across multiple days. Inter-clinician deviation compared the average SVA error when multiple clinicians measured from the same participant. Comparing inter-clinician, inter-day, and intra-day to intra-session deviation indicates the relative impact of experimental errors, such as repositioning of the smartphone by clinicians.
Discussion
Smartphone sensing is becoming more prevalent for monitoring human movement.16,36 For the context of gait analysis, we evaluated whether smartphone sensors can be used to monitor and record shank orientation during gait. Specifically, we evaluated the inter- and intra-tester repeatability for measuring SVA with a smartphone, and compared its accuracy to gold-standard motion analysis. Orientation of the shank has been previously used for orthotic tuning, prosthetic alignment, and biofeedback training.5–10 This research demonstrated that smartphone accelerometers can accurately and repeatedly monitor SVA when used by licensed clinicians during unimpaired gait.
We evaluated two different smartphone positions that are commonly used to measure SVA. Prior studies have either evaluated SVA from the anterior surface of the shank 6 or the lateral side of the shank. 57 Due to the anatomical structure of the shank, these two measures are not equivalent. For our participants, the average difference in SVA measured from marker-based measurements during gait was 1.48 ± 0.97° with a maximum difference of 3.21° between the anterior and lateral positions. Due to the structure of the tibia, SVA measured from the anterior surface of the tibia is greater than the axis between the LE and LM (Figure 1(b)). This research also demonstrates that SVA measured from the anterior surface of the tibia is more accurate and repeatable, for both smartphone and marker-based measurements, with average deviations less than 2°. Anterior positioning on the tibia benefited from ease of palpation and reduced soft tissue movement from large muscle bodies compared to lateral positioning. Accurately identifying and aligning the smartphone with boney landmarks on the lateral side of the shank is challenging and impacts accuracy and repeatability between sessions. However, differences in tibia structure between individuals are not well documented and may impact guidelines using static and dynamic SVA.5–7 Understanding these inter-individual differences will be important for creating generalizable guidelines for rehabilitation or other applications.
Variations in kinematics during gait can occur naturally (intrinsic) or arise from experimental errors (extrinsic). Intra-session deviations can be used to quantify intrinsic sources of variability, such as natural gait cycle variability and soft tissue artifacts. Intra-session deviations therefore serve as an important reference to evaluate extrinsic sources of error. During gait, the intrinsic variations were greatest in loading response and swing phase, which may be due to greater stride-to-stride variability or soft tissue movement during these phases. For example, the weight of the smartphone may contribute to greater soft tissue artifacts during these phases. Visible perturbations of the smartphone were observed during gait analysis since the smartphone was attached with an elastic band. For the anterior smartphone position, the variability in SVA over the gait cycle had only minimal differences (e.g. <2.5°) compared to intra-session variability suggesting that errors induced by smartphone placement and other experimental errors were minimal. In contrast, the lateral smartphone position had greater deviations from intra-session variability, indicating greater extrinsic errors. Even with these deviations, the accuracy and repeatability of smartphone sensing of SVA was still better than other alternative measurement tools (e.g. goniometer) used in clinical practice.
For this research, clinicians were not provided specific instructions on how to perform the task, with the exception of attaching the smartphones snug enough to minimize slippage during gait and using anatomical landmarks, as described, for alignment. The clinicians also did not have practice or training in using the smartphone before the testing. Inter- and intra-tester repeatability was strong in this study, even though performance of the task was not strictly constrained. All clinicians in this research were highly experienced (>20 years of clinical experience), and greater training or instructional materials may be required for similar accuracy and repeatability for new clinicians. 37
In this research, we evaluated SVA during gait among healthy adults to establish baseline accuracy and repeatability, similar to standards for marker-based 3D motion analysis. 43 However, accuracy and repeatability also need to be evaluated for children or individuals with pathologic gait. Children can have more variable gait patterns, which typically lead to greater intra-session and inter-day deviations in kinematic measures. SVA monitored with marker-based, video, or smartphone methods evaluate shank orientation in the sagittal-plane. This measure can be impacted by bone deformities (e.g. tibial or femoral torsion) or gait deviations (e.g. excessive in-toeing). For orthotic tuning or prosthetic alignment, testing the accuracy with different devices will also be important to understand how the device impacts smartphone placement and SVA measurement. We anticipate that anterior placement will be easier for most orthotic and prosthetic designs. The rigidity of the devices may also further reduce soft-tissue movement observed in this research. Being able to measure SVA during gait across multiple trials may also facilitate testing and comparison of devices.
Conclusion
This research demonstrated that widely available smartphone sensors can be used for monitoring SVA during gait, demonstrating potential advantages over traditional tools used in clinical practice. Real-time smartphone sensing of SVA and other gait metrics may facilitate device tuning and gait training for adults and children, especially in settings where gold-standard motion capture systems are not readily available. The mobile application used for measuring SVA in this research is freely available for other clinicians and researchers to use for both Android and iOS operating systems (https://steelelab.me.uw.edu/2020/03/huskysteps/). Expanding the availability of quantitative tools for gait assessment is important to enable clinicians to compare devices, monitor changes in gait, guide rehabilitation, and serve the needs of their patients.
Footnotes
Author contributions
All authors contributed equally in the preparation of this article.
Declaration of conflicting interests
The author(s) declared no potential conflicts of interest with respect to the research, authorship, and/or publication of this article.
Funding
The author(s) disclosed receipt of the following financial support for the research, authorship, and/or publication of this article: This research was supported by the National Science Foundation CBET-1452646 and the National Institutes of Health, National Institute of Biomedical Imaging and Bioengineering R01-EB021935.