
Abstract
Background:
Motion capture systems are widely used to quantify human gait. Two-dimensional (2D) video systems are simple to use, easily accessible, and affordable. However, their performance as compared to other systems (i.e. three-dimensional (3D) gait analysis) is not well established.
Objectives:
This work provides a comprehensive review of design specifications and performance characteristics (validity and reliability) of two-dimensional motion capture systems.
Study design:
Systematic review.
Methods:
A systematic literature search was conducted in three databases from 1990 to 2019 and identified 30 research articles that met the inclusion/exclusion criteria.
Results:
Reliability of measurements of two-dimensional video motion capture was found to vary greatly from poor to excellent. Results relating to validity were also highly variable. Comparisons between the studies were challenging due to differences in protocols, instrumentation, parameters assessed, and analyses performed.
Conclusions:
Variability in performance could be attributed to study design, gait parameters being measured, and technical aspects. The latter includes camera specifications (i.e. resolution and frame rate), setup (i.e. camera position), and analysis software. Given the variability in performance, additional validation testing may be needed for specific applications involving clinical or research-based assessments, including specific patient populations, gait parameters, mobility tasks, and data collection protocols.
Clinical relevance
This review article provides guidance on the application of 2D video gait analysis in a clinical or research setting. While not suitable in all instances, 2D gait analysis has promise in specific applications. Recommendations are provided about the patient populations, gait parameters, mobility tasks, and data collection protocols.
Introduction
Quantification of human gait is essential in both research and clinical contexts. Gait analysis involves the measurement of spatiotemporal, kinematic, and kinetic variables, such as stride length, walking velocity, and joint angles. Research involving gait analysis provides fundamental insights into the function associated with neuromusculoskeletal and motor control systems to improve the understanding of various locomotor disorders and advance treatments and development of assistive technologies.1–3 In clinical settings, gait analysis has been used to diagnose gait deviations and evaluate effects of interventions, both in short- and long-term follow-ups.4,5
A variety of gait analysis systems exist to meet differing needs of measurement validity and reliability, portability, cost, and ease of use. “No tech” approaches including observational gait analysis are most often used in clinical practice stemming from their ease of use and affordability. However, these methods are highly subjective, and assessments are dependent on the experience and interpretation of the clinician. “High tech” systems, such as three-dimensional (3D) motion capture systems, are considered the gold-standard in gait analysis in terms of accuracy and reliability. 3D systems are typically comprised of camera arrays that track markers on the subject in a pre-calibrated space and these can be readily combined with force plates or electromyography (EMG) systems to capture kinetic data and muscle activation patterns during gait. Benedetti et al. mentions that for certain patient groups, 3D gait analysis can affect decision-making and clinical outcomes. For example, for cerebral palsy and adult brain injuries, it can inform clinical evaluations and surgery planning to improve outcomes. 6 However, 3D gait analysis methods are expensive and complicated to apply in regular clinical practice, and thus have primarily been restricted to research applications.7,8 Furthermore, the use of 3D motion capture is limited by time, space, costs, and training required for operation. 5 Hence, simpler and more cost-effective gait analysis methods are being constantly sought.9–13 These approaches may forego some of the advanced high-fidelity measurement of instrumented gait laboratories, for simpler and clinically appropriate systems. 14
Two-dimensional (2D) video motion capture dates back to the origins of gait analysis, more than a century ago. 1 With recent advances in digital videography and computing, it is a relatively simple process to acquire and process high resolution videos.15,16 The use of 2D video analysis ranges from sports medicine to rehabilitation.17–19 In rehabilitation, uses include evaluating effectiveness of interventions and assistive devices for mobility of patients with musculoskeletal and neurological disorders to characterize lower limb kinetics and kinematics.20–22 However, the overall performance of 2D gait analysis systems is not well established; this may be a reason for lack of broad utilization of these systems in both research and clinical realms. A recent systematic review of literature found 2D video analysis to be reliable, but reliability was dependent on type of athletic task performed, type of reliability calculated (i.e. inter-rater vs intra-rater), and place of measurement. 23 Yet, the review only focused on selected athletic tasks and not gait. Hence, guidance in the peer-reviewed literature is limited about the most appropriate applications, reliability, and validity of 2D video gait analysis for rehabilitation purposes.
In the context of gait analysis, reliability relates to the magnitude of the measurement error in observed measurements to the inherent variability in the parameter being measured. 24 Reliability is typically assessed as intra-rater reliability (i.e. single rater or tester analyzing the same video on different days), intra-session reliability (i.e. analyzing different videos within the same session), inter-rater reliability (i.e. different raters analyzing the same video), and inter-session (test–retest) reliability (i.e. analyzing videos in trials that occur days apart and in different sessions).25,26 Reliability is typically measured as intra-class correlation coefficients (ICCs) or the coefficient of multiple correlation.27–29
Validity refers to the level of agreement between two measurement methods. In the case of 2D gait analysis techniques, it may be of interest to determine the level of measurement agreement to 3D systems. While the use of 3D systems for gait measurement is not a standard practice in clinical care due to their complexity as described earlier, 3D systems are considered to be gold-standard in terms of providing accurate and reliable measurements. Studies assessing validity of 2D video gait analysis typically take concurrent measurements using 2D and 3D systems.7,9,10,19,30–38 Common statistical analyses of validity include assessing the level of agreement between measurements using Bland–Altman plots, correlation coefficients, and analyses of variance.7,19,30,33,36,38 A high level of agreement is indicative of valid absolute measurement of gait parameters.
While individual articles have reported aspects of 2D gait analysis, to the authors’ knowledge, no study has consolidated this information to provide a comprehensive assessment of the performance (i.e. reliability and validity) of 2D video gait analysis systems, as well as factors that may affect their performance. In this regard, the main objective of this article was to assess the performance of 2D gait analysis systems in relation to technical system configuration. The overall goal was to inform and improve application of 2D gait analysis.
Methods
A literature search was conducted in three databases—MEDLINE, Web of Science, and SCOPUS. The search time frame was 1990 to January 2019. Early work was excluded to focus on modern approaches and technologies that are more relevant today. The following keywords were included in the search: gait, locomotion, 2D, two-dimension, 2-dimension, video, analysis, measure, metric, and assess. The search strategy used in one of the included databases, Scopus, is shown in Figure 1. Reliability and validity were not included as search keywords, because many articles did not perform quantitative reliability studies or assess validity of 2D systems. All publications in English were considered. In addition to the results obtained from the database searches, bibliographies of the found papers were reviewed and relevant papers were included. Duplicates were removed and the remaining set of abstracts was reviewed based on the inclusion criteria. The inclusion and exclusion criteria were evaluated by one author and verified by another. The abstract inclusion criteria were (1) studies on human subjects and (2) the use of a video camera in the study methodology. Studies that used video cameras for the purpose of computer vision applications and gait recognition were excluded as the focus of this article was clinical gait analysis. If the abstract was not clear with respect to the inclusion criteria, the full text was evaluated using the abstract inclusion criteria. Next, the remaining full texts were reviewed, and the following inclusion criteria were applied: (1) quantitative reliability or validity studies performed or measures of variation reported; studies that qualitatively described the reliability or validity of their systems were excluded; (2) walking or running trials. Studies that used only qualitative methods of gait assessment (e.g. Edinburgh visual gait score) were excluded. Studies were also excluded if 2D kinematic and spatiotemporal data were obtained from 3D analysis systems or were used for kinetic gait analysis. Following the Preferred Reporting Items for Systematic Reviews and Meta-Analyses (PRISMA) guideline, 39 the flow diagram for the identification and selection of the included papers is presented in Figure 2. The PRISMA checklist (Supplemental material) was used to ensure appropriate reporting throughout the article. A risk of bias assessment was not included in this review as it was felt that there was limited suitability given the nature of the studies. Risks of bias assessments, which consider aspects such as sequence randomization and blinding, are better suited for treatment studies, and preferably randomized controlled trials (RCTs), unlike the studies found in this review.
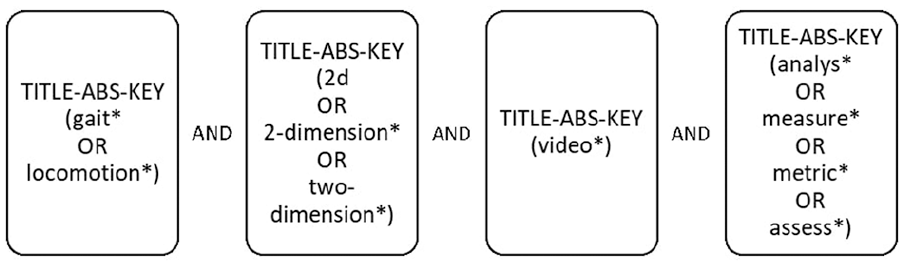
Keyword search strategy used in Scopus database.
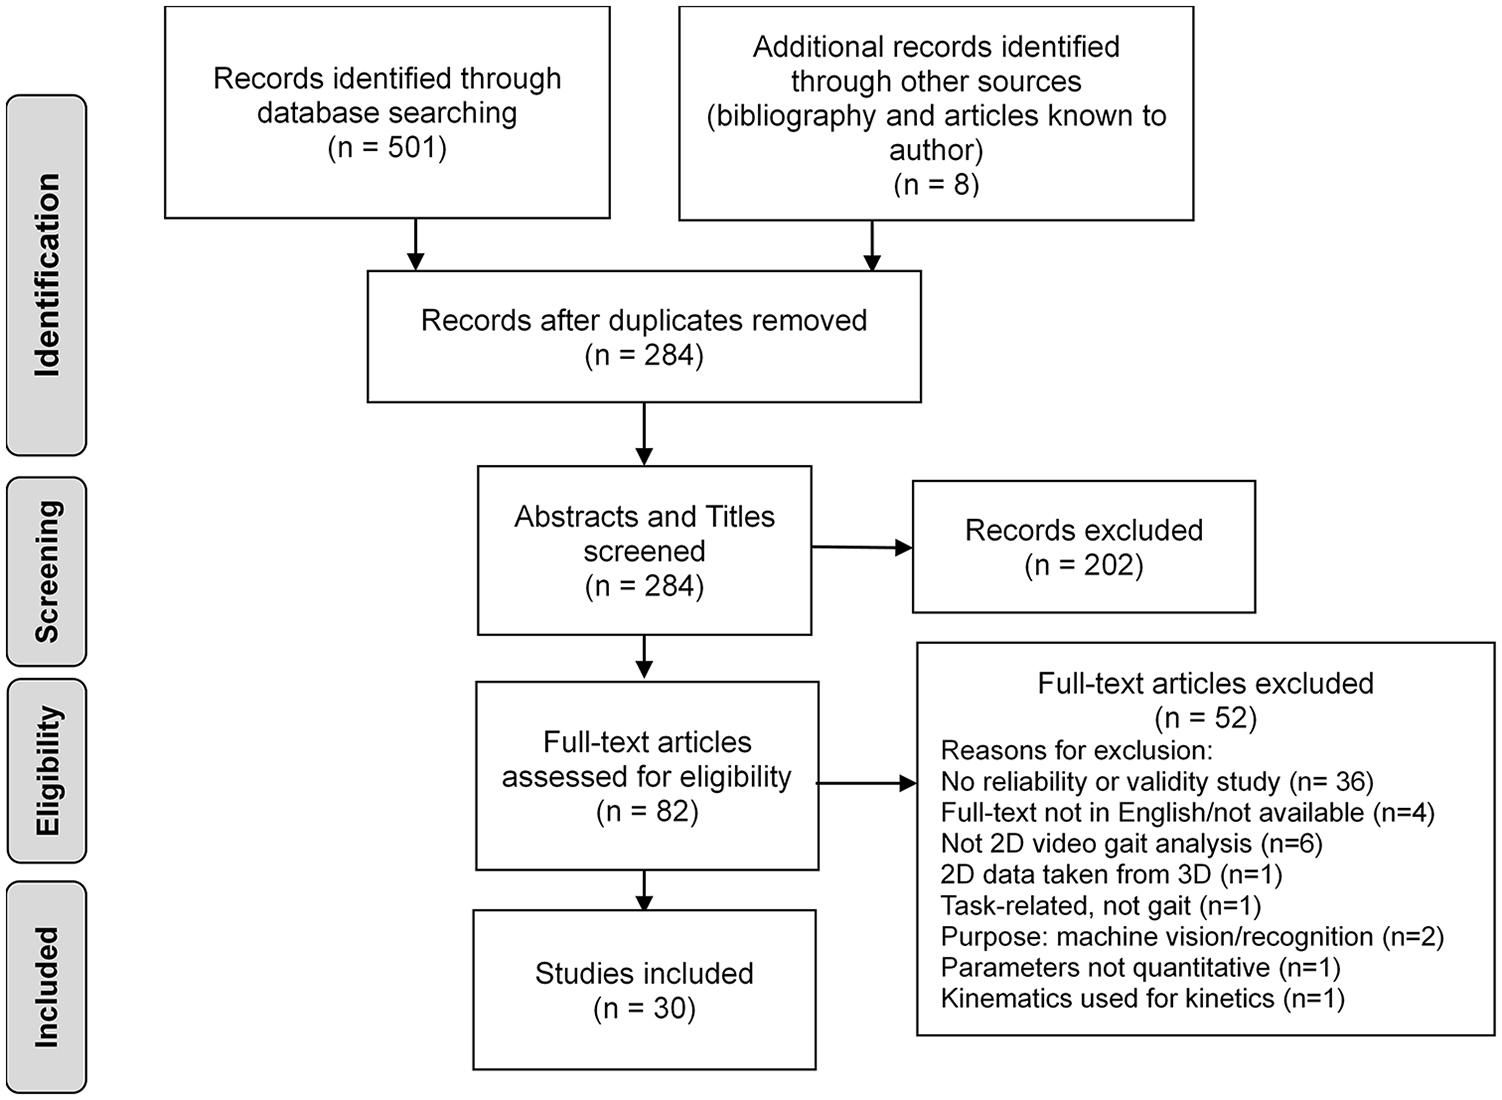
Study identification and selection flow diagram.
Once the final set of studies was established, data extraction was accomplished by one author (AM) and verified by a second author (AE). In case of conflict between the two authors, the third author (JA) functioned as a tie breaker. The following data were extracted from the final set of articles: the research methodology, planes of movement and measurement, parameters, reliability, validity, limitations, and recommendations for clinical use. The methodology data included participant information, the software used, camera specifications and setup, absolute measures of variation, and reliability study protocols and metrics. Measurements were comprised of spatiotemporal data, joint angles, and planes of movement (i.e. sagittal, frontal, and transverse). For studies that compared 2D methods with 3D methods, measures and other comparison data were extracted to assess validity. For studies that assessed the reliability of 2D methods, intra-rater, inter-rater, intra-session, and inter-session data were extracted. The level of reliability was characterized whereby ICC ⩾ 0.90 was considered as excellent, 0.80 ⩽ ICC < 0.90 as good, 0.70 ⩽ ICC < 0.80 as fair, and ICC <0.70 as poor. 14
Results
The database searches resulted in a total of 501 articles (Medline: 115; Scopus: 230; and Web of Science: 156). In addition, eight papers, including a dissertation, were identified by examining the bibliographies of the searched paper.25,30,31,36,38,40–42 In total, 30 studies were included in this systematic review.7,9,10,14,19,25,30–38,40–54
Study design and overall recommendations for clinical use
The methodological details for each included study are presented in Table 1. In summary, the number of participants in each study ranged from 1 to 572 (median: 17.5). The majority of studies analyzed gait of healthy individuals (n = 24), while one analyzed patients with peripheral arterial disease, 45 two with spastic cerebral palsy,36,38 one with patellofemoral pain syndrome, 47 one with forefoot varus deformity, 43 and one with anterior cruciate ligament (ACL) rupture. 44 Parameters were mainly assessed in the sagittal plane (n = 22),7,9,10,14,19,25,31,33,34,36–38,41,42,44,45,47–51,54 followed by the frontal plane (n = 6),30,32,35,40,43,52 and then both the sagittal and frontal planes (n = 2).46,53 Most studies assessed walking (n = 22)7,9,10,14,19,25,31,33–38,40,41,43–45,48,49,52,54 and the others running (n = 8).30,32,42,46,47,50,51,53 The most commonly assessed parameters were knee extension/flexion (n = 10),7,14,19,25,31,44–46,49,53 ankle (n = 7),25,31,36,44–46,49 and hip extension/flexion angles (n = 6),25,36,44,45,49,54 followed by stance duration,34,35,40 hip adduction angles (n = 3),30,46,53 step length (n = 3),48,50,51 gait velocity (n = 3),7,44,49 trunk angles (n = 3),36,45,48 and pelvic drop angles (n = 3).30,32,46
Study methodology characteristics.
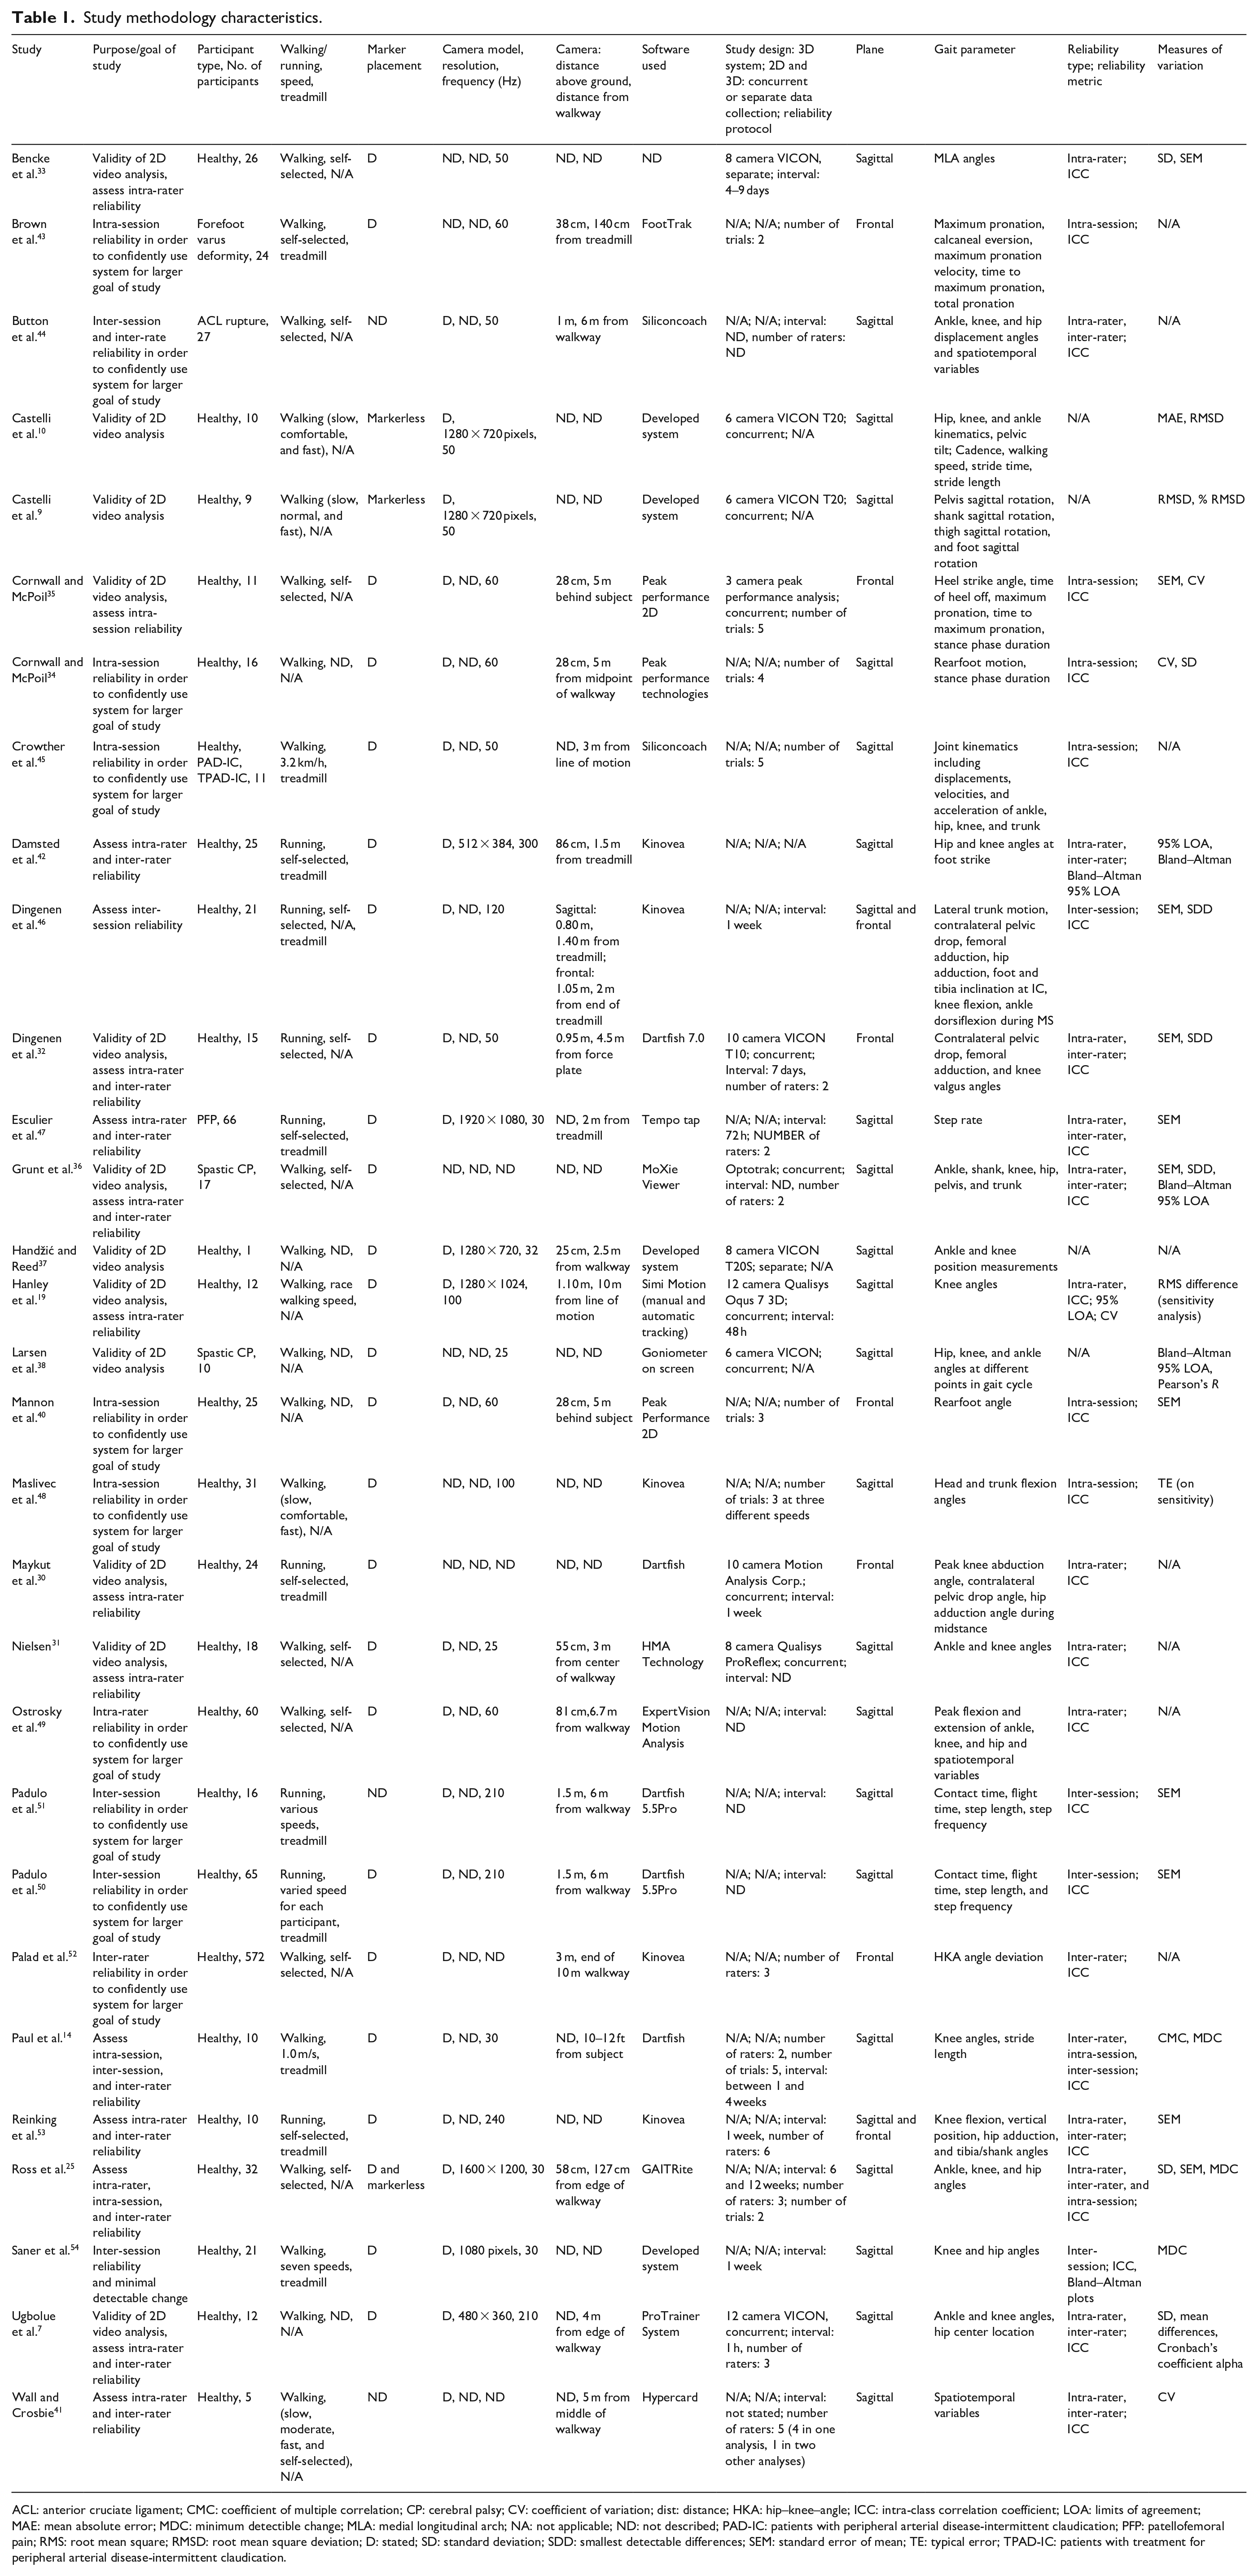
ACL: anterior cruciate ligament; CMC: coefficient of multiple correlation; CP: cerebral palsy; CV: coefficient of variation; dist: distance; HKA: hip–knee–angle; ICC: intra-class correlation coefficient; LOA: limits of agreement; MAE: mean absolute error; MDC: minimum detectible change; MLA: medial longitudinal arch; NA: not applicable; ND: not described; PAD-IC: patients with peripheral arterial disease-intermittent claudication; PFP: patellofemoral pain; RMS: root mean square; RMSD: root mean square deviation; D: stated; SD: standard deviation; SDD: smallest detectable differences; SEM: standard error of mean; TE: typical error; TPAD-IC: patients with treatment for peripheral arterial disease-intermittent claudication.
From the authors’ conclusions and recommendations, 14 studies supported the use of 2D analysis in clinics as an alternative to 3D gait analysis.9,10,14,32,33,37,41,42,44,46,47,52–54 Two studies recommended that 2D gait analysis should be used with caution due to interference from movements in other planes 36 and low validity. 38 In addition, one study stated that 2D video systems are only partially viable for use in a clinical setting, because only a limited set of clinically relevant gait variables can be attained reliably and with validity. 30 Two studies reported that 2D analysis does not substitute for motion analysis systems having high resolution and sampling rates in a clinical setting.33,37 Multiple papers recognized that testing with healthy participants limited application of study findings to patients.30,31,35,46
Technical and configuration information
Camera and walkway setup
Most of the studies provided details of their setup, including the camera distance from walkway (n = 21)7,14,19,25,31,32,34,35,37,40–47,49–52 and camera height (n = 16).19,25,31,32,34,35,37,40,42–44,46,49–52 Camera height with respect to the ground ranged from 25 cm to 3 m—a median of 80.5 cm. The camera position relative to the walkway ranged from 1.27 to 10 m in the sagittal plane (median of 3.2 m) and relative to the walkway or participant in the frontal place from 1.4 to 10 m (median of 4.75 m). Note that the distance from the walkway was not a standardized metric throughout the studies with some studies defining this distance from the center of the walkway31,34,41 and others the edge.7,25 Eleven studies used treadmills,14,30,42,43,45–47,50,51,53,54 while all others used overground walking/running. Treadmills can significantly decrease the effect of “parallax” error in the sagittal plane and perspective error in the frontal plane. 55
Camera parameters
The camera frequency ranged from 25 to 300 Hz, with the majority from 50 to 60 Hz. Information about camera models, including their resolutions, aperture settings, and light sensitivity, was often not provided; only nine studies stated the camera resolution.7,9,10,19,25,37,42,47,54 One study indicated that a low frame rate of 25 Hz was a limitation, because high speed ankle movements were blurred. 38 Low frame rate (30 Hz) and camera resolution (1600 × 1200 pixels) affected consistency in choosing phases of the gait cycle for analysis. 25 In that study, the researcher attempted to select initial contact in both trials, but due to the camera limitations, initial contact was selected for one trial, while the loading phase was selected in another trial. 25 In addition, the low resolution accounted for a limited number of pixels around the identified anatomical landmarks, affecting the reliability of the joint kinematics. 25 Pixilation was reported at high frame rates (e.g. 300 Hz) causing blurriness. 42 Use of sufficient lighting at high velocity activity and shutter speeds was recommended. 42
Markers
Markers were placed on anatomical landmarks in most of the studies (n = 24),7,14,19,30–38,40,42,43,45–50,52–54 while two used markerless systems (n = 2)9,10 and one did assessments both with and without markers (n = 1). 25 To measure ankle, knee, and hip kinematics in the sagittal plane, markers were typically placed on the iliac crest, greater trochanter, lateral femoral epicondyle, lateral malleolus, and fifth metatarsal head.25,45,49,54 For the frontal plane, markers were placed on the calcaneus, tibia, and navicular tuberosity to measure kinematics of the foot,33,40 or on the anterior superior iliac spine (ASIS), midpoint of the tibiofemoral joint, and bisection of the medial and lateral malleoli to measure knee abduction, contralateral pelvic drop, and hip adduction. 30 Contralateral pelvic drop angle was described as the “angle between the horizontal line starting at the ASIS of the stance leg and a second line connecting the ASIS of the stance and swing leg.” 32
Software
All but one of the studies named the software they used. 33 Four studies developed their own software and algorithms used for 2D analysis.9,10,37,54 Most commonly used software were Dartfish (n = 5),14,30,32,50,51 Kinovea (n = 5),42,46,49,52,53 Peak Performance (n = 3),34,35,40 and Siliconcoach (n = 2).44,45 Based on the reliability and validity studies in Table 1, Dartfish and Kinovea were used often in the last decade. The studies that compared 2D and 3D motion capture systems (n = 12) employed 3D systems including the VICON, Qualisys, Peak Performance Analysis, and Motion Analysis Corporation (Cortex) systems.
One study described that the GAITRite 2D analysis software processed landmarks as if there was large movement, while in fact there was minimal movement; this resulted in incorrect joint angle measurements. 25 While the HMA Technology software could not be fully validated against 3D systems due significant differences with knee angles at initial contact and during swing phase of gait during highly dynamic movements, it was described as promising. 31 This was related to difficulties in tracking highly dynamic movements. One study indicated that a limitation of their work was the simple, yet time-consuming manual data processing. 7
Reliability
Twenty-six studies reported reliability of kinematic and spatiotemporal variables (Table 2),19,30–36,40,43–51 with all but one reporting the ICC. 42 Intra-rater (n = 13),7,19,25,30–33,36,41,44,47,49,53 inter-rater (n = 10),7,14,25,32,36,41,44,47,52,53 intra-session (n = 8),14,25,34,35,40,43,45,48 and inter-session (n = 5)14,46,50,51,54 reliability are presented as the ICC. For intra-rater and inter-session reliability, the interval times ranged from 1 h to 12 weeks, and most common was a 1-week interval. For the three inter-session studies that reported the intervals, they ranged from 1 to 4 weeks.14,46,54 For inter-rater reliability, the number of raters ranged from 2 to 6 (median = 3). All the studies that assessed intra-session reliability stated the number of trials performed from 2 to 5 (median = 3.5) per participant.
Reliability of evaluated studies (ICC).
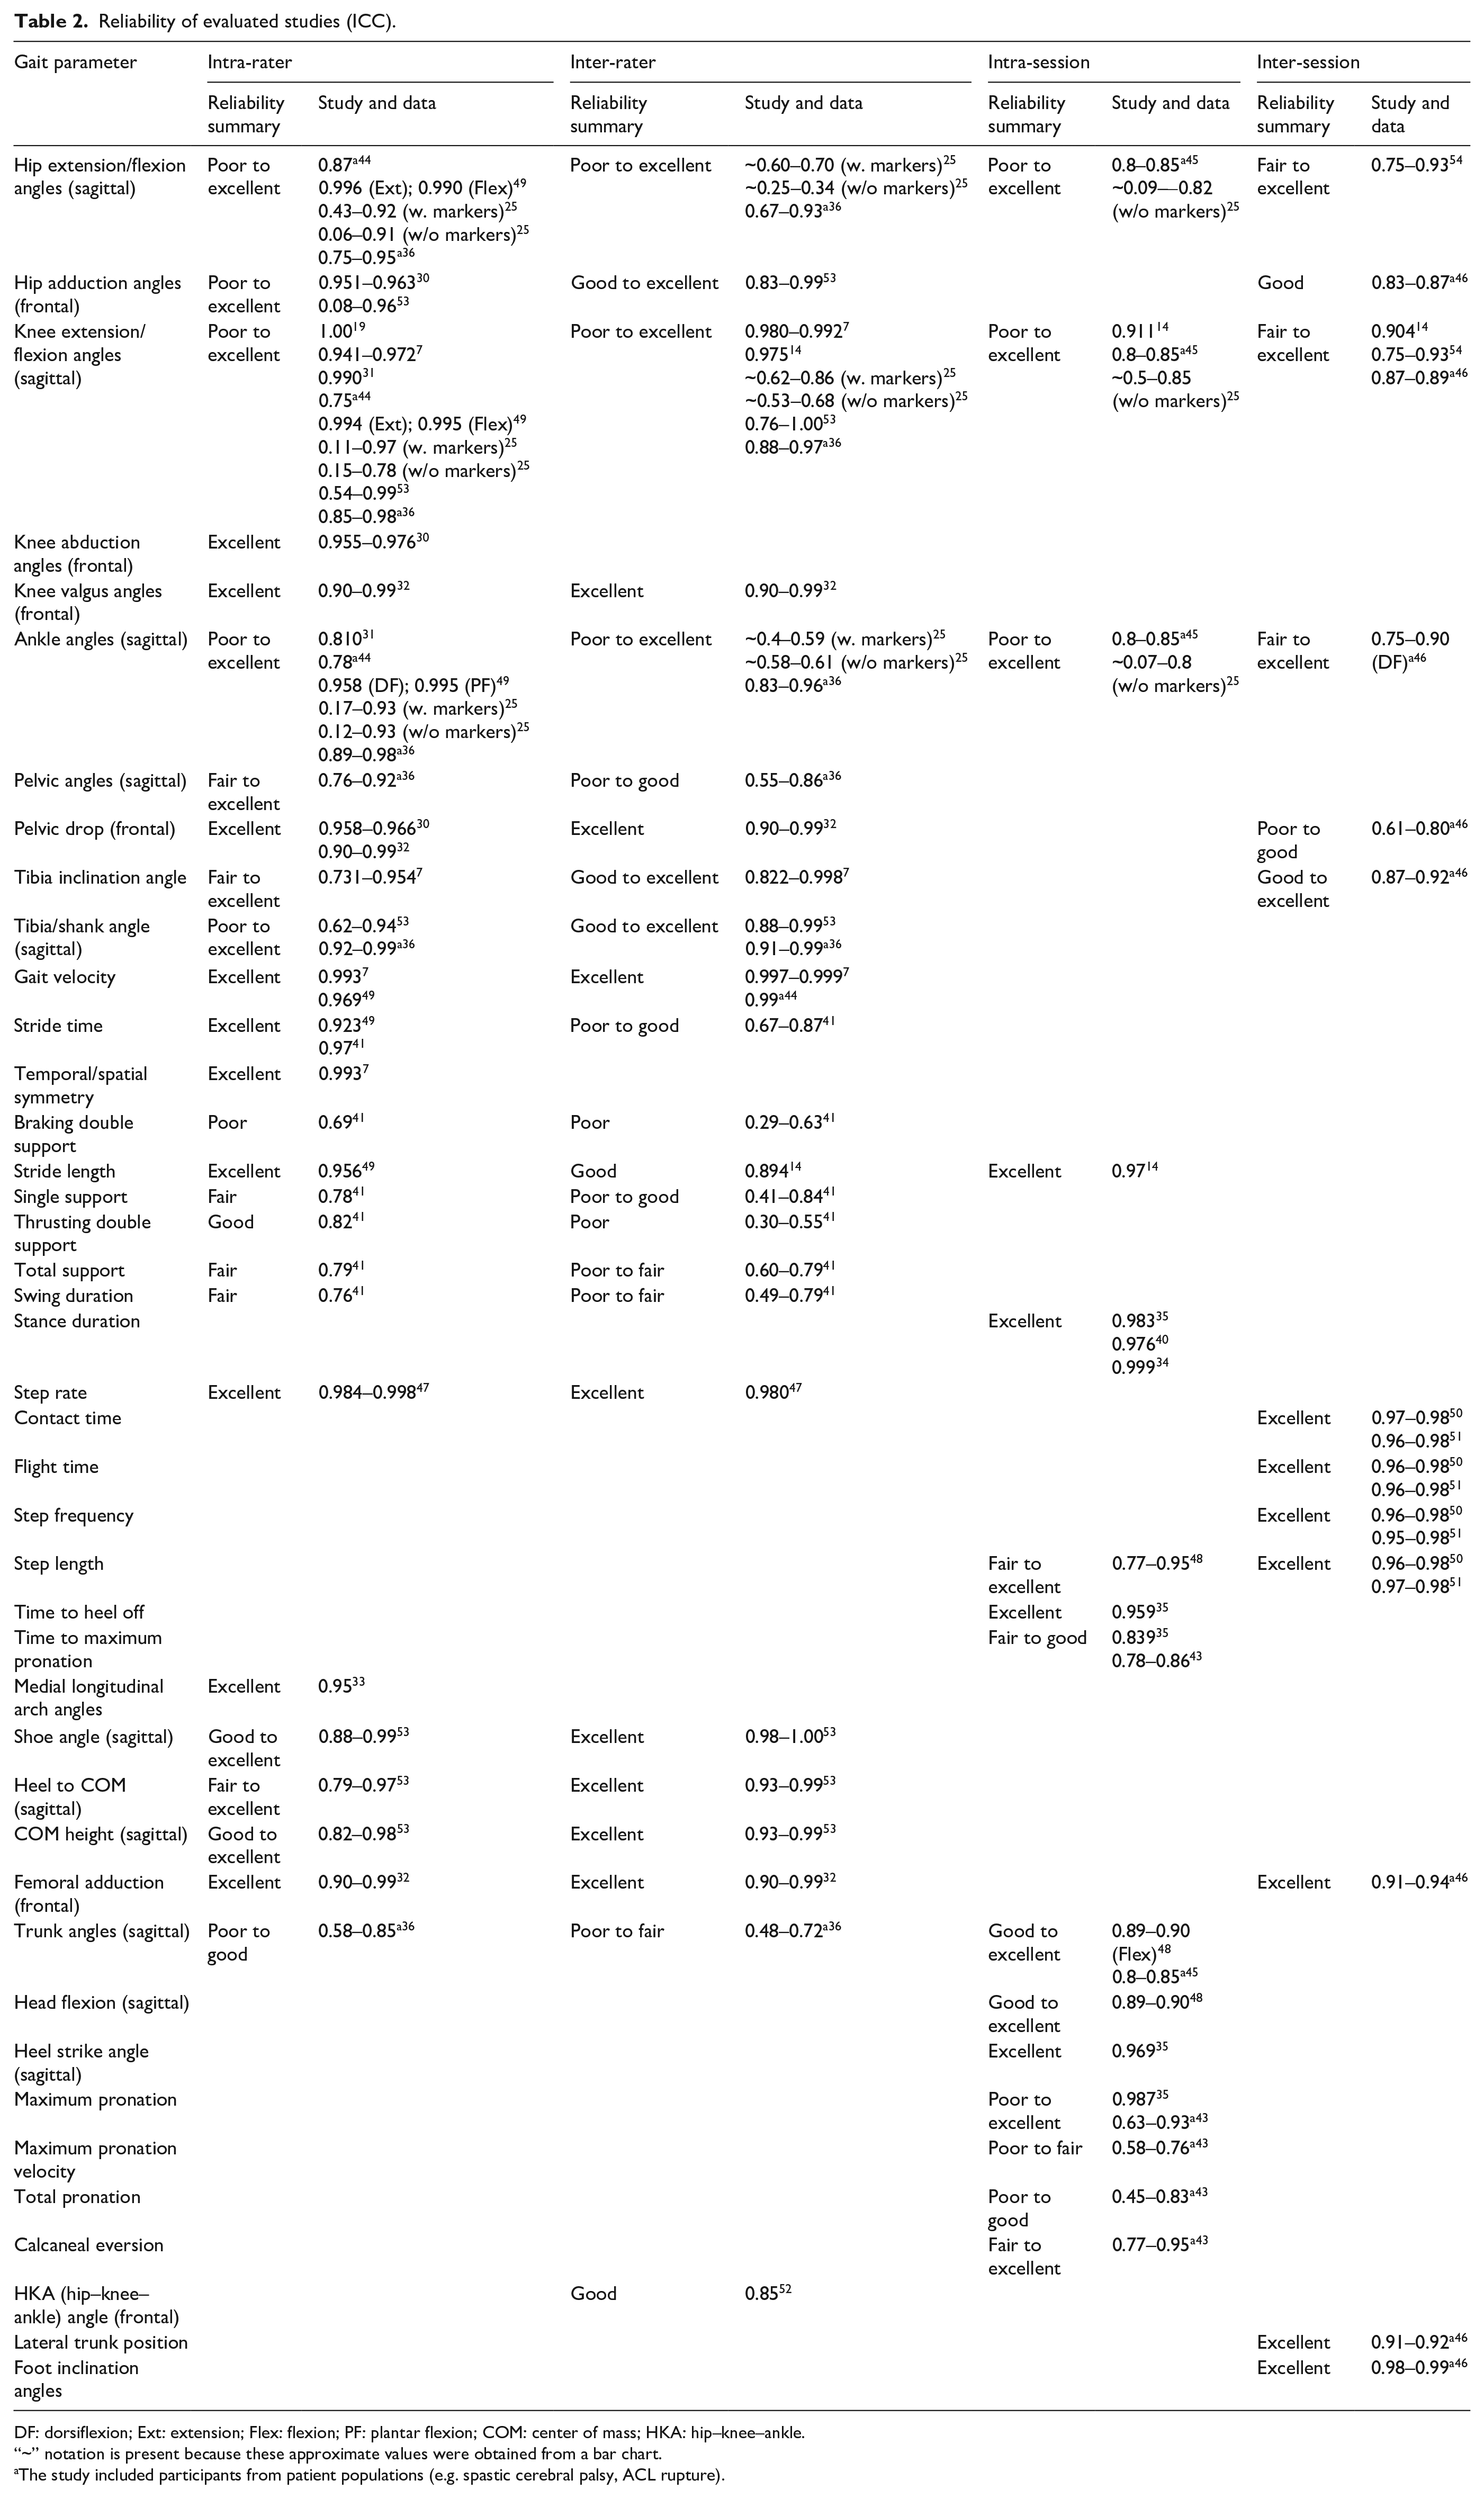
DF: dorsiflexion; Ext: extension; Flex: flexion; PF: plantar flexion; COM: center of mass; HKA: hip–knee–ankle.
“~” notation is present because these approximate values were obtained from a bar chart.
The study included participants from patient populations (e.g. spastic cerebral palsy, ACL rupture).
Intra-rater reliability of lower limb joint angles as well as gait velocity and stride time varied across the studies—ranging from poor to excellent. Excellent intra-rater reliability was found for some gait parameters, including pelvic drop angles,30,32 gait velocity,7,49 and stride time.41,49 In the sagittal plane, intra-rater reliability of hip, knee, and ankle angles was poor to excellent.25,31,36,44,49,53
Inter-rater reliability was inconsistent for hip flexion/extension, knee flexion/extension, and ankle angles. Good to excellent inter-rater reliability was reported in studies that measured tibia/shank angles36,53 and gait velocity.7,44
The intra-session ICC values for hip, knee, and ankle angles were poor to good.25,45 For trunk angles, the ICC values were good to excellent.45,48 For stance duration, intra-session reliability was excellent.34,35,40
The inter-session reliability for knee flexion/extension angles was fair to excellent.14,54 Ankle 46 and hip angle 54 ICC values could not be compared between studies, because only one study reported these reliability results for each parameter.
Comparing reliability with and without markers 25 showed that markers produced higher intra-rater and inter-rater ICC values. Studies that used Kinovea software produced reliability ICC results ranging from poor to excellent.46,48,52,53 Dartfish software produced ICC reliability results of good to excellent.14,30,32,50,51 ICC results for Siliconcoach software was fair to excellent,44,45 while Peak Performance software showed good to excellent34,35,40 reliability ICC values. Camera distance from walkway for sagittal plane studies and camera distance from participant/treadmill for frontal plane studies were plotted against reliability, as shown in Figure 3. However, these results should be interpreted with caution as 2D camera calibration can affect the image quality and ultimately the reliability. Camera frame rates are plotted against the study reliability in Figure 4. To compare potential differences in overground and treadmill reliability, ICC values are plotted for both treadmill and overground walking/running studies in Figure 5. Studies with the camera set back at least 6 m from the walkway/participant/treadmill produced good to excellent reliability in the sagittal plane, whereas a trend was not evident for in the frontal plane. In addition, a trend was not evident with frame rate and ICC reliability results. The studies that included patient populations had reliability ICC values that ranged from 0.45 to 0.99.36,38,43–45,47 The remaining 24 studies focused on healthy participants had reliability ICC values that ranged from 0.05 to 1. No conclusions can be drawn from this.
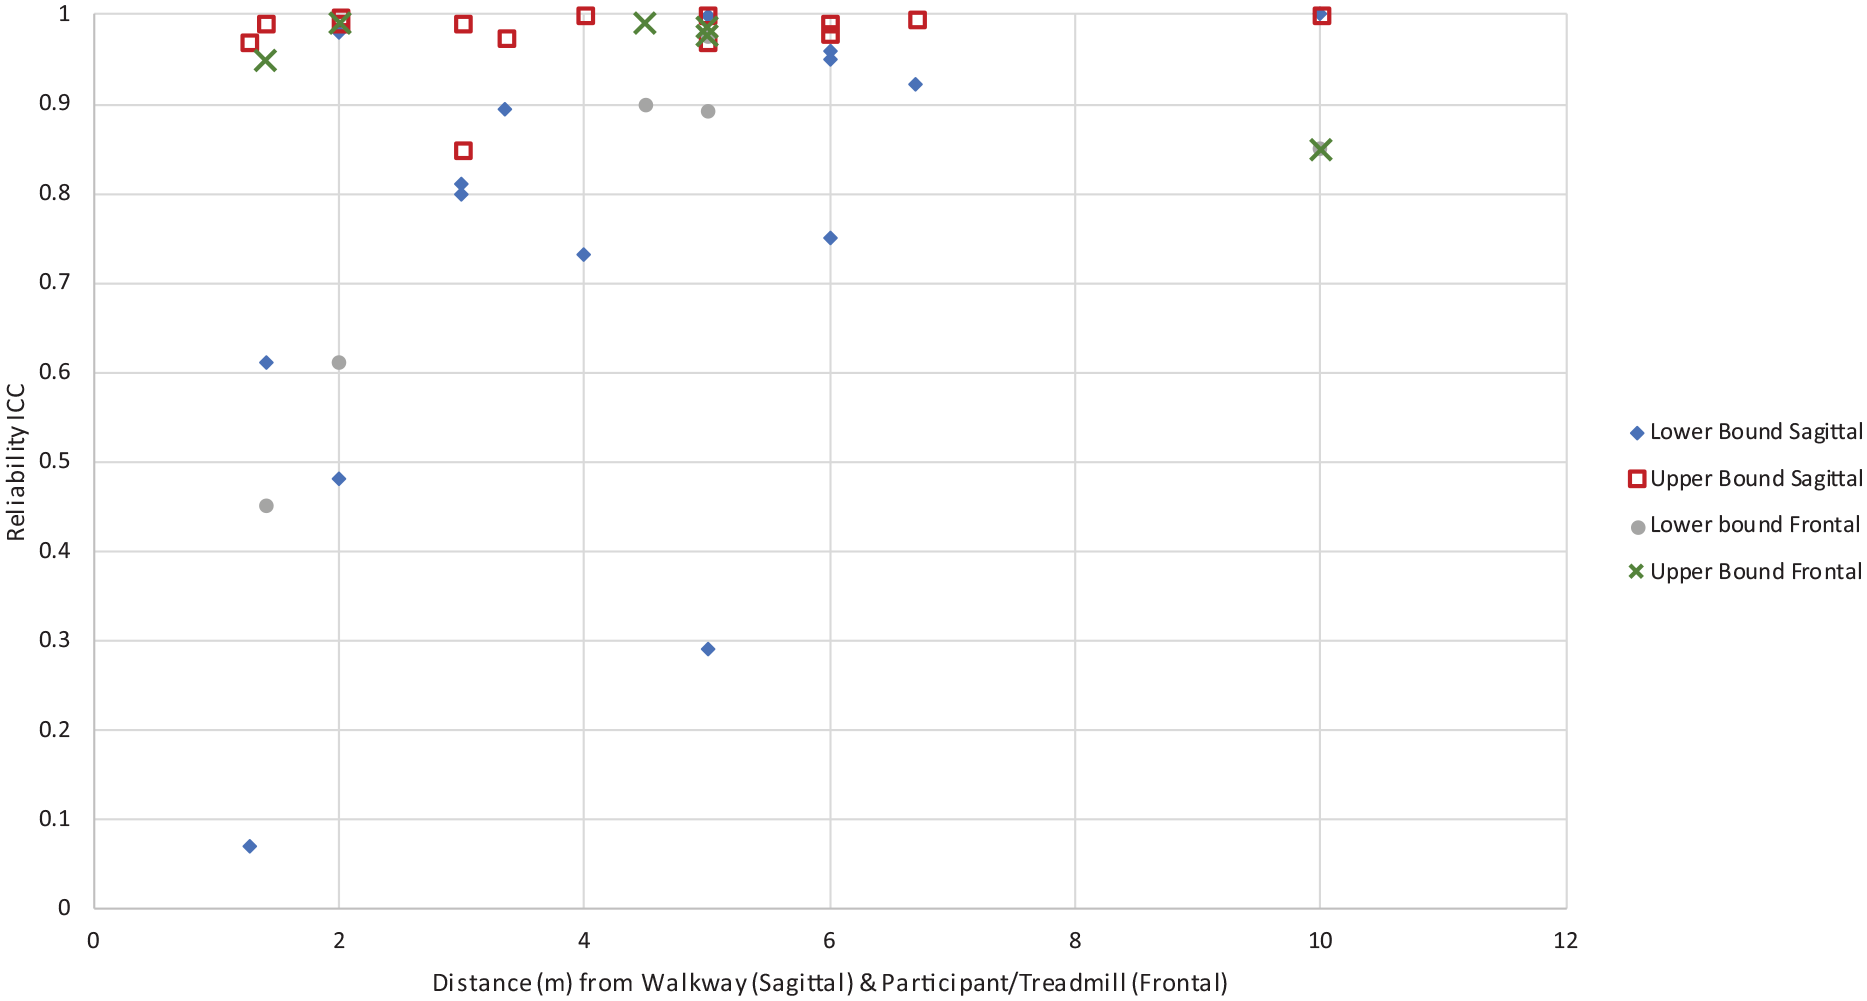
Camera distance from walkway (m) vs reliability (ICC).
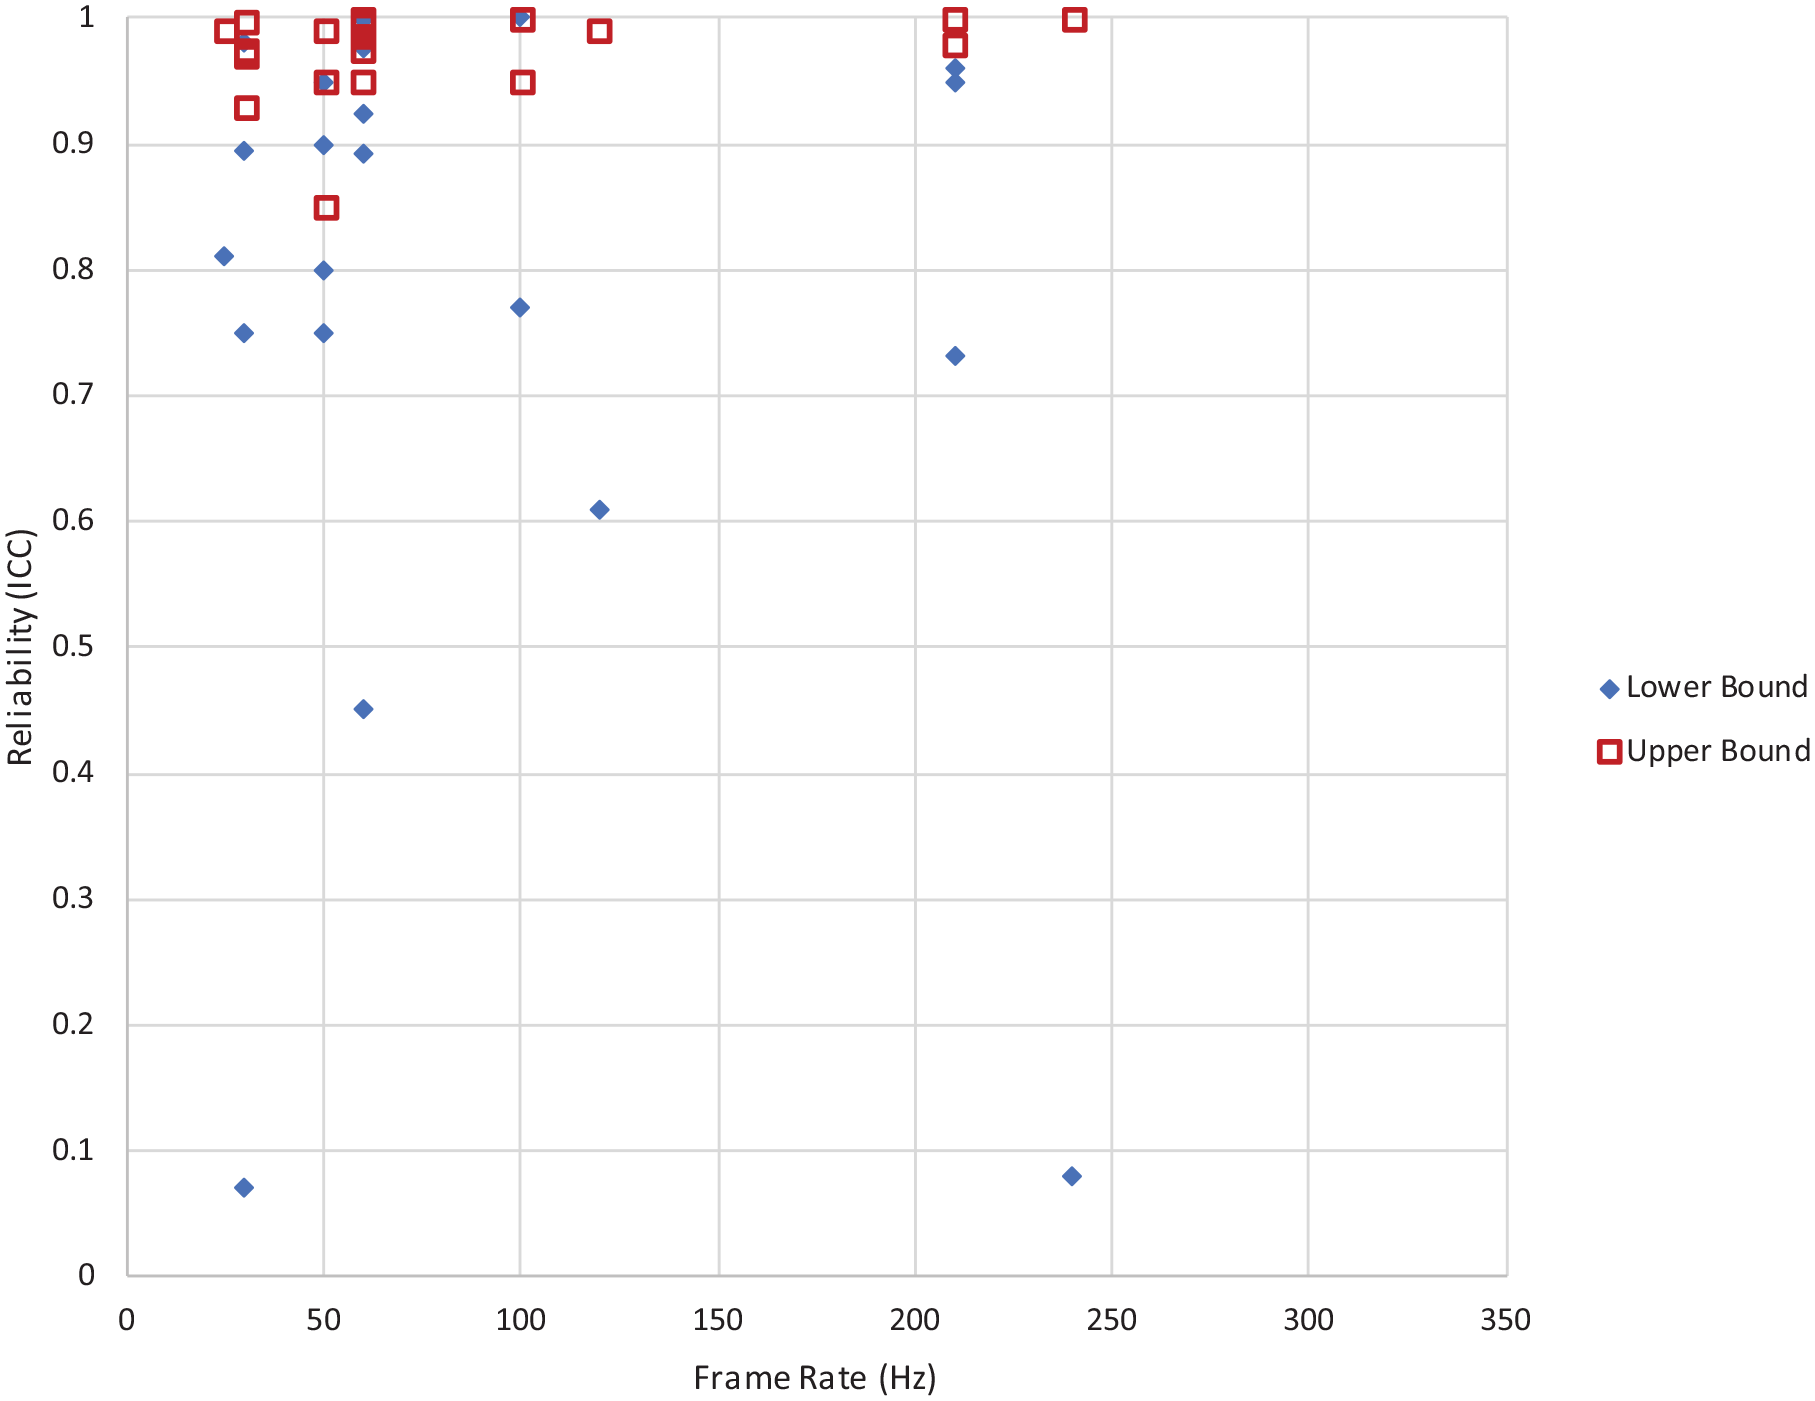
Camera frame rate (Hz) vs reliability (ICC).
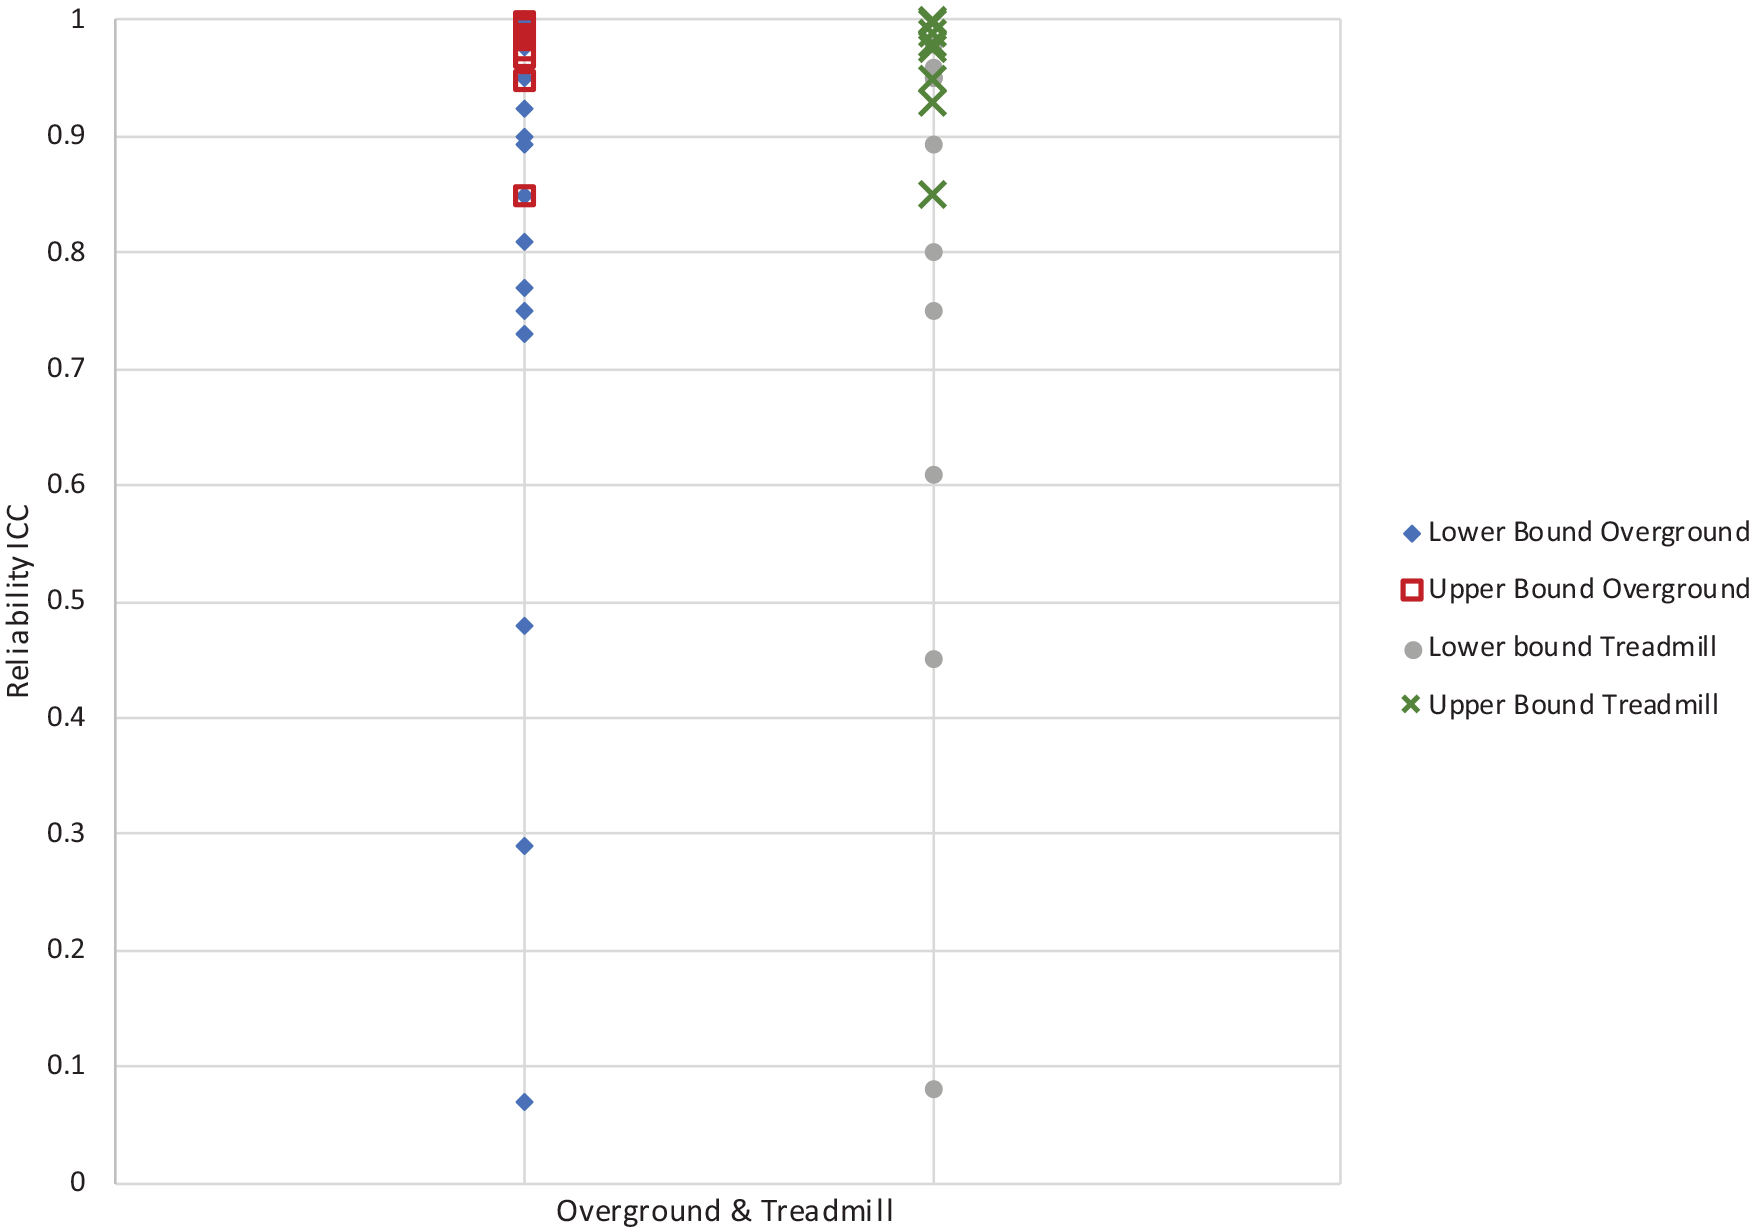
Overground and treadmill vs reliability (ICC).
Validity
Twelve studies compared 2D to 3D motion analysis systems (Table 3).7,9,10,19,30–33,35–38 Varied statistical tests and methods were used making it challenging to compare results. Some of the frequently used methods included the Bland–Altman limits of agreement, paired t-tests, and Pearson product correlation coefficients. It is important to note that there is questionable acceptability of the latter two measures to assess agreement. 24 When used in isolation, they cannot determine levels of agreement or validity; this should be considered in the interpretation of the results.
Validity including statistical tests, parameters, and results for 2D and 3D comparison.
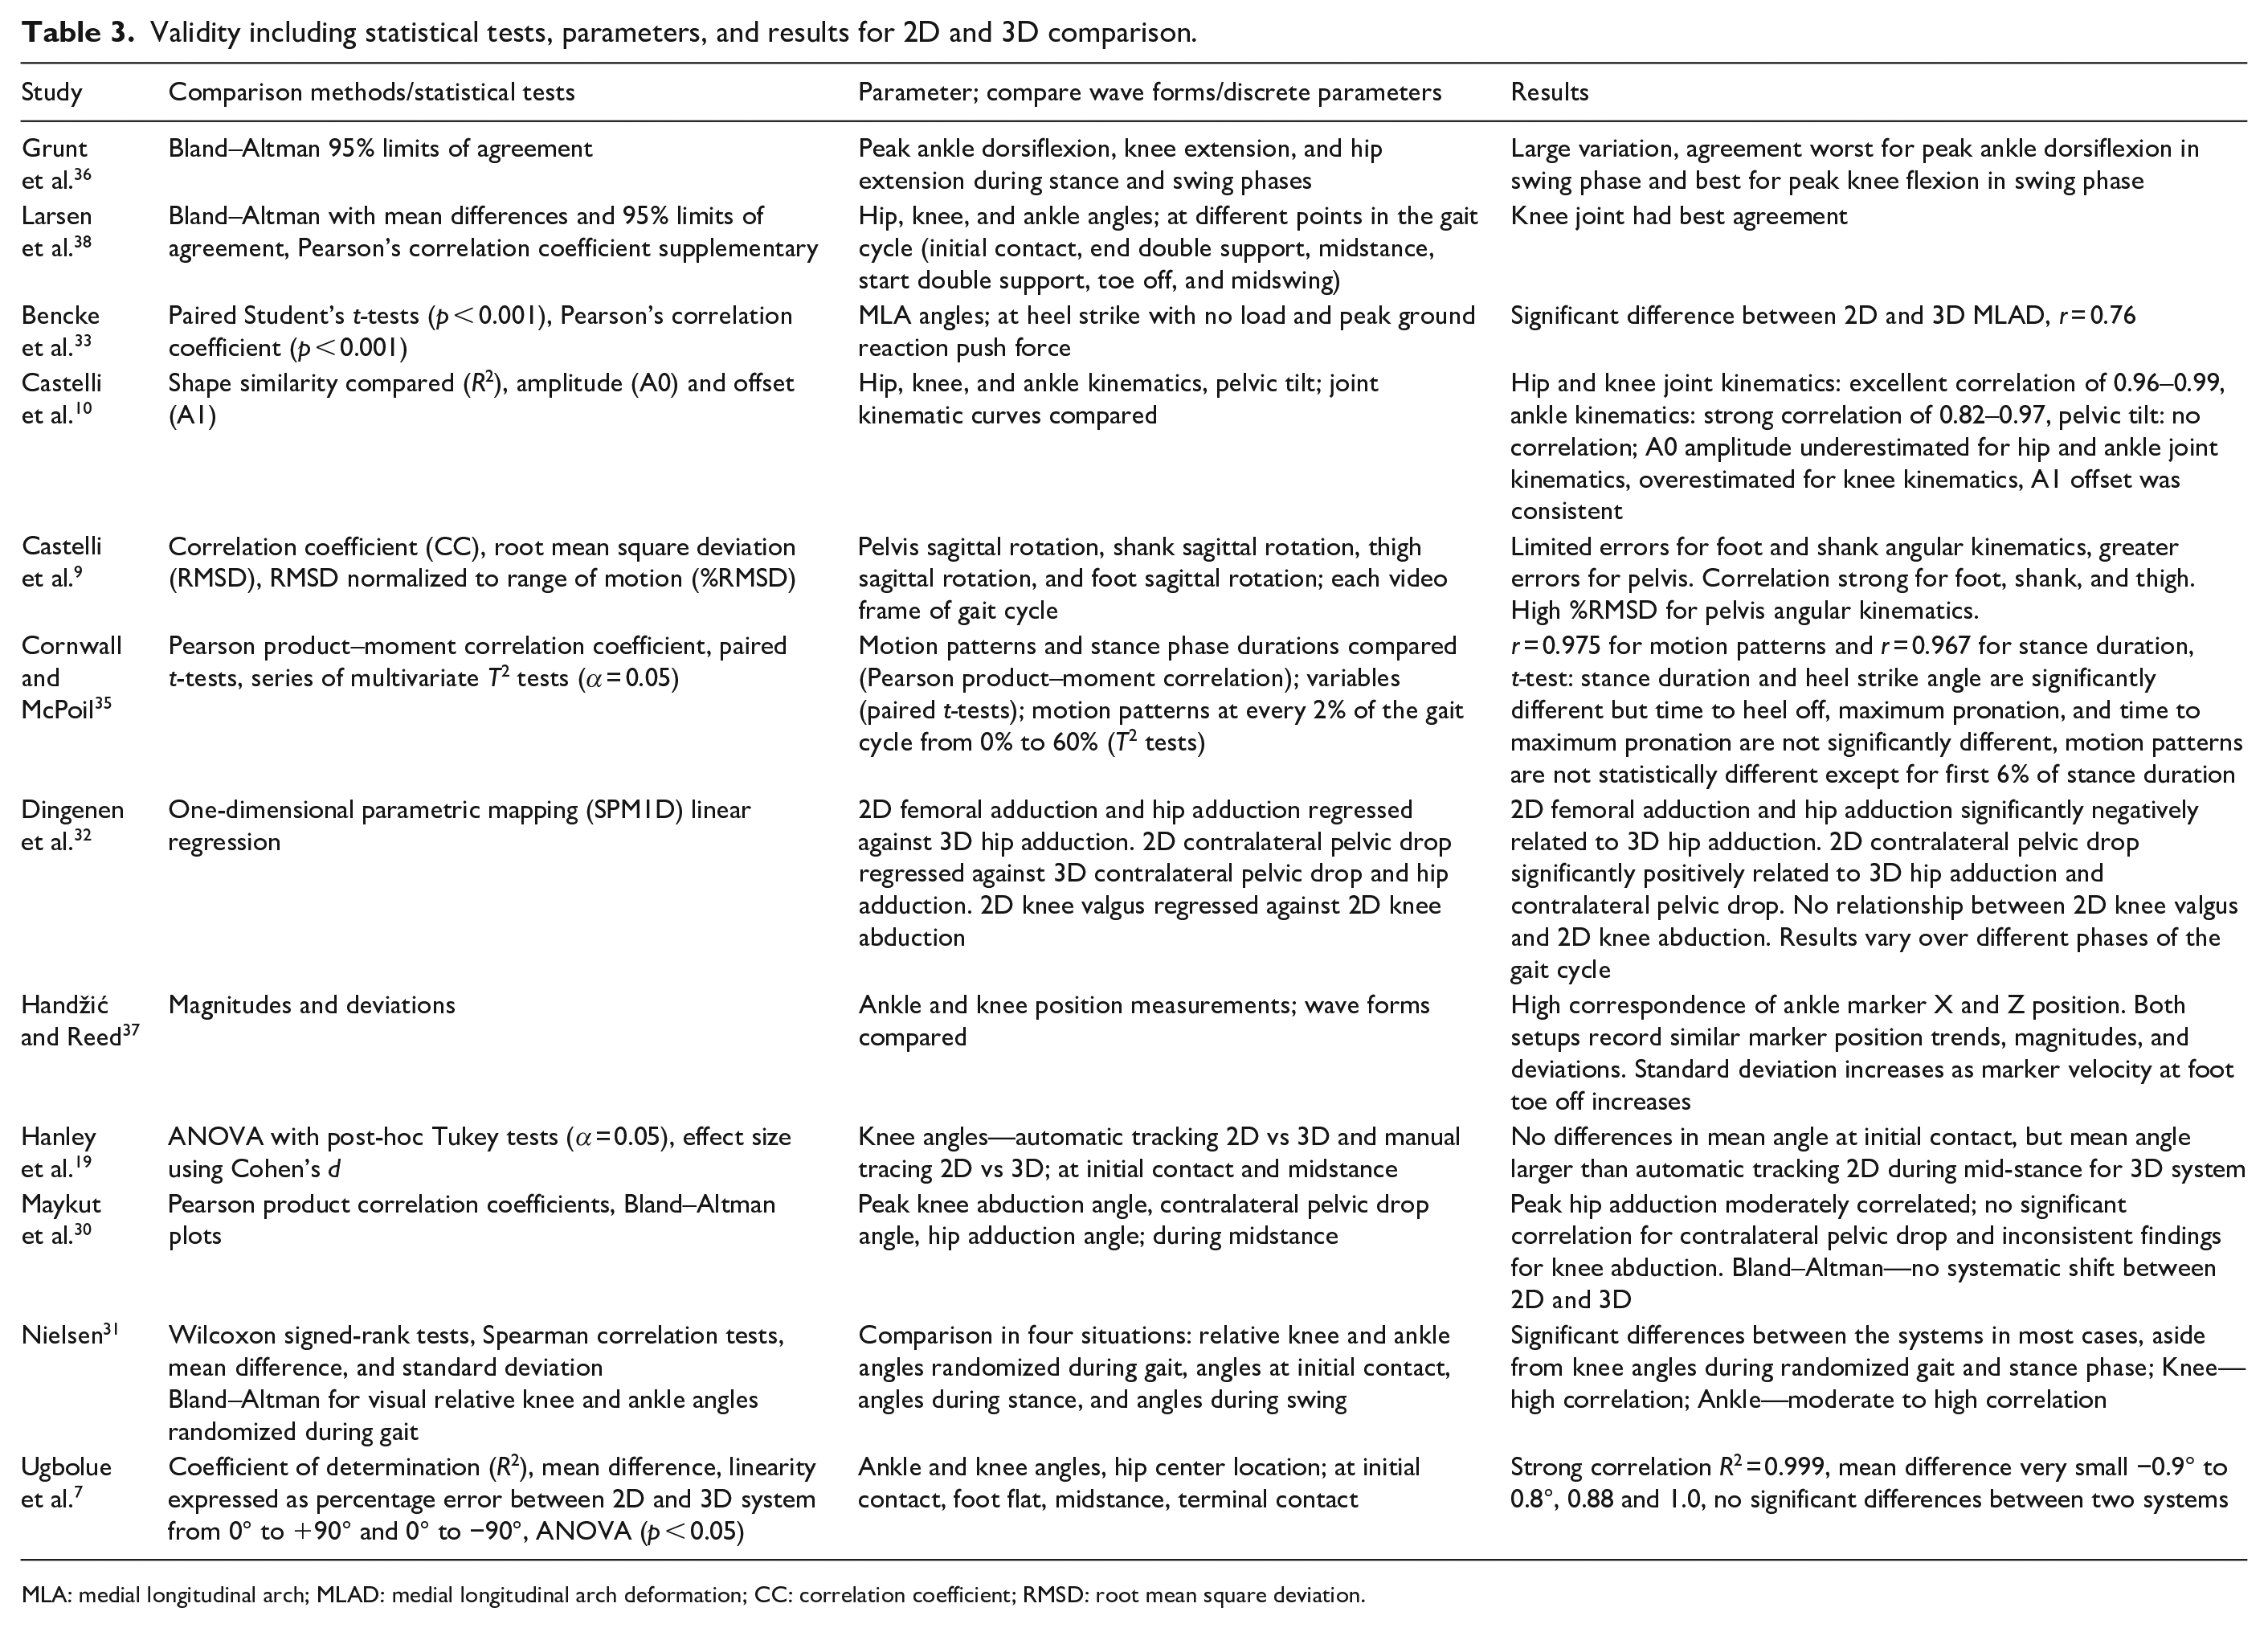
MLA: medial longitudinal arch; MLAD: medial longitudinal arch deformation; CC: correlation coefficient; RMSD: root mean square deviation.
Two studies used the Bland–Altman limits of agreement to assess validity.36,38 Both found that the knee angles had the best agreement, especially in the swing phase of the gait cycle. 36 Findings overall were variable; in general, moderate to high correlations existed for certain parameters, such as knee and ankle angles,7,31 but not for others (i.e. ones with small excursions such as pelvic tilt and pelvic drop or in the secondary planes). No significant correlations to 3D systems were found for contralateral pelvic drop, and inconsistent findings were reported for knee abduction in the frontal plane. 30 Few articles indicated that the 2D and 3D methods were not statistically different and had strong correlation,7,35 with the exception of the first 6% of the stance phase in one study. 35 Two studies assessed the validity of frontal plane joint kinematics using Dartfish 2D video software when compared to 3D motion analysis.30,32 Both studies assessed validity of hip adduction angle and contralateral pelvic drop angle using 2D system and correlation coefficient findings were inconsistent. Few studies found no correlation in some measurements, but high correlation in others.9,10,30 In summary, the results of the review do not support an overall validation of 2D systems; however, it does identify specific gait parameters that can be captured using 2D systems such as knee and ankle angles with validity. Finally, it should be noted that all of the validity studies with the exception of one 30 used overground walking rather than treadmill walking, so it was not possible to compare results on this basis.
Discussion
This review aimed to provide information about the performance of 2D gait analysis and guidance about the technical and protocol-related factors. Fatone and Stine 16 recommended that equipment for a good quality video should include a camera, tripod, leveling device, markers to track anatomical landmarks, computer system, and digitizing software. While our review agrees with many of these previous recommendations, it also provides new and important insights based on information extracted from recent published studies. This section highlights these findings and summarizes the overall state of video analyses for gait assessment.
Reliability and validity across studies greatly varied from poor to excellent. Comparisons between the studies were challenging, attributable to variabilities in the protocols, instrumentation, parameters assessed, and analyses performed. Due to many factors, including limited number of gait parameters assessed and studies available, it is difficult to perform meta-analyses to inform which factors influence reliability. As such, our results and recommendations are partly based on descriptive analyses and recommendations provided in the reviewed papers. Variability in results limits a blanket application of 2D gait analysis. While validity and reliability information exists for specific individual parameters, other gait parameters of interest that were not included in this review may need to be further researched and performance must be established. As such, this article provides guidance about important considerations for the technical setup and performance assessments (i.e. what to measure and how to perform reliability and validity assessments).
In a few studies, reliability results were reported to be poor and unacceptable.25,36,41,43,46,53 One potential cause was low frame rate and resolution of the videos, 25 but this relationship was not clearly evident in our analysis. Nevertheless, frame rates of at least 50–60 Hz, high definition camera resolution, and adequate lighting are recommended to capture high velocity movement without blurring. In terms of software, Kinovea and Dartfish were among the few systems that were used in multiple studies. This may be because Dartfish offers automatic marker tracking, while Kinovea offers semi-automatic tracking. Dartfish produced good to excellent reliability results in the included studies and is recommended for use in future studies. The use of markers is recommended for effective and efficient use of the software, Fatone and Stine 16 also suggest using markers for 2D analysis as manually digitizing without markers is potentially error prone. With marker use, errors may occur during 2D analysis as they do with 3D gait analysis due to soft tissue artifacts and inconsistent marker placement.6,16 Another potential source of error is related to parallax and perspective, which can be reduced using a treadmill. 16 However, no clear benefits for treadmill gait were found in terms of reliability results and validity could not be compared since only one study used a treadmill. 30 In terms of camera height with respect to the ground, parallax is said to be minimized if the camera is perpendicular to the measurement area of interest. 15
For kinematics, knee, hip, and ankle angles in the sagittal plane were most commonly extracted from the videos. This may be for several reasons. Sagittal plane movements of the lower limbs often reveal clinically relevant gait abnormalities.56,57 In addition, the measurement and extraction of parameters can be achieved more reliably in this plane due to larger and more defined movements.1,15 Abduction and adduction angles are also deemed important, especially when evaluating the gait of persons with hemiplegia to determine the cause of gait pathologies. 58 However, measurement of gait parameters from these secondary (i.e. frontal and transverse) planes is more challenging due to smaller magnitudes of the excursions of movements. Another challenge of frontal plane measurement is inconsistency in the image, as subject size increases and decreases in the case of overground walking. 15 Again, the use of a treadmill can eliminate this problem, where feasible. Fatone and Stine 16 have suggested recording in multiple views in order to capture quality clinical videos; however, this may require the development of image processing and video analysis tools capable of consolidating information from multiple images.
Further limitations and recommendations for 2D gait analysis are noted. First, treadmills can eliminate inaccuracies with parallax and frontal plane image size changes, however, few validity studies exist. Hence, more work is needed to assess and compare performance of overground and treadmill protocols. Most studies have focused on self-selected walking velocities with acceptable blurring and image capture quality; 16 however, more research is necessary at higher gait speeds. Also, there are other activities, such as slope and stair negotiation that are part of clinically relevant mobility and physical tasks that need to be considered when evaluating performance of 2D systems. 23 Furthermore, the fact that only a small portion of studies have used patient populations may suggest limited translation or penetration of 2D gait analysis into the clinical realm. This may be, at least in part, related to some of the performance limitations associated with these systems in terms of validity and reliability, as revealed by this review. Nevertheless, validation studies are needed for 2D gait analysis application with specific patient populations of interest. Finally, spatiotemporal measures were assessed to a lesser degree in the reviewed studies compared to kinematics, potentially since they can be more easily acquired using alternative means (i.e. pressure mats). Several spatiotemporal measures including gait speed, stride time, and stride length can be extracted with high reliability, however, validity studies are missing.
One limitation of this review is that the search was limited to three databases, therefore, some related literature may not have been included in this work. However, these are commonly used databases in this area of research. A risk of bias assessment was not formally conducted; however, most of the papers included in this review were not at the level of RCT’s and did not control for factors such as blinding, randomization of sequence, concealment, etc. Due to the diverse nature of the studies, other risk-of-bias criteria such as outcome reporting were also not formally assessed. Finally, research on markerless techniques using depth cameras and machine learning was not the focus of this review. These techniques may offer simple and affordable movement and gait analyses, 59 however, these techniques are still in their infancy, and have yet to see translation into clinical practice. Furthermore, a limitation of this review is that some validity studies used parameters such as t-test and correlation coefficients. These parameters cannot be used in isolation to determine validity, but these studies were still included in this review.
Conclusion
To be viable in clinical research, certain technical recommendations provided here should be considered relating to camera and analysis software specifications and data collection setups. More research is needed to identify reliable design specifications and protocols for activities other than walking and running and for different speeds. Future work should aim to standardize protocols for 2D gait analysis and further assess reliability and agreement compared to 3D systems for clinically relevant gait parameters and patient populations.
Supplemental Material
10.1177_0309364620921290_Supplemental_material – Supplemental material for Two-dimensional video gait analysis: A systematic review of reliability, validity, and best practice considerations
Supplemental material, 10.1177_0309364620921290_Supplemental_material for Two-dimensional video gait analysis: A systematic review of reliability, validity, and best practice considerations by Alexandria Michelini, Arezoo Eshraghi and Jan Andrysek in Prosthetics and Orthotics International
Footnotes
Acknowledgements
The authors wish to thank Ms Pui-Ying Wong for her invaluable advice on the search strategy and keywords selection as well as Calvin C. Ngan for his support with reviewing and editing the manuscript.
Author contribution
All authors contributed equally in the preparation of this manuscript.
Declaration of conflicting interests
The author(s) declared no potential conflicts of interest with respect to the research, authorship, and/or publication of this article.
Funding
The author(s) received no financial support for the research, authorship, and/or publication of this article.
Supplemental material
Supplemental material for this article is available online.
References
Supplementary Material
Please find the following supplemental material available below.
For Open Access articles published under a Creative Commons License, all supplemental material carries the same license as the article it is associated with.
For non-Open Access articles published, all supplemental material carries a non-exclusive license, and permission requests for re-use of supplemental material or any part of supplemental material shall be sent directly to the copyright owner as specified in the copyright notice associated with the article.