
Abstract
Background:
The osseointegrated implant system is a treatment option for people with transfemoral amputation, but implant removal is not uncommon. The association between bone mineral density changes or bone turnover markers and the need for implant removal has not previously been investigated.
Objectives:
The aim was to evaluate changes in bone mineral density and bone turnover markers in people with transfemoral amputations treated with osseointegrated implants.
Study design:
This is a prospective cohort study.
Methods:
Nineteen patients were followed up for 30 months or until implant removal. Bone mineral density was measured in the lumbar spine, proximal femur and seven periprosthetic regions. 25-hydroxyvitamin (D2 + D3), parathyroid hormone, N-terminal propeptide of type-I procollagen, C-telopeptide of type-I collagen, bone-specific alkaline phosphatase and osteocalcin were measured in blood samples.
Results:
Four fixtures and three abutments were removed. Patients with removed implants had a decreased bone mineral density in the seven periprosthetic regions between 27% (95% confidence interval = 6; 43) and 38% (95% confidence interval = 19; 52) at 30-month follow-up compared to baseline (p < 0.02), whereas bone mineral density around non-removed implants normalized to baseline values (p > 0.08). C-telopeptide of type-I collagen was significantly different between the groups at 18- and 24-month follow-up (p < 0.05). None of the measured variables were significant predictors of implant removal (p > 0.07).
Conclusion:
Implant removal was associated with loss of periprosthetic bone mineral density and increase in C-telopeptide of type-I collagen in the years following osseointegrated surgery.
Clinical relevance
This study offers new insight into changes in bone mineral density and bone turnover markers that precipitate aseptic or septic osseointegrated implant removal. Results of this study could contribute to clinical guidelines for monitoring rehabilitation progress and implant removal through dual-energy X-ray absorptiometry or surrogate markers like C-telopeptide of type-I collagen.
Background
The osseointegration (OI) implant system for people with transfemoral amputation provides a direct bone-anchored attachment to the prosthetic leg, alleviating problems associated with the prosthetic socket.1,2 The system consists of a titanium fixture osseointegrated with the residual femoral bone and an abutment protruding the skin, making it possible to attach an external prosthetic leg with a snap-lock (Figure 1).
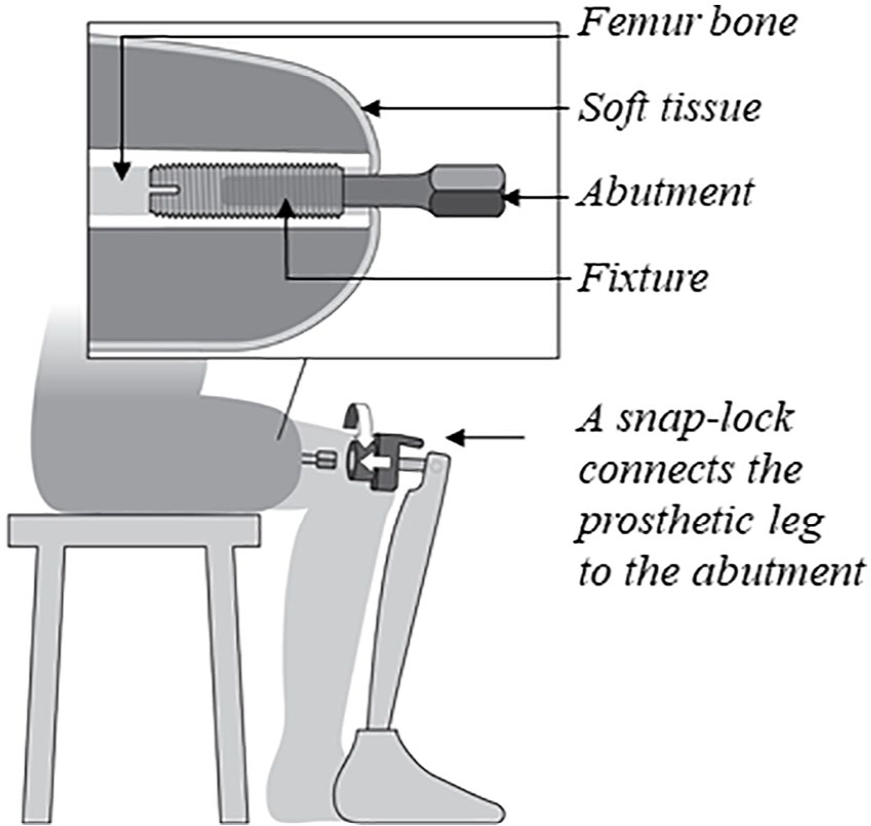
Illustration of the OI implant system.
The Swedish Osseointegration Team treated 100 patients with an OI implant from 1990 to 2008. In total, 20 OI implants were removed, and half of the removals were conducted within the first 4 years. 3 Later, 51 patients were consecutively enrolled in the prospective Osseointegrated Prostheses for the Rehabilitation of Amputees (OPRA) study. Four OI implants were removed within the first 2 years of the OPRA study. 4 The United Kingdom Osseointegration Team removed 2 of 11 OI implants after 1 year 5 and 5 of 18 OI implants after 11 years. 6 A prospective cohort study found that 7 of 39 patients had a periprosthetic OI implant infection after 3 years, and of these. “one patient had the OI implant removed, one patient had the infection resolved after antibiotic treatment and five patients had ongoing deep infections that did not affect prosthetic use.” 7 There are no available studies on the specific reasons for septic and aseptic OI implant removal. In general, the aetiology of aseptic implant loosening is thought to be multifactorial but associated with local osteoclastic bone resorption causing changes in bone mineral density (BMD). 8 People with lower limb amputations often experience halisteresis in the residual bone, and BMD in the proximal femur is reduced between 28 and 38%.9,10 The level of amputation is a predictor of BMD loss as patients undergoing transfemoral amputation lose more BMD in the proximal femur than patients receiving transtibial amputations.10,11 Even though BMD in people with transfemoral amputation is reduced on the amputated side, it remains within the normal range in the intact proximal femur and spine compared with healthy individuals. 9
The gold standard imaging methodology for examining BMD changes in serial measurements and diagnosing osteoporosis is dual-energy X-ray absorptiometry (DXA). 12 Periprosthetic BMD measurements made using DXA have been used in numerous joint replacement studies to assess strain-adaptive remodelling changes. 13 While DXA provides information on BMD, only bone turnover markers reflect bone remodelling activity. 14 A variety of bone turnover markers, including N-terminal propeptide of type-I procollagen (P1NP), C-terminal telopeptide of type-I collagen (CTX) and osteocalcin (OC), have been investigated in patients with loose hip implants and may be useful for evaluating periprosthetic OI implant osteolysis.15–17 Studies on hip implants found that CTX may be elevated in patients with loose implants,16,17 but systemic bone turnover in people with transfemoral amputations or BMD changes around OI implants have not been described previously. The purpose of this study was therefore (1) to investigate preoperative BMD and systemic bone turnover in people with transfemoral amputations in comparison with a matched control group and (2) to evaluate BMD and systemic bone turnover during 30 months of follow-up in patients with non-removed OI implants (NRIs) compared to patients with later removed OI implants (RIs).
Methods
Patients
Nineteen patients with transfemoral amputation (12 males and seven females) were consecutively enrolled between 2010 and 2013 in the observational cohort study and received an OI implant. The surgical criteria were transfemoral amputation, aged 18–70 years, with body mass index (BMI) <30 kg/m2 and sufficient femur bone length for OI implant surgery. Exclusion criteria were diabetes, smoking, treatment with bisphosphonates, non-steroidal anti-inflammatory drugs or cytostatic medications, active cancer, kidney or hepatic insufficiency, dementia, pregnancy, body weight >100 kg and a transfemoral amputation caused by atherosclerosis.
The control group was selected from the AutoRSA database, which consists of patients examined preoperatively before hip or knee arthroplasty with DXA scans of the spine and bilateral hips, blood samples for bone turnover markers, parathyroid hormone (PTH) and vitamin D. From 902 patients who underwent arthroplasty between 2014 and 2016, we matched a control group with the OI cohort by gender, age and BMI (± 1 kg/m2) in a ratio 2:1. Each control patient was only used for a single match. We made an exact match for 11 control patients and a partial match for 23 control patients. Partial matching was done by expanding the BMI difference up to 3 kg/m2 (n = 7) and age difference up to 2 years (n = 18). Two transfemoral amputated patients (age 30 and 32 years) could not be matched with the revised criteria. We, therefore, expanded the age-matching criteria to 11 years to identify the final four control patients (age between 19 and 26 years).
Ethics
According to the Danish law, formal ethical approval was not required since all examinations were performed according to an established quality assurance protocol (inquiry number: 135/2016). Data were handled in accordance with the regulations by the Danish Data Protection Agency (approval number 2012-28-005).
Surgical treatment and rehabilitation
The OI implant comprises an intraosseous threaded titanium fixture (Integrum AB, Gothenburg, Sweden) and a percutaneous abutment implanted during a two-stage surgical procedure. At stage 1 (S1), the fixture was inserted into the residual femur and allowed to osseointegrate for 6 months before the stage 2 (S2) operation. Prophylactic intravenous (IV) dicloxacillin 2 g was administered preoperatively and three times on the first postoperative day. At S2, the percutaneous abutment was connected to the fixture, making it possible to attach an external prosthesis. IV dicloxacillin 2 g was administered prior to surgery and three times/day for the next 10 days postoperatively. After the S2 surgery, the patients followed a standardized 6-month rehabilitation programme. This included hip range of motion exercises over the first 6 weeks, followed by weight bearing starting at 20 kg and increasing by 10 kg/week over the next 6 weeks. After 12 weeks, the patient gradually increased load on the OI implant until full weight bearing was possible (up to a year after the S1 surgery). 3
Examinations
The cohort was followed up prospectively for 30 months after the S1 surgery. The investigation included DXA and blood samples taken on the same day at each follow-up. Examinations were conducted preoperatively (2–21 days before surgery) and 1, 3, 6, 7, 9, 12, 18, 24 and 30 months after the S1 surgery. The clinical outcome was OI implant removal documented in patient records. Periprosthetic infection was verified by positive isolation of microorganisms from deep representative tissue specimens taken adjacent to the fixture. The control group DXA scans and blood samples were taken prior to hip or knee arthroplasty.
Dual-energy X-ray absorptiometry
Nineteen patients from the OI cohort were scanned on a GE Lunar Prodigy Advance scanner (General Electric Healthcare, Madison, WI). All 38 patients in the control group were scanned on the GE Lunar iDXA scanner. BMD around the OI implant was evaluated using a custom-made model consisting of seven periprosthetic regions of interest (ROIs), previously validated by our research group. 18 BMD was also measured in the proximal femur (total hip) and anteroposterior (AP) lumbar spine (L1–L4), using standard ROIs. Osteopenia was diagnosed when the T-score was below −1, and osteoporosis, when the T-score was less than or equal to −2.5. 19 Precision error was determined by double examinations obtained 2 years (standard deviation = 1.4) after the S2 surgery (i.e. between 2014 and 2015). All DXA scans were performed by the same technician, and all BMD analyses were completed non-blindly by one observer (R.L.H.) with GE Healthcare enCORE 14.10.022 software.
Biochemical measurements
Venous blood samples were obtained between 10:00 a.m. and 3:00 p.m. in non-fasting patients at Aarhus University Hospital, Department of Clinical Biochemistry. The OI cohort serum samples were stored at −80°C until later batch analysis, while the control group samples were analysed on the same day as they were obtained. The following methods were used to analyse the serum samples: calcium (Ca) was determined by absorption spectrophotometry; 25-hydroxyvitamin (D2 + D3; vitamin D), by high-performance liquid chromatography (API 5500; AB Sciex); bone-specific alkaline phosphatase (BSAP), by enzyme-linked immunosorbent assay (ELISA); and PTH, P1NP, CTX and OC, by electrochemiluminescence analysis (Cobas 6000 module601; Roche Diagnostic A/S, Rotkreuz, Switzerland).
Statistical analysis
The cohort was dichotomized into RI and NRI groups. The RI group comprised total implant removals (fixture and abutment) and abutment (only) removals. Patients were followed up until 30 months or until total implant/abutment removal. One patient was allocated to the RI group because he did not use the implant at the 30-month examination due to pain and had the implant removed at 31 months. The longitudinal dataset was analysed with a log-linear mixed model with random effects for patients. The model assumptions were evaluated by visual assessment of the residuals and best linear unbiased predictors (BLUPs) or fitted values of the model. The primary outcome was measurements compared to baseline values calculated for all time points and presented as percent change with 95% confidence intervals (CIs). Baselines were defined as preoperative BMD measurements in the proximal femur (total hip) and spine, preoperative blood test values and first postoperative (1 month after S1) periprosthetic BMD measurement.
The preoperative case–control data and data from the last follow-up examination were inspected with quartile–quartile plots to assess the normality of the distribution. Parametric data were tested using Student’s t test, and non-parametric data were tested using the Mann–Whitney U test. A logistic regression analysis was used to determine the predictors of implant removal, and the odds ratio (OR) estimated the odds of implant removal during a 30-month follow-up.
Precision of BMD measurements was presented as a root mean square coefficient of variation in percent (RMS-CV). Statistical analyses were carried out using Stata (v 13.1, StataCorp LP, College Station, TX), and statistical significance was assumed at p <0.05 (not adjusted for multiple comparisons).
Results
Missing data
Four patients with transfemoral amputation did not attend the 1-, 3- and 6-month follow-up examination due to logistic problems, leading to missing BMD and BTM data (Appendix 1).
Preoperative data
Mean proximal femur BMD was significantly lower than the BMD measured in the control group (p = 0.0002) (Table 1). Individually, eight patients with transfemoral amputations had PTH or vitamin D concentrations outside the reference interval: three had an elevated PTH level (>6.9 pmol/L) and five had a low vitamin D level (<50 nmol/L).
Comparison of preoperative variables between transfemoral amputees and the control group.
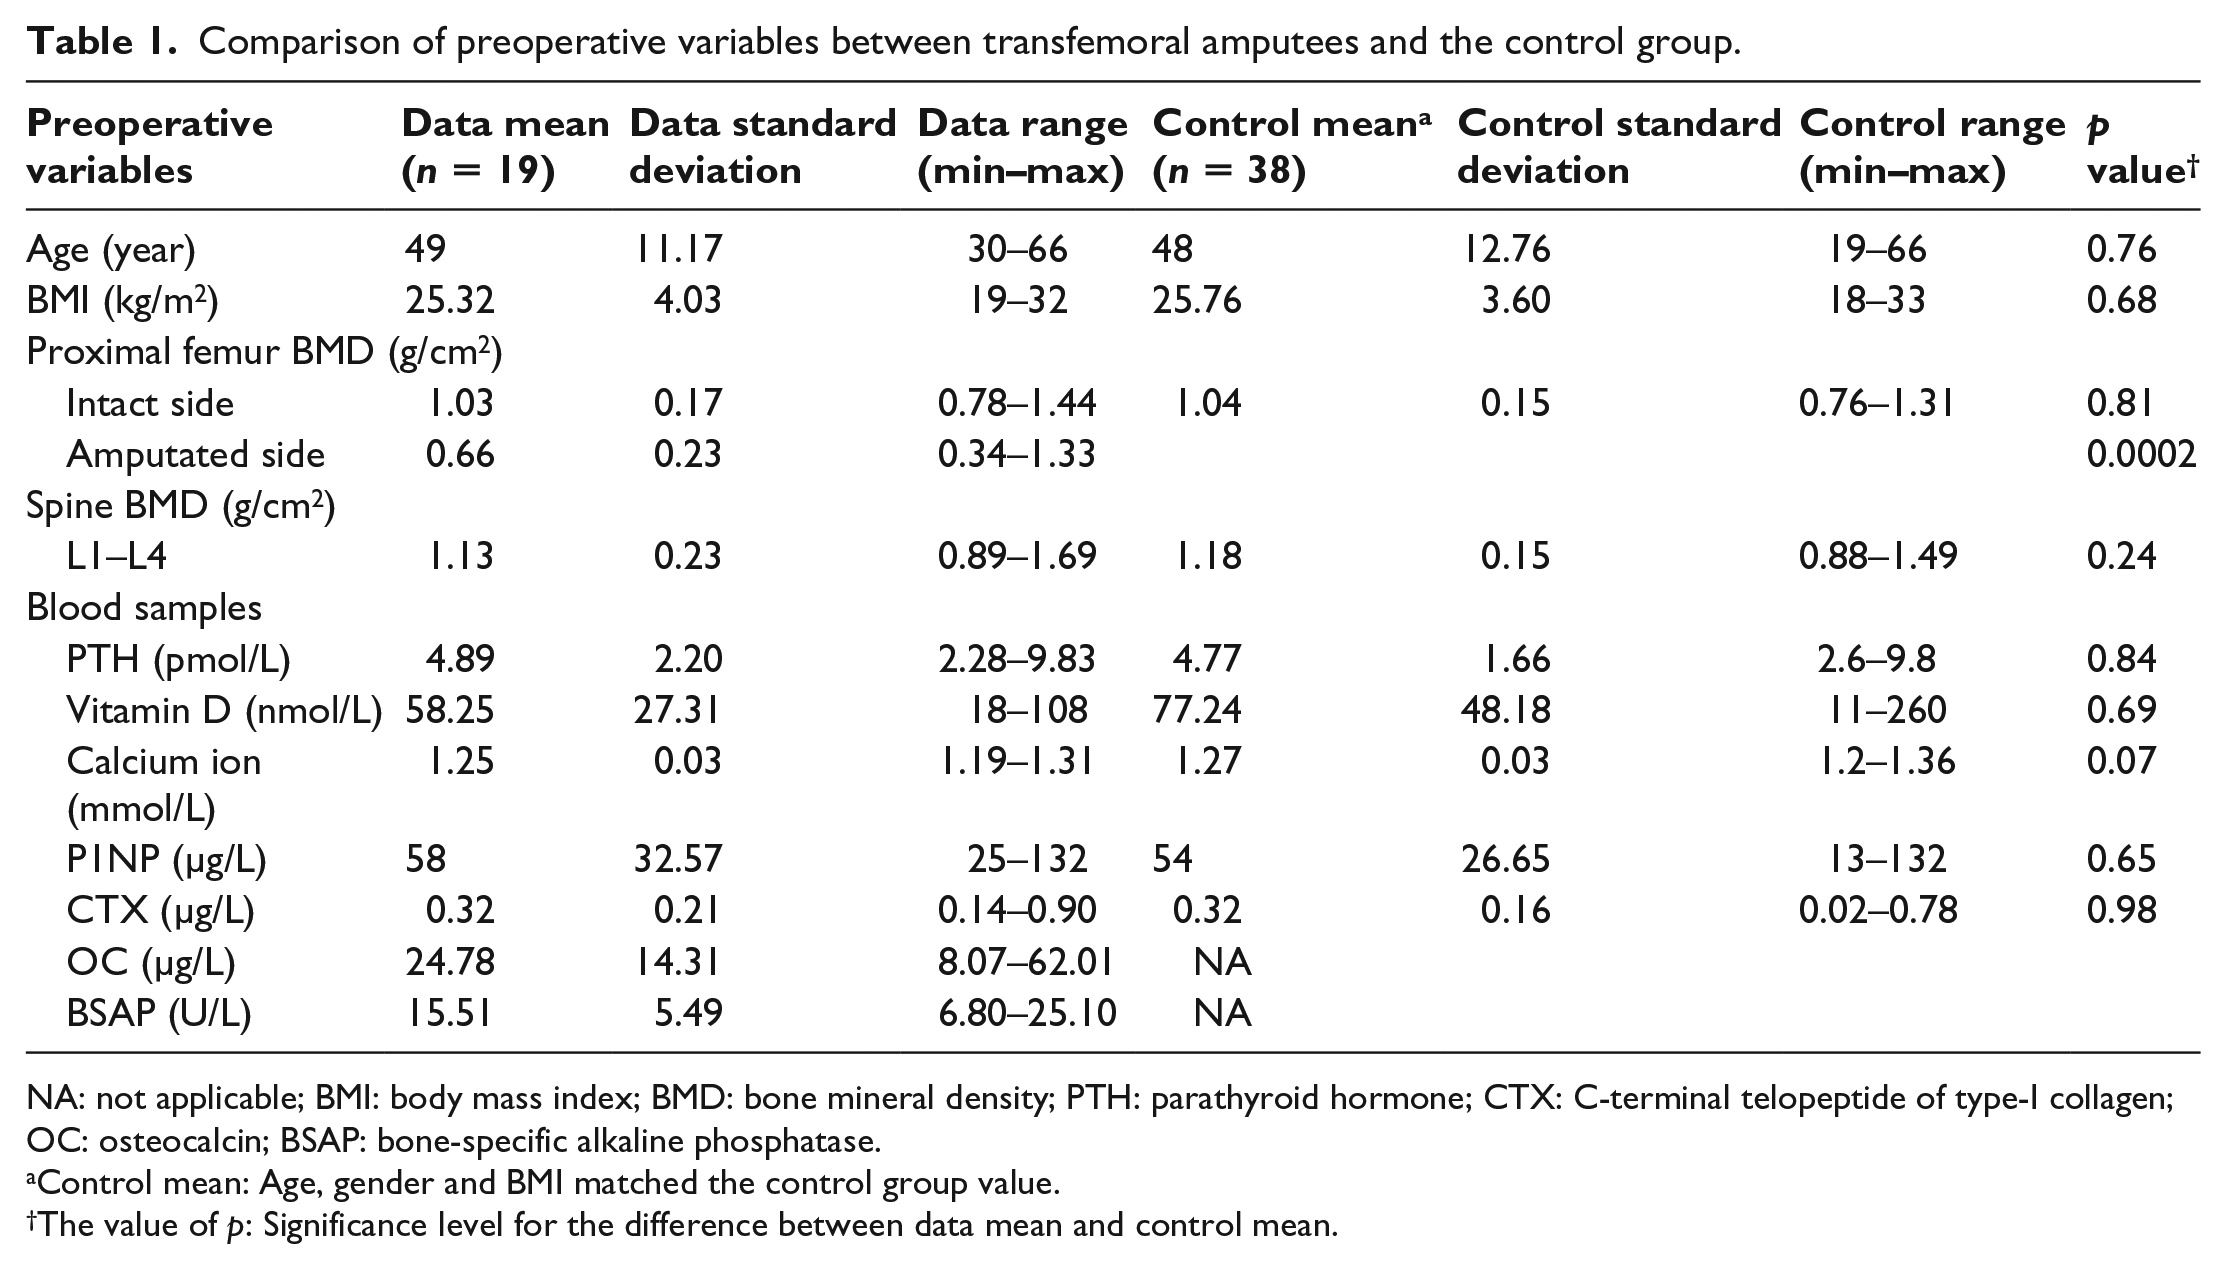
NA: not applicable; BMI: body mass index; BMD: bone mineral density; PTH: parathyroid hormone; CTX: C-terminal telopeptide of type-I collagen; OC: osteocalcin; BSAP: bone-specific alkaline phosphatase.
Control mean: Age, gender and BMI matched the control group value.
The value of p: Significance level for the difference between data mean and control mean.
Clinical outcomes
During 30-month follow-up, four patients underwent total OI implant removal due to deep infection. Three patients had their abutment removed due to pain. One patient could not use the OI implant and was equipped with a modified socket prosthesis. One patient had the abutment removed after 31 months (Appendix 1). In total, eight patients, with a mean of 23 months (range: 16–31 months) to implant removal, were allocated to the RI group.
Bone mineral density
In both groups, mean BMD of the seven periprosthetic ROIs decreased between 15% (95% CI = 8; 23) and 33% (95% CI = 22; 42) from the S1 surgery to the 6-month follow-up (p < 0.001). Compared to baseline values (Figure 2), mean BMD (ROI 1–7) in the RI group was reduced between 27% (95% CI = 6; 43) and 38% (95% CI = 19; 52) at 30-month follow-up (p < 0.02), whereas mean BMD in the NRI group returned to baseline values after 30 months (p > 0.08). No differences were found between RI and NRI groups in mean periprosthetic BMD at any follow-up (Figure 2, p > 0.13) or in the last follow-up analysis (Table 2, p > 0.14).
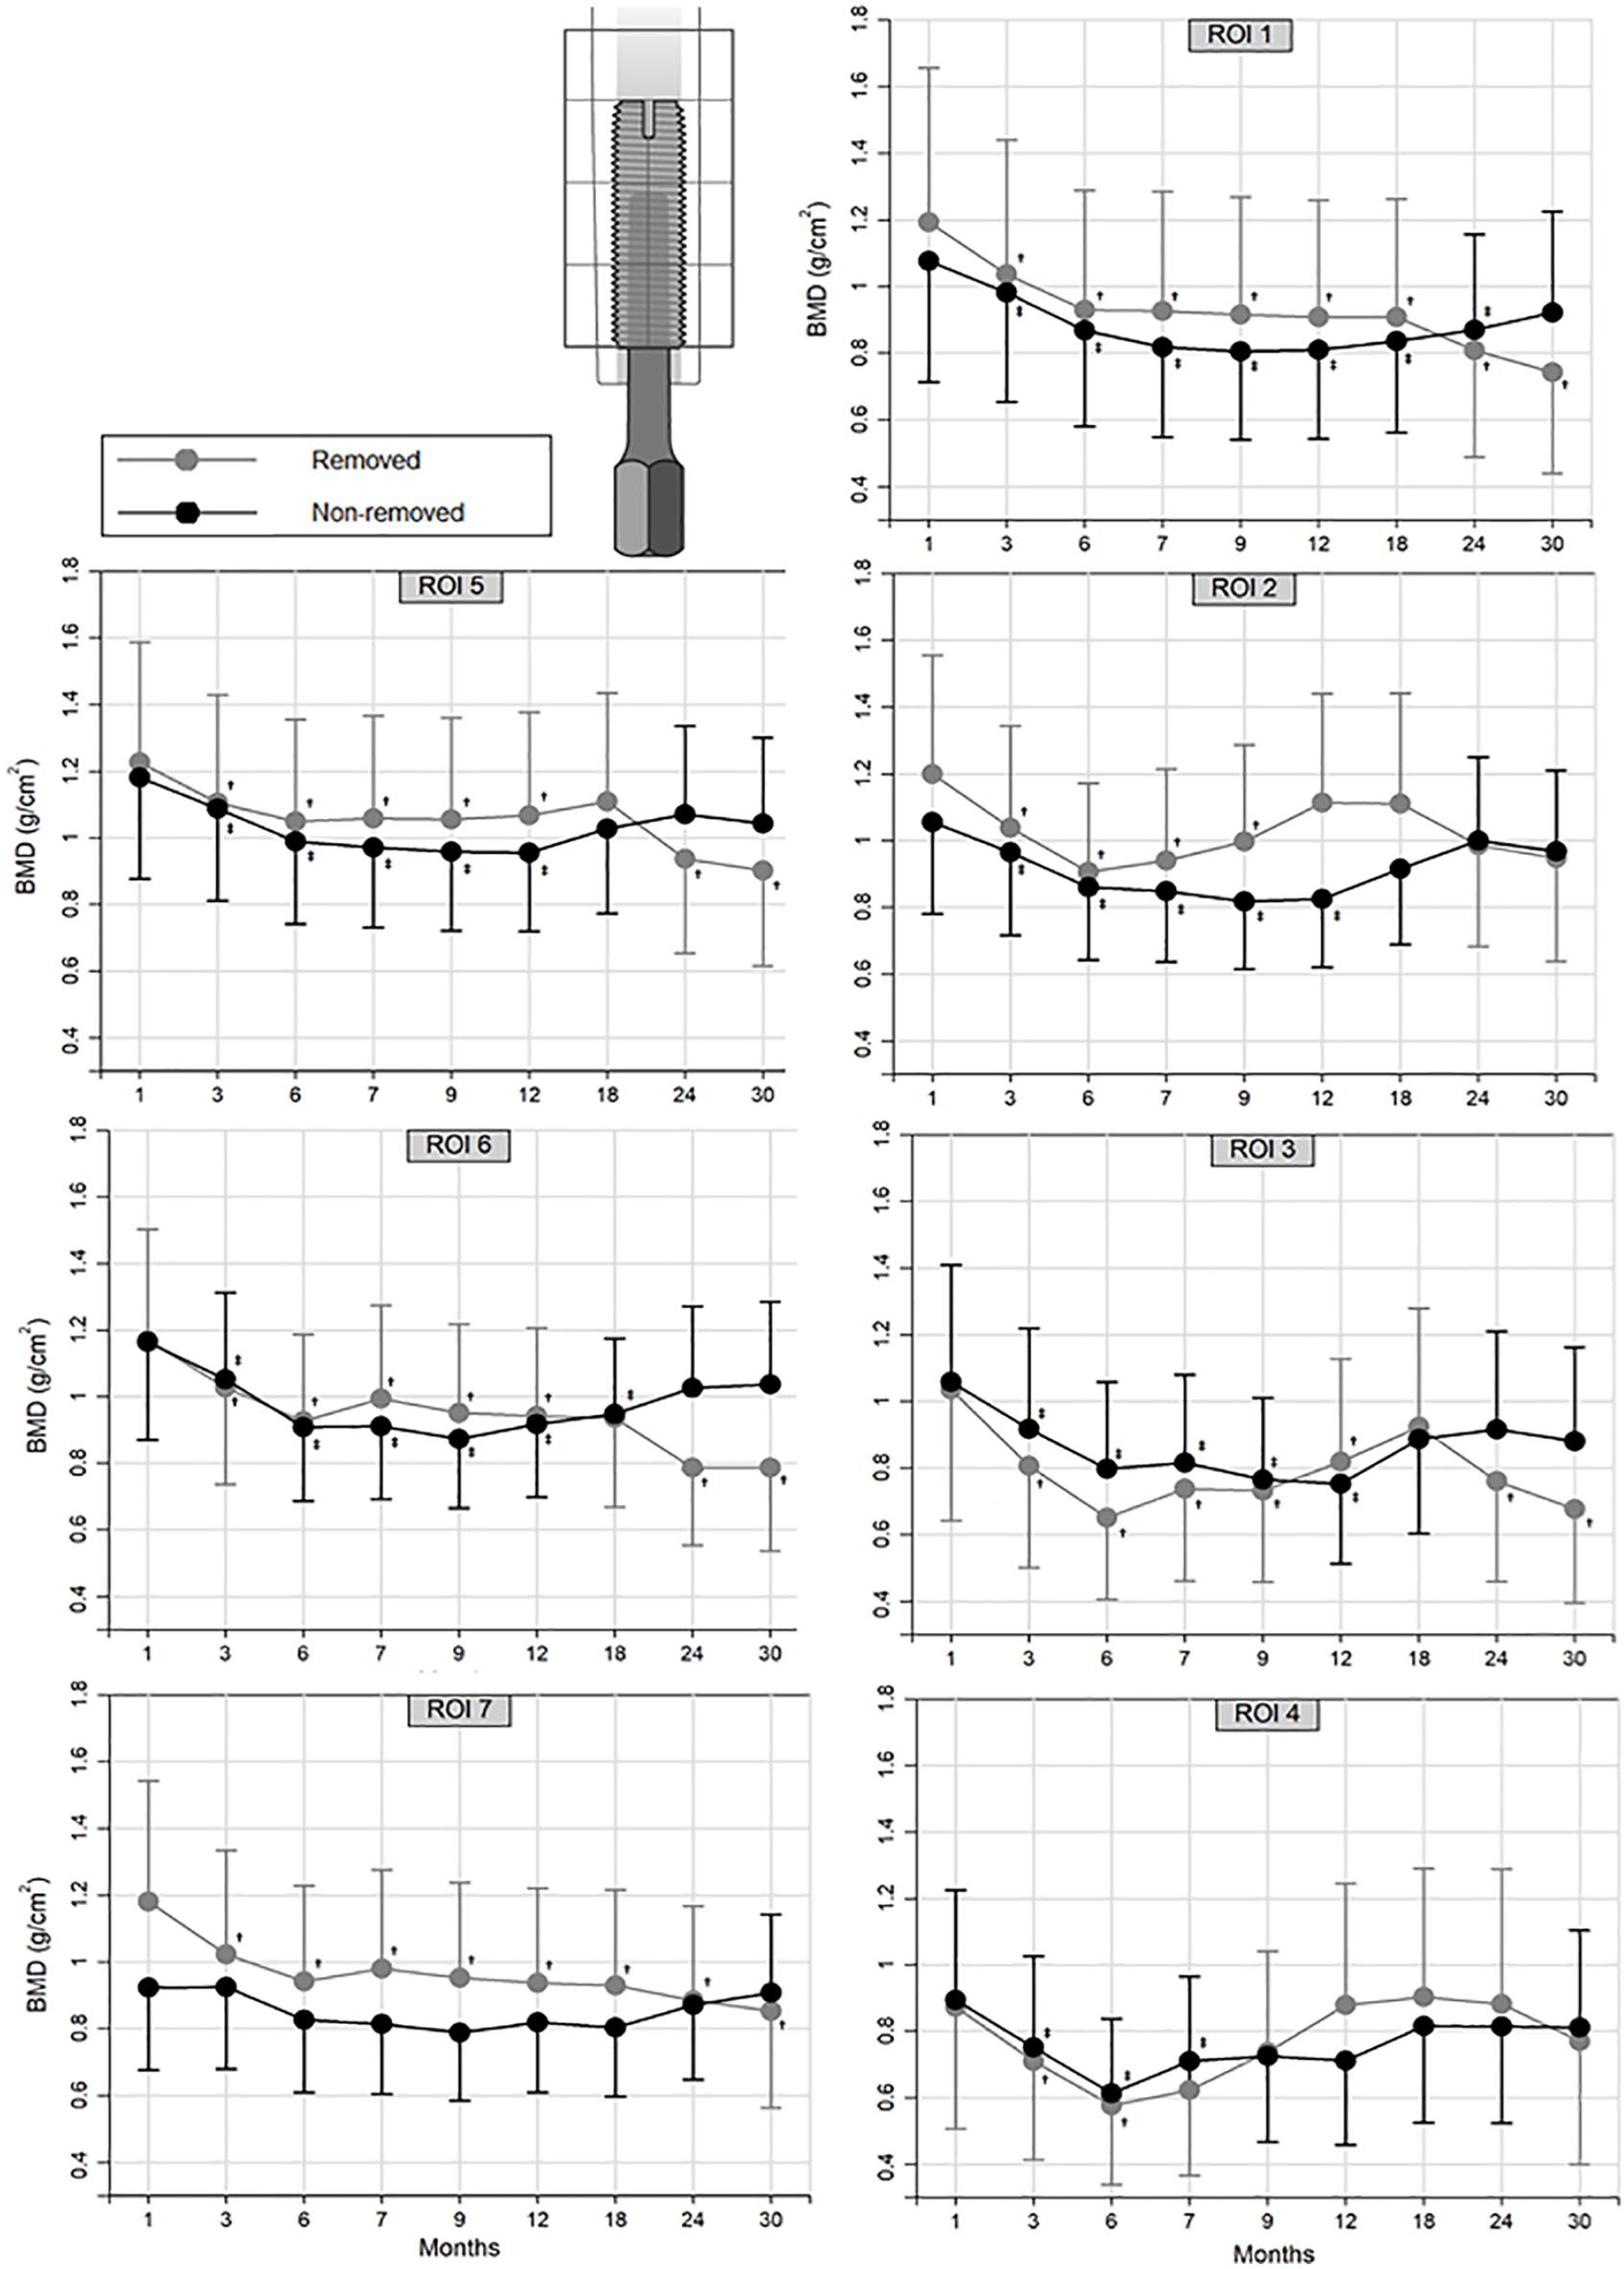
Mean periprosthetic BMD (95% CI) in ROI 1–7 in patients with later-removed and non-removed OI implants during 30 months of follow-up. Significant BMD changes from the postoperative reference (1 month after S1 surgery) are labelled as (†) in the RI group (grey line) and (‡) in the NRI group (black line).
Comparison of variables at the last follow-up examination between patients with later-removed and non-removed OI implants.
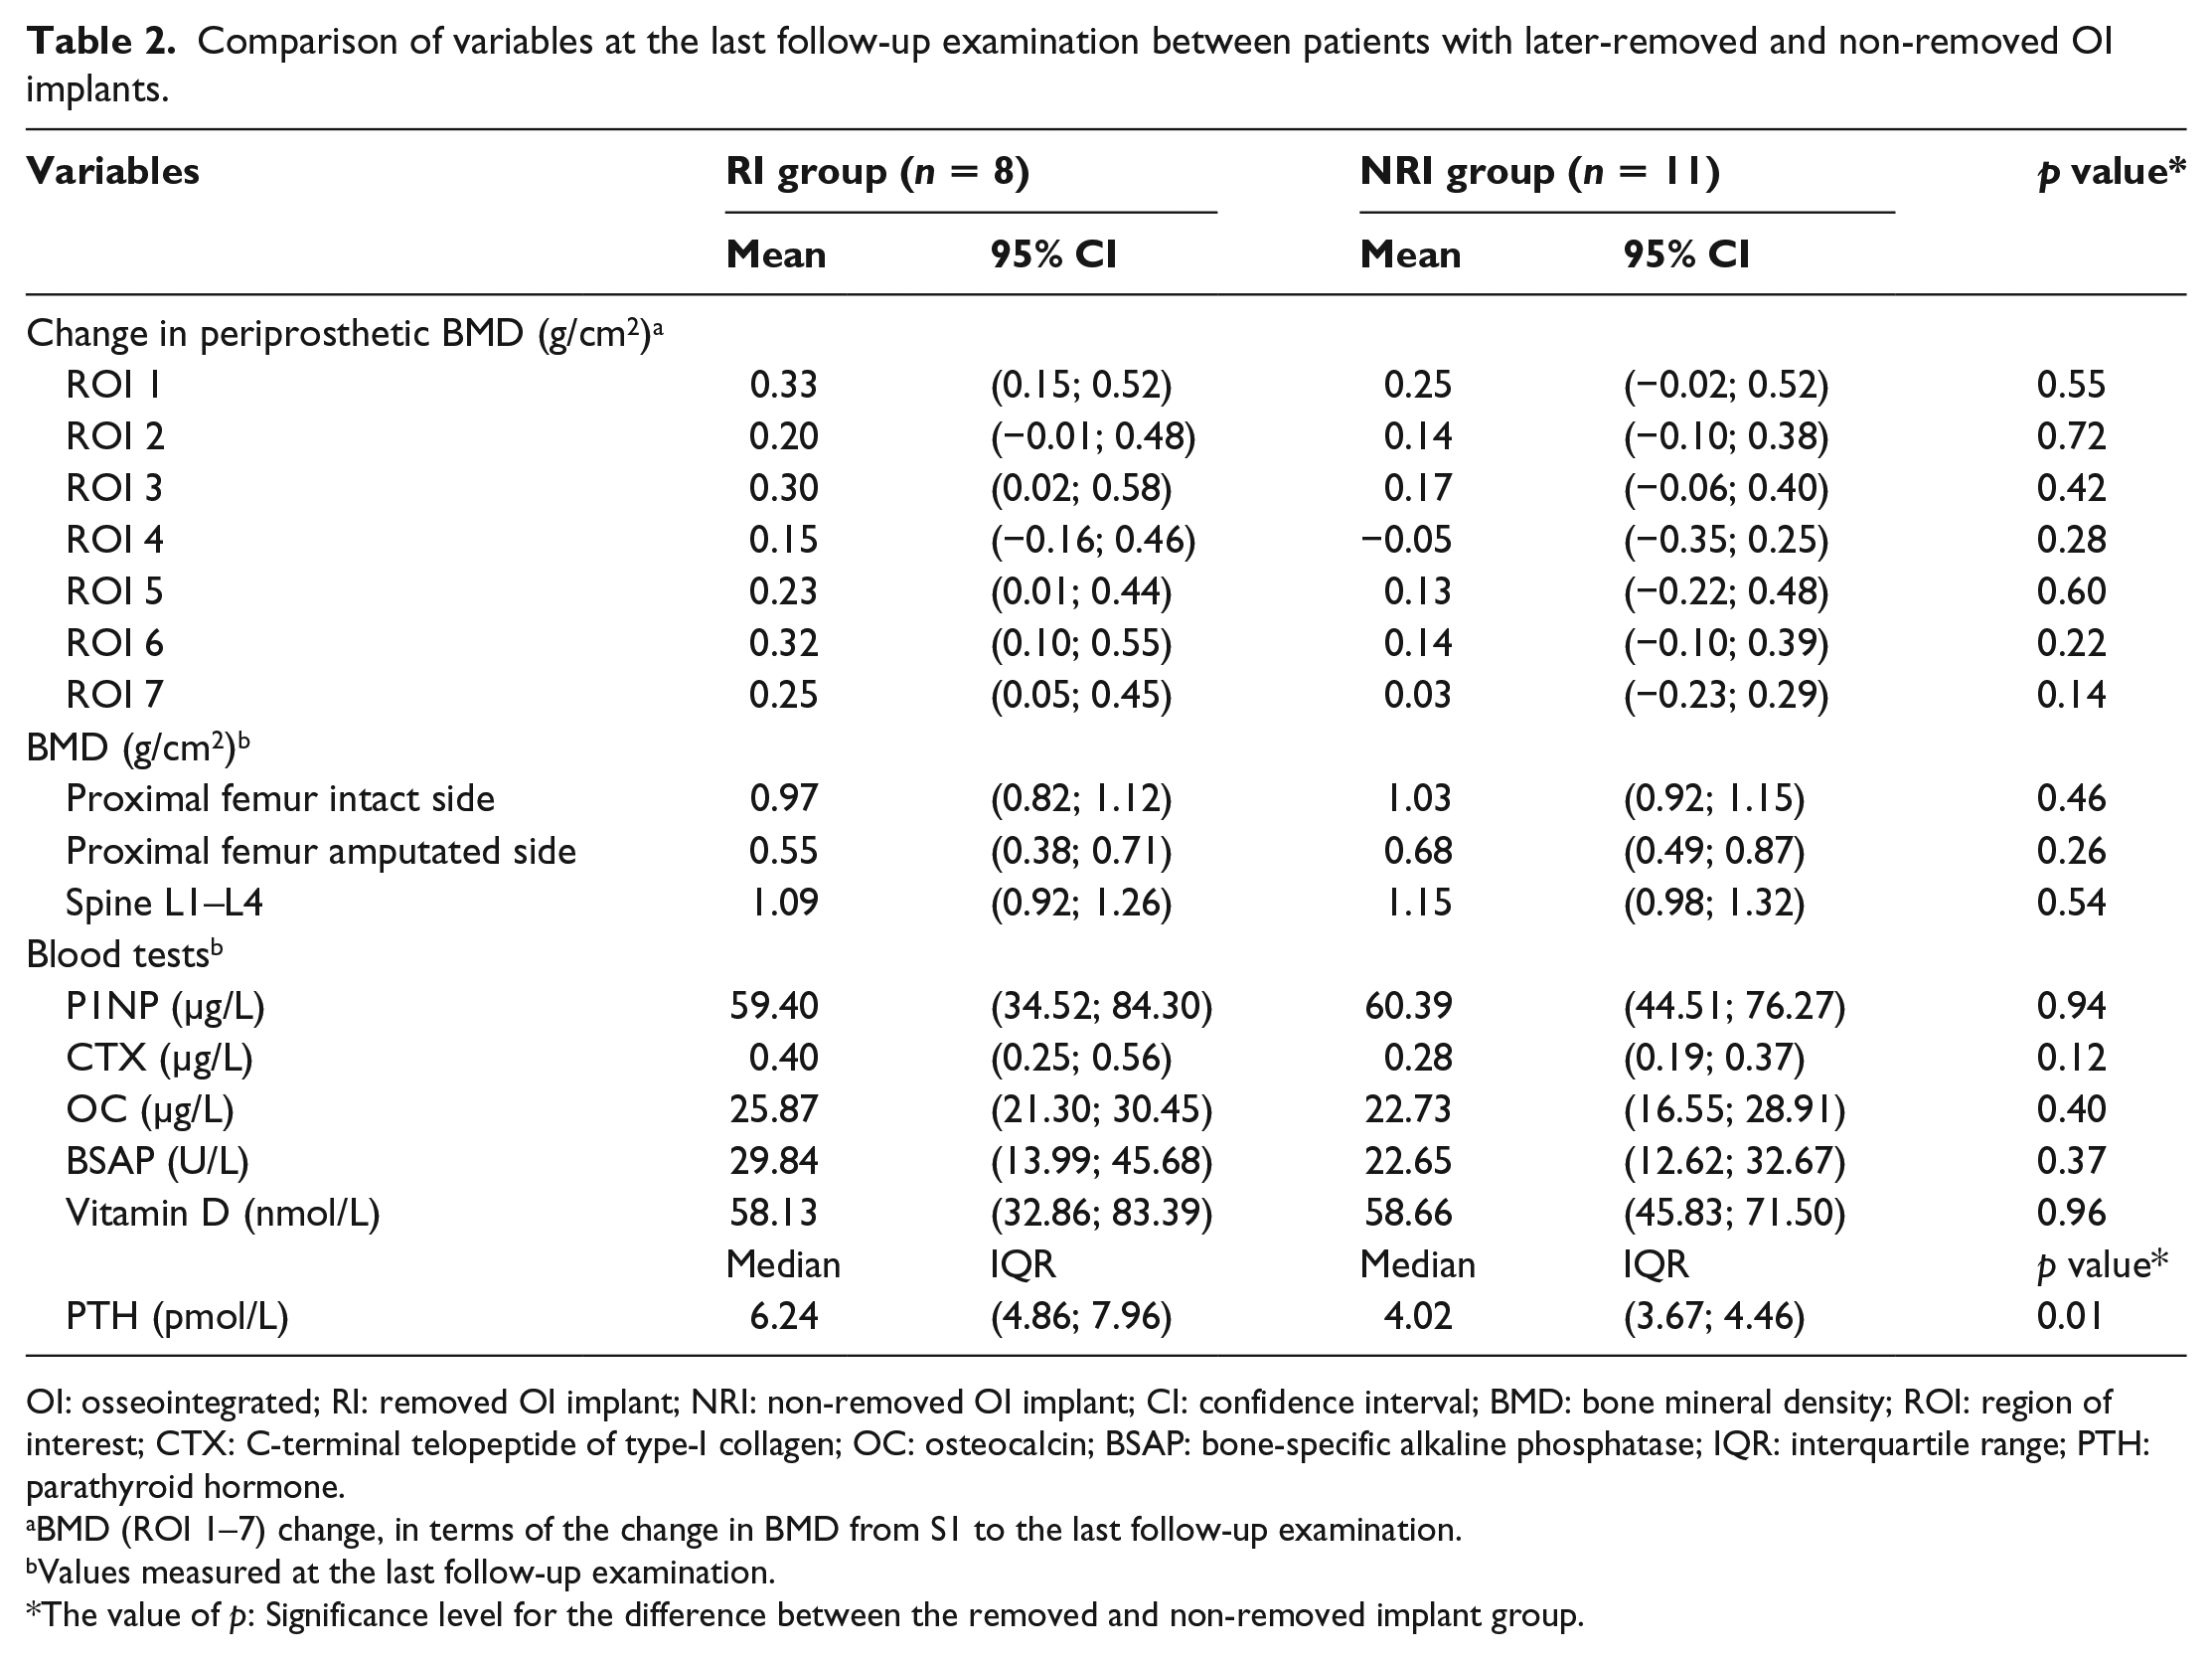
OI: osseointegrated; RI: removed OI implant; NRI: non-removed OI implant; CI: confidence interval; BMD: bone mineral density; ROI: region of interest; CTX: C-terminal telopeptide of type-I collagen; OC: osteocalcin; BSAP: bone-specific alkaline phosphatase; IQR: interquartile range; PTH: parathyroid hormone.
BMD (ROI 1–7) change, in terms of the change in BMD from S1 to the last follow-up examination.
Values measured at the last follow-up examination.
The value of p: Significance level for the difference between the removed and non-removed implant group.
Mean proximal femur BMD on the amputated side dropped by 9% (95% CI = 4; 13) 6 months after S1 surgery and remained low during most follow-ups compared to preoperative values (Figure 3, p < 0.027). Mean proximal femur BMD on the intact side remained unchanged at all time points (p > 0.23). There was no difference in mean proximal femur BMD between the RI and NRI groups at any follow-up examinations (p > 0.20). Mean lumbar spine BMD remained unchanged during the 30-month follow-up (p > 0.68), and there was no difference between the RI and NRI groups at any time points (p > 0.35).
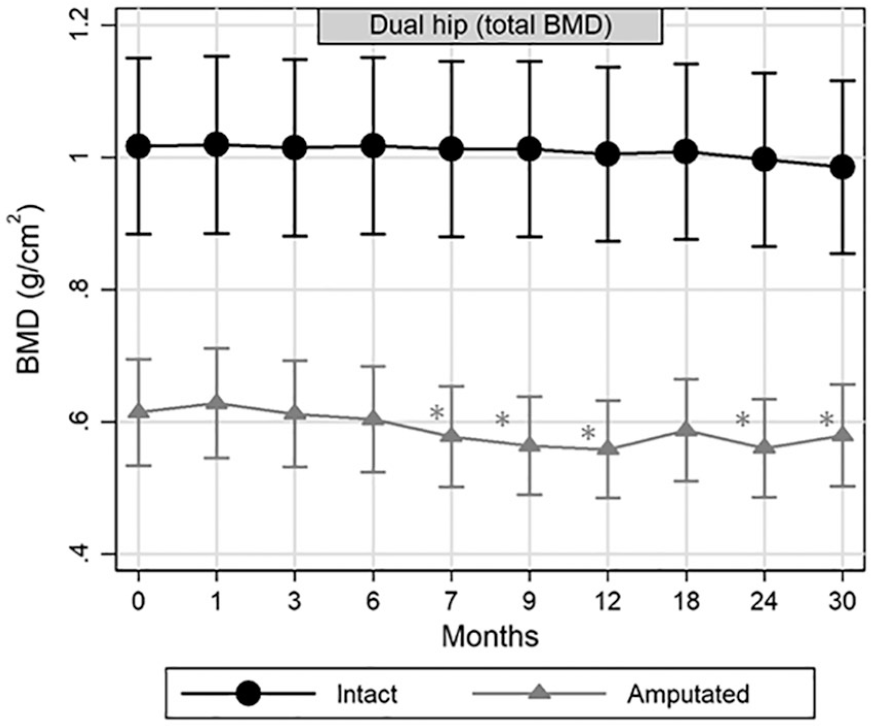
Mean proximal femur (total hip) BMD (95% CI) in the amputated and intact side during 30 months of follow-up. Significant BMD changes from the preoperative baseline are labelled as (*).
The precision (RMS-CV) of BMD measurements was 3.1%–6.6% for ROIs 1–7, 1.2% for the spine (L1–L4), 2.1% for the proximal femur (total hip) on the amputated side and 1.1% for the proximal femur on the intact side.
Blood samples
At the cohort level, mean P1NP, CTX and BSAP concentrations increased 1 month after the S1 surgery by 130% (95% CI = 93; 175), 44% (95% CI = 16; 79) and 166% (95% CI = 111; 236), respectively (p = 0.001). The longitudinal analysis (Figure 4) showed a significant difference in the mean OC concentrations at baseline (p = 0.003) and in the mean CTX concentrations at 18 and 24 months (p < 0.05) between the RI and the NRI groups, whereas no difference was found in the last follow-up analysis (Table 2, p > 0.12). The longitudinal analysis showed significantly higher mean PTH concentrations in the RI group during the first 18 months compared to the NRI group (Figure 4, p < 0.048). A similar median group difference was found in the last follow-up analysis (Table 2, p = 0.01).
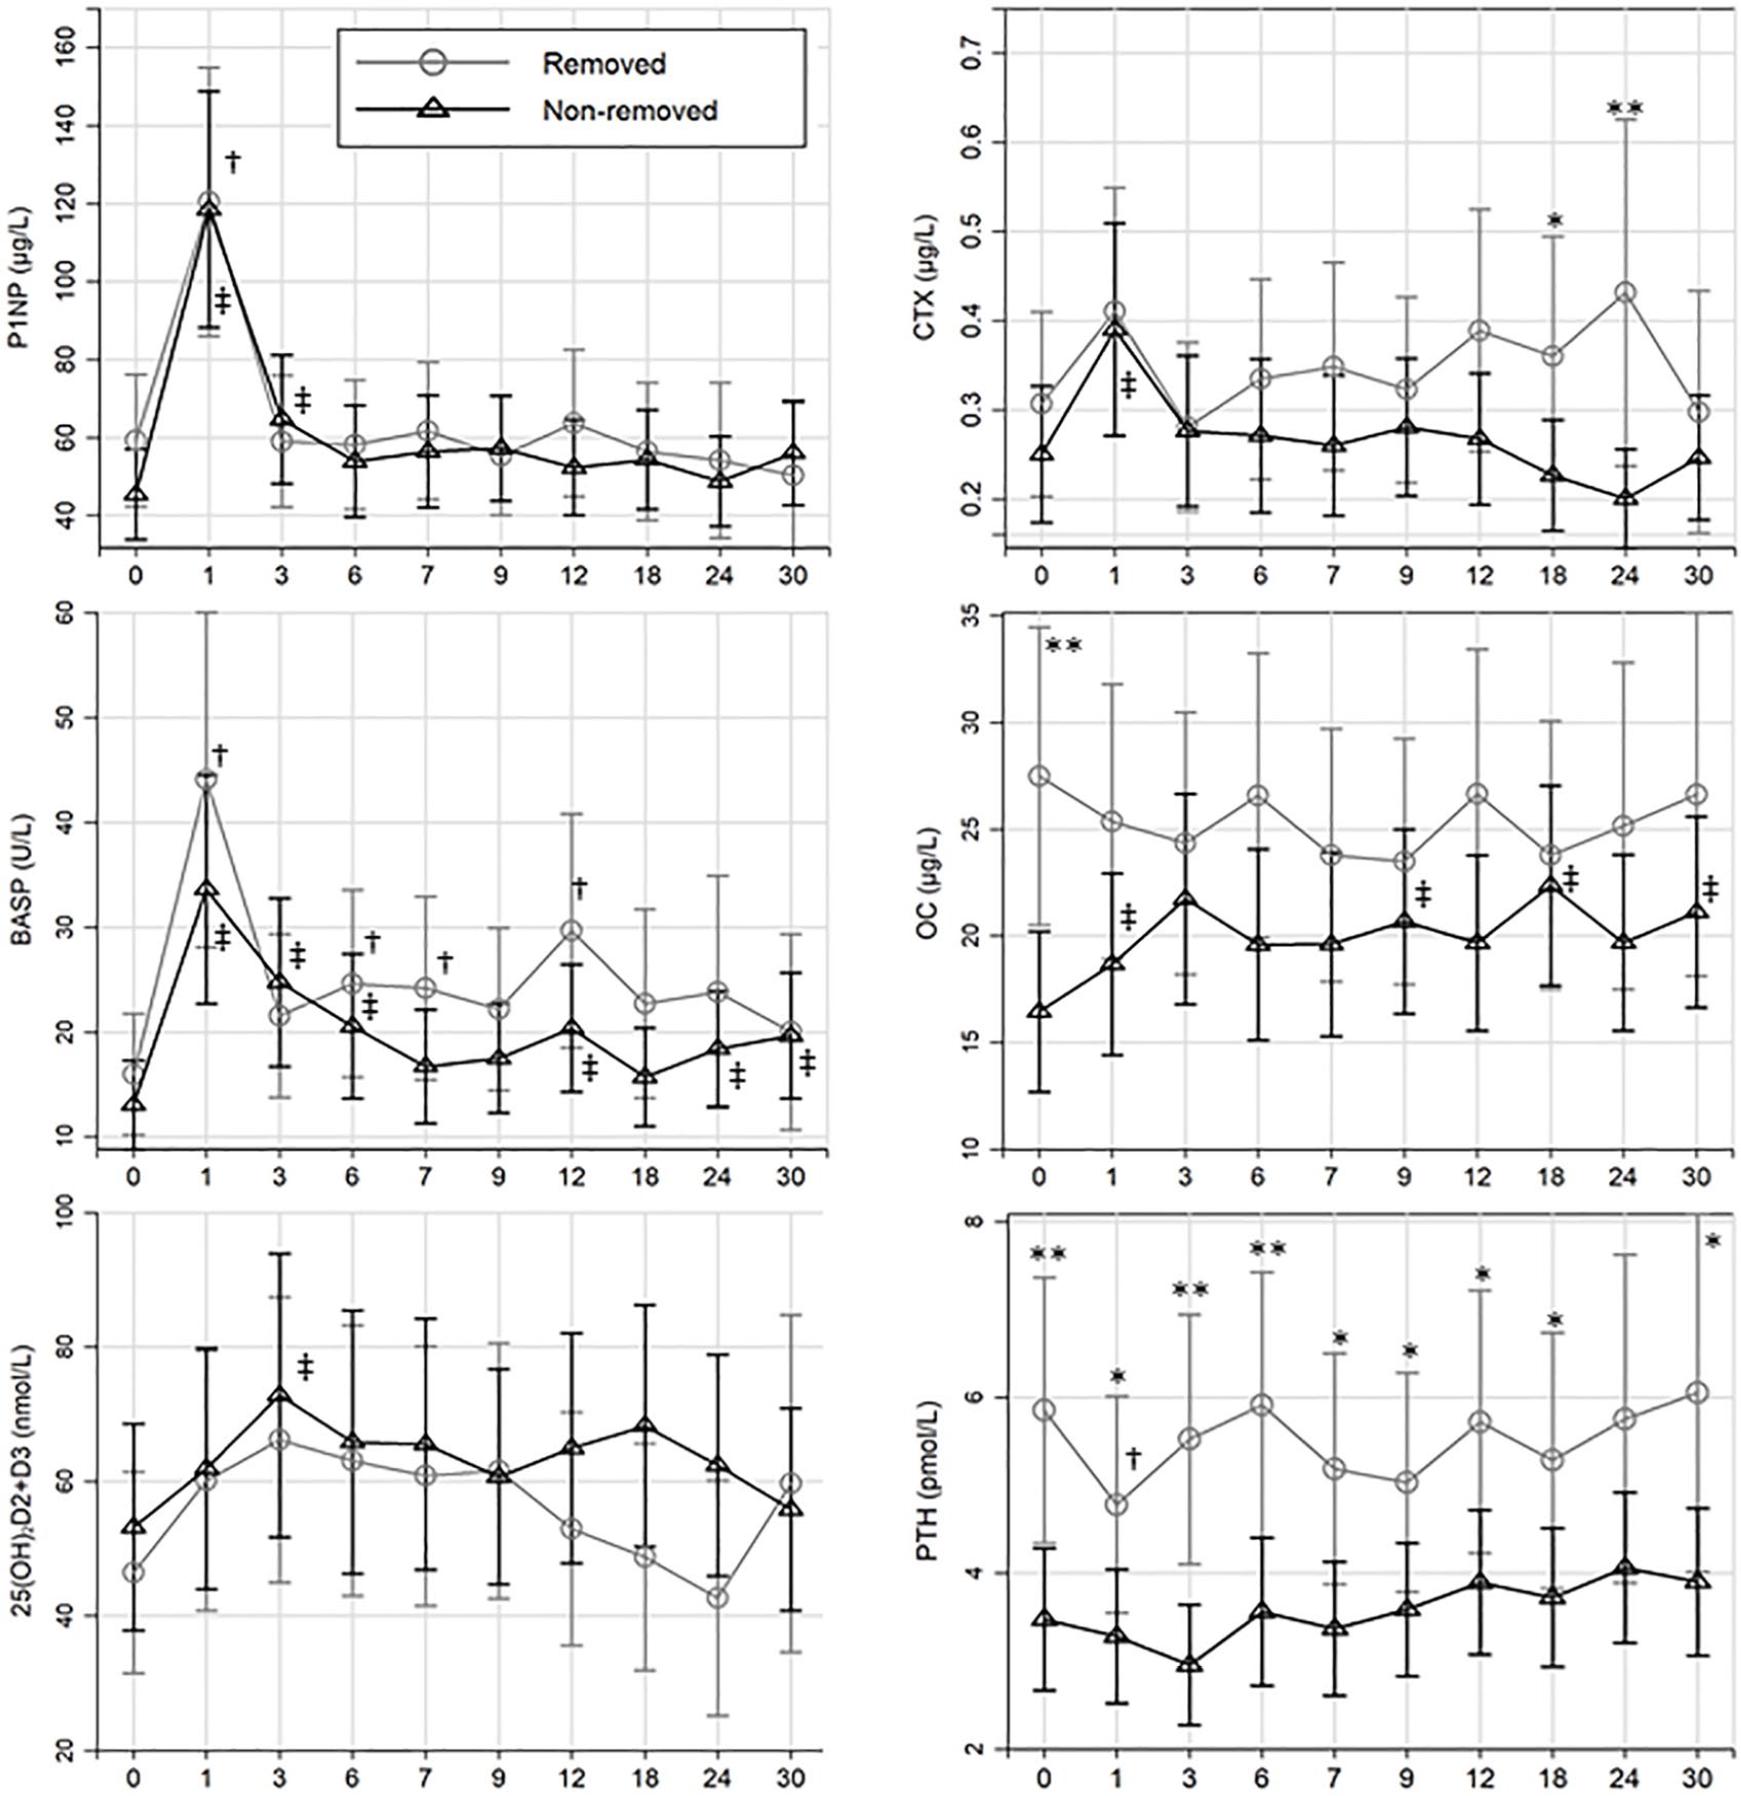
Mean serum concentrations (95% CI) at each time point in the removed and non-removed group. Significant group difference (*p < 0.05 and **p < 0.005); significant changes from the preoperative baseline (0) in the removed group (†) and the non-removed group (‡).
Predictors of implant removal
None of the preoperative variables or BMD changes in ROI 1–7 presented in Table 3 were significant predictors of implant removal (p > 0.07).
Odds ratio of OI implant removal during 3 years of follow-up.
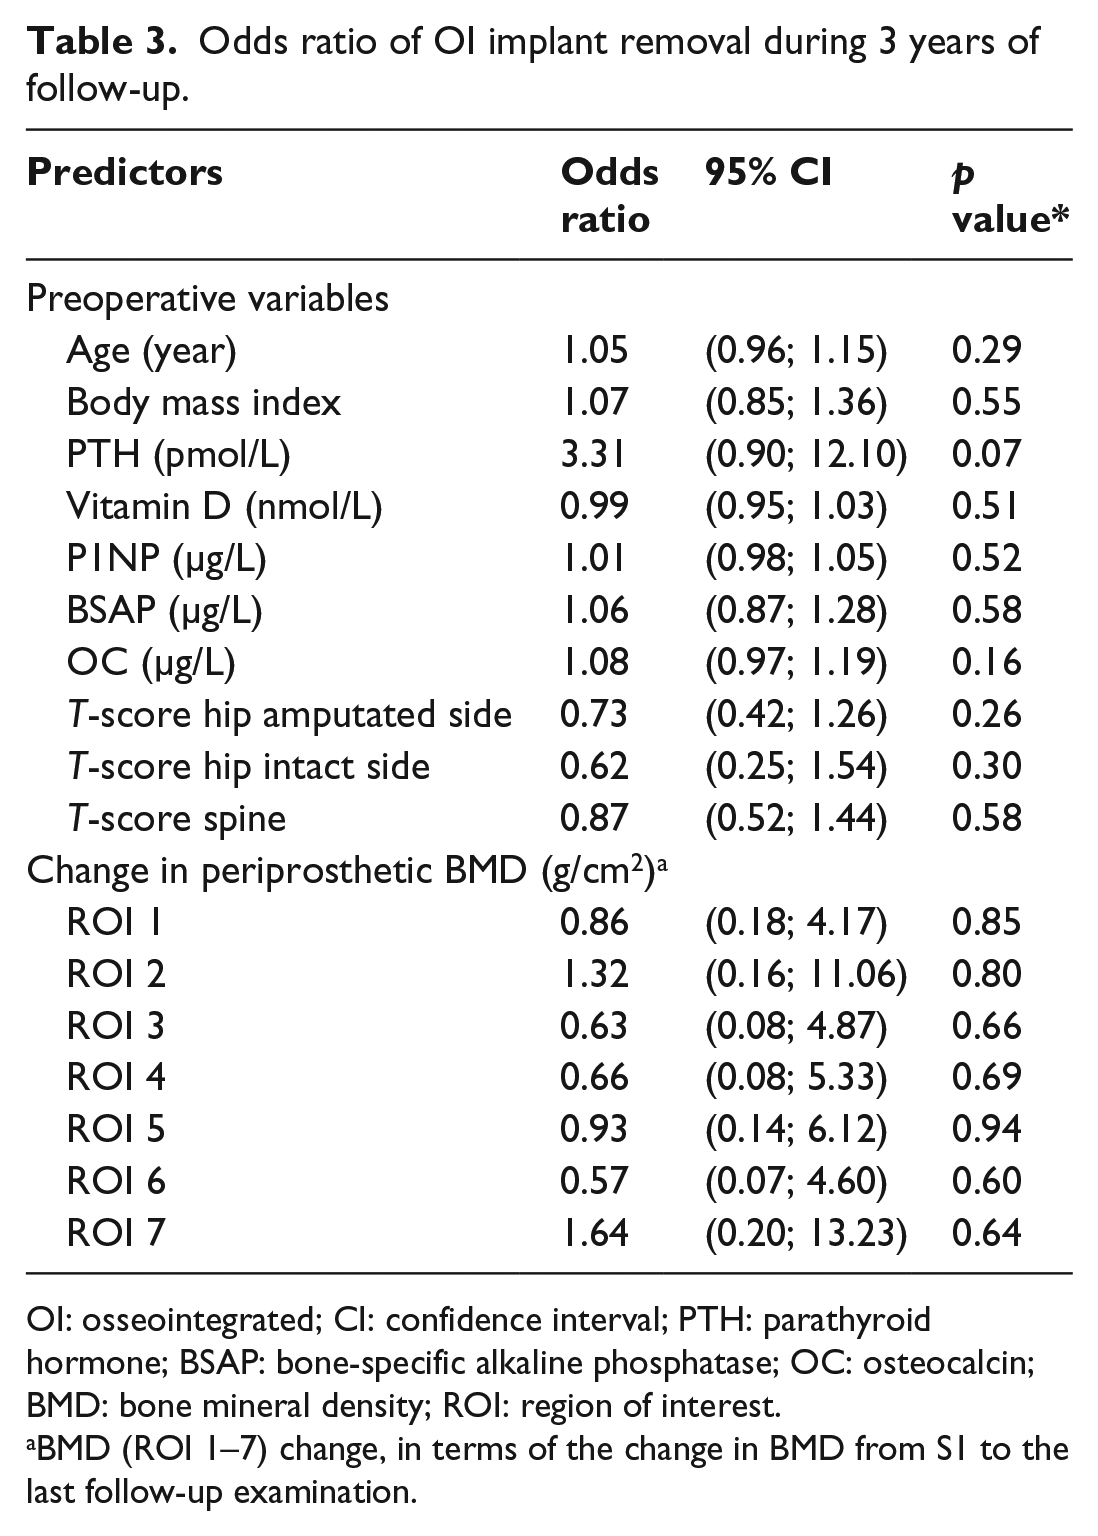
OI: osseointegrated; CI: confidence interval; PTH: parathyroid hormone; BSAP: bone-specific alkaline phosphatase; OC: osteocalcin; BMD: bone mineral density; ROI: region of interest.
BMD (ROI 1–7) change, in terms of the change in BMD from S1 to the last follow-up examination.
Discussion
This is the first study to evaluate the changes in BMD and in bone turnover after OI implant surgery. The BMD changes measured in patients with loose and intact OI implants add to the current understanding of the bone–implant interface in OI patients with transfemoral amputation.
Bone mineral density
We found that patients with transfemoral amputation had a low BMD in the proximal femur on the amputated side, whereas BMD was similar to the control group on the intact side. This finding was also previously shown in DXA studies of people with lower limb amputations, suggesting that low BMD was likely due to disuse atrophy.9,10 Disuse atrophy is caused by reduced weight bearing on the femoral bone, as most of the weight load transfer from the leg to the body core is transferred via the prosthetic socket to the surrounding soft tissue and the ischial tuberosity. In addition, physical disability is commonly followed by a low activity level, and consequently, the combined effect of reduced weight bearing and low activity level caused demineralization in the residual bone. 20
Computed tomography (CT) finite-element studies have suggested that net negative bone remodelling around OI implants was caused by stress shielding imposed by the new loading conditions. 21 The periprosthetic BMD decreased up to 33% in all ROIs during the OI phase between the S1 and S2 surgeries. The BMD changes were, at this point, not caused by stress shielding since the OI implants were not subjected to weight bearing. These changes may partly be explained by disuse atrophy after amputation;10,22 however, all patients were already amputated and had a low BMD in the residual femur bone. Consequently, additional non-use atrophy in the residual femur occurred after the S1 surgery until the patients commenced weight bearing on the OI implant. We found that periprosthetic BMD in the NRI group normalized to baseline values at 30-month follow-up. It is uncertain why BMD did not increase above baseline values, but the endosteal resorption and cortical thinning observed on radiographs around the OI implant 23 may cause permanent changes in the femur bone, limiting further increase in BMD. A similar effect was observed on DXA scans after hip arthroplasty as BMD decreased due to stress shielding in the calcar region after 6 months and was followed by increased BMD in the distal regions after 1 year. 13 In the RI group, BMD remained below baseline values in most ROIs, which may be partly related to osteolytic changes after infection and partly related to disuse osteoporosis, as patients with pain during weight bearing typically have lower physical activity levels than those with well-functioning implants. 24 The findings in the RI group were also consistent with the excessive BMD loss found adjacent to clinically loose hip stems (aseptic loosening). 16
Our study showed that neither the periprosthetic BMD changes nor the preoperative T-score in the proximal femur or lumbar spine increased the OR of implant loosening. Likewise, earlier studies reported that even severe stress shielding adjacent to hip stems did not cause more adverse events (like aseptic loosening or infection) or affect the clinical outcome.25,26 However, the BMD loss in the RI group was related not only to stress shielding but also probably to the osteolytic changes that may occur after OI implant loosening/removal and the reduced weight-bearing and disuse atrophy that may occur due to pain.
Blood samples
Increased concentrations of P1NP, BSAP and CTX were expected as a response to bone remodelling after OI implant surgery and matched the response observed in fracture healing and in hip replacement studies.14,17 Earlier studies examined CTX as a surrogate marker of aseptic implant loosening15,16 as osteolysis led to increased bone resorption and type-I collagen degradation released CTX and NTX (N-terminal telopeptide of type-I collagen). 14 The investigators found that the mean CTX concentration in loose hip implants ranged from 0.32 to 0.43 µg/L.15,16 We measured a higher CTX concentration in the RI group at 18 and 24 months (0.36 and 0.43 µg/L) compared to OI implants that remained in situ. Increased CTX concentrations were found in the four OI implants that were removed due to septic loosening, as was also expected, since the inflammatory markers acted as proresorptive factors in the osteoclastogenesis and activation of bone resorption. 27
Occult vitamin D deficiency is common (43%) in people with lower limb amputations. 28 Thus, all patients in this study were referred to an endocrinologist upon measurements of biomarkers or the T-score outside the normal reference interval. The patients were screened for metabolic diseases and recommended to take calcium and vitamin D supplements. Surprisingly, the preoperative PTH concentrations were higher in the RI group than those in the NRI group and remained elevated during the first year. We found a trend that the odds (OR = 2.4) of implant loosening increased with elevated PTH concentrations. This association may be explained by continuous exposure of PTH, increasing the osteoblastic receptor activator of nuclear factor kappa-Β ligand (RANKL) production, which has proven to be a strong activator of osteoclastic bone resorption. 29 Increased osteoclastic activity and bone resorption around the OI implant would likely have affected the OI negatively and resulted in early removal of the OI implant. In contrast, animal studies using intermittent treatment with recombinant PTH stimulated osteoblast activity and improved OI. 30
OI implant removal
The Swedish Osseointegration Team removed 10 of 15 OI implants (Integrum AB) during the first 4 years 3 but were able to improve implant survival after implementing a standardized rehabilitation protocol. Later, they reported a 2-year OI implant survival rate of 92%. 4 We adapted the standardized rehabilitation protocol but were not able to reproduce a similar implant survival as 40% of our implants were removed within 30 months. Four OI implants (20%) were removed due to a deep infection, which was high compared to a recent study reporting that the 10-year cumulative risk of implant removal due to osteomyelitis was 9%. 31 The abutment is made of pure titanium, which has anti-infectious properties. However, a study reported that 90% of bacterial swabs from bone canal adjacent to the abutment were positive. 32 The challenge with the percutaneous abutment is that it provides a permanent open access to the bone and thereby increases the risk of an ascending intramedullary infection.
Limitations
Although the reference population used for matching was very large, we had to extend the matching criteria for 27 control patients. However, the patients with the largest age difference were young (<32 years), and the BMD difference between cases and controls caused by age was expectedly minimal. In addition, the control group consisted of patients with hip or knee osteoarthritis, and they are expected to have a lower activity level compared to a normal population. 33 As a consequence, the control group may have a lower BMD compared to an average population. Arbitrarily, we dichotomized the OI cohort into users (OI implants used/not removed) and non-users (OI implants removed for various reasons or patients used socket prosthesis). Accordingly, the non-user (RI) group was very heterogeneous. Yet, there was clear difference in the load type on the bone between groups (osseous load transfer vs soft-tissue load transfer or unloading), which made BMD comparison between groups relevant and interesting.
The circadian rhythm and food intake affect bone marker concentrations, and further vitamin D concentrations display seasonal variance; 14 thus, blood samples in the OI cohort were collected during daytime and analysed as batches to minimize analytical variability. To handle the missing data (four patients each missing three examinations), a linear mixed model was used to keep all the patients in the analysis. The data were evaluated using BLUPs, and neither BMD nor BTM was biased. We acknowledge that the small sample size and the patient group heterogeneity may increase the risk of type-II errors, and thus, interpretation of the results should focus on the 95% CI. 34
Conclusion
Four fixtures and three abutments were removed during the study period. A large periprosthetic BMD loss was observed between the S1 and S2 surgeries, probably due to non-use bone atrophy. Periprosthetic BMD around the implants that were later removed decreased at follow-up, which was likely due to septic/aseptic loosening and pain experienced by patients during use of their OI prostheses. In contrast, the BMD around surviving implants normalized to baseline values at 30-month follow-up. More investigations on periprosthetic BMD changes around OI implants are warranted as people with transfemoral amputations have a low BMD in the residual femur prior to surgery and the bone is greatly affected by loading and unloading mechanisms. PTH and CTX concentrations were higher among patients with removed implants compared to patients with non-removed implants at certain time points, indicating a higher bone remodelling or bone turnover. The results in this study offer insight into the mechanisms leading to septic and aseptic implant removal. The methods applied in this study can be used in the clinic to monitor the bone response related to rehabilitation (DXA) and to correct secondary hyperparathyroidism (vitamin D and PTH) prior to surgery or used as surrogate marker in implant loosening (CTX).
Footnotes
Appendix
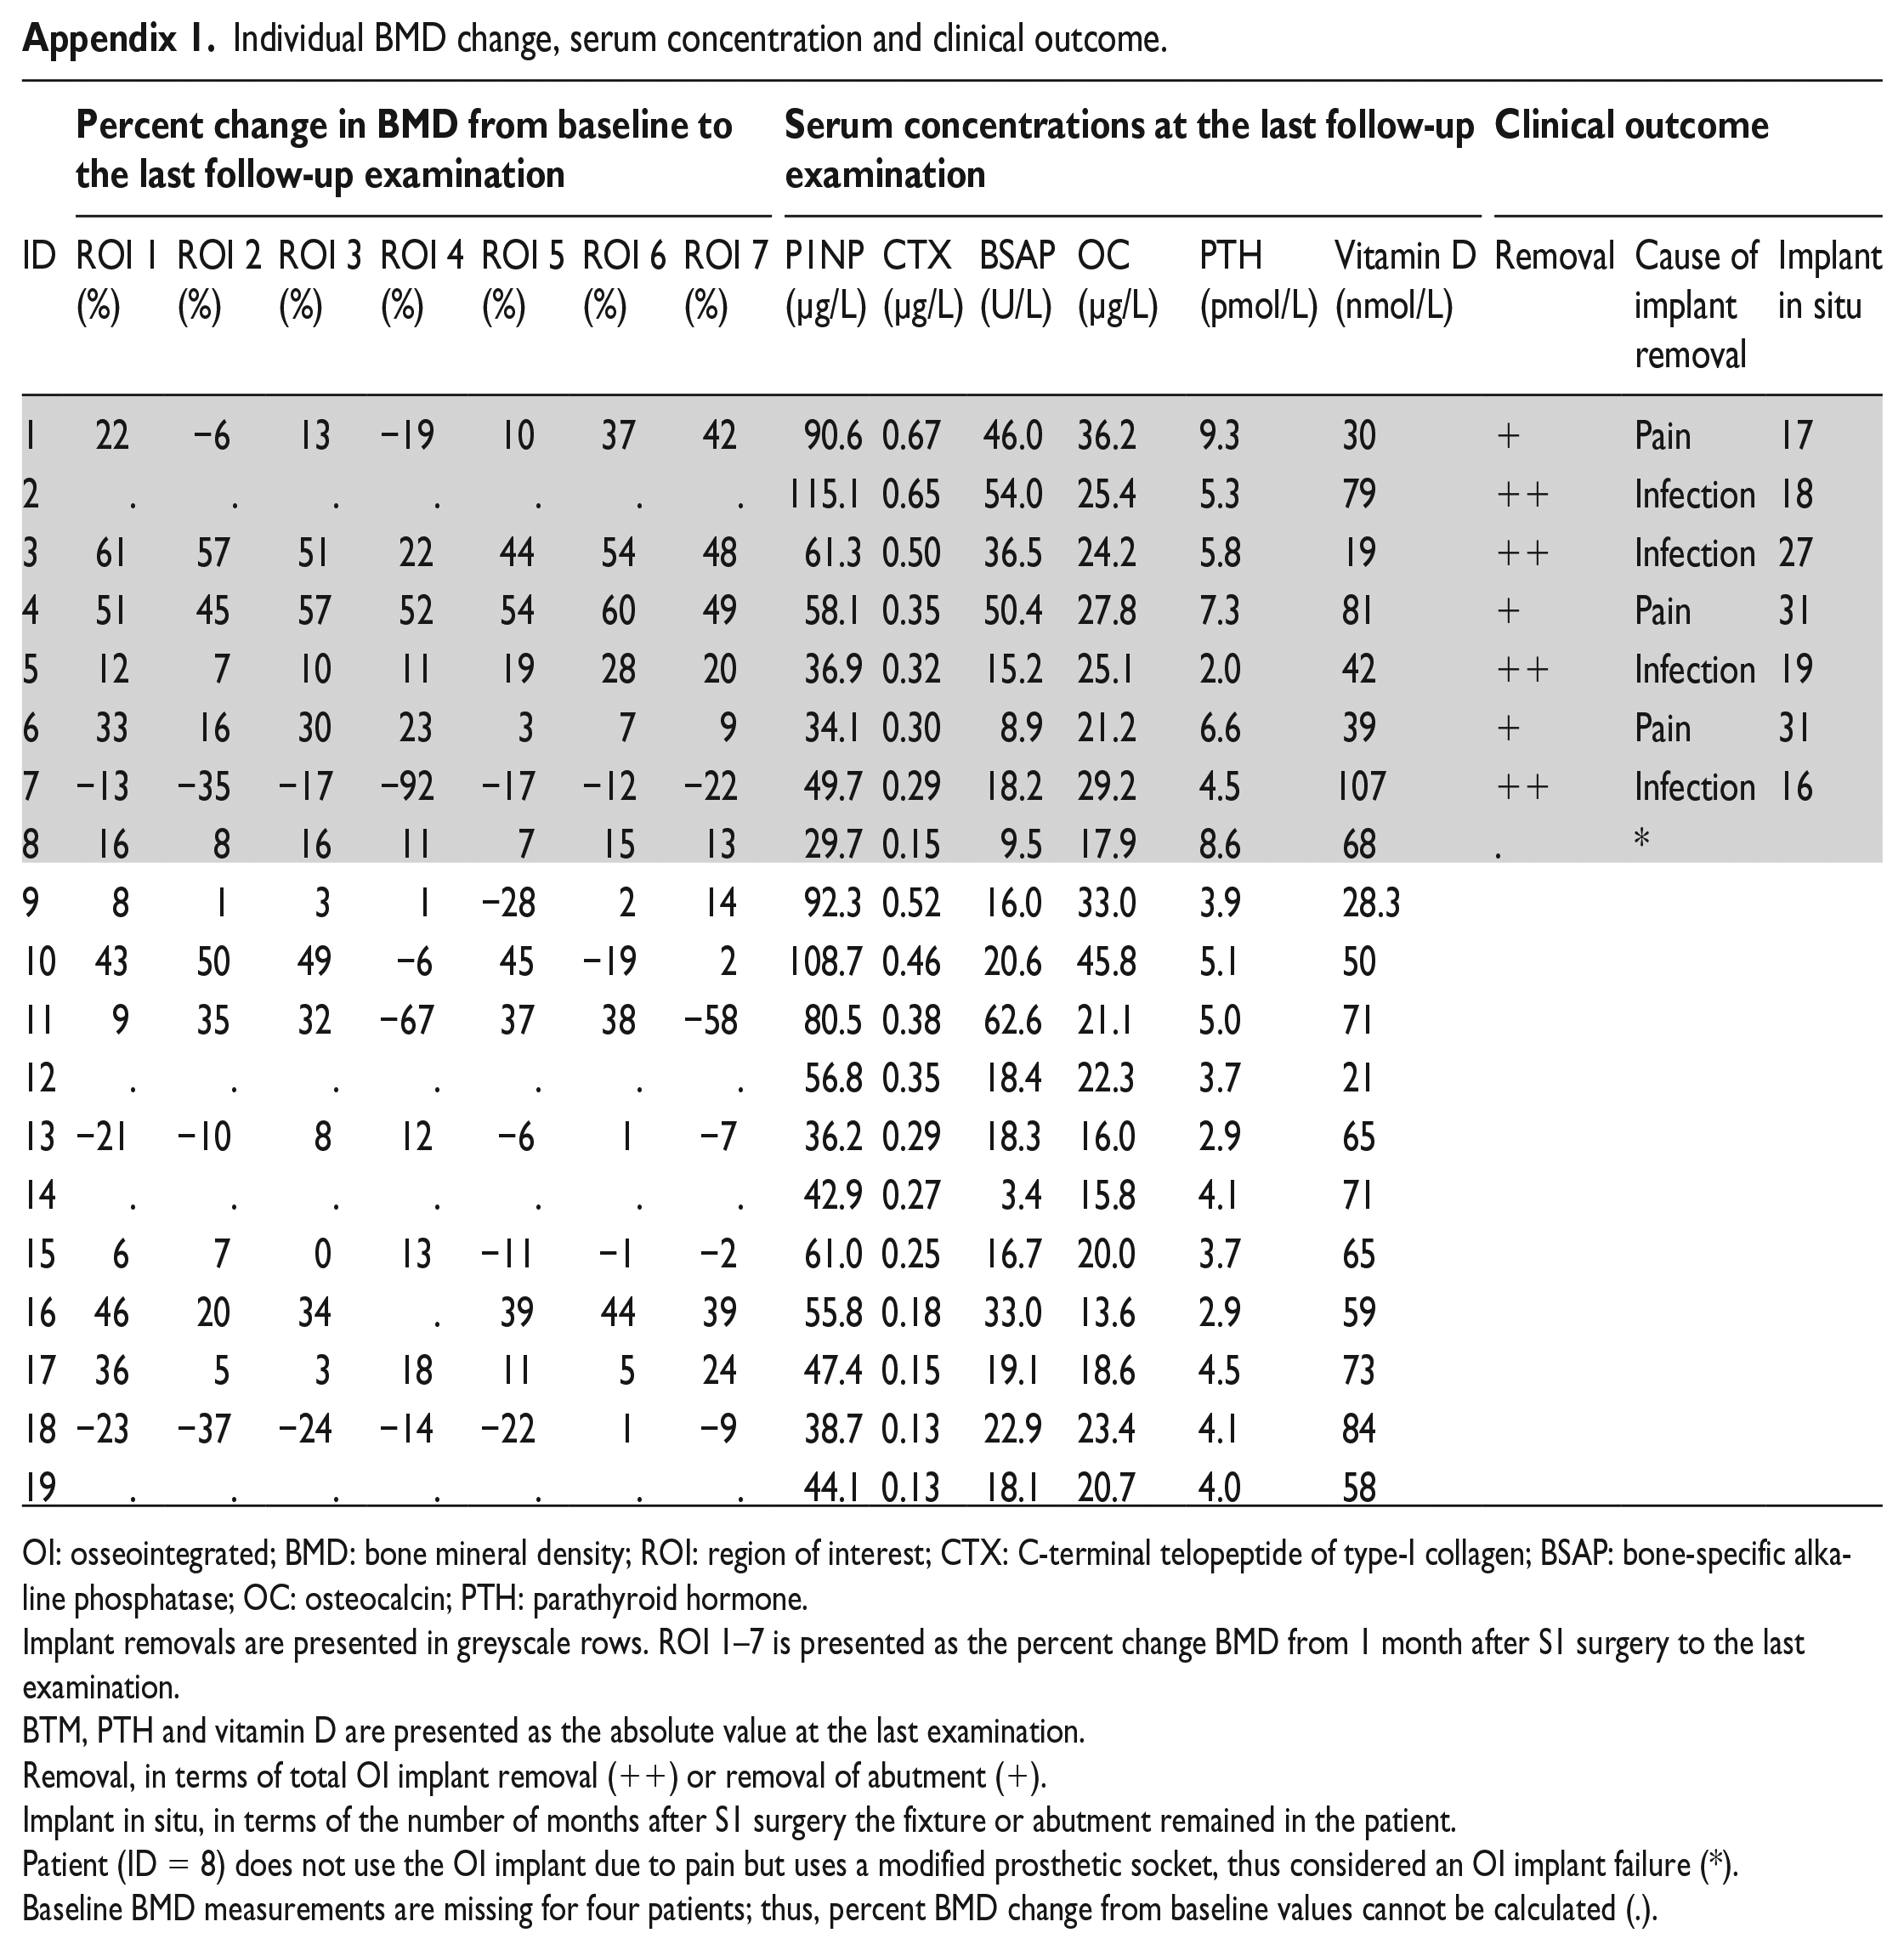
Individual BMD change, serum concentration and clinical outcome.
| Percent change in BMD from baseline to the last follow-up examination |
Serum concentrations at the last follow-up examination |
Clinical outcome |
||||||||||||||
|---|---|---|---|---|---|---|---|---|---|---|---|---|---|---|---|---|
| ID | ROI 1 (%) | ROI 2 (%) | ROI 3 (%) | ROI 4 (%) | ROI 5 (%) | ROI 6 (%) | ROI 7 (%) | P1NP (µg/L) | CTX (µg/L) | BSAP (U/L) | OC (µg/L) | PTH (pmol/L) | Vitamin D (nmol/L) | Removal | Cause of implant removal | Implant in situ |
| 1 | 22 | −6 | 13 | −19 | 10 | 37 | 42 | 90.6 | 0.67 | 46.0 | 36.2 | 9.3 | 30 | + | Pain | 17 |
| 2 | . | . | . | . | . | . | . | 115.1 | 0.65 | 54.0 | 25.4 | 5.3 | 79 | ++ | Infection | 18 |
| 3 | 61 | 57 | 51 | 22 | 44 | 54 | 48 | 61.3 | 0.50 | 36.5 | 24.2 | 5.8 | 19 | ++ | Infection | 27 |
| 4 | 51 | 45 | 57 | 52 | 54 | 60 | 49 | 58.1 | 0.35 | 50.4 | 27.8 | 7.3 | 81 | + | Pain | 31 |
| 5 | 12 | 7 | 10 | 11 | 19 | 28 | 20 | 36.9 | 0.32 | 15.2 | 25.1 | 2.0 | 42 | ++ | Infection | 19 |
| 6 | 33 | 16 | 30 | 23 | 3 | 7 | 9 | 34.1 | 0.30 | 8.9 | 21.2 | 6.6 | 39 | + | Pain | 31 |
| 7 | −13 | −35 | −17 | −92 | −17 | −12 | −22 | 49.7 | 0.29 | 18.2 | 29.2 | 4.5 | 107 | ++ | Infection | 16 |
| 8 | 16 | 8 | 16 | 11 | 7 | 15 | 13 | 29.7 | 0.15 | 9.5 | 17.9 | 8.6 | 68 | . | * | |
| 9 | 8 | 1 | 3 | 1 | −28 | 2 | 14 | 92.3 | 0.52 | 16.0 | 33.0 | 3.9 | 28.3 | |||
| 10 | 43 | 50 | 49 | −6 | 45 | −19 | 2 | 108.7 | 0.46 | 20.6 | 45.8 | 5.1 | 50 | |||
| 11 | 9 | 35 | 32 | −67 | 37 | 38 | −58 | 80.5 | 0.38 | 62.6 | 21.1 | 5.0 | 71 | |||
| 12 | . | . | . | . | . | . | . | 56.8 | 0.35 | 18.4 | 22.3 | 3.7 | 21 | |||
| 13 | −21 | −10 | 8 | 12 | −6 | 1 | −7 | 36.2 | 0.29 | 18.3 | 16.0 | 2.9 | 65 | |||
| 14 | . | . | . | . | . | . | . | 42.9 | 0.27 | 3.4 | 15.8 | 4.1 | 71 | |||
| 15 | 6 | 7 | 0 | 13 | −11 | −1 | −2 | 61.0 | 0.25 | 16.7 | 20.0 | 3.7 | 65 | |||
| 16 | 46 | 20 | 34 | . | 39 | 44 | 39 | 55.8 | 0.18 | 33.0 | 13.6 | 2.9 | 59 | |||
| 17 | 36 | 5 | 3 | 18 | 11 | 5 | 24 | 47.4 | 0.15 | 19.1 | 18.6 | 4.5 | 73 | |||
| 18 | −23 | −37 | −24 | −14 | −22 | 1 | −9 | 38.7 | 0.13 | 22.9 | 23.4 | 4.1 | 84 | |||
| 19 | . | . | . | . | . | . | . | 44.1 | 0.13 | 18.1 | 20.7 | 4.0 | 58 | |||
OI: osseointegrated; BMD: bone mineral density; ROI: region of interest; CTX: C-terminal telopeptide of type-I collagen; BSAP: bone-specific alkaline phosphatase; OC: osteocalcin; PTH: parathyroid hormone.
Implant removals are presented in greyscale rows. ROI 1–7 is presented as the percent change BMD from 1 month after S1 surgery to the last examination.
BTM, PTH and vitamin D are presented as the absolute value at the last examination.
Removal, in terms of total OI implant removal (++) or removal of abutment (+).
Implant in situ, in terms of the number of months after S1 surgery the fixture or abutment remained in the patient.
Patient (ID = 8) does not use the OI implant due to pain but uses a modified prosthetic socket, thus considered an OI implant failure (*).
Baseline BMD measurements are missing for four patients; thus, percent BMD change from baseline values cannot be calculated (.).
Acknowledgements
We thank Inger Krog-Mikkelsen, from the Orthopaedic Research Unit, for assisting with DXA scans, collecting blood samples and managing the logistics of this study.
Author contribution
R.L.H, B.L.L., P.H.J., K.K.P., K.S. and M.S. designed the study, R.L.H. and M.S. drafted the manuscript. P.H.J. and K.K.P. performed the surgical procedures. M.S., P.H.J., K.K.P., B.L.L. and K.S. contributed in critical revision of the manuscript.
Associate Editor: Brian Hafner
Declaration of conflicting interests
The author(s) declared the following potential conflicts of interest with respect to the research, authorship and/or publication of this article: B.L.L. reports grants from Amgen and Novo Nordisk and personal fees from UCB, Eli Lilly and Amgen, outside the submitted work.
Funding
The author(s) disclosed receipt of the following financial support for the research, authorship and/or publication of this article: The main author R.L.H. reports a grant from the Disability Foundation (Vanføre Fonden).