
Abstract
Background:
Mechanical properties of prosthetic feet can significantly influence amputee gait, but how they vary with respect to limb loading and orientation is infrequently reported.
Objective:
The objective of this study is to measure stiffness and energy storage characteristics of prosthetic feet across limb loading and a range of orientations experienced in typical gait.
Study design:
This study included mechanical testing.
Methods:
Force–displacement data were collected at combinations of 15 sagittal and 5 coronal orientations and used to calculate stiffness and energy storage across prosthetic feet, stiffness categories, and heel wedge conditions.
Results:
Stiffness and energy storage were highly non-linear in both the sagittal and coronal planes. Across all prosthetic feet, stiffness decreased with greater heel, forefoot, medial, and lateral orientations, while energy storage increased with forefoot, medial, and lateral loading orientations. Stiffness category was proportional to stiffness and inversely proportional to energy storage. Heel wedge effects were prosthetic foot dependent.
Conclusion:
Orientation, manufacturer, stiffness category, and heel wedge inclusion greatly influenced stiffness and energy storage characteristics.
Clinical relevance
These results and an available graphical user interface tool may help improve clinical prescriptions by providing prosthetists with quantitative measures to compare prosthetic feet.
Background
Prosthetic feet help facilitate a more natural gait by attempting to emulate the biomechanical functions normally provided by the anatomical foot and ankle such as body support, propulsion, and balance control during stance. However, there is a lack of consensus from both researchers1,2 and clinicians3,4 on the criteria needed to inform the prescription process, which is often guided only by limited manufacturer recommendations (e.g., patient weight and intended activity level). Clinicians often rely on personal experience and empirical evidence when making prescription decisions.5,6 As a result, prosthetists often prescribe a small selection of prosthetic feet, 6 which may not be optimal for the patient. Previous research has sought to better inform prescriptions by developing a prosthetic foot emulator that allows patients to try more prosthetic feet 7 or by examining how different prosthetic foot properties affect walking performance.8–12 However, additional quantitative information on the mechanical properties of prosthetic feet over a broader range of conditions is needed to develop criteria that could help clinicians make more informed prescription decisions.
Both stiffness13–17 and energy storage and return18–20 properties have been shown to have a significant influence on amputee gait. As a result, a number of studies have attempted to quantify prosthetic foot stiffness21–25 or energy storage properties.21–28 These studies often make measurements for a few conditions: loading either the prosthetic heel to simulate heel strike or the forefoot keel to simulate toe off. Others have tested prosthetic feet at additional sagittal plane angles,24,28 but did not vary the coronal plane angle, thus limiting data to a single plane. In addition, studies often make measurements at different ranges of force to calculate stiffness, which makes comparisons across studies difficult. For example, some have used a specific region of the force–displacement curve to calculate an instantaneous stiffness, 25 while others have used the entire force–displacement curve to calculate a mean stiffness.21,22,24,29 Because the stiffness properties of a prosthetic foot are most likely non-linear across the force–displacement curve, using different conditions to determine prosthetic foot stiffness will likely lead to inconsistencies between studies.
Although many previous studies have measured energy storage and return efficiency,21–27 few have measured the energy storage capacity 28 of various prostheses. Only measuring energy storage and return efficiency eliminates the ability to compare how much energy different prosthetic feet can store. Because many previous studies only tested prostheses in the sagittal plane, it cannot be determined how various prostheses store and return energy in coronal plane loading conditions.
The ability to make direct comparisons of the mechanical properties between various prosthetic feet is necessary if these properties are to inform the clinician’s prescription decisions. Standardization of testing procedures would eliminate methodologic differences that prevent comparison between studies. Although not recommended as a prescription guide, the current testing standards for lower limb prostheses3,30 only specify linear stiffness testing at a few orientations (i.e., heel contact, toe contact, and foot flat for the American Orthotic & Prosthetic Association protocol and heel strike and toe off for International Organization for Standardization 10328). Such limited testing protocols do not capture the potential non-linear stiffness properties of prosthetic feet and make comparisons across prosthetic feet challenging.
The purpose of this study was to quantify the stiffness and energy storage characteristics of a variety of commonly prescribed prosthetic feet over the range of limb loading and orientations normally experienced during amputee gait. The outcomes of this study will provide a more complete characterization of mechanical properties and allow for quantitative comparisons between prosthetic feet to help inform clinical prescription decisions.
Methods
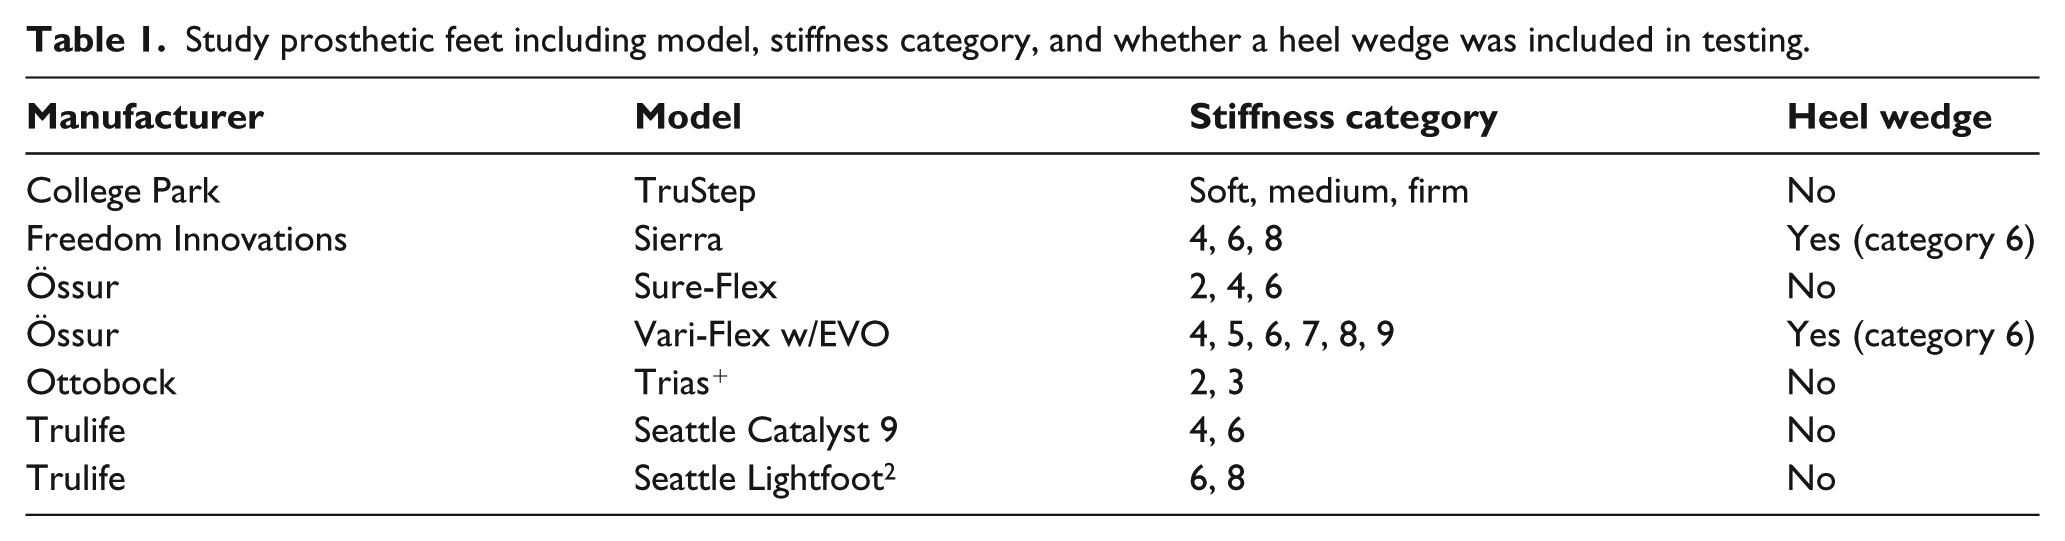
Prosthetic feet from five different manufacturers of various stiffness categories and heel wedge conditions were tested (Table 1). All were size 27 and all were tested with the manufacturer’s prosthetic foot cover.
Study prosthetic feet including model, stiffness category, and whether a heel wedge was included in testing.
To determine their mechanical properties, a Kistler force plate (Kistler Instrument Corporation; Amherst, NY, USA) rigidly mounted on an R-2000 Rotopod (Parallel Robotics System Corporation; Hampton, NH, USA) was used to collect the force–displacement data. The R-2000 is a 6-degree-of-freedom parallel robot with a horizontal mobile platform that allows translation and rotation in three directions.
A rigid fixture held the prosthetic foot to the frame of the robot. The prosthetic foot was initially aligned with the force plate in a foot flat orientation without a prosthetic foot cover (0° orientation in both the sagittal and coronal planes). Positive sagittal plane angles correspond to forefoot-loaded orientations and negative angles correspond to heel-loaded orientations. Positive coronal plane angles correspond to medial load orientations and negative angles correspond to lateral load orientations.
By altering the configuration of the Rotopod, the force plate orientation relative to the prosthetic foot was changed. All combinations of the 15 sagittal (−15°, −10°, −7.5°, −5°, −2°, −1°, 0°, 1°, 2°, 5°, 10°, 15°, 20°, 25°, 30°) and 5 coronal (−10°, −5°, 0°, 5°, 10°) orientations were tested, for a total of 75 test orientations. Each test began by rotating the Rotopod and force plate to the desired orientation. The force plate was then translated along the longitudinal axis of the pylon to load the prosthetic foot. Each prosthetic foot was loaded at a rate of 5 mm/s, while force–displacement data were collected at 250 Hz. The force data recorded were the components of force perpendicular to the force plate. A roller plate was used to reduce the tangential shear forces. If the friction between the force plate and the prosthetic foot was not enough to hold the prosthetic foot in place, the prosthesis would slip along the force plate. Any configurations where slippage occurred were discarded.
The testing load for each orientation was determined from previously collected walking data (Figure 1). From a group of individuals with transtibial amputations, a representative subject was chosen whose data (body mass (73.0 kg), self-selected walking speed (0.97 m/s), ground reaction forces (GRFs) filtered at 100 Hz, and pylon-ground angles) fell near the group mean. The kinetic and kinematic data from this subject were used to determine the vertical GRF at each sagittal orientation during stance. The vertical GRF data were scaled to represent the group body mass (88.2 kg) and standard deviation (11.0 kg). For each configuration, the sagittal orientation being tested determined the maximum load applied (i.e., 1 standard deviation greater than the mean vertical GRF at each orientation). There was no fixed range of motion as the applied load (independent variable) determined displacement. The range of coronal angles tested was determined from the same subject’s pylon-ground angles during a 1-m radius circle turning trial (methods described in the work by Segal et al. 31 ). The corresponding sagittal load was applied for each sagittal–coronal angle combination as the Rotopod was positioned to the desired sagittal and coronal angle, then moved along the longitudinal axis of the pylon to load the prosthetic foot and obtain corresponding the force–displacement data. A single load cycle was performed for each condition.
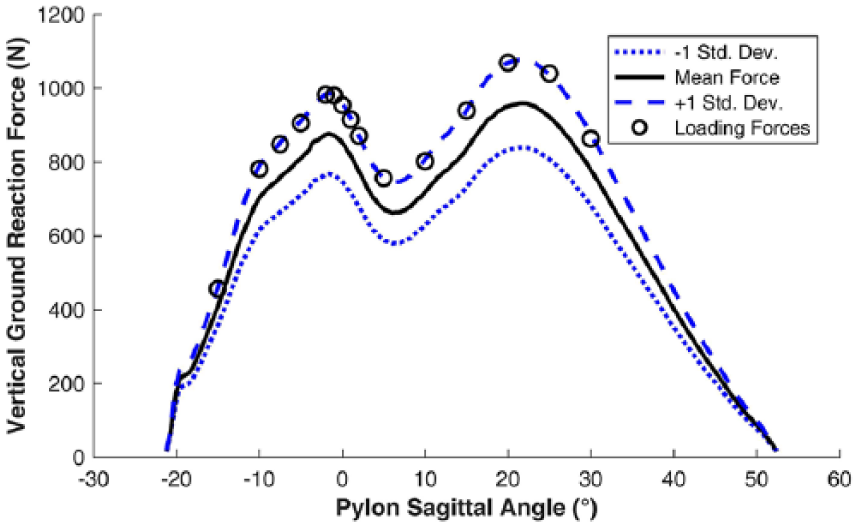
Vertical ground reaction force used for testing at each pylon sagittal angle orientation. Loading forces used for each sagittal test orientation are indicated.
A functional measure of prosthetic foot stiffness was calculated using a linear regression model through a portion of the force–displacement data: the functional load range. The functional load range used for this linear fit was a section of the entire force–displacement curve where the force perpendicular to the force plate was within 1 standard deviation of the scaled vertical GRF. Thus, the maximum functional load was the scaled vertical GRF plus 1 standard deviation for each sagittal plane angle and the minimum functional load was the scaled vertical GRF minus 1 standard deviation. Using only data over the functional load range meant that the stiffness calculated was indicative of the stiffness an amputee would experience. When a test yielded a coefficient of determination below 0.99 for the functional load range, that configuration was excluded.
The total energy stored in the prosthetic foot was calculated by trapezoidal integration of the force–displacement data over the entire load range. The prosthetic foot was considered engaged with the force plate once a 20 N threshold was achieved. Thus, the energy storage integration was only performed between the lower limit of 20 N and the upper limit of the load tested.
Stiffness and energy storage were normalized to compare the effects of orientation on stiffness and energy storage across prosthetic feet. The relative stiffness was calculated using the ratio from two orientations: a reference orientation (0° sagittal, 0° coronal) and the orientation of interest. This provides a unitless metric that describes the relative stiffness or energy storage of the prosthetic foot at the orientation of interest compared to the reference orientation. Values less than 1 indicate that the reference orientation is stiffer or stores more energy, while values greater than 1 indicate less stiffness or less energy stored.
Inferential statistics, such as analysis of variance or Student’s t tests, were not employed. Unlike human subject tests, where the level of uncertainty requires probabilistic methods, structural tests are deterministic. The results from structural tests exhibit little to no variation across repeated measures making inferential statistics unnecessary.
Results
Influence of sagittal orientations on mechanical properties
Stiffness was greatest for sagittal orientations near foot flat with the maximum stiffness for all prosthetic feet located between −5° and 2° (Figure 2, Table 2). Maximum stiffness values ranged from 5.4 to 14.2 times greater than the minimum stiffness. Stiffness decreased with orientations toward heel loading or forefoot loading. All 20 prosthetic feet that did not experience slippage during testing had a minimum stiffness at the greatest forefoot loading orientation (30° sagittal). Four of the five prosthetic feet experiencing slippage had a minimum stiffness at the maximum heel loading orientation (−15° sagittal), while the other prosthetic foot had the minimum stiffness at the greatest forefoot loading orientation it was tested at (10° sagittal). The heel strike orientation (−15° sagittal) for non-slippage prosthetic feet was between 24.6% and 225.7% stiffer than the toe-off orientation (30° sagittal).
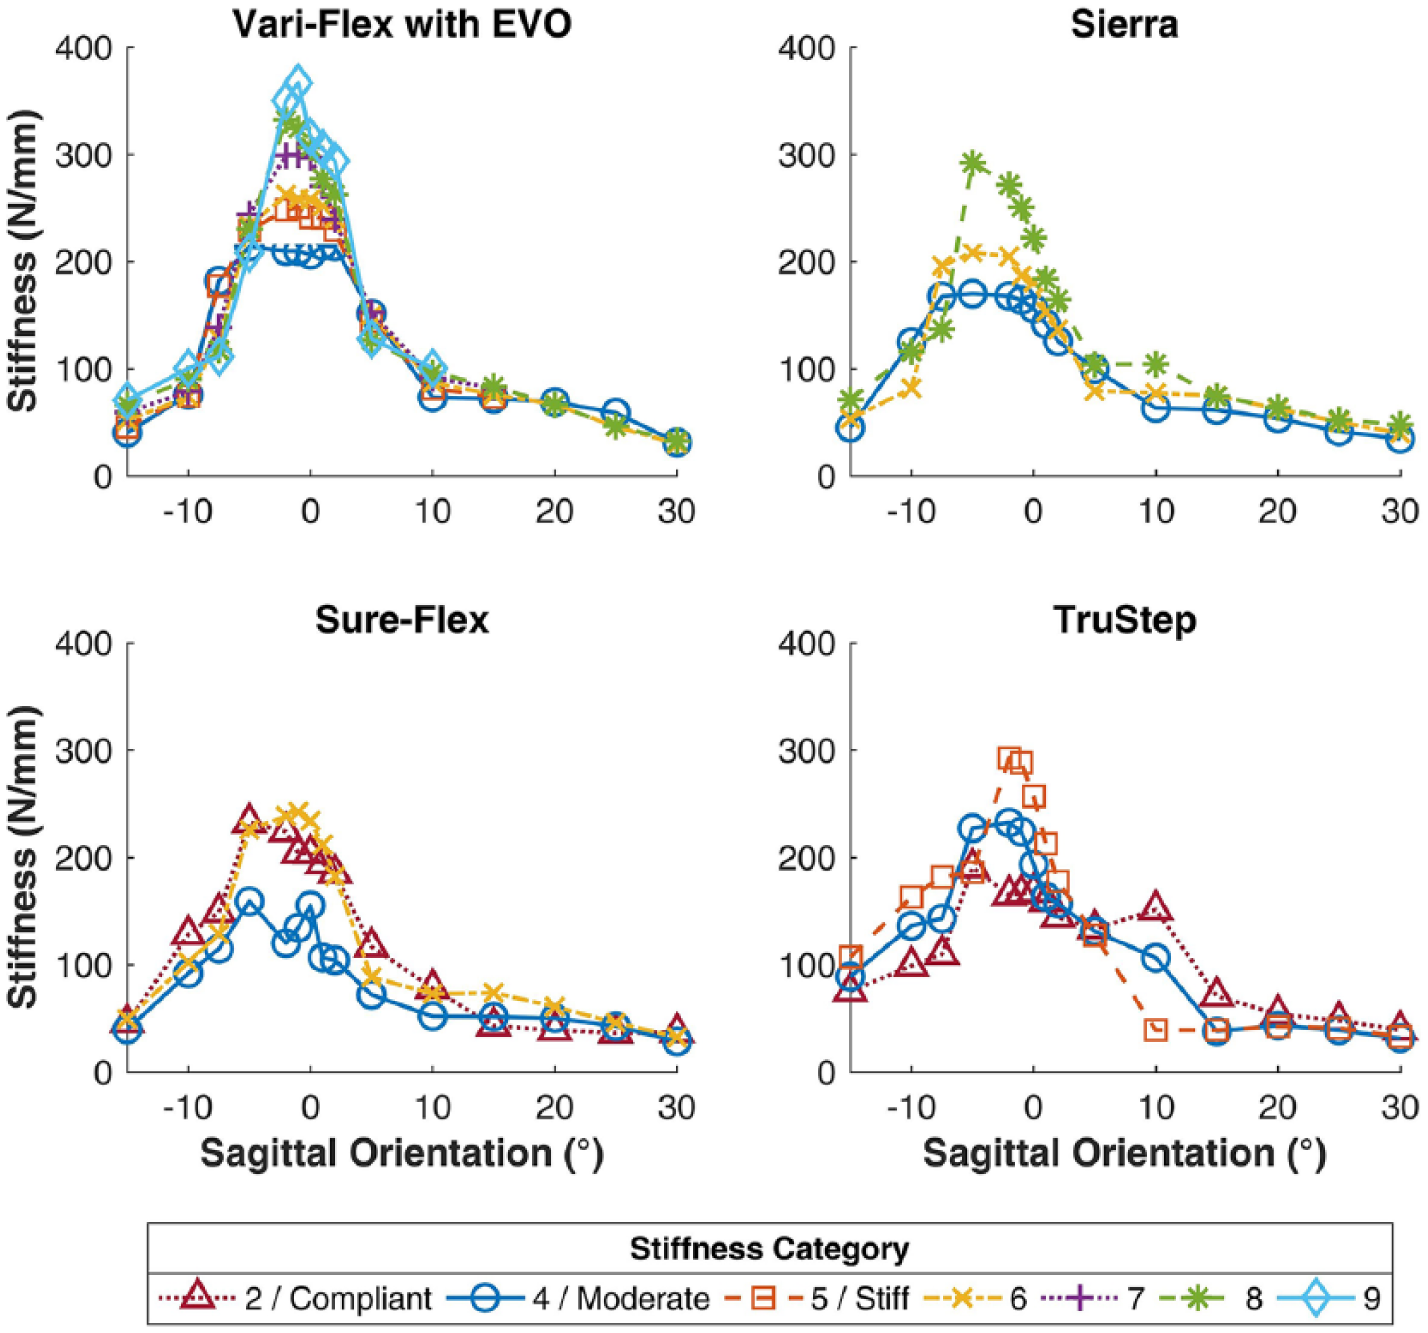
Stiffness values for all prosthetic feet models with at least three stiffness categories tested. Stiffness values are reported at a coronal orientation of 0°. Positive and negative sagittal angles correspond to forefoot and heel loading, respectively.
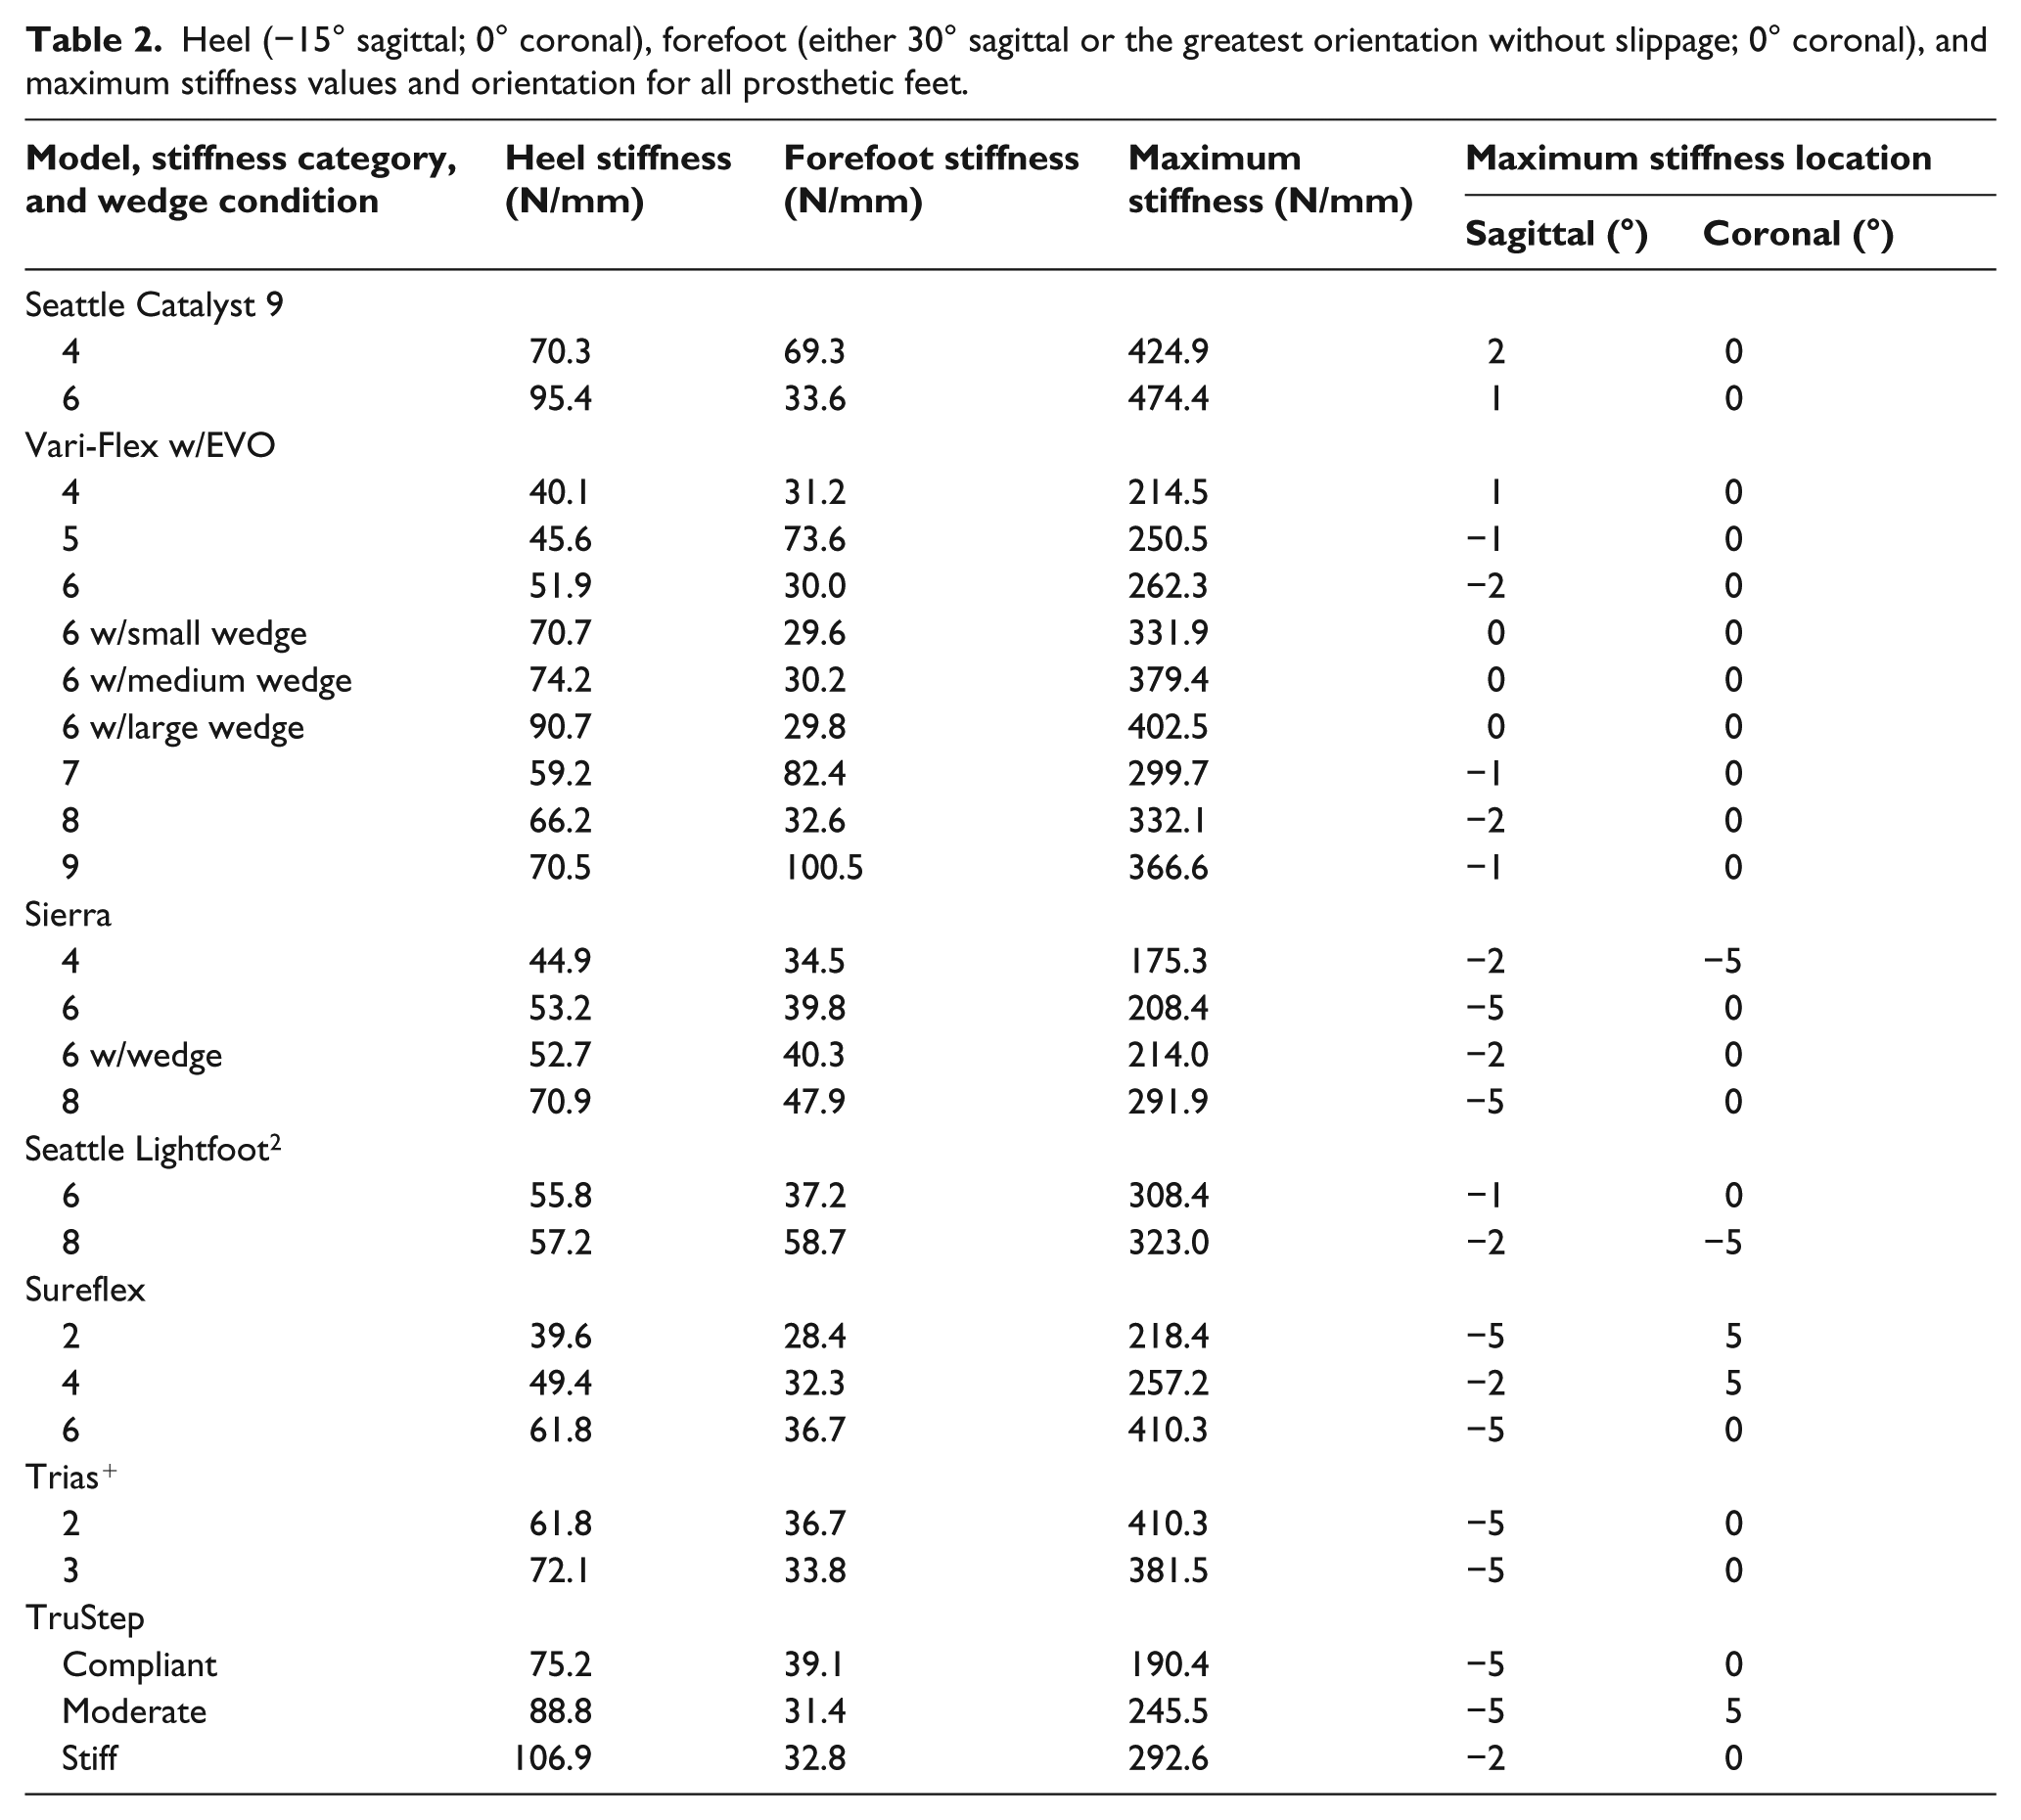
Heel (−15° sagittal; 0° coronal), forefoot (either 30° sagittal or the greatest orientation without slippage; 0° coronal), and maximum stiffness values and orientation for all prosthetic feet.
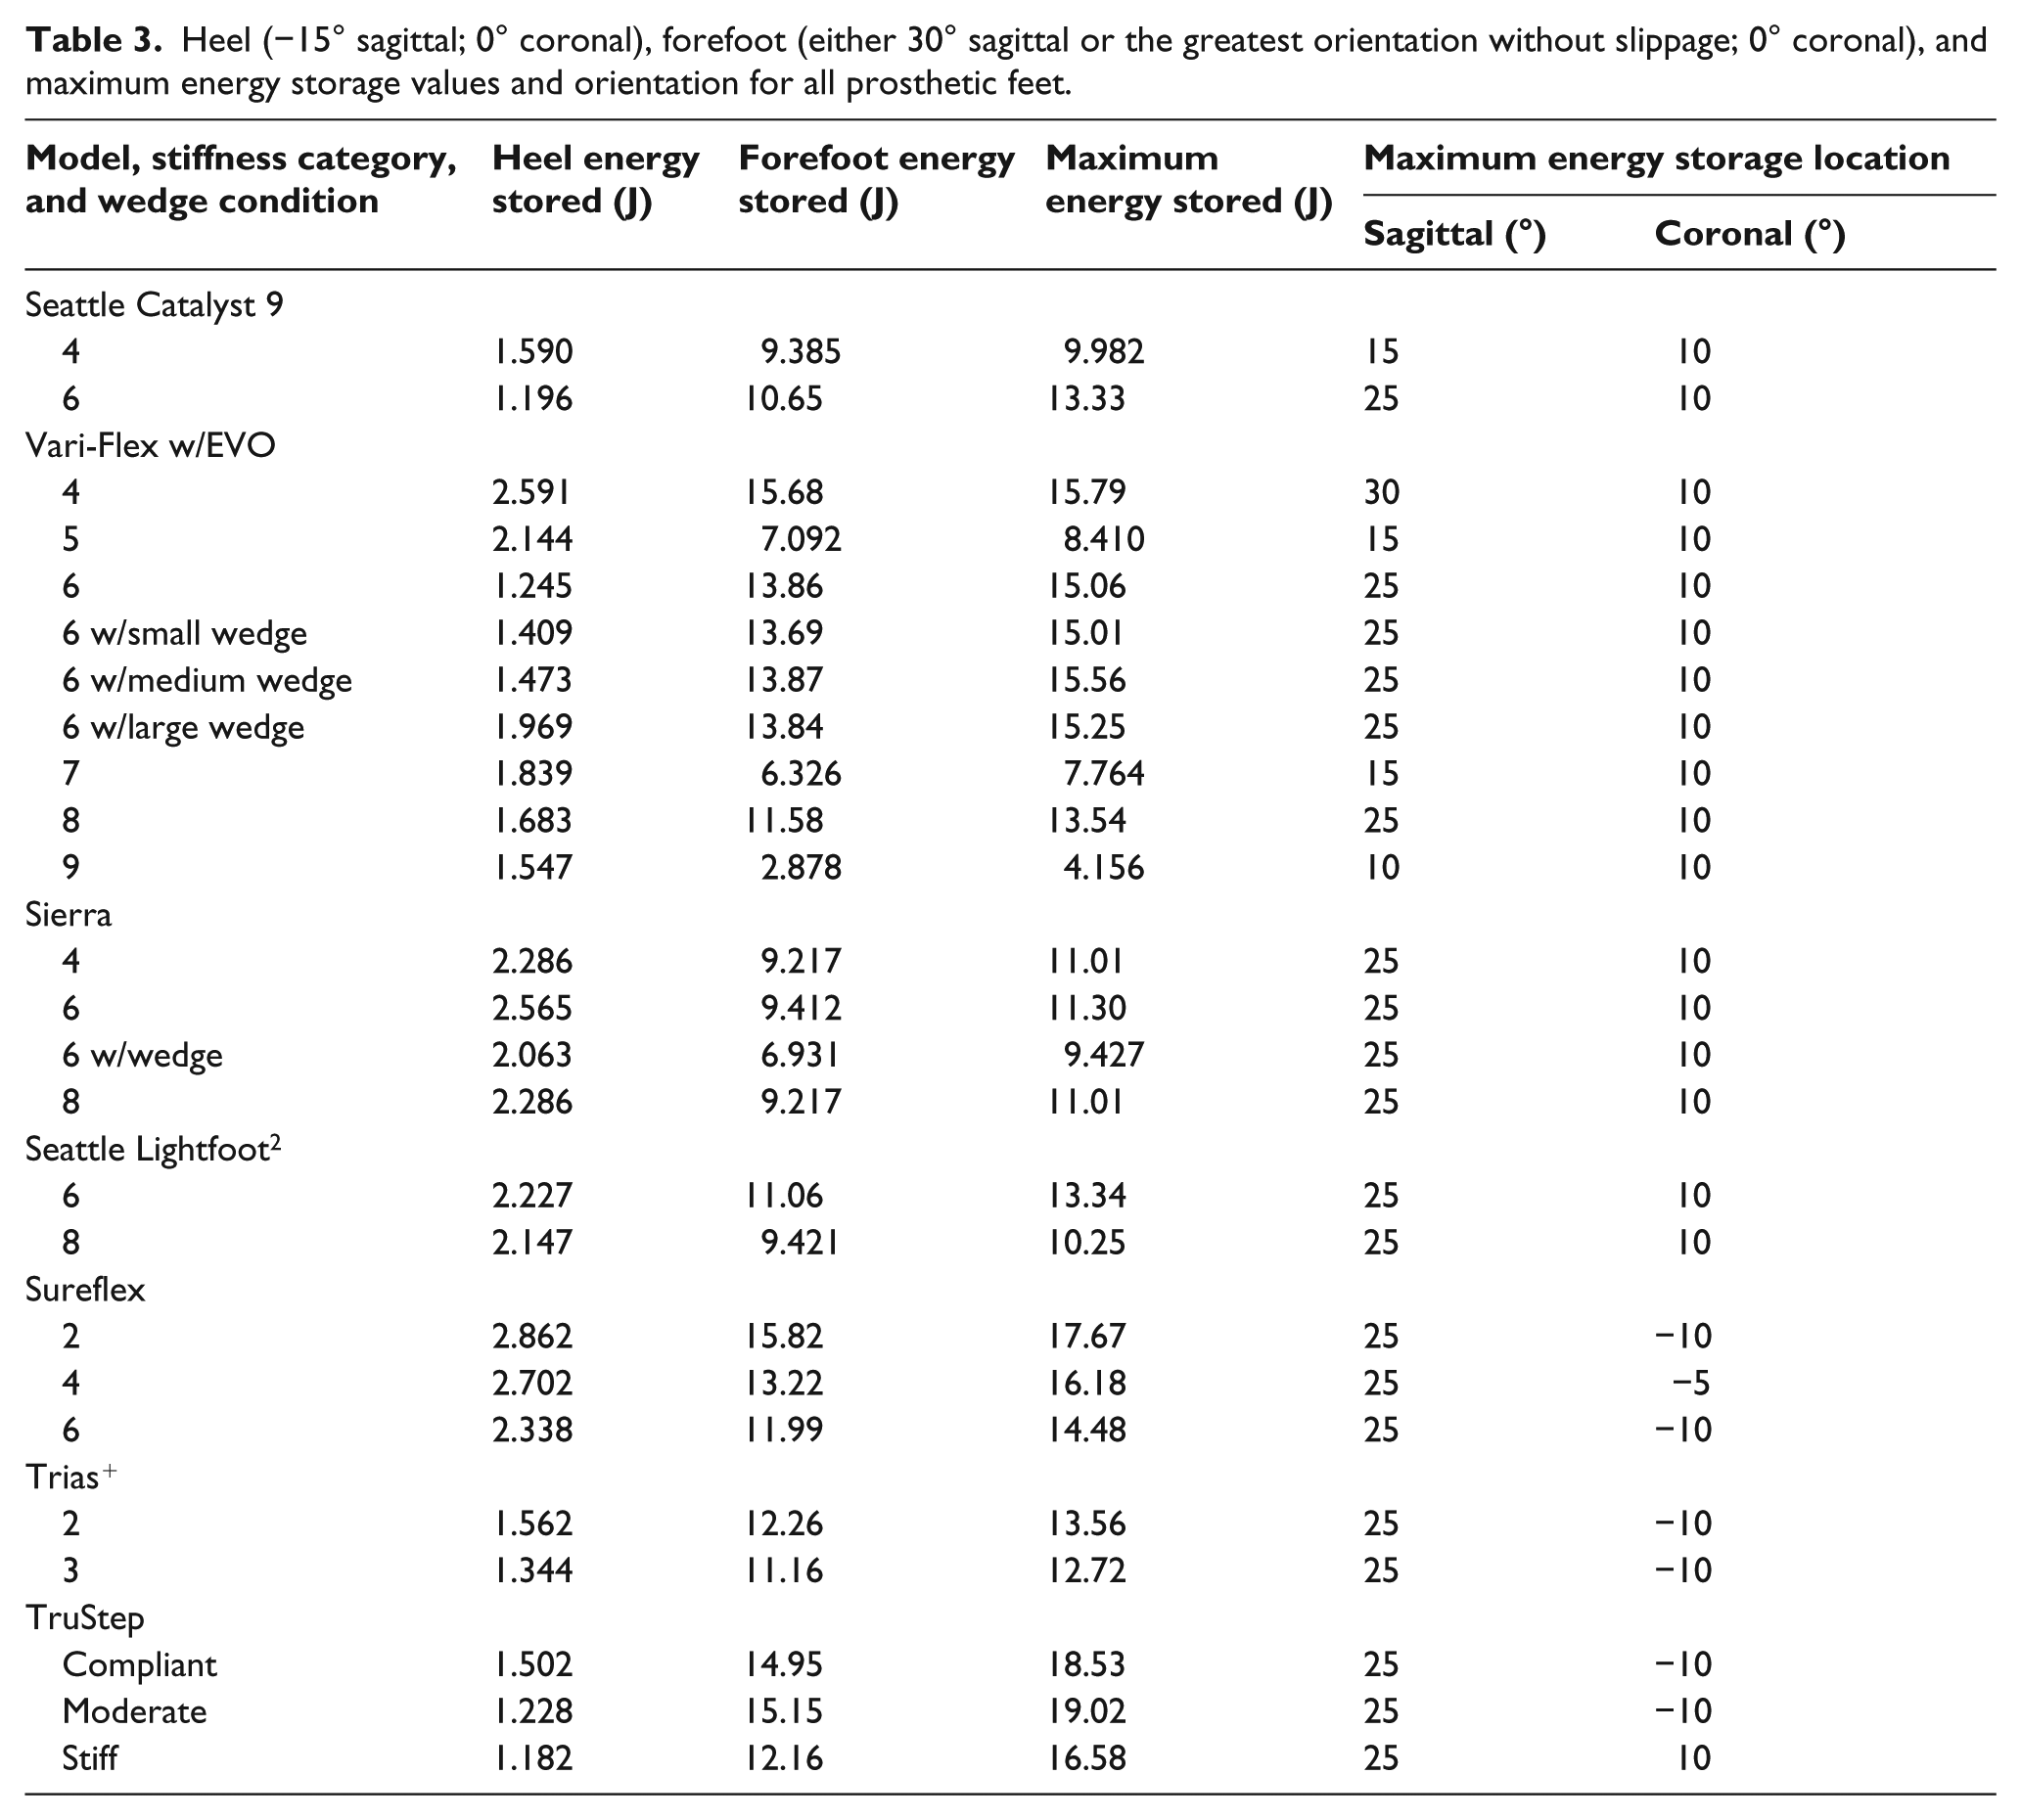
Energy storage was greatest during forefoot loading orientations, with all prosthetic feet storing the most energy at sagittal orientations of 25°, 30° or the greatest sagittal orientation tested without slippage (Figure 3, Table 3). The least amount of energy storage occurred either at the maximum heel loading orientation (−15° sagittal) or at a sagittal orientation near foot flat (between −2° and 1°). Maximum energy storage ranged from 2.7 to 15.5 times greater than the minimum energy stored for all prosthetic feet.
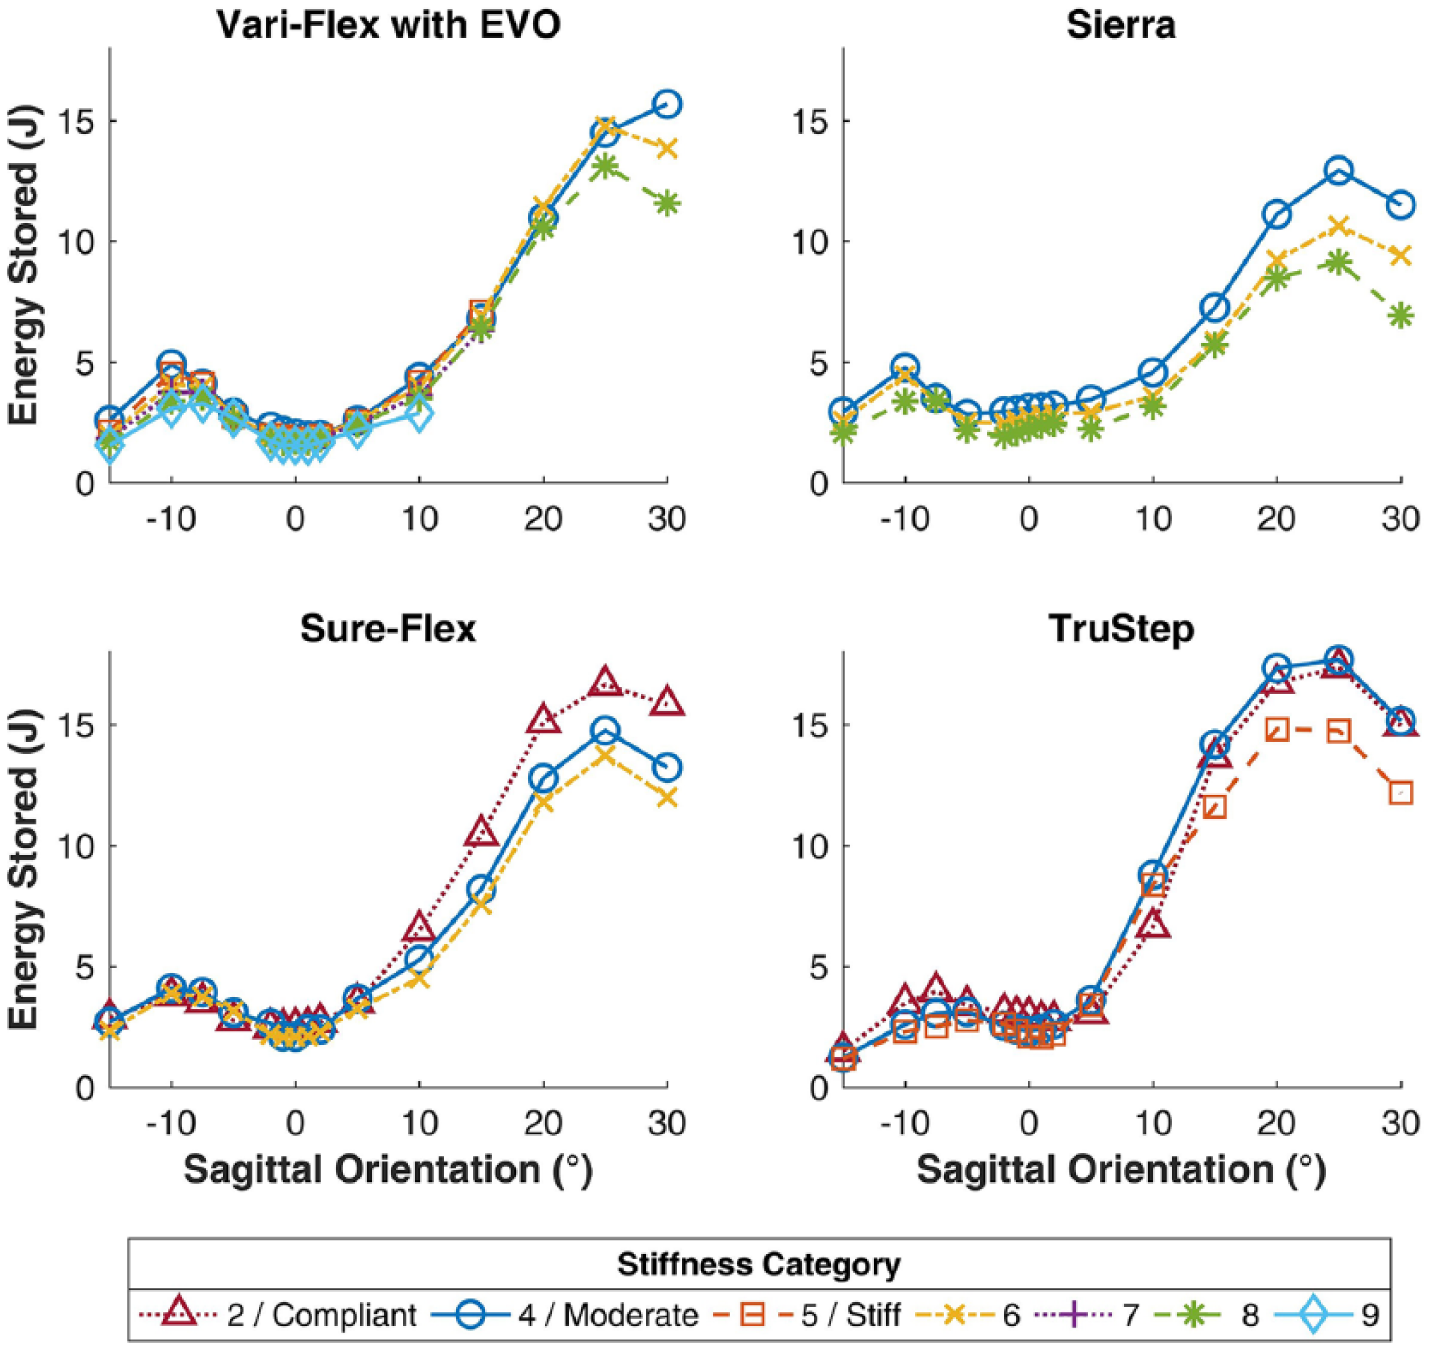
Energy storage values for all prosthetic feet models with at least three stiffness categories tested. Energy values are reported at a coronal orientation of 0°. Positive and negative sagittal angles correspond to forefoot and heel loading, respectively.
Heel (−15° sagittal; 0° coronal), forefoot (either 30° sagittal or the greatest orientation without slippage; 0° coronal), and maximum energy storage values and orientation for all prosthetic feet.
Influence of coronal orientations on mechanical properties
Overall, stiffness decreased as coronal orientation increased toward medial or lateral loading. However, the influence of coronal orientation on stiffness was dependent on the prosthetic foot’s sagittal orientation. The 5° medial and lateral loading were on average 1.7% less stiff than the coronally neutral orientation (0°). Similarly, the 10° medial and lateral loading orientations were 7.1% less stiff than the coronally neutral orientation. Stiffness of medial or lateral loading only exceeded coronally neutral stiffness at a few sagittal orientations: −10°, −7.5°, and 5°. Coronal orientation had the greatest influence on stiffness near foot flat orientations (between sagittal orientations −5° and 2°). Across this range, 5° medial and lateral loading were 4.3% less stiff and 10° medial and lateral loading were 15.5% less stiff than the neutral coronal orientation.
Increased coronal orientation resulted in increased energy storage (Figure 4). Medial or lateral loading at 5° and 10° stored 5.9% and 18.8% more energy on average than neutral coronal orientations, respectively. The influence of coronal orientation on energy storage was also dependent on the prosthetic foot’s sagittal orientation. Medial or lateral loading had the greatest effect on energy occurred at sagittal orientations between −2° and 10°. Over these sagittal orientations, 5° medial and lateral loading stored, on average, 10.5% more energy than the corresponding neutral coronal orientation, while 10° medial and lateral loading stored 33.4% more energy.
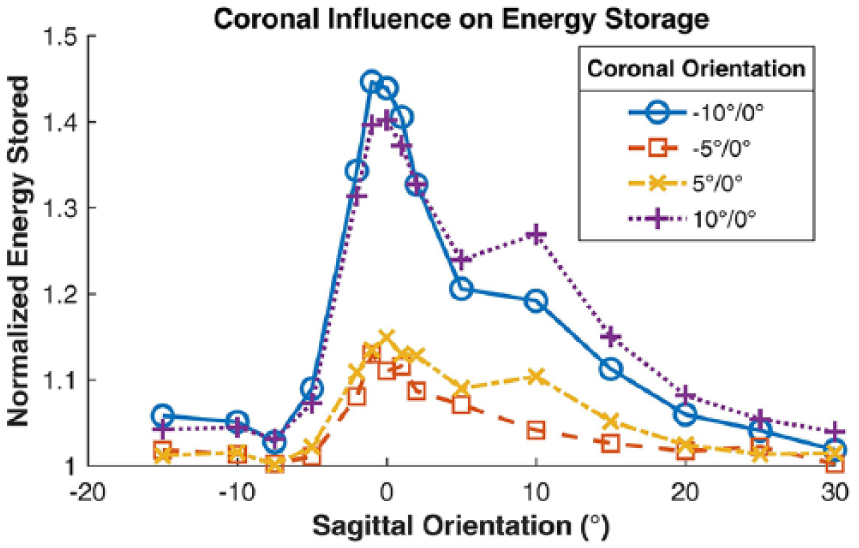
Mean normalized energy stored for all prosthetic feet models. All normalized energy storage values were normalized by the mean energy stored at 0° in the coronal plane over all prosthetic feet. Positive and negative sagittal angles correspond to forefoot loading and heel loading, respectively. Positive and negative coronal angles correspond to medial and lateral loading, respectively.
Influence of heel wedge on mechanical properties
In general, the inclusion of a heel wedge produced an increase in stiffness (Figure 5) and a decrease in energy storage for the Vari-Flex with EVO prosthetic foot. The heel wedge produced the greatest increase in stiffness and decrease in energy storage over all heel loading and foot flat orientations (sagittal orientations up to 2°). Over these orientations, the mean increase in stiffness for the small, medium, and large heel wedges relative to no wedge were 19.9%, 29.9%, and 41.0%, respectively. The inclusion of heel wedges produced a mean decrease in energy storage over heel and foot flat orientations of 16.6%, 16.8%, and 24.7% for the small, medium, and large heel wedges, respectively. In contrast, the heel wedges had a much smaller effect over forefoot loading orientations (sagittal orientations from 5° to 30°). The mean deviation in stiffness for forefoot-loaded orientations was −4.5%, 1.2%, and 1.2% for the small, medium, and large wedges, respectively. The small, medium, and large wedges also produced a mean deviation in energy storage of 2.7%, 0.7%, and −0.1% over the forefoot-loaded orientations, respectively.
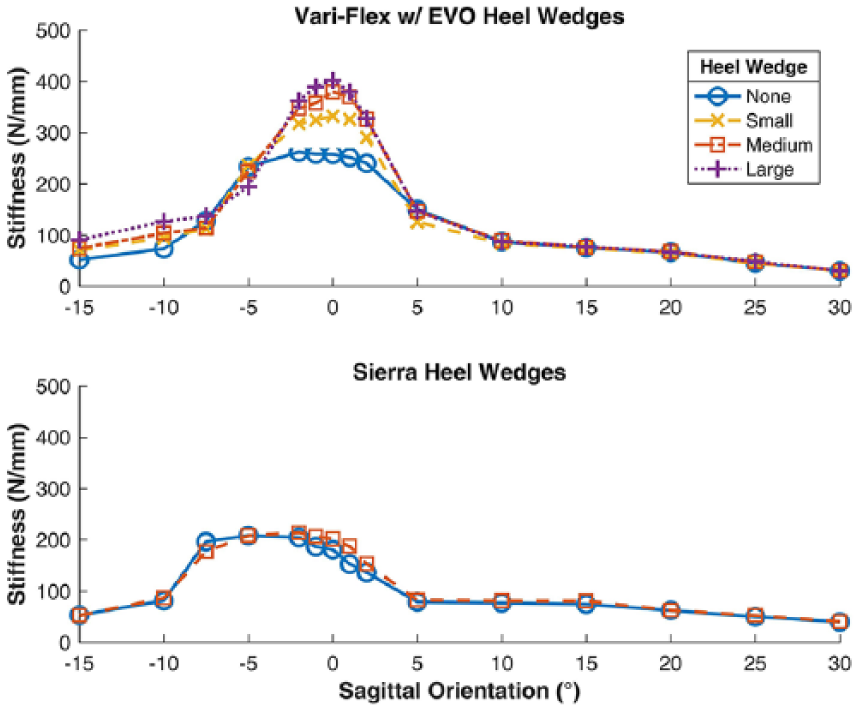
Stiffness values for the heel wedge conditions. All values are reported at a coronal orientation of 0°. Positive and negative sagittal angles correspond to forefoot loading and heel loading, respectively.
Unlike the Vari-Flex with EVO heel wedges, the Sierra heel wedge did not produce a large effect on the stiffness and energy storage over the sagittal orientations tested. The heel wedge produced a mean stiffness increase of 5.5%, while the energy stored decreased on average 1.5%.
Discussion
This study investigated how stiffness and energy storage of prosthetic feet varies across limb loading and orientations, stiffness category, and prosthetic foot model with the goal of helping to inform clinical prescription decisions. In general, the stiffness and energy storage profiles were similar for all prosthetic feet and highly non-linear in both the sagittal and coronal planes.
Stiffness was greatest for orientations near foot flat, with decreased stiffness during heel loading and forefoot loading conditions (Figure 2). The large increase in stiffness near foot flat is most likely due to the loading of both the heel and forefoot keels. For heel and forefoot loading conditions, only a single component is engaged (either the heel or forefoot keel), which results in lower stiffness values. Peak stiffness ranged from 175 to 474 N/mm, which either exceeded foot flat stiffness values 29 or were on the high end of maximum stiffness values 24 reported in previous studies (Table 2). In general, heel loading orientations were stiffer than forefoot loading orientations, with all heel-strike orientations (−15° sagittal) stiffer than toe-off orientations (30° sagittal) (Figure 2, Table 2). These results were consistent with the general findings from previous studies23–25 with the exception of South et al., 29 who found the toe-only stiffness was over twice as stiff as the heel-only stiffness for the Highlander (Freedom Innovations, Inc; Irvine, CA, USA.) prosthetic foot.
Stiffness generally increased with stiffness category and decreased with medial or lateral loading, but there were some orientations where these trends did not hold true. Since the testing load was fixed for a given sagittal orientation for all prosthetic feet, it is possible that at these trend opposing orientations, the lower stiffness category prosthetic feet deformed enough to engage both keels, while higher stiffness category prosthetic feet reached the maximum testing load before both keels were loaded. Prosthetic feet in lower stiffness categories tended to have a greater range of sagittal orientations near foot flat with high stiffness than higher category prosthetic feet of the same model (Figure 2). Thus, some of the lower category prosthetic feet were stiffer than higher category prosthetic feet at sagittal orientations just outside of foot flat in both heel and forefoot loading. Similarly, there were several orientations where the stiffness for medial and lateral loading exceeded that of neutral coronal orientations. Similarly, it is possible that at these sagittal orientations, the medial or lateral positions were so compliant that both keels were loaded, while the neutral coronal orientation reached the maximum testing load before engaging both keels. Engagement of both keels would cause the functional stiffness of medial and lateral loading to be greater than that of the neutral coronal orientation, even though the overall stiffness (total load divided by total displacement) would still be greater for the neutral coronal position.
Energy storage and return prosthetic feet seek to emulate some of the function normally provided by the ankle muscles, tendons, and ligaments, by absorbing energy in the heel from early to mid-stance for braking and returning a portion of that energy in late stance for forward propulsion.12,14,17,32,33 The energy storage profiles show that the heel and forefoot loading orientations can store more energy than during foot flat, with the forefoot loading storing the most energy (Figure 3), likely due to the forefoot providing a larger moment arm to generate bending. In general, prosthetic feet of the same model with lower stiffness categories store more energy, consistent with previous findings.14,32,34 However, these findings may be influenced by the force invariant testing scheme used. The negative relationship between stiffness and energy stored did not hold across prosthetic foot models. For example, even though the TruStep with stiff components had greater forefoot and maximum stiffness values than the Sure-Flex category 6 prosthetic foot, the TruStep also had the greater forefoot and maximum energy storage values (Tables 2 and 3). Future work could focus on optimizing the trade-off between stiffness and energy storage to improve performance.
Another interesting finding was that the addition of heel wedges produced contrasting results for the two prosthetic feet tested. Heel wedges are intended to increase the stiffness of the prosthesis during heel loading orientations. 35 For the Vari-Flex with EVO, inclusion of progressively larger heel wedges increased stiffness (Figure 5) and decreased energy stored over the heel loading and foot flat orientations. In contrast, adding a heel wedge to the Sierra prosthetic foot had a minimal influence on stiffness and energy storage over all orientations. Future work is needed to test more prosthetic feet and identify the design aspects that produce these contrasting results.
This study has reported generalized findings across prosthetic feet; however, specific comparisons between prosthetic feet may be more helpful when making clinical prescription decisions. To this end, we have created a standalone graphical user interface (GUI) tool in MATLAB (The MathWorks, Inc., Natick, MA, USA) to allow individuals to make their own comparisons (https://github.com/esarfeetgui/Prosthetic-GUI). Mechanical properties of multiple prosthetic feet can be compared with the GUI by plotting the stiffness and energy profiles in subplots next to one another or using overlays in the same plot. The GUI can also generate mechanical property tables for all prosthetic feet with prosthetic foot model, mechanical property, or orientations examined held fixed. The ability to directly compare prosthetic feet may be beneficial to prosthetists by allowing them to examine prosthetic feet with which that they do not have prior experience.
Some examples of how the results of this study could be used in practice are as follows. If a practitioner were to observe a slow progression from initial contact to mid-stance, sometimes described by amputees as “sinking into a hole,” or standing instability, the practitioner may want to select a prosthetic foot with a stiffer heel or add a heel wedge to the existing prosthetic foot. The results from this study can aid in this selection process because the practitioner could compare the stiffness differences between prosthetic feet or how a specific heel wedge might change a prosthetic foot’s stiffness. If a practitioner were to observe excessive knee flexion after initial contact through mid-stance, the practitioner may want to select a prosthetic foot with a less stiff heel. Again, the results from this study could be used aid in this selection process. For individuals who routinely walk on uneven terrain, the results from this study could be used to gain insight on how the coronal plane stiffness may vary between multiaxial feet from different manufacturers.
One limitation of this study was that loading forces were the same across all prosthetic feet tested. This allowed for direct comparisons of each prosthetic foot’s stiffness and energy storage for a representative amputee. However, using similar loading forces meant that stiffness or energy storage may have been under or overestimated, depending on whether the testing load was lower or higher than the recommended weight for each prosthetic foot. When making prescription decisions, prosthetists may prefer to use stiffness and energy storage profiles that are scaled to their patient. In addition, prosthetic foot covers can have a small influence on structural properties, as can socks and shoes. The results reported here include only the prosthetic feet as this is the component prescribed by clinicians. Only the vertical GRF was used to load the prostheses, precluding the use of an iterative, time-consuming multiaxial approach. The omission of other GRF components did not cause an appreciable difference in the calculated results of several preliminary test cases. Another potential limitation is that the loading rate of the applied force was limited to 5 mm/s by the Rotopod used in this study. Since the loading rate is only significant at heel strike and toe off, this likely did not affect our results, particularly since none of the tested prostheses included articulating ankles. Articulating ankles often use hydraulic elements whose force–displacement properties are velocity dependent. Future work with these prostheses should be performed at different velocities. Finally, while the mechanical properties determined from this study may better inform the prescription process, it is unknown how these properties might affect gait. Several studies have examined how altering stiffness influences amputee gait.13,14,16,20,36 Future studies should focus on how altering mechanical properties (i.e., specific regions of stiffness or energy storage profiles) influence amputee gait. When possible, these studies should try to match commercially available prosthetic feet as a baseline for comparison with systematically altered mechanical properties.13,14,27
Conclusion
The stiffness and energy storage of prosthetic feet were measured over limb loading and orientations that are typically experienced during amputee gait. Mechanical properties were found to be highly non-linear in both the sagittal and coronal planes for all prosthetic feet tested. Results of this study and the GUI tool may help inform clinical prescription decisions by providing quantitative prosthetic foot characteristics to supplement prosthetist experience when comparing prosthetic feet. Prosthetists will also be able to consider prosthetic feet they have little experience with when making prescriptions. Future work linking mechanical properties with clinical outcomes may improve the prescription process by identifying how different aspects of prosthetic feet influence amputee gait.
Footnotes
Acknowledgements
Experimental data were collected by Catherine Treadwell, MS.
Author contribution
All authors contributed equally in the preparation of this manuscript.
Declaration of conflicting interests
The author(s) declared no potential conflicts of interest with respect to the research, authorship, and/or publication of this article.
Funding
The author(s) disclosed receipt of the following financial support for the research, authorship, and/or publication of this article: This work was supported by Merit Review Award Number I01 RX000311 and Career Development/Capacity Building Award Number IK6 RX002974 from the United States Department of Veterans Affairs Rehabilitation Research and Development Service. The contents do not represent the views of the US Department of Veterans Affairs or the US Government.